
Earthquakes and Landscapes:
Interpreting Geology Of the California Fault System
This is an introduction to the greater California Fault System. "Geoscience communities" have been investigating the regional faults for well over the past century with many thousands of articles, books, and technical reports published over the years (select resources are included below). The discussion focuses on landscape and geologic features associated with regional earthquake faults, including the San Andreas Fault and a host of interconnected faults that make up the greater California Fault System. This website is purely for educational purposes only. The graphics presented below correspond to talks presented to gem and mineral societies, community organizations, and adult education programs in the San Diego Region.Return to Field Trips main page. |
Click on images for a larger view. |
| Fig. 1. This introductory slide shows satellite view of western North America showing the Baja Peninsula that gradually split away from the coast of Mexico starting about 12 to 15 million years ago. This occurred as the East Pacific Rise began cutting into the western margin of the North American Plate. This also resulted in the formation of the greater San Andreas Fault System where continental crustal rocks west of the fault zone detached from the North American Plate and is now gradually moving northward with the Pacific Plate. The generalized plate tectonics map (on the right) illustrates the the modern configuration of the plate boundaries along the West Coast. | 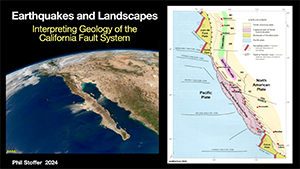 |
Fig. 2. Tectonic forces (and gravity) are responsible for the formation of folds and faults. The block diagram on the right illustrates 4 common types of faults: normal, reverse, strike slip, and thrust faults. In actual observations, large fault zone can display all 4 types of fault offset, with a 5th variety called oblique faults that a combination of the the other 4. The map on the right shows that most of the major earthquake faults associated with the California Fault System display dominantly right-lateral strike-slip fault displacement. Note that this is in contrast to normal faults that dominate the Great Basin and Rocky Mountains region. It is argued that the faults on the eastern side of the Sierra Nevada Range may be the western plate boundary far in the future. | 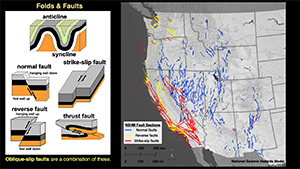 |
| Fig. 3. The focus is the place where an earthquake originates. The point on the Earth's surface directly above the focus is the epicenter. Seismic energy radiates away from an earthquake fault as it ruptures, producing fast moving compressional P waves and slower S "shake" waves. Major faults, like the San Andreas Fault, extend downward from the brittle upper crust into the more ductile lower crust and upper mantle where rocks tend to bend and flow gradually rather than rupture. Some of the most powerful earthquakes occur at depth in the brittle-ductile transition zone. However, powerful earthquakes also occur at shallower depths where fault zones are locked relative the flowing rocks deep below. In shallower depths, faults tend to splay out into more complex fault pattern. | 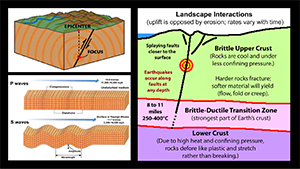 |
| Fig. 4. This USGS diagram illustrates earthquake frequency and destructive power associated with earthquakes using examples of famously notorious earthquakes (such as San Francisco, 1906 at M 7.9 and Chile, 1964 at M 9.5) . It also illustrates magnitude of the energy released by earthquake compared to notable examples including the Hiroshima nuclear blast (about a M 6.2) or the eruption of Mount St. Helens in 1908 (about a M 7.7), and others. The diagram illustrates that there may be many thousands of lower magnitude earthquakes that happen around the globe, the frequency of large earthquakes diminishes with greater intensity. However, great earthquakes can happen at any time. | 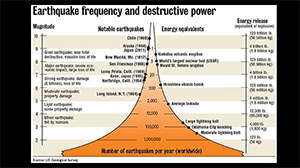 |
| Fig. 5. The USGS National Seismic Hazards Model map graphically illustrates the likelihood of damaging earthquake shaking due to an earthquake over the next 100 years. Note that California's fault system is the most likely contender in this assessment. The Wasatch Fault system in Utah extending northward into the Yellowstone area, and the New Madrid Fault system in the midcontinent is another. | 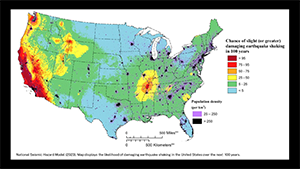 |
| Fig. 6. Two maps showing the location of major earthquake ruptures along the California Fault System. The older map on the left shows the "creeping" section of the faults relative to sections that ruptured during major earthquakes. The newer map on the right provides more detail including major historic earthquakes and the estimated recurrence interval of major earthquakes along sections of the faults. For instance, the recurrence of earthquakes along the San Andreas Fault is estimated to be 200-300 years, yet no major earthquake has occurred along that section of the fault system in historic time. | 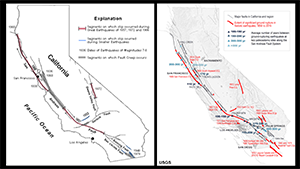 |
| Fig. 7. This figure illustrates the cross-sectional profile of a fault zone. Major fault are typically seismically active in a narrow band at depth. The may be represented by a single major fault trace at the surface, but more often they splay into often multiple fault traces closer to the surface, resulting is a fault zone. Deformation associated with fault displacement typically extend far beyond the immediate fault zone, with deformation resulting in the formation of associated mountain ranges or troughs. Near the surface the zone of fracturing may be widely distributed across fault zones. | 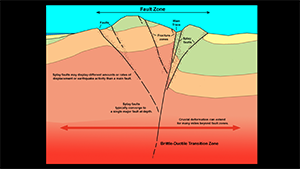 |
| Fig. 8. How can you recognize a fault? In most places faults are obscured by plant cover, soil and loose rock material. Having a crew of geologists dig a trench to locate and study a fault is best, but not always practical. However, there is an abundance of landscape and bedrock features that may indicate the location of a fault. The next few slides illustrate some of these. This view shows a most obvious feature called slickensides created when one side of a fault plane preserves scratches created by fault displacement. Slickenside reveal information about relative fault motion. In this case, the fault block on the right has risen relative to the other side, preserving a fault scarp on the uplifted block. | 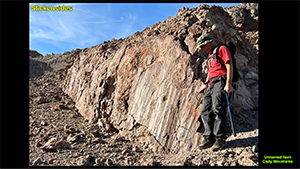 |
| Fig. 9. Faults are often reveal by changes in bedrock composition, and these differences can be revealed by changes in soil characteristics and associated vegetation cover across fault zones. However, note that not all bedrock changes are associated with faults. However, they can be revealed by other characteristics such as the abundance of fractures and small fault displacements, and ground up rock gouge (or fault breccia). Actively creeping faults often display evidence of displacement in infrastructure. Fault zone are also notorious for being locations of active landsliding. | 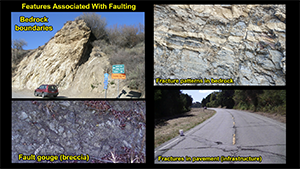 |
| Fig. 10. Climate and topography influence weathering and erosion pattern in bedrock. This view along Interstate 8 east of San Diego shows hillsides covered with granite boulders. The granite formed about 90 millions of years ago (in the Late Cretaceous Period), but since then the rocks have endured perhaps millions of earthquakes of significant magnitude. Anyone who has experienced a significant earthquake won't forget the rumbling sound created by rocks fracturing and rubbing against each other, dissipating energy in the process. On rare occasions earthquakes have been known to produce lightning. |  |
| Fig. 11. This figure from a 1990 USGS Professional Paper about the San Andreas Fault illustrates common landscape features associated with major strike-slip earthquake faults in California. Linear valleys with offset stream channels are among the most obvious features. Fault displacements result in "shutter ridges" shutting in drainage channels blocked by fault motion. Some locations where fault motion causes the land to sink (and not drain) results in sag ponds. Fault displacement often results in the appearance of scarps or hillside benches. Springs are common along fault zones where fractured bedrock provides easy water flow to the surface. |  |
| Fig. 12. On a larger scale, bends along a strike-slip fault will result in local compression that may push up a mountain range, or tension (or extension) that will cause a sag in the crust creating a basin. Mission Bay in San Diego is a classic example of this. |  |
| Fig. 13. Large landslides may be associated with fault. A slump has glide planes that are essentially fault on a local scale (associated with gravitational forced motion). However, it is quite common for landslide slumping to be widespread across a region when major earthquakes occurs. Also, many slumps are associated with fault and fracture zones associated with earthquake faults. |  |
| Fig. 14. Here begins a tour of the California Fault System, starting in Northern California where the San Andreas Fault comes onshore near Point Arena. The San Andreas Fault isn't easy to see on the ground because forests cover the landscape, but there are several important places to look at where it is exposed along the coast. |  |
| Fig. 15. From an aerial view it is easy to see the linear valley trace of the San Andreas Fault zone. On the ground near Point Arena near Alder Creek the fault best reveals itself as subtle scarps offsetting marine terraces along the coast. The most significant evidences is the number of large magnitude earthquakes that have occurred in this region and along the fault offshore where it continues as the Mendocino Fracture Zone in the Pacific Basin. |  |
| Fig. 16. South of Point Arena the San Andreas Fault Zone returns offshore at a location called near Mill Creek (Along Highway 1). Here the fault zone is revealed in the sea cliffs by the occurrence of serpentinite and blue schist (Franciscan melange. ancient ocean crustal rocks) on the east side of the fault and younger Tertiary sedimentary rock formations on the west side of the fault. Note that it is a bear of a hike to get down to the shore where fault features are exposed. Farther south, Bodega Bay is a sag area where the San Andreas Fault Zone briefly comes onshore. The Franciscan melange bedrock on the east side of the fault is in contrast with the granite bedrock of Bodega Head, the headlands on the west side of the fault. |  |
| Fig. 17. At this point it is important to introduce the Salinian Block (or Salinian Terrane). This is an extensive, complex belt of dominantly granitic rock, metasedimentary rocks, and younger sedimentary cover located on the west side of the San Andreas Fault. These rocks have migrated northward attached to the Pacific plate, much in the manner that we can see how Baja California has been ripped off Mexico and carried northward. The granitic rocks (shown in red) on the west side of the San Andreas Fault were likely derived from the ancient Cordilleran volcanic arc system responsible for the formation of the Sierra Nevada Range and the Transverse and Peninsular Ranges in Southern California. |  |
| Fig. 18. Point Reyes is similar to Bodega Head, on a larger scale. Point Reyes, on the west side of the San Andreas Fault, is underlain by Salinian granitic bedrock rock with overlying younger sedimentary rocks. East of the fault the bedrock consists of Franciscan blueschist melange (ancient ocean crustal rocks). The linear valley along to fault zone is highlighted by Tomales Bay to the north, and Bolinas Lagoon to the south. The San Andreas Fault has been extensively studied in the Point Reyes area, and for good reason, primarily because of its proximity to the San Francisco Bay Area. The area was heavily impacted by the Great San Francisco Earthquake of 1906 (including both earthquake shaking and tsunamis). |  |
| Fig. 19. The 1906 Earthquake changed everything in that it was perhaps the most expensive disaster in the United States since the Civil War. The earthquake raise awareness about earthquake hazards, engineering, and civil response to earth disasters, as illustrated by the release of the Lawson Report in 1908. From a geologic perspective, the earthquake changed much of what was known about earthquake. This is because the "traditional view" was that earthquakes resulted in "vertical uplift," whereas the San Andreas Fault moved with right-lateral displacement. As much as 21 feet in some places along the fault (near what is now the Park Visitor Center. This caused an abundance of confusion in the "Geologic Community" that ultimately contributed to the foundation of Plate Tectonics Theory. | 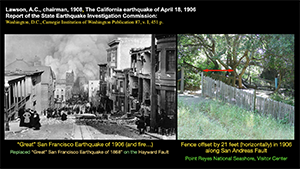 |
| Fig. 20. Great fault produce great earthquakes with impacts far beyond the immediate fault zone. Whole sections of a coastline may rise or fall, sometime many feet with the release of strain along a major fault. This has been witnessed from major earthquakes such as in Alaska, Japan, and Indonesia. Sudden uplift of a coastline may result in the formation of elevated wave-cut benches. Examples shown here include elevated-wave cut benches along Drakes Bay on Point Reyes, along sea cliffs at Wilder Ranch near Santa Cruz, and Flat Rock at Torrey Pines in San Diego. Whether these features actually formed as a result of massive earthquakes is unclear, but it is worth pondering. |  |
| Fig. 21. This next section focusses of earthquake faults in the San Francisco Bay Region. The San Andreas Fault was relatively quiet following the 1906 Earthquake up until the 1989 Loma Prieta Earthquake. The San Andreas Fault runs offshore at Point Reyes and then reemerges at Mussel Rock near the SF neighborhood of Pacifica. Many people who fled from San Francisco earthquake and fire move across the Bay to settle along its east shore. Little did they know that they were moving out the "frying pan into the fire." In fact, the East Bay region had a major earthquake on the Hayward Fault in 1858. The area then was rural and dominantly Spanish speaking at the time, so little record has been preserved. Today, about 2.8 million people live in the East Bay region. | 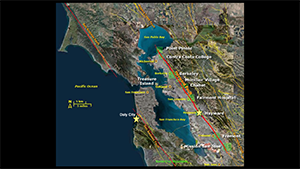 |
| Fig. 22. This Google Earth satellite view shows the trace of the San Andreas Fault where it comes onshore at Mussel Rock Park and extends through Pacific neighborhoods to where it meets Crystal Spring Reservoir - formerly San Andreas Lake (a sag pond), for which Berkeley Professor, Andrew Lawson named the San Andreas Fault in 1895. From Crystal Spring Reservoir southward, the San Andreas Fault cuts through the core of the Santa Cruz Mountains and passes on the west side of Loma Prieta Peak overlooking San Jose. | 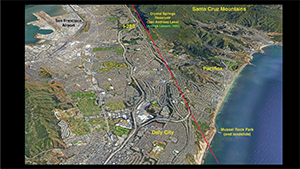 |
| Fig. 23. This "out-dated" USGS diagram illustrates the historic frequency and intensity of strong and very strong earthquakes in the San Francisco Bay Region, and shows the "62% statistical probability" of a 6.7 magnitude earthquake happening in the region between 2003 and 2032... Hmmm. That was more than 20 years ago! Since then, organizations like the Bay Area Earthquake Alliance and allied organizations have been studying and attempting to get the communities aware of earthquake risks. Estimated damage costs from a major earthquake on the Hayward Fault range into the many, many billions of dollars and would certainly change the economic climate of Silicon Valley. | 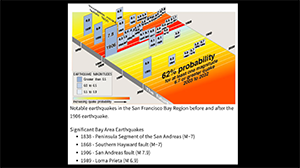 |
| Fig. 24. The Hayward Fault cuts along the western flank of the Diablo Range and the foothills and alluvial plain of the East Bay. It cuts through the cities of Richmond, Berkeley, Oakland, Hayward, Fremont. Near San Jose, it merges with and continues south as the Calaveras Fault. Current estimates suggest that more movement is occurring along the Hayward/Calaveras Fault than along the San Andres Fault. Trench studies and historical records show at least 5 major earthquakes have occurred on the Hayward Fault in the past 700 years, about every 120 years. But... the last one occurred 156 years ago, and the next one is overdue. | 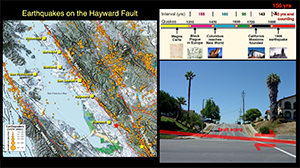 |
| Fig. 25. It is fairly easy to follow the Hayward Fault where it cuts through neighborhoods of the East Bay. The Hayward Fault is "creeping" at the surface, but is likely locked up at depth (until the next Big One). Evidence of the slow creep is visible cutting across infrastructure in many locations. The classic feature was the offset of the original Berkeley Stadium (replaced in 2010). Elsewhere the creepy fault exposes itself as cracks in builds, walls, offset street curbs, and perhaps most famous, cutting through historic Hayward City Hall. See Where's the Hayward Fault? A Green Guide to the Fault (.pdf, 96 p.) | 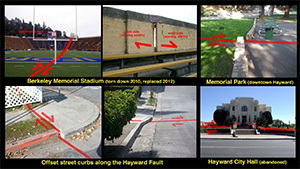 |
| Fig. 26. South of the Bay Area, the San Andreas, Calaveras, and other faults converge in the vicinity of Hollister in San Benito County. Hollister is one of several cities that claims to be the "Earthquake Capitol of the World." The fault system, bedrock geology, and the climate factors all contribute to the amazing landscapes in the region. Many colleges and geological associations converge on field trips to look at "classic" fault related features where the San Andreas Fault descends from the Santa Cruz Mountains (near Loma Prieta Peak and crosses through Pajaro Gap before continuing south along the eastern foothills of the Gavilan Range. The Calaveras Fault bounds the western side of the southern Santa Clara Valley and the west flank of the Gavilan Range. From Hollister the two faults roughly parallel each other down the San Benito River valley (along Highway 25) south past the Pinnacles National Park, and beyond. | 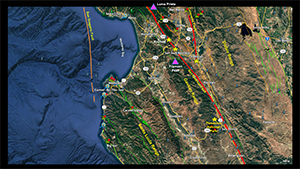 |
| Fig. 27. Fremont Peak is a high point at the north end of the Gavilan Range near San Juan Bautista (Gilroy). Named after Major John C. Fremont and a dozen US soldiers put up a US flag in 1847 before Castro's Mexican Army surrounded them on the mountain top. After a lot of shouting they fled in the night. In any case, the marble-capped mountain peak is an excellent location to see the regional geology. The San Andreas Fault emerges from Pajaro Gap runs through the town of San Juan Bautista where is merges with the Vergeles Fault (another regional earthquake fault). From there it continues south along the northeast foothills of the Gavilan Range. The bedrock of the Gavilan Range is mostly Salinian Granite (with some marble), whereas east of the San Andreas Fault it is mostly Tertiary-age sedimentary rocks. | 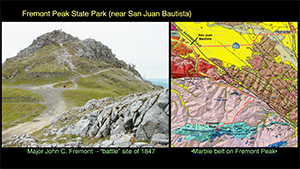 |
| Fig. 28. This view is looking north from Fremont Peak and it show the trace of the San Andreas Fault where it cuts through the southern Santa Cruz Mountains, crosses the Pajaro River at Pajaro Gap before entering the broad agricultural valley of the lower San Benito River near San Juan Bautista. It has been argued that the ancestral drainage of the Bay Area used to be through Pajaro Gap, but movement of the San Andreas Fault, combined with landsliding and uplift eventually blocked the drainage, causing a lake to flood the Santa Clara Valley before rising lake waters breached the northern gap, creating the Golden Gate Passage near San Francisco. | 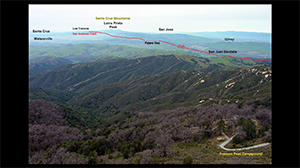 |
| Fig. 29. This view shows the vegetation contrast along opposite sides of the San Andreas Fault where it enters Pajaro Gap. This is near the town of Aromas, a small town that got its name for the sulfur springs that occur along the fault zone. This one is along Highway 156 near Aromas. The 1989 Loma Prieta earthquake ruptured the southernmost 40 km of the 1906 break. The right-lateral displacement during the earthquake was about 6 to 8 feet. Displacement damaged a railroad bridge across the Pajaro River in the fault zone. South of Pajaro Gap, the San Andreas fault becomes a creeping fault, but is still capable of producing earthquakes. | 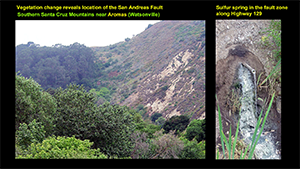 |
| Fig. 30. This view shows one of the sag ponds still active along the San Andreas Fault along Anzar Road, southeast east of Aromas, California. The forested slope covers granitic bedrock on the south side of this linear valley that follows the fault. | 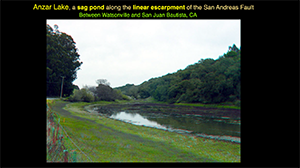 |
| Fig. 31. The creepy trace nature of the San Andreas Fault can be clearly seen where it has displaced fence lines crossing fields on Nyland Ranch on the northwest side of San Juan Bautista. | 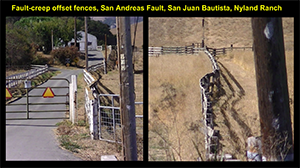 |
| Fig. 32. This view is looking along the historic El Camino Real adjacent to Mission San Juan Bautista. The mission was built in in "ideal location" above a low escarpment overlooking the rich, productive agricultural fields of the lower San Benito River Valley. What the Padres didn't know is the escarpment was the active trace of the San Andreas Fault (shown here). Construction of the first mission church began in 1797, but it was heavily damaged by a large earthquake in 1798. Construction resumed, but again construction efforts were severely damaged by another major earthquake (actually 4 large ones in one day in 1803). It was after that earthquake that plans were made to build the next version with enough reinforcement to survive a major earthquake while occupied by a thousand people. This was the first "earthquake engineered" building in North America! | 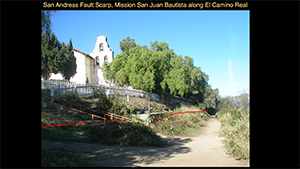 |
| Fig. 33. The region south of Hollister is another California wine region, the first vineyard and winery was established in 1851 in the Cienega Valley, a long linear valley that follows the trace of the San Andreas Fault. "Cienega" means "marsh" and was probably named after sag ponds along the fault valley. The original winery is now the DeRose Winery (on Cienega Road). Several miles to east, two strand of Calaveras Fault cut through the Hollister area, and a third earthquake fault, the Quien Sabe Fault, runs along the lower western flank of the Quien Sabe Range. | 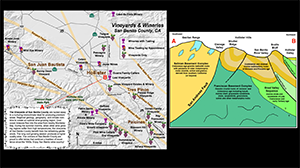 |
| Fig. 34. This is another view from Fremont Peak, looking east toward Hollister Valley. Vegetation contrasts highlight the trace of the San Andreas Fault. The Chaparral-covered foreground is granite bedrock (in the Hollister Hills ORV Park. The grasslands and oak forest are growing on a shutter ridge on the opposite side of Cienega Valley, a linear valley that follows the trace of the fault. The distant mountains on the opposite side of Hollister Valley is the Quien Sabe Range that consists of a series of eroded volcanic peaks that erupted as the early coastal fault system began propagating northward across the region roughly 13 to 10 million years ago. | 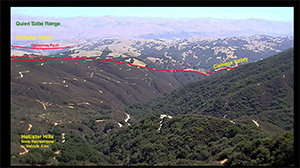 |
| Fig. 35. A creeping section of the Calaveras Fault is easy to trace from street to street through an old neighborhood around Dunne Park in Hollister that was established before modern rule about building construction along active fault. This view is of a hundred-year old cement yard wall that is now offset by nearly a meter. It isn't uncommon for people who live in the homes to come out to talk to student groups who are following the trace of the fault through the neighborhood, looking at offset curbs and cracked walls and foundations. Another important stop is at the Derose Winery along Cienega Valley. The winery building was built directly on the creeping San Andreas Fault over a century ago. This view shows a cement-lined drainage ditch offset by a meter of creep. The walls of the winery building are also offset by a meter. The location is a National Geologic Landmark commemorating the San Andreas Fault. | 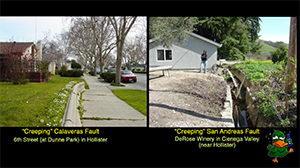 |
| Fig. 36. This map shows the California Fault System in central California. A long, straight section of the San Andreas Fault extends southward from Hollister to the Carrizo Plain area. South of the San Andreas Fault is the "Big Bend" section of the fault, notorious for the M 7.9 Great Fort Tejon Earthquake of 1857 (CA largest historic earthquake). That earthquake ruptured starting near Parkfield and extended southward about 225 miles to the Wrightwood area in SoCal. The "Big Bend" is on the north side of Transverse Ranges (north of Los Angeles) near the intersection of the Garlock Fault. Garlock Fault marks the southern end of the Sierra Nevada Province and links eastward with the fault system on the eastern side of the Sierra Nevada Range and greater Death Valley region. | 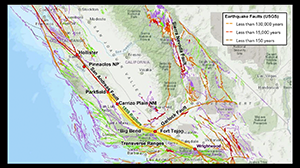 |
| Fig. 37. The drive southward from Hollister on Highway 25 provides a scenic tour of the rift valley drained by the San Benito River. The Calaveras Fault runs along the east side of the valley, whereas the San Andreas Fault runs parallel on the west side of the rift zone for nearly 100 miles before merging into a single (yet complex) fault zone. Along the way, Highway 25 crosses the fault in several places where cracks from fault creep appear crossing the pavement. | 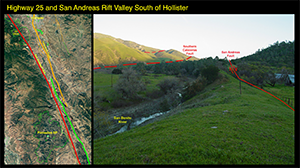 |
| Fig. 38. The volcano that makes up the core of Pinnacles NP is perhaps the most famous feature along the San Andreas Fault. Research by Vince Matthews (UCSC PhD dissertation, 1973) suggested that the Pinnacles volcano was part of the Neenach Volcanic Field that formed along the San Andreas Fault (near the intersection with the Garlock Fault) about 23 million years ago. Since then the Pinnacles half of the volcano has moved northward on the Pacific Plate side of the San Andreas Fault a distance of about 195 miles. These numbers seem incredible, but that comes out to about 0.54 inches (1.37 cm) per year on average, spread out over thousands to millions of earthquakes along the fault zone since the volcano formed. | 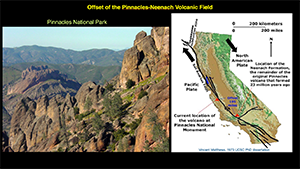 |
| Fig. 39. Parkfield, CA (population 18) is another famous location on the San Andreas Fault because of its famous frequency of large earthquakes. Since the large earthquake of 1857, Parkfield has experience a M 6 earthquake about every 22 years. The fault zone in this area is among the most studied location of faults in the world. The USGS predicted there would be a next big one in the Parkfield area in 1993, so they started a drilling program on a ranch near Parkfield to send equipment down a 2.5 mile well that penetrated through into the fault zone. Unfortunately, the next big quake did not come until September 28, 2004. (I managed to run down there to take this picture of surface rupture cracks beneath the famous Parkfield Bridge that crosses the San Andreas Fault trace along Little Chalome Creek.) | 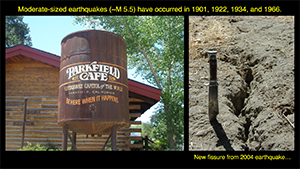 |
| Fig. 40. View of the famous "bent bridge" on Chalome Creek that crosses the San Andreas Fault. The bridge foundation has been retrofitted to shift from fault motion. Estimates suggest that the bridge piers on opposite sides of the fault have have been displaced approximately 5.5 feet since the original bridge was constructed in 1936. Signs have been added to both ends of the bridge commemorating the boundary of the the Pacific and North American tectonic plates. Because there are so many faults showing right-lateral strike-slip displacement in the West, where one plate begins and another ends is open for debate. | 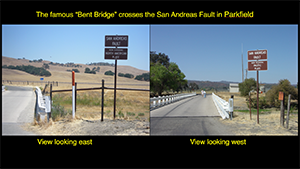 |
| Fig. 41. The Carrizo Plain National Monument is another important place where the San Andreas Fault has been studied. The reason is because of the arid climate in the region prevents erosion and plant growth that otherwise obscures the visibility of fault-line features. The areal view on the left shows the famous shutter ridges and rift that accentuates the trace of the fault. The picture on the right show a sag pond in the fault zone between pressure ridges near the south end of the park. | 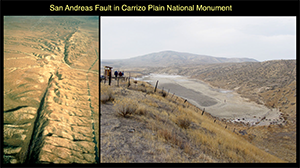 |
| Fig. 42. A famous location along the San Andreas Fault is an offset stream drainage at Wallace Creek (named after USGS Earthquake geologist, Robert E. Wallace who produce and edited the first major professional report on the San Andreas Fault). Here, a steam drainage channel makes a short right-lateral offset where it crosses the San Andreas Fault. Radiocarbon dates of sediments taken from the channel suggest that there has been about 425 feet of right-lateral displacement across the stream channel in the past 11,000 years, measuring a rate of about 3.3 cm (1.3 inches) on average each yea. | 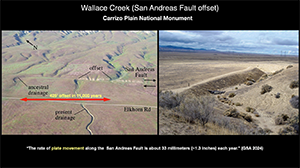 |
| Fig. 43. It is important to note that the movement of the fault happen sporadically associate with great earthquakes. The time between great earthquakes is called a recurrence interval. The USGS released that the average recurrence interval for an earthquake of the size of the M 7.9 Fort Tejon earthquake of 1857 is estimated to be 140 years, plus or minus 40 years. And, that another earthquake of that magnitude is expected within the next several decades. In contrast, the tangential Garlock Fault has not been seismically significant in historic times. However, the White-Wolf Fault on the north side of the Tehachapi Mountains is associated with the M 7.3 Kern County Earthquake of 1952 that cause widespread damage to homes and infrastructure in the region near Bakersfield. | 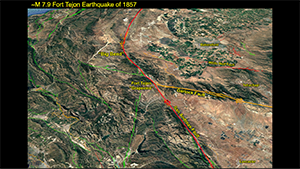 |
| Fig. 44. This USGS figure is a map of major faults in the California region highlighting the extent of ground rupture in historic earthquakes that occurred between 1850 and 2016. It also shows the average number of years between ground-rupturing earthquake at key paleoseismic sites along the San Andreas Fault System. What is important to note is that there are sections of the fault systems that have a record of paleoseismic activity, but no record of historic earthquakes (meaning these sections of the major faults are currently overdue for potentially major earthquakes). | 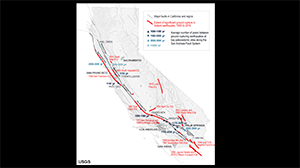 |
| Fig. 45. It is also important to note that there are plenty of other faults out there that are not part of the San Andreas Fault that have produced major earthquakes. The M 7.3 Kern County Earthquake of 1852 and the M 6.7 Northridge Earthquake of 1994 are two examples of major earthquakes that produce mega-billions of dollars in damage. | 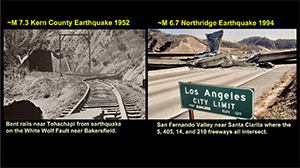 |
| Fig. 46. The Eastern Sierra Fault on the western side of the Sierra Nevada Range is part of the earthquake fault zone. This view shows the faulted Eastern Sierra Front and Big Pine volcanic field near Bishop California. The Owens Valley Fault in this area produced the estimated M 7.4 to M 7.9 Big Pine earthquake of 1872. These faults are part of the Foothills Fault System in the region. Faults in this region display both larger horizontal and vertical displacements, but also have the added measure of having volcanic activity, most notably perhaps Mammoth Mountain volcano (but we'll save that for another story). | 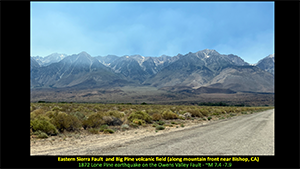 |
| Fig. 47. This is map of know earthquake fault of of southern California. Note the arrangement of faults aligned with the mountain blocks of the Coast Ranges in the north, the Transverse Ranges in the center, the Peninsular ranges in the south, the belt of fault crossing the Mojave region, and the belt of faults offshore in the Borderlands region. | 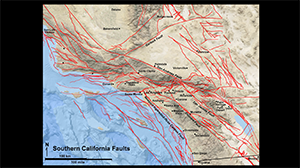 |
| Fig. 48. It is interesting to compare the fault map to earthquake data. This map compiled by Ben Sleeter at the USGS shows earthquake data for SoCal for 1970 to 2010. During this time frame there were several significant earthquakes that are illustrated by clusters of earthquakes (including foreshocks, main shocks (red dots), and aftershocks) in some areas including the the Northridge area, the Joshua Tree/Mojave region , and southern Imperial Valley/Baja earthquakes of 2010). Also noteworthy (and concerning) are the sections of faults that have not shown earthquake activity such as the San Andreas Fault near San Bernardino and from Palm Springs south to the Salton Sea, and inactive sections of the Elsinore Fault, and the Newport-Ingelwood-Rose Canyon Fault along the shore. | 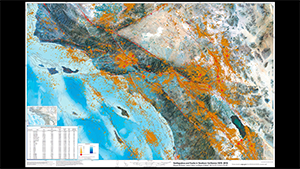 |
| Fig. 49. Although many California highway and interstates cross the San Andreas and other faults, there are few exposures as good as along Highway 14 near Palmdale California. Here the fault zone is exposed in a road cut and appears as a complexly folded and faulted layers and blocks of Pliocene-age sedimentary beds of the Anaverde Formation. These sediments were originally deposited horizontally in an inland lake basin between 5 and 3 million years ago. | 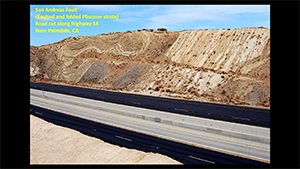 |
| Fig. 50. The highest mountains in the coastal ranges of western western United States are in the Los Angeles region. They are not the highest mountains, but they display among the highest relief of all the mountain ranges in North America, mean the steepest slope and elevation difference from their base to their mountain peaks, starting near sea level and rising to elevations about 10,000 feet. These are also very young mountain ranges actively rising along major faults. This map shows the trace of the Sierra Madre Fault along the southern flank of the San Gabriel Mountains. Mount Baldy, "currently at" 10,068 feet, the high peak just south of Cajon Pass on Interstate 15 where the San Andreas Fault cuts through the gap between the San Gabriel Mountains and the San Bernardino Mountains. Both the Elsinore and San Jacinto Faults also display high relief along sections of their fault zones. | 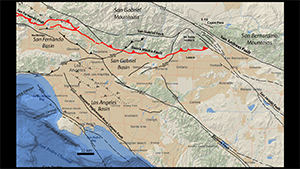 |
| Fig. 51. This satellite map shows the location of the major earthquake faults and the location of major recent earthquakes in southern California. Although the M 6.7 Northridge Earthquake of 1994 did the greatest damage to urban areas of the LA basin, three other more powerful earthquake occurred in the relatively rural, unpopulated regions of southern California including the M 7.3 Landers earthquake of 1992, the M 7.1 Hector Mine earthquake of 1999, the northern Baja California earthquake of 2010 south of the Salton Sea. Note the vicinity of San Gorgonio Peak and San Jacinto Peak relative to the San Andreas Fault in the Palm Springs area (for next image). | 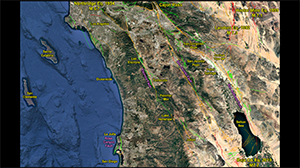 |
| Fig. 52. The San Andreas Fault is responsible for the two highest mountain peaks on opposite side of the fault zone where it cuts through Banning Pass or San Gorgonio Pass. It is the deepest mountain pass in the lower 48 states. The pass is know for its extensive windmill farm visible (between sand storms) along Interstate 10 between Riverside and Palm Springs. San Jacinto Peak, with elevation of 10,804 feet, has the "greatest vertical relief" of any mountain in North America (starting at below sea level near Palm Springs). San Gorgonio Mountain, with elevation of 11,499 feet is the "highest peak in SoCal." Seeing the height and relief of these mountains can force you to ponder just how much stress must exist in the crust along these faults in this region. | 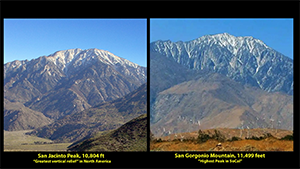 |
| Fig. 53. South and east of Palm Springs the San Andreas Fault runs along the east side of the Coachella Valley. This aerial view shows the fault cutting through badlands of Pliocene basin sediments exposed in of the Mecca Hills south of Indio, California. | 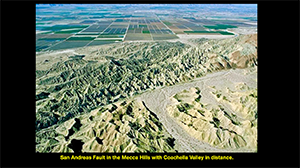 |
| Fig. 54. The southernmost exposure of the San Andreas Fault is exposed near a community called Bombay on the eastern shore of the Salton Sea. It can be argued that the Salton Sea is a large sag pond at the southern end of the fault, but the sea also formed by shifting channels of the Colorado River, sometime filling the valley of the Salton Trough. | 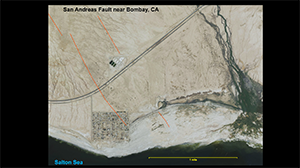 |
| Fig. 55. Displacement along San Andreas Fault shifts to the west beneath the Salton Sea and continues south where continues south as the Imperial Fault. In this region the San Jacinto and southern Elsinore Faults merge into a complex tectonic setting where right lateral transform faulting intersects divergent faulting. This is in the vicinity of the Obsidian Buttes volcanic area at the south end of the Salton Sea. The area has several Quaternary-age volcanoes and is host to a Salton Sea Shallow Geothermal Field (currently being exploited for power and lithium brines). | 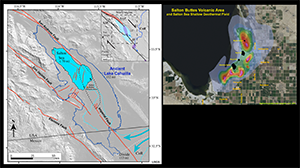 |
| Fig. 56. This figure shows the "plate tectonics setting" for the Salton Sea basin (or Salton Trough). The dynamics involve both transform faulting, with the Peninsular Ranges (including Baja California) moving northward relative to the North America Plate side (with the Chocolate Mountains). It also illustrates the small spreading center beneath the southern end of the Salton Sea (responsible of the Obsidian Buttes volcanic field and geothermal area. Other small spreading centers are inferred below the Mexican border and new seafloor is forming beneath the Gulf of California. | 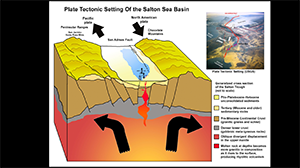 |
| Fig. 57. This is part of the Sleeter Earthquake map of SoCal focusing on the southern Riverside, Orange, and San Diego Counties region. It shows the 4 significant fault zones with their average annual slip rate calculations: 22 mm/yr for the southern San Andreas Fault, 13 mm/yr for the San Jacinto Fault, 2.5 to 5 mm/yr for the Elsinore Fault, and 2 mm/yr for the Rose Canyon Fault. Whereas, these last two faults are not nearly as active, they have a history of large historic earthquakes, and they are located in highly populated regions. The earthquake data show that earthquakes are centered along the major faults but not in the internal parts of the large crustal blocks that make of the Peninsular Ranges, the Perris Block and the Santa Ana Block. These blocks are underlain by crystalline granitic basement rocks associated with the formation of the Western Cordilleran volcanic arc that formed and cooled during late Mesozoic time. | 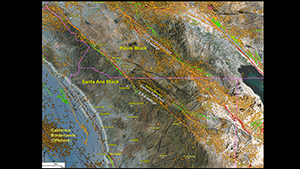 |
| Fig. 58. Elsinore Fault is considered "One of the largest and quietest faults in Southern California." It is considered as old as the San Andreas Fault (having started to form ~ 28 million years ago). It displays right-lateral strike-slip fault displacement. It cuts through crystalline basement rocks of the Peninsular Ranges. Displacement estimates: ~14 miles. Average slip rate varies: ~2-5 mm/year. Earthquake recurrence interval: ~250 years (varies). The Elsinore Fault is associated with 3 major earthquakes in historic times: a M 6.0 in 1910 in the Glen Ivy/Temecula segment area, and 7.2 in 2010 on the southern Coyote Mountains segment, and a M 7 in 1892 on the Laguna Salada segment (in Mexico). According the SCEC (Southern California Earthquake Center) there is a probable magnitude of a major earthquake in the range of a M 6.5 to 7.5 on the Elsinore Fault. | 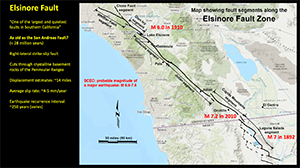 |
| Fig. 59. This view is of Lake Elsinore from the Roadhouse Overlook on the Ortega Highway (Hwy 74) that crosses westward over the Santa Ana Mountains. Lake Elsinore is a large sag pond within the broad valley of the Elsinore Fault Zone. | 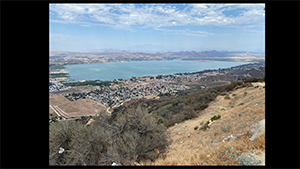 |
| Fig. 60. This satellite view of the Lake Elsinore area shows two subsidiary, parallel faults that run along opposite sides of the rift valley. Together they are considered part of the Elsinore Fault Zone. The Wildomar Fault runs along the northeast shore and side of the valley whereas the Willard Fault runs along the southwest shore bordering the Santa Ana Mountains. These two faults run parallel to each other, along with other splay faults for nearly 60 miles (from Corona to Temecula) before merging in the vicinity of Palomar Mountain. | 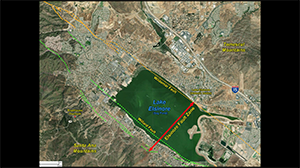 |
| Fig. 61. This figure shows a map and cross section of the Elsinore Trough just north of lake Elsinore. It show ares of late Miocene volcanic rocks that cap the high country on both sides of the sediment-filled trough. These volcanic rocks probably came from a volcanic source in the Santa Ana Mountains as the Elsinore Fault (and trough) were forming in late Miocene time. Right-lateral displacement of rocks on opposite sides of the Elsinore Fault Zone has been calculated at about 14 miles. | 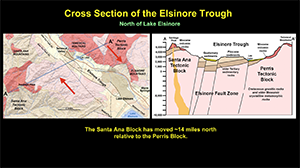 |
| Fig. 62. Landscape features associated with the Elsinore Fault Zone are fairly obvious in many locations along the fault. This view shows the mountain front view near where Interstate 15 crosses the mouth of the Santa Margarita River Canyon near Old Town Temecula. The Willard fault runs along the mountain front. | 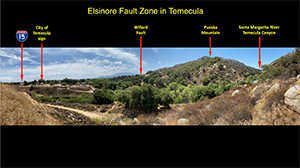 |
| Fig. 63. This is a map view of the same area in the previous image. It show the faults associated with the Elsinore Fault Zone (rift valley) near Old Town Temecula. Note that several streams converge in the fault zone near the mouth of the canyon. This suggests that the Santa Margarita River carved the canyon as the Santa Ana Block began to rise on the west side of the fault zone. | 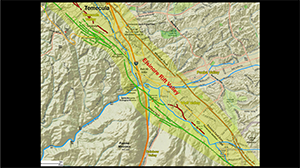 |
| Fig. 64. Subtle landscape features associated with the earthquake faults in the Temecula area. The figure on the left show low escarpment of the Wildomar Fault where it crosses beneath Interstate 15. Small hillocks and linear escarpments associated with the Willard Fault are still preserved on the Temecula Creek Inn golf resort (along the east side of the interstate), with an additional fault strand cutting across the base of Pueska Mountain (on the west side of the interstate). | 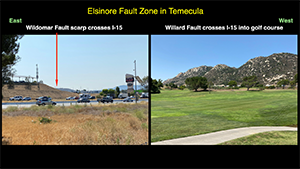 |
| Fig. 65. This view is from an overlook at the southeast end of Palomar Mountain. Palomar Mountain is an elevated pressure ridge on the north side of the Elsinore Fault Zone. The linear trace of the Elsinore Fault follows the drainage of the San Luis Rey stream valley where it cuts along the southern flank of the mountain. Continuing south, the Elsinore fault passing along the south side of Lake Henshaw basin before rising through a gap near Julian adjacent to Vulcan Mountain. Lake Henshaw basin is a shallow sediment-filled sag on the east side of the fault. The elevated plateau of Mesa Grande was probably originally adjacent to the Vulcan Mountains uplands when the Elsinore Fault began forming in Miocene time. | 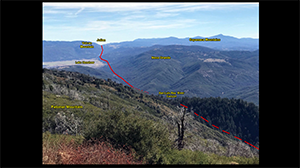 |
| Fig. 66. The Newport-Ingelwood-Rose Canyon Fault zone is perhaps of greatest interest to the coastal communities south of Las Angeles to San Diego, for a variety of reasons. For most of its length it runs offshore between Newport and La Jolla. It is associated with the offshore escarpment that partly defines the shelf break offshore. Most of what is known about the Rose Canyon Fault section where it has been extensively studied between where it comes onshore in La Jolla and runs offshore again. A 2020 Report by the California Earthquake Authority suggests that the fault is capable of generating a M 6.9 earthquake. An earthquake with an estimated magnitude between M 6.0 to 6.5 that occurred in 1862 is attributed to the Rose Canyon Fault. | 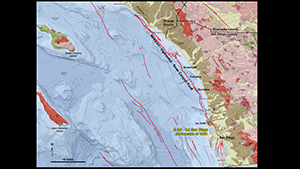 |
| Fig. 67. The Rose Canyon Fault comes onshore in La Jolla Bay, cuts across the flank of Mount Soledad where it descends into Rose Canyon and then basically follows the route of Interstate 5 along the east shore of Mission Bay southward into San Diego. Places where the fault zone can be easily seen is in the sea cliffs near La Jolla, on Mount Soledad, with notable locations including Tecolote Park, and in Old Town San Diego. This map shows Alquist-Priolo zoning. Alquist-Priolo earthquake fault zones are regulatory zones surrounding the surface traces of active faults in California. Wherever an active fault exists, if it has the potential for surface rupture, a structure for human occupancy cannot be placed over the fault and must be a minimum distance from the fault (generally fifty feet). Note that not all fault are AP zone faults (yet). | 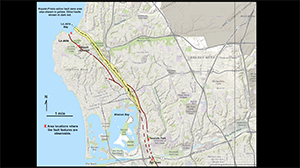 |
| Fig. 68. This map show the Rose Canyon Fault Zone in the vicinity of La Jolla Bay where the fault comes onshore. The active shown on an Alquis-Priolo fault map is not exposed at the surface, however other faults and fractures appear along the sea cliffs in the vicinity that can arguably be included in the greater fault zone. These smaller faults are part of the greater spread of tectonic displacement where the fault approaches the surface. Some of these faults show greater offset than others. These faults/fractures are zone of enhanced wave erosion, resulting in the formation of sea caves. | 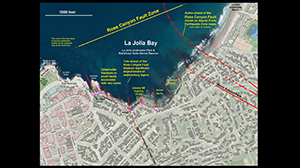 |
| Fig. 69. This image show the line of seven sea caves in the sea cliff on the south shore of La Jolla Bay. Each of the caves is associated with a minor fault that parallels the main trace of the Rose Canyon Fault. | 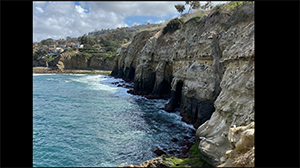 |
| Fig. 70. This view shows an elevated wave-cut bench (shown here at low tide) that is raised on the south side of the main trace of the Rose Canyon Fault. In the distance, in the corner of the cove, is a feature called the Devils Slide (where people risk their lives to get down to the beach). One of the larger faults is exposed in the Devils Slide area. It is show here where small caverns carved by escaping groundwater are carved into the fault zone at this location. | 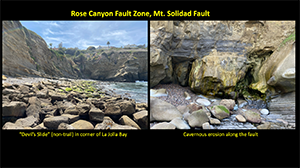 |
| Fig. 71. These view show sea caves exposed along the shore that were carved in zones of weakness along small faults that show minor displacement. | 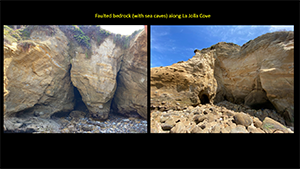 |
| Fig. 72. This is an aerial view of the Mount Soledad area that shows the location of mapped earthquake faults. The Mount Soledad Fault runs across the summit next to the National Veterans Memorial. Two strand on the right are part of the Alquist-Priolo earthquake fault maps. | 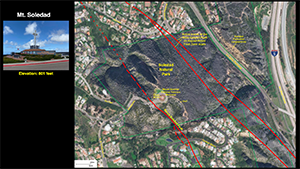 |
| Fig. 73. This view lis looking south along the linear fault valley of Rose Canyon where Interstate 5 and the rail line descends toward Mission Bay. The fault gradually bends to the right along the east shore of Mission Bay, and is probably tectonically responsible for the origin of the bay. | 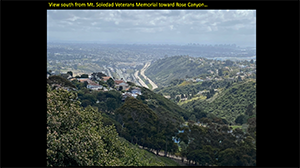 |
| Fig. 74. Although not shown on the mapped USGS earthquake faults on the east shore of Mission Bay, a fault interpreted as part of the Rose Canyon Fault is commemorated Tecolote Park with a sign above an outcrop where Quaternary age river terrace gravels are displace by a minor fault. | 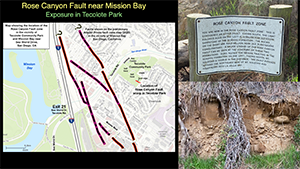 |
| Fig. 75. Old Town, San Diego, was established in 1769 was the first permanent Spanish settlement in California. It was, however unfortunate, built basically within the fault zone of the Rose Canyon Fault. Many of the buildings and residents were damaged in the 1862 earthquake, and ground ruptures were reported in the area. It is fairly easy to follow the trace of the fault from street to street in the Old Town area. | 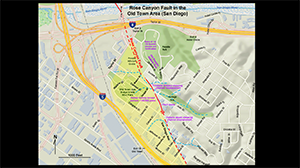 |
| Fig. 76. For example, this view shows a break in slope that basically follows the fault scarp of the Rose Canyon Fault. | 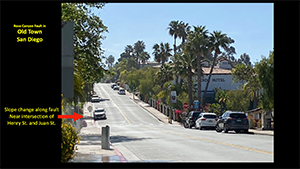 |
| Fig. 77. Map showing the Aquist-Priolo Fault Zones in San Diego. The fault is subdivided into numerous strands that cut across San Diego Bay and across Coronado Island before heading offshore. Places to observe the significance of fault include Fault Line Park in downtown San Diego, along the shoreline at Tidewater Park. The scarp of the Coronado Fault strand can be traced through the neighborhood on Coronado Island. | 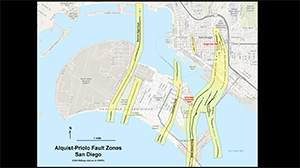 |
| Fig. 78. Fault Line Park is a park partly commemorating the significance of the Rose Canyon Fault. A pathway with explanatory exhibits cuts across this new urban park. Two large stainless steel balls placed on opposite sides of the fault-line pathway have holes through them that are aligned for the purpose of noting if fault displacement occurs over time. | 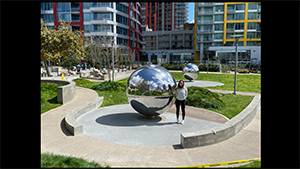 |
| Fig. 79. The San Diego Coronado Bridge was constructed over several strands of the fault noted during its construction. One strand comes onshore in the vicinity of the the beach at Coronado Tidelands Park. From there it is easy to walk over and see the scarp of the Coronado Fault strand preserved as a change in slope where it passes through the old Coronado neighborhood. | 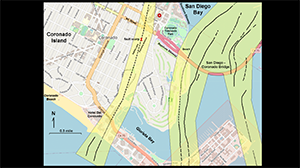 |
| Fig. 80. This view show the interpreted location of fault strand relative to the north end of the San Diego - Coronado Bridge and seen from Coronado Tidelands Park on San Diego Bay. | 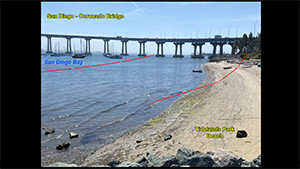 |
| Fig. 81. This view shows the change in slope (fault scarp) associated with the Coronado Fault strand of the Rose Canyon Fault Zone where it crosses 5th Street and Pomona Avenue on Coronado Island. | 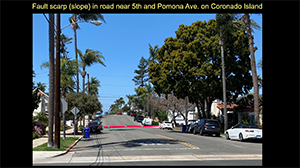 |
| Fig. 82. The final stop along the Rose Canyon Fault is where it extends offshore in the vicinity of a rip-rock groin that marks the boundary between Coronado Beach and the Silver Strand (beach) near Hotel Del Coronado. The hotel was established as a National Historic Landmark in 1977. When it opened in 1888 it was the largest hotel resort in the world. It is an all wooden structure, among the largest ever constructed. Despite the fire risk, the wooden building it is possibly likely to better survive strong earthquake shaking (hopefully!). | 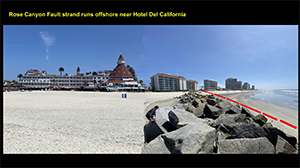 |
| Fig. 83. This is the last image. It shows the California Borderlands physiographic region of offshore southern California. Note the rugged relief as reveal by bathymetry. Note the scale of depths of the basins, compared to the elevations of mountain peaks onshore. Several faults in have been identified (so far) in this offshore region, and other may soon be revealed, or may reveal themselves during submarine earthquakes. Each of the seamounts is a large chunk of continental crust that has split away from the coastline and are migrating northward like a slow fleet of ship. Whether new ocean crust is forming between in the deep basin regions is undetermined. Perhaps the greatest concern about this region is the potential for tsunamis generated by large offshore earthquakes or associated great underwater landslides. Perhaps parts of California do fall of during major earthquakes? | 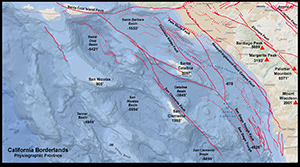 |
Selected ResourcesThis website contains graphics from numerous sources (including photographs and maps compiled by the writer). Many of graphics came originally from US Geological Survey websites compiled starting in the 1990s (including many that no longer exist online). Base maps were compiled and modified from sources including the NationalAtlas.gov with fault data overlays from the USGS qFaults database of Quaternary earthquake faults, and selected California Geological Survey resources, among others. Satellite imagery derived from NASA.gov, Google Earth and NOAA's nowCOAST website were also used. Note that there are many faults not show on the maps, and newer maps and data are probably available. All graphics used from sources on the Internet came from public domain websites, but may have been modified and edited to improve visual quality or highlight significant features.The best places to start looking for recent information about earthquake faults in California are the following websites: U.S. Geological Survey, Earthquake Hazards Program: https://www.usgs.gov/programs/earthquake-hazards Statewide California Earthquake Center (SCEC): https://www.scec.org/ California Department of Conservation: Earthquakes: https://www.conservation.ca.gov/cgs/earthquakes California Earthquake Authority: https://www.earthquakeauthority.com/ Below are some selected additional reference sources and links.Abbott, P.L., 1999, The Rise and Fall of San Diego: 150 Million Years Of History Recorded In Sedimentary Rocks. San Diego: Sunbelt Publications, 231 p.Bennett, R.A., Friedrich, A.M., and Furlong, K.P., 2004, Codependent histories of the San Andreas and San Jacinto fault zones from inversion of fault displacement rate: Geology, v. 32, p. 961-964. (link) California Department of Conservation, California Geological Survey, 2019, EQ Zapp: California Earthquake Hazards Zone Application (EQ Zapp) [Maps of Alquist-Priolo Act - Earthquake Fault Zones used for construction zoning]. (link) California Earthquake Authority, 2020, Rose Canyon Fault Earthquake Predictions. (link) California Earthquake Authority, 2020, Earthquake Risk in San Diego. (link) California Geological Survey, 1991, Earthquake Zones of Required Investigation: La Jolla Quadrangle. 1 sheet. Map scale 1:24,000. (link) California Geological Survey, 2021, Earthquake Zones of Required Investigation: Point Loma Quadrangle. 1 sheet. Map scale 1:24,000. (link) DeFrisco, M., 2021, The Rose Canyon Fault in the Point Loma and La Jolla 7.5 Minute Quadrangles San Diego County, California: California Geological Survey Fault Evaluation Report FER 265, 57 p., with tables and 3 plates. (link) Deméré, T. A., Faults and Earthquakes in San Diego County: San Diego Museum of Natural History [accessed in archive, 2021]. (link) Earthquake Engineering Research Institute (EERI), San Diego Chapter, 2020, San Diego Earthquake Planning Scenario: Magnitude 6.9 on the Rose Canyon Fault Zone, 87 p. (link) Frederiksen, N.O., 1991, Age determinations for Eocene formations of the San Diego, California, area, based on pollen data, IN Abbott, P.L., and May, J.A., eds., Eocene geologic history, San Diego region: Society of Economic Paleontologists and Mineralogists, Pacific Section, Field Trip Guidebook, book 68, p. 201-215. Kennedy, M.P. and Tan, SS., 2008, Geologic map of the San Diego 30' x 60' Quadrangle, California: California Geological Survey Regional Geologic Map No. 3, sake 1:100,000. (Link) Lindvall, S.C. and Rockwell, T.K., 1995, Holocene activity on the Rose Canyon Fault Zone in San Diego, California. Journal of Geophysical Research, v. 100, no. B12, p., 24,121-24,132 [Dec. 10,1995]. (link) Moore, G.W. and Kennedy, M.P., 1975, Quaternary faults at San Diego Bay, California: Journal of Research of the U.S. Geological Survey: v. 3, no. 5, p. 589-595. (link) Rockwell, T., 2010, The Rose Canyon Fault Zone in San Diego: Fifth International Conference on Recent Advances in Geotechnical Earthquake Engineering and Soil Dynamics, May 24-29, 2010, paper no. 7, 9 p. (link) Sahakian, V., Bormann, J., Driscoll, N., Harding, A., Kent, G., and Wesnousky, S., 2017. Seismic constrains on the architecture of the Newport-Inglewood/Rose Canyon Fault: Implications for the length and magnitude of future earthquake ruptures. JGR Solid Earth, 07 March 2017. (link) Singleton, D. M., Rockwell T.K, Murbach, D., Murbach, M., Maloney, J. M., Freeman, T., and Levy, Y. , 2019, Late-Holocene Rupture History of the Rose Canyon Fault in Old Town, San Diego: Implications for Cascading Earthquakes on the Newport-Inglewood-Rose Canyon Fault System: Bulletin of the Seismological Society of America, v. 109, 855-874. (link) Sleeter, B.M., Calzia, J.P., and Walter, S.R., 2012, Earthquakes and faults in southern California (1970–2010): U.S. Geological Survey Scientific Investigations Map 3222, scale 1:450,000. (link) U.S. Geological Survey and California Geological Survey, Quaternary Fault and Fold Database of the United States, Interactive Quaternary Fault Map (accessed 4/1/2021). (link) Todd, Victoria, 1994, Geologic Map of the Julian 7.5 Minute Quadrangle, San Diego County, CA: U.S. Geological Survey, Open-File Report 94-16, 18 p. (link) U.S. Geological Survey and California Geological Survey, Quaternary Fault and Fold Database of the United States, Interactive Quaternary Fault Map. (link) Wallace, Robert E., ed., 1990, The San Andreas fault system, California: U.S. Geological Survey Professional Paper 1515, 283 p. (link) California Fault System reports compiled by the author of this website: Stoffer, P., 2005, The San Andreas Fault In The San Francisco Bay Area, California: A Geology Fieldtrip Guidebook To Selected Stops On Public Lands: U.S. Geological Survey, Open-File Report 2005-1127, 133 p. (link) Stoffer, P., 2006, Where’s the San Andreas Fault? A Guidebook to Tracing the Fault on Public Lands in the San Francisco Bay Region: U.S. Geological Survey, General Interest Publication, GIP 16, 142 p. (link) Stoffer, P., 2008, Where’s the Hayward Fault? A Green Guide to the Fault: U.S. Geological Survey, Open-File Report 2008-1135, 96 p. (link) Stoffer, P., 2010, Joshua Tree National Park: A 3D Photographic Tour Featuring Park Geology [includes guides to the Coachella Valley Preserve and Painted Canyon natural areas along the San Andreas Fault]: Geology of National Parks: MiraCosta College, Gotbooks Website (link)> Stoffer, P. 2021, A Guide To Selected Locations and Features Along the Rose Canyon Fault Zone In The San Diego Area, CA: Field Trip Destinations in San Diego County: MiraCosta College, Gotbooks Website (link) Stoffer, P. 2022, Geology Field Guide to the Torrey Pines Park Area: Field Trip Destinations in San Diego County: MiraCosta College, Gotbooks Website (link) Stoffer, P. 2022, Geology Field Trips To California's Central Coast: MiraCosta College, Gotbooks Website [includes field trips to the San Andreas and Calaveras Faults in the San Benito County, CA region near San Juan Bautista and Hollister, California] (link)> Stoffer, P. 2023, The Elsinore Fault Zone: Field Trip Destinations in San Diego County: Field Trip Destinations in San Diego County: MiraCosta College, Gotbooks Website (link) Stoffer, P. 2024, Geology and Natural History of the Salton Sea Area: Field Trip Destinations in San Diego County: MiraCosta College, Gotbooks Website (link) |
| >This page is <https://gotbooks.miracosta.edu/fieldtrips/SAF/> Last modified 11/3/2024. |