
Torrey Pines State Nature Reserve |
Geology Field Guide to the Torrey Pines Park Area |
|
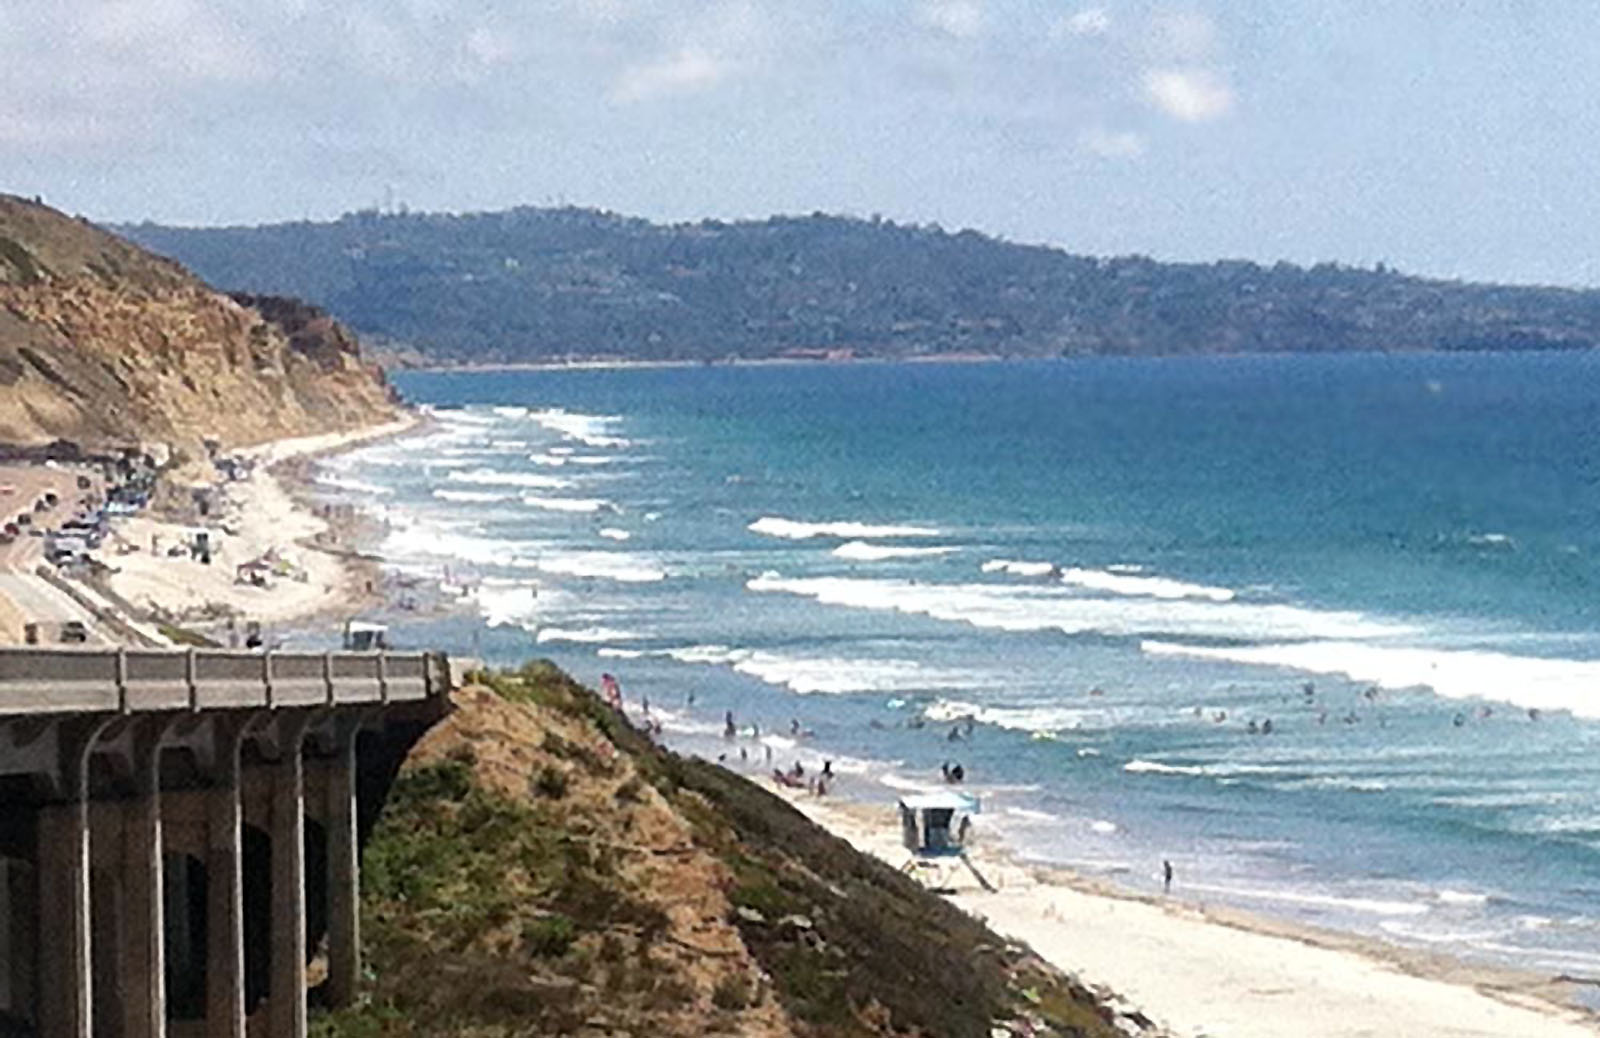
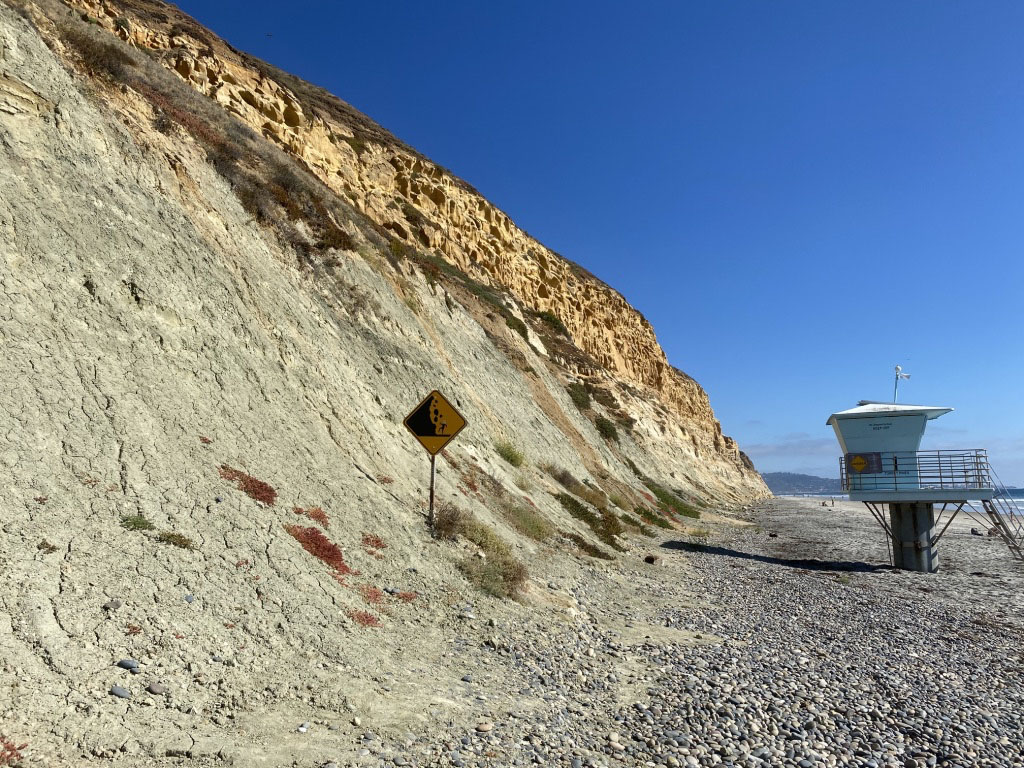
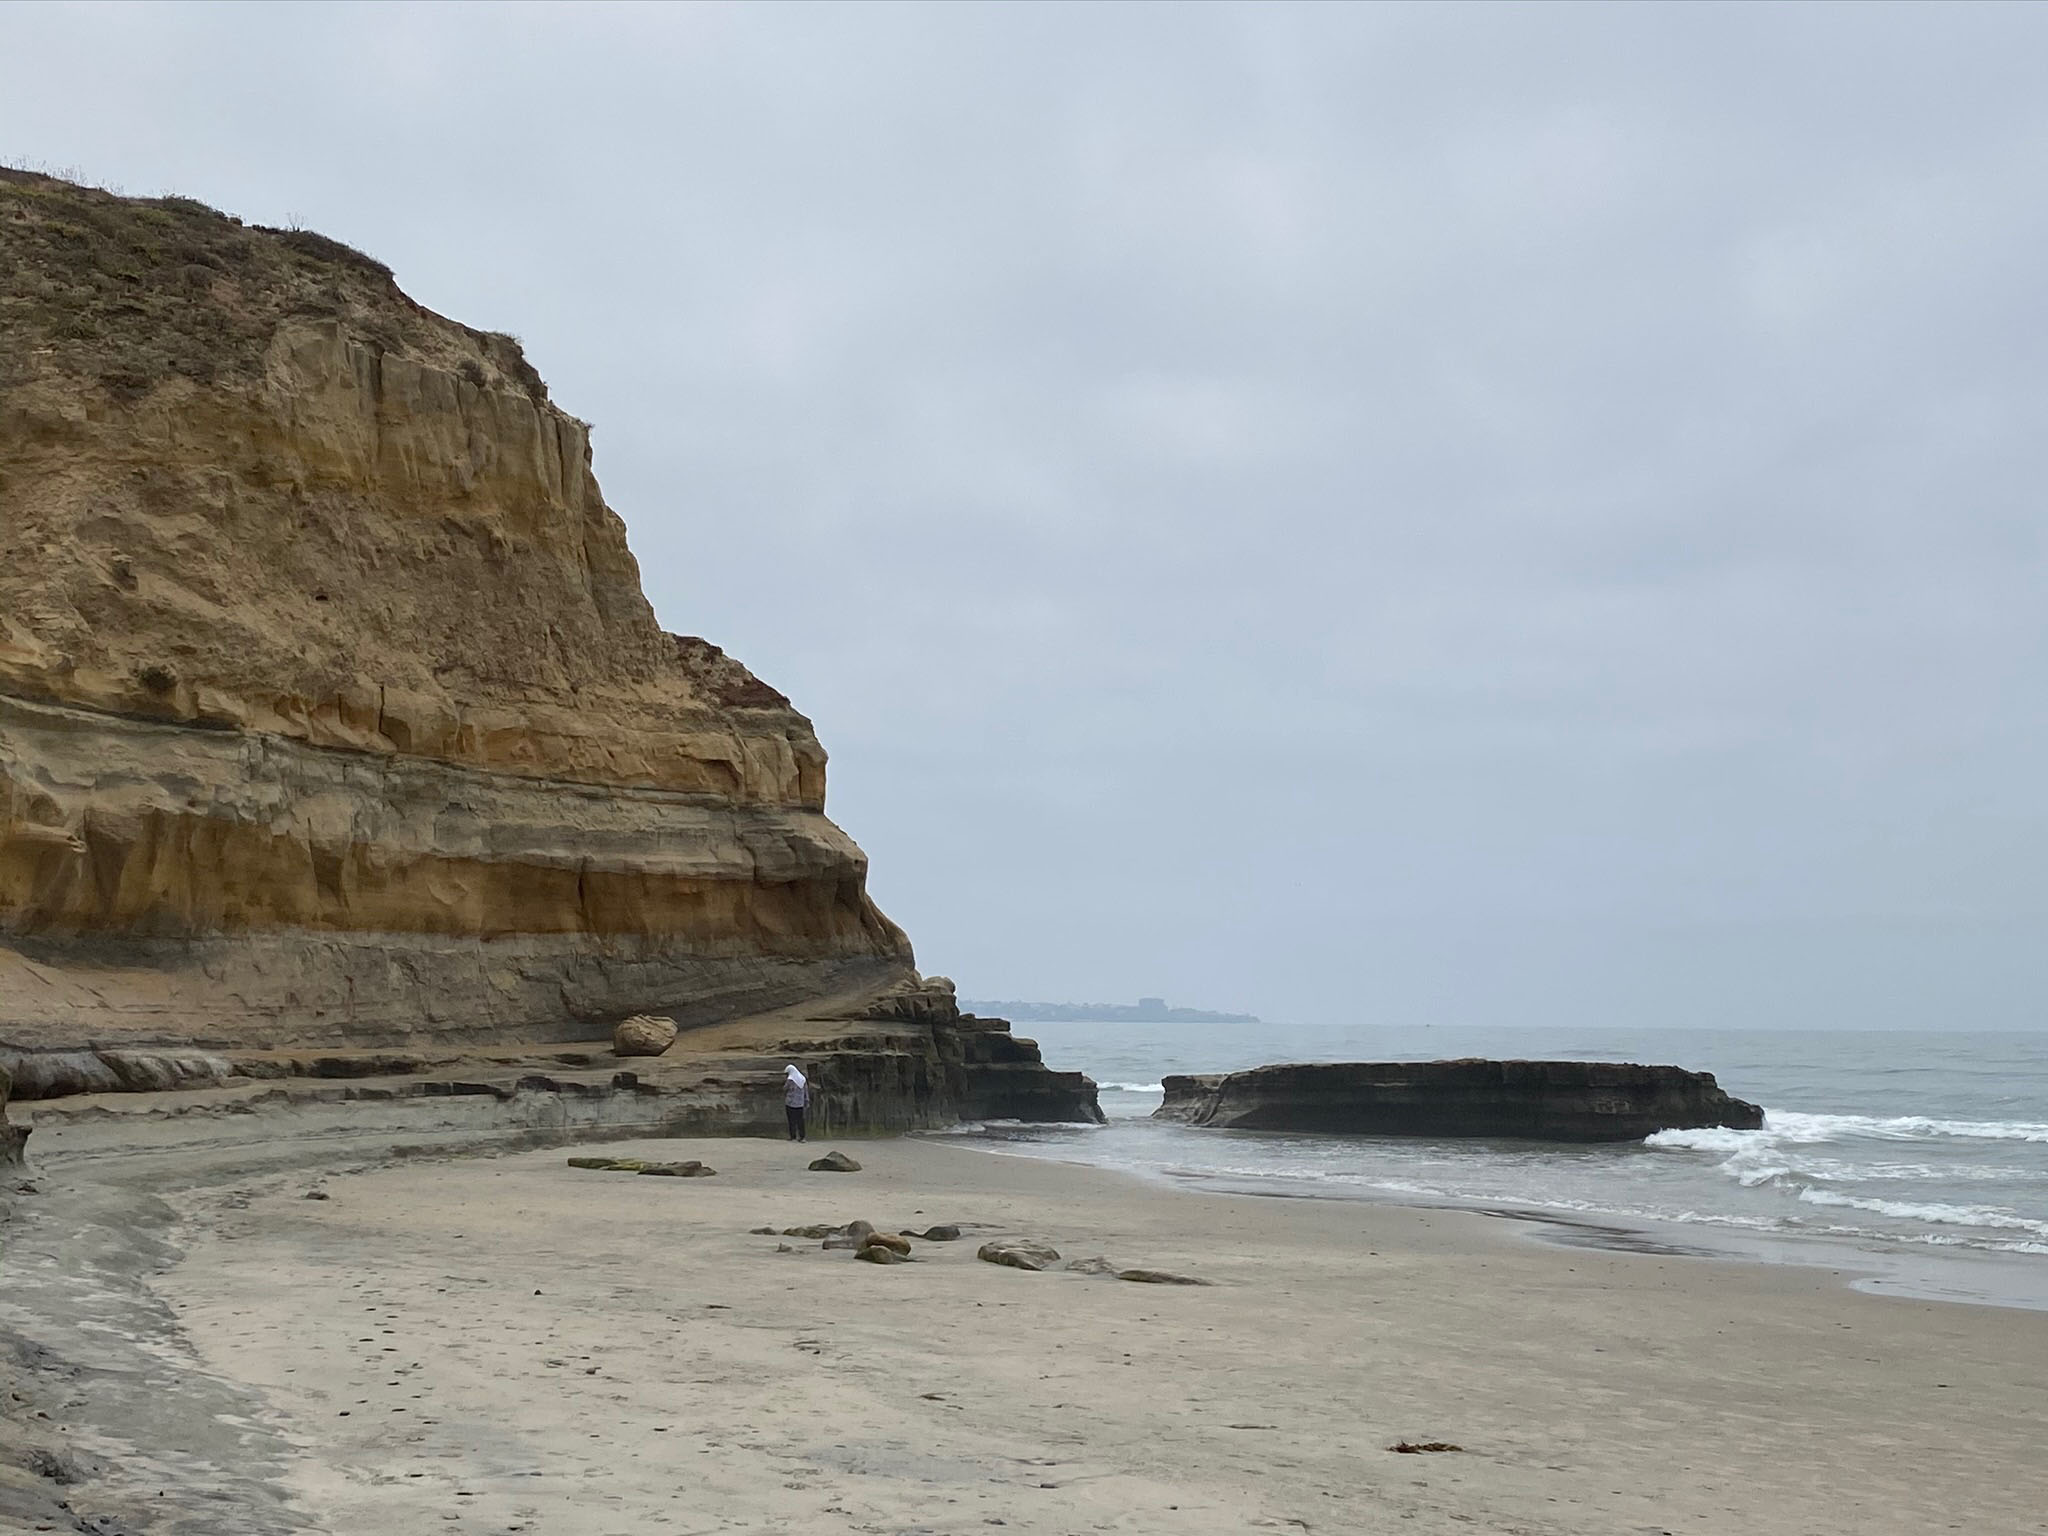
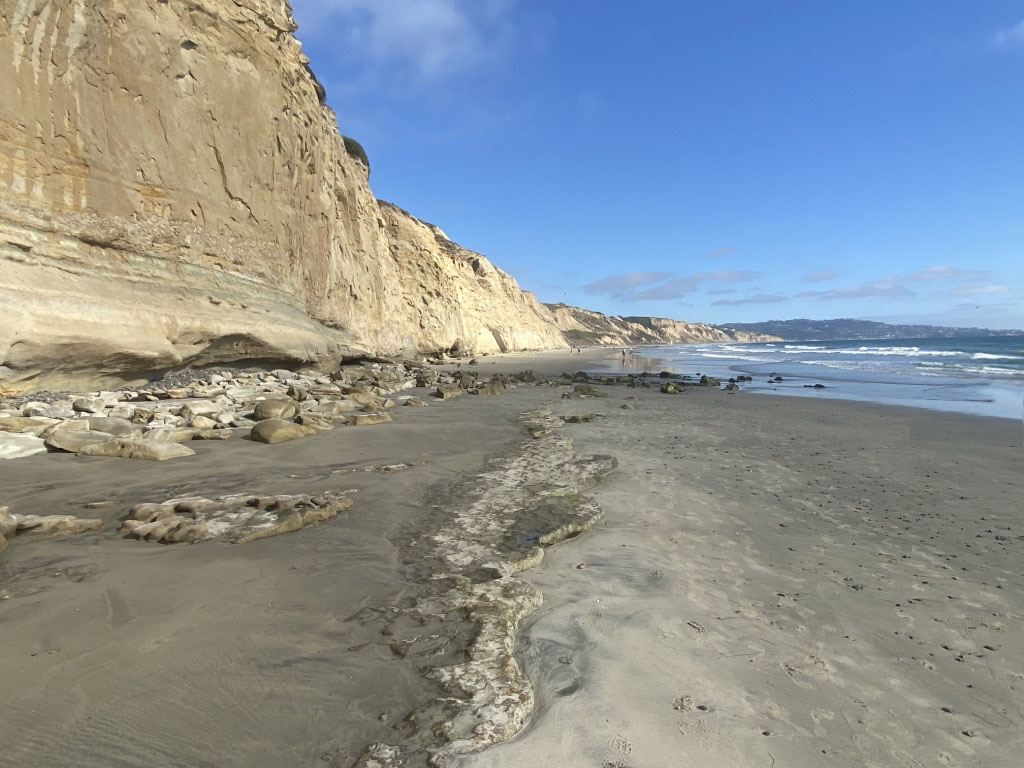
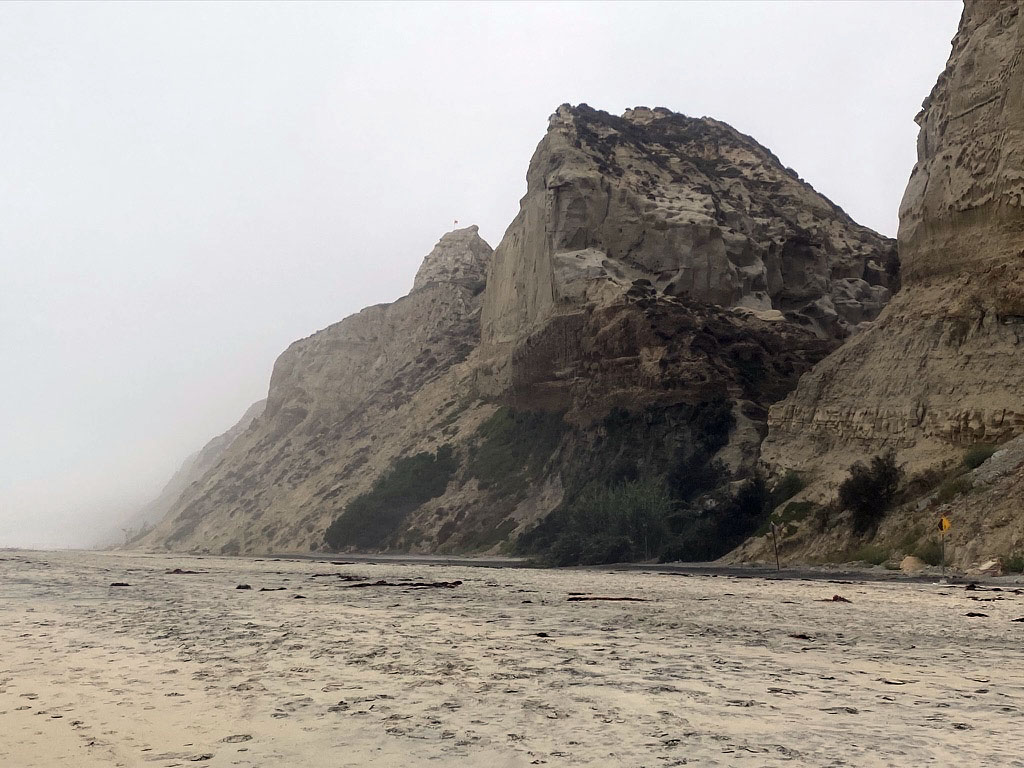
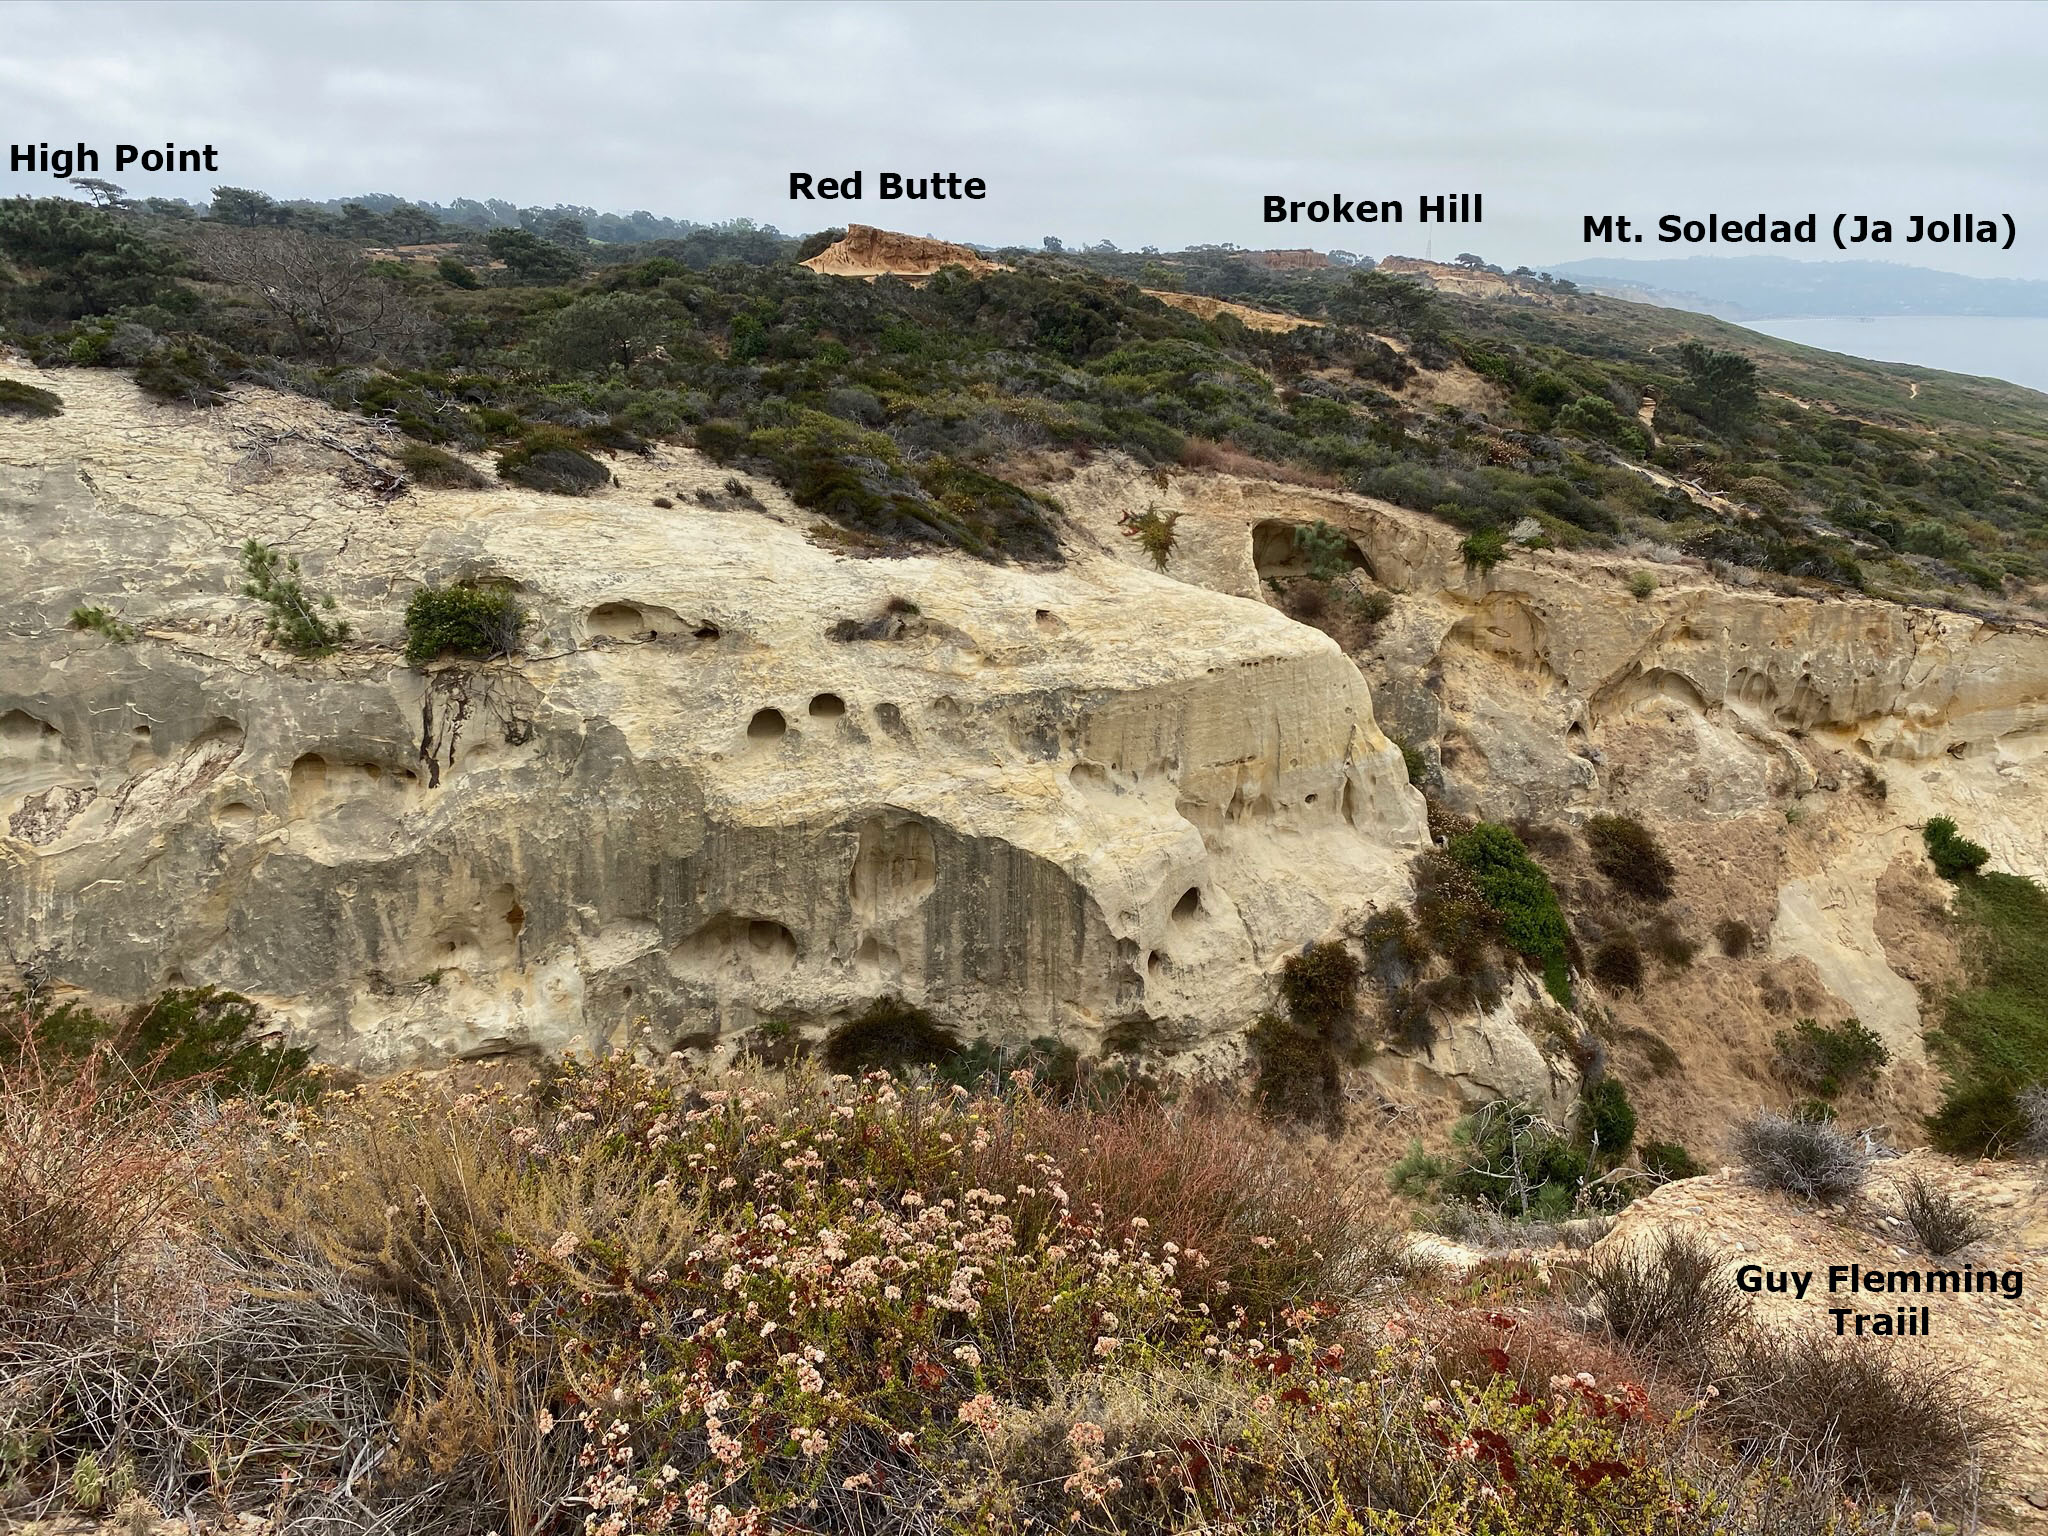
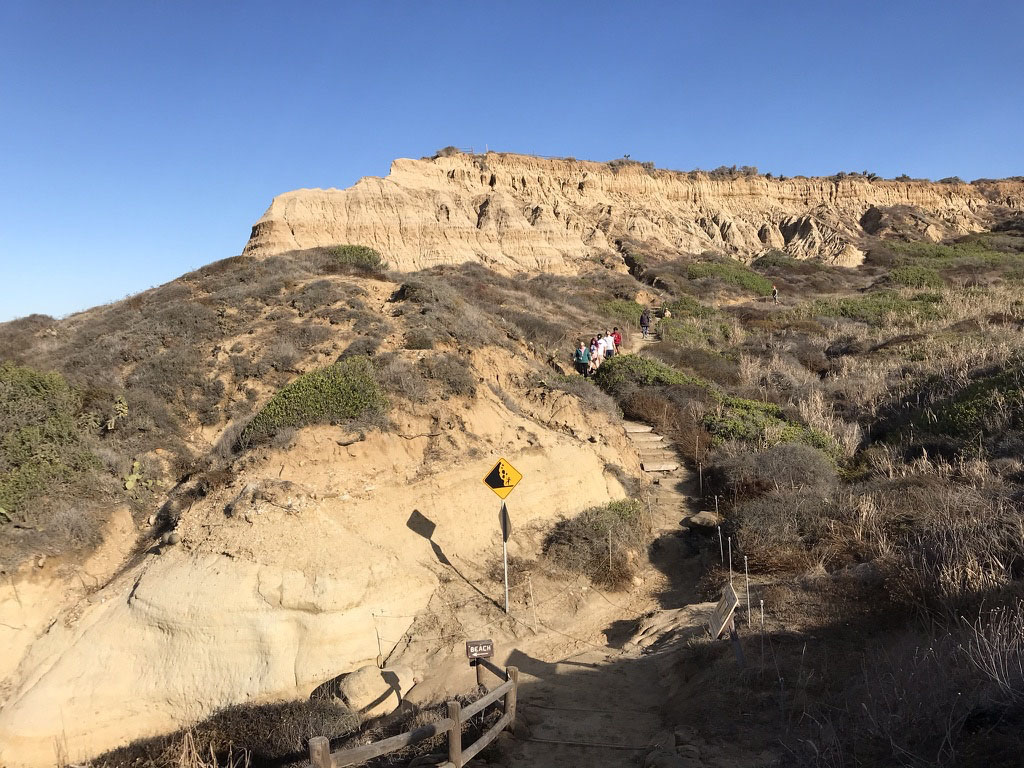
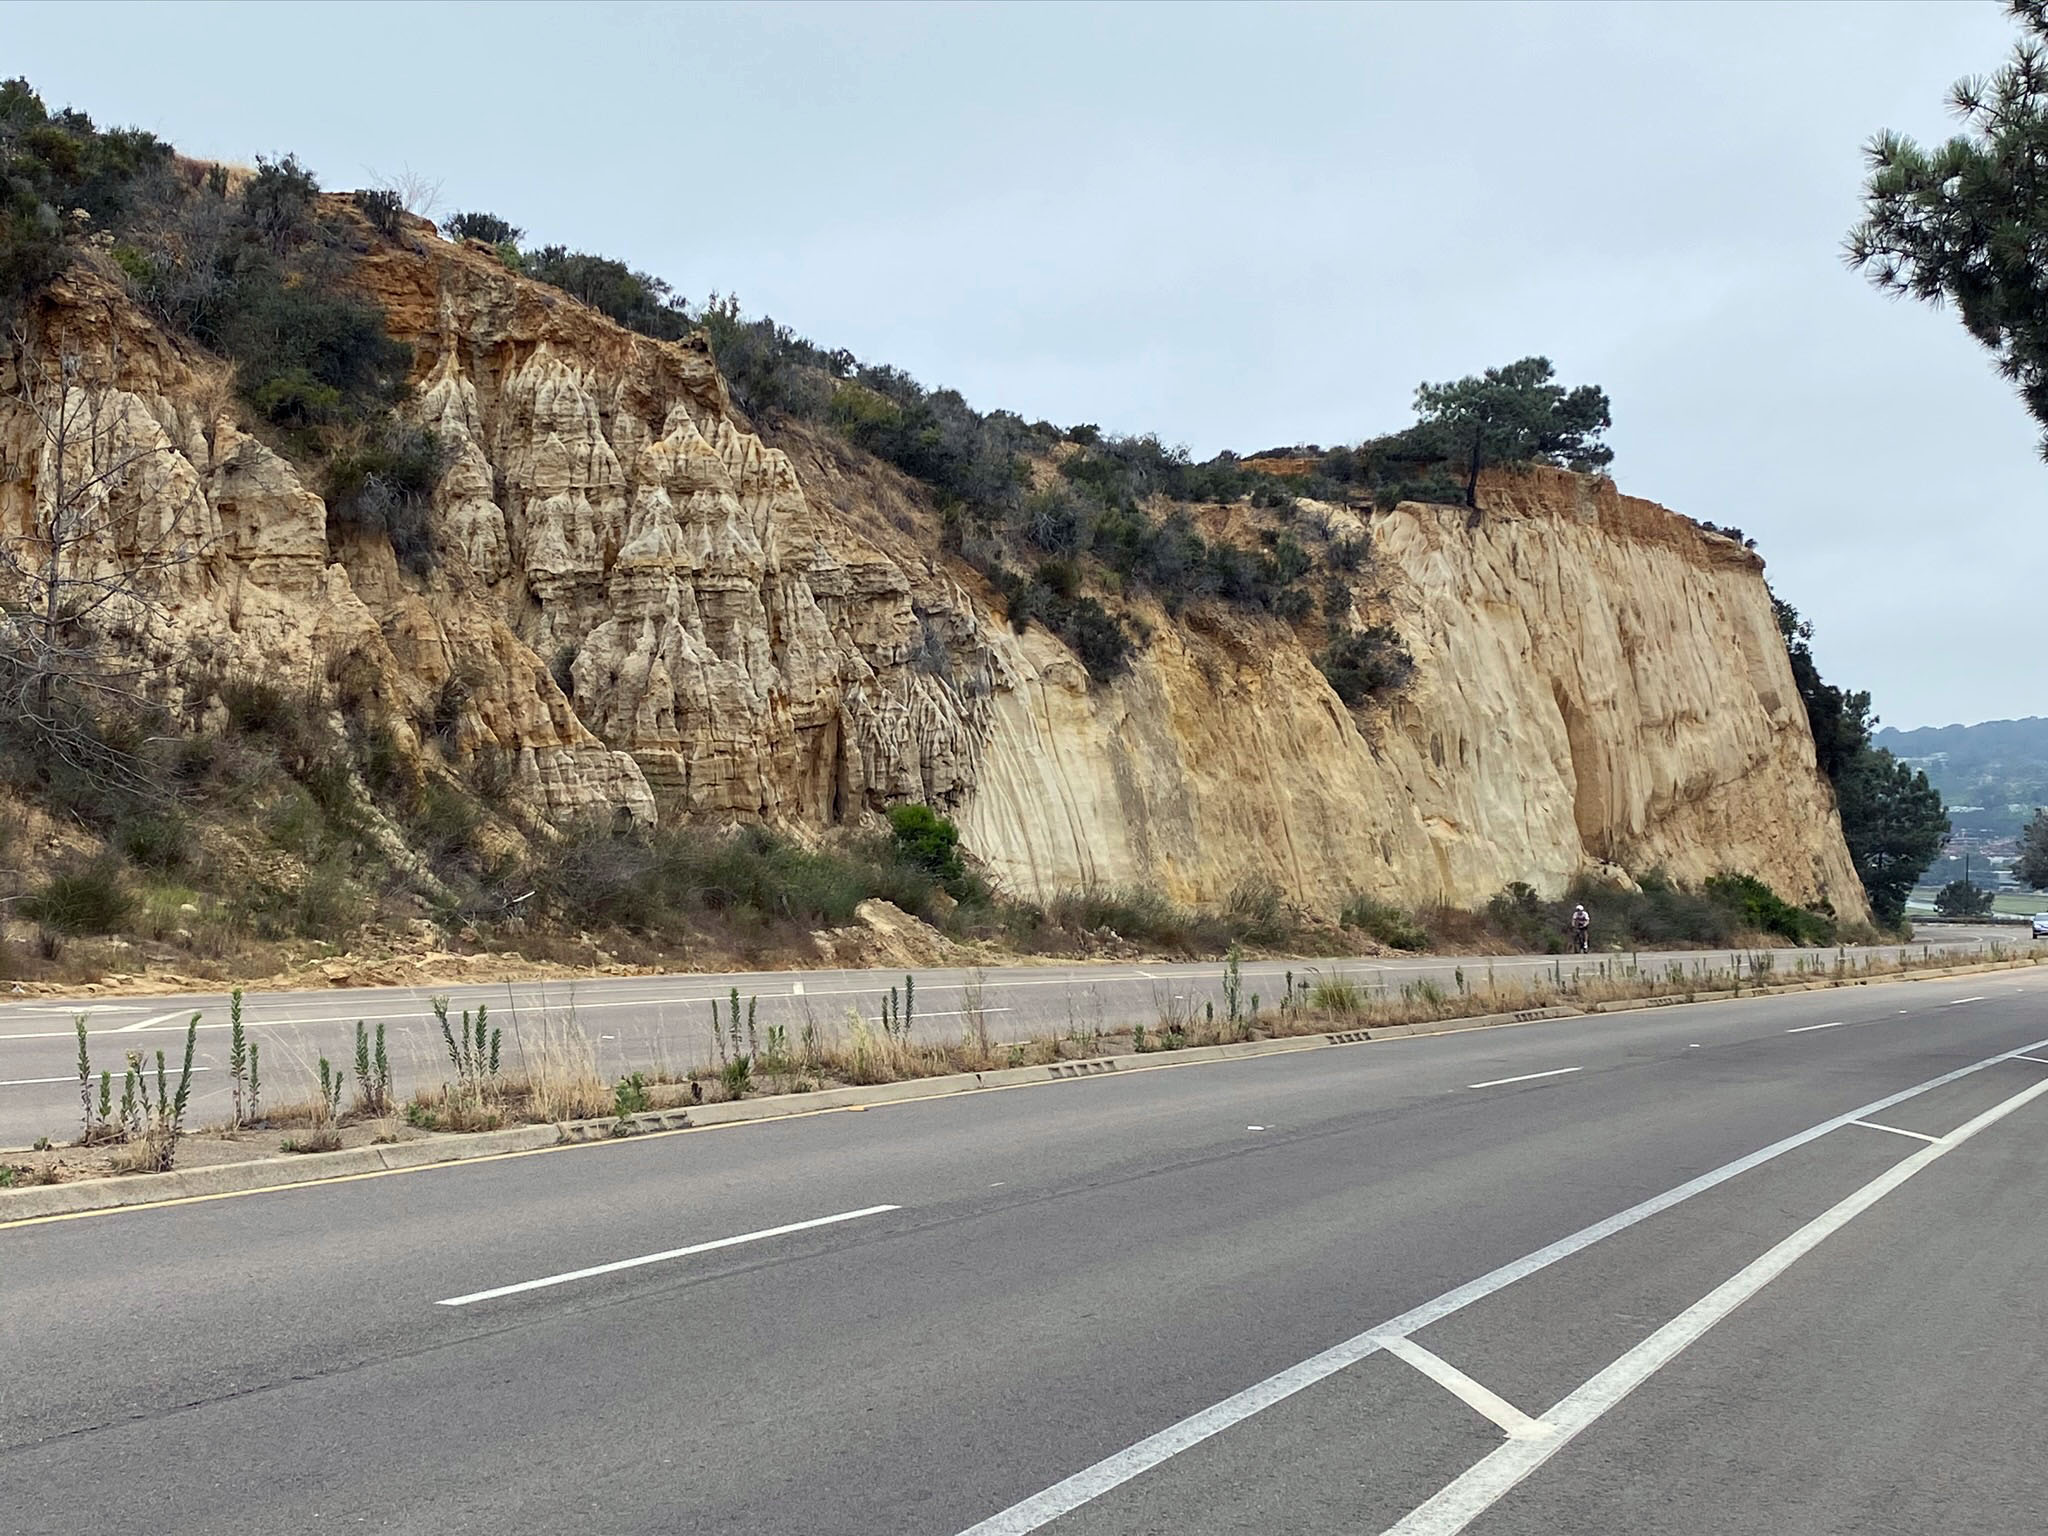
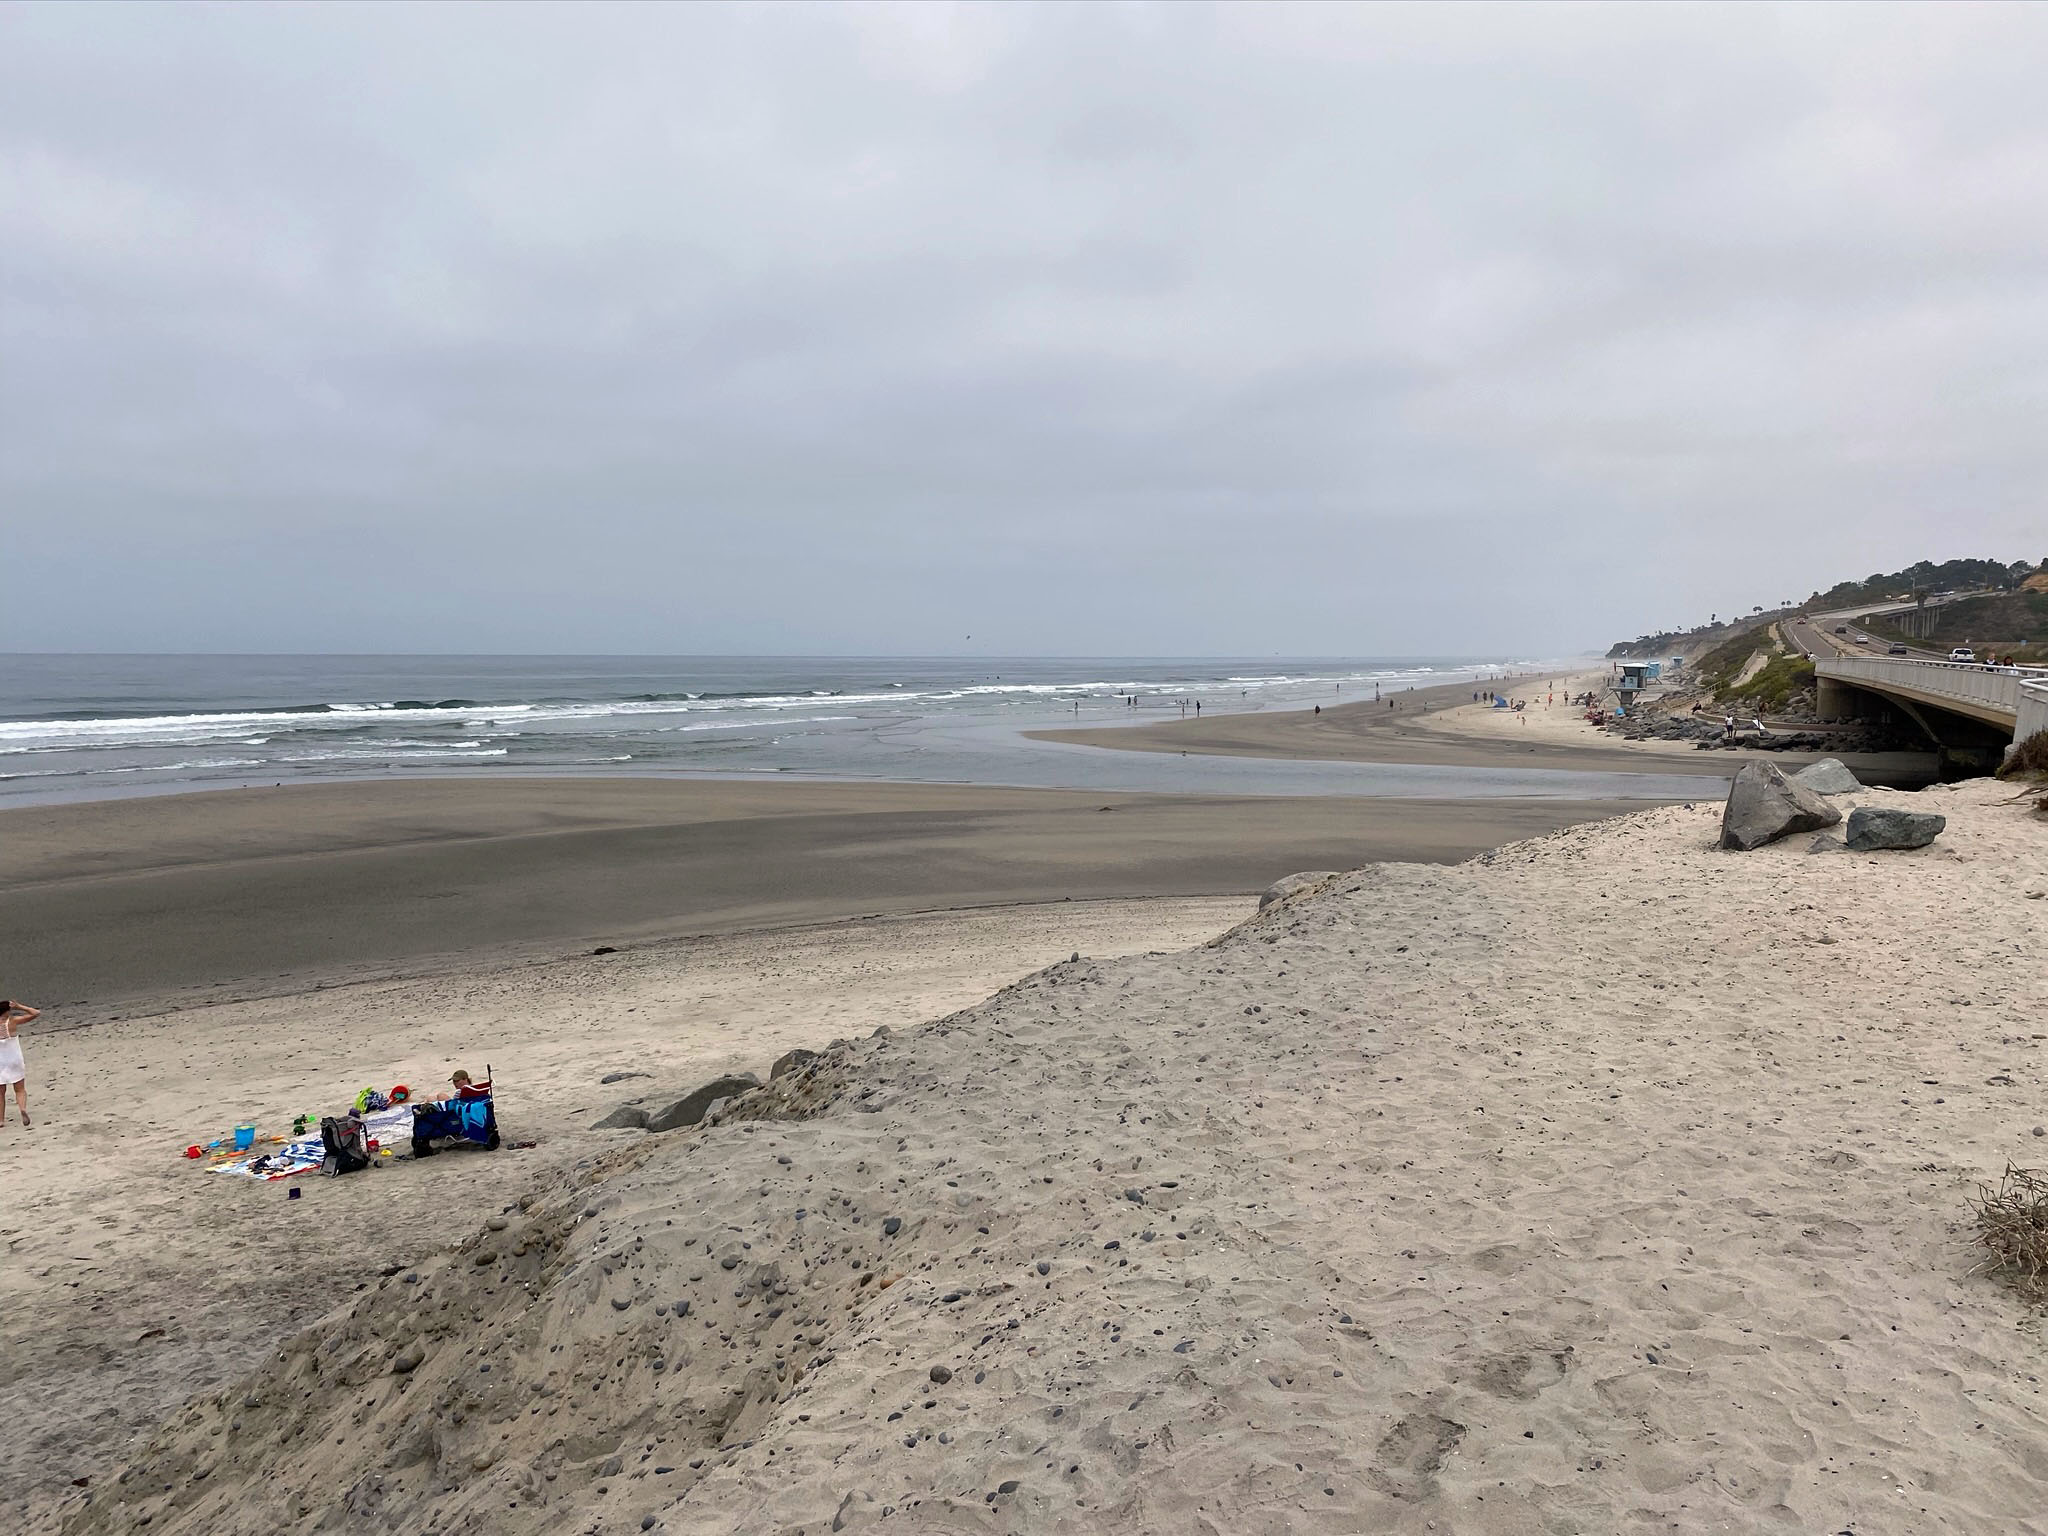
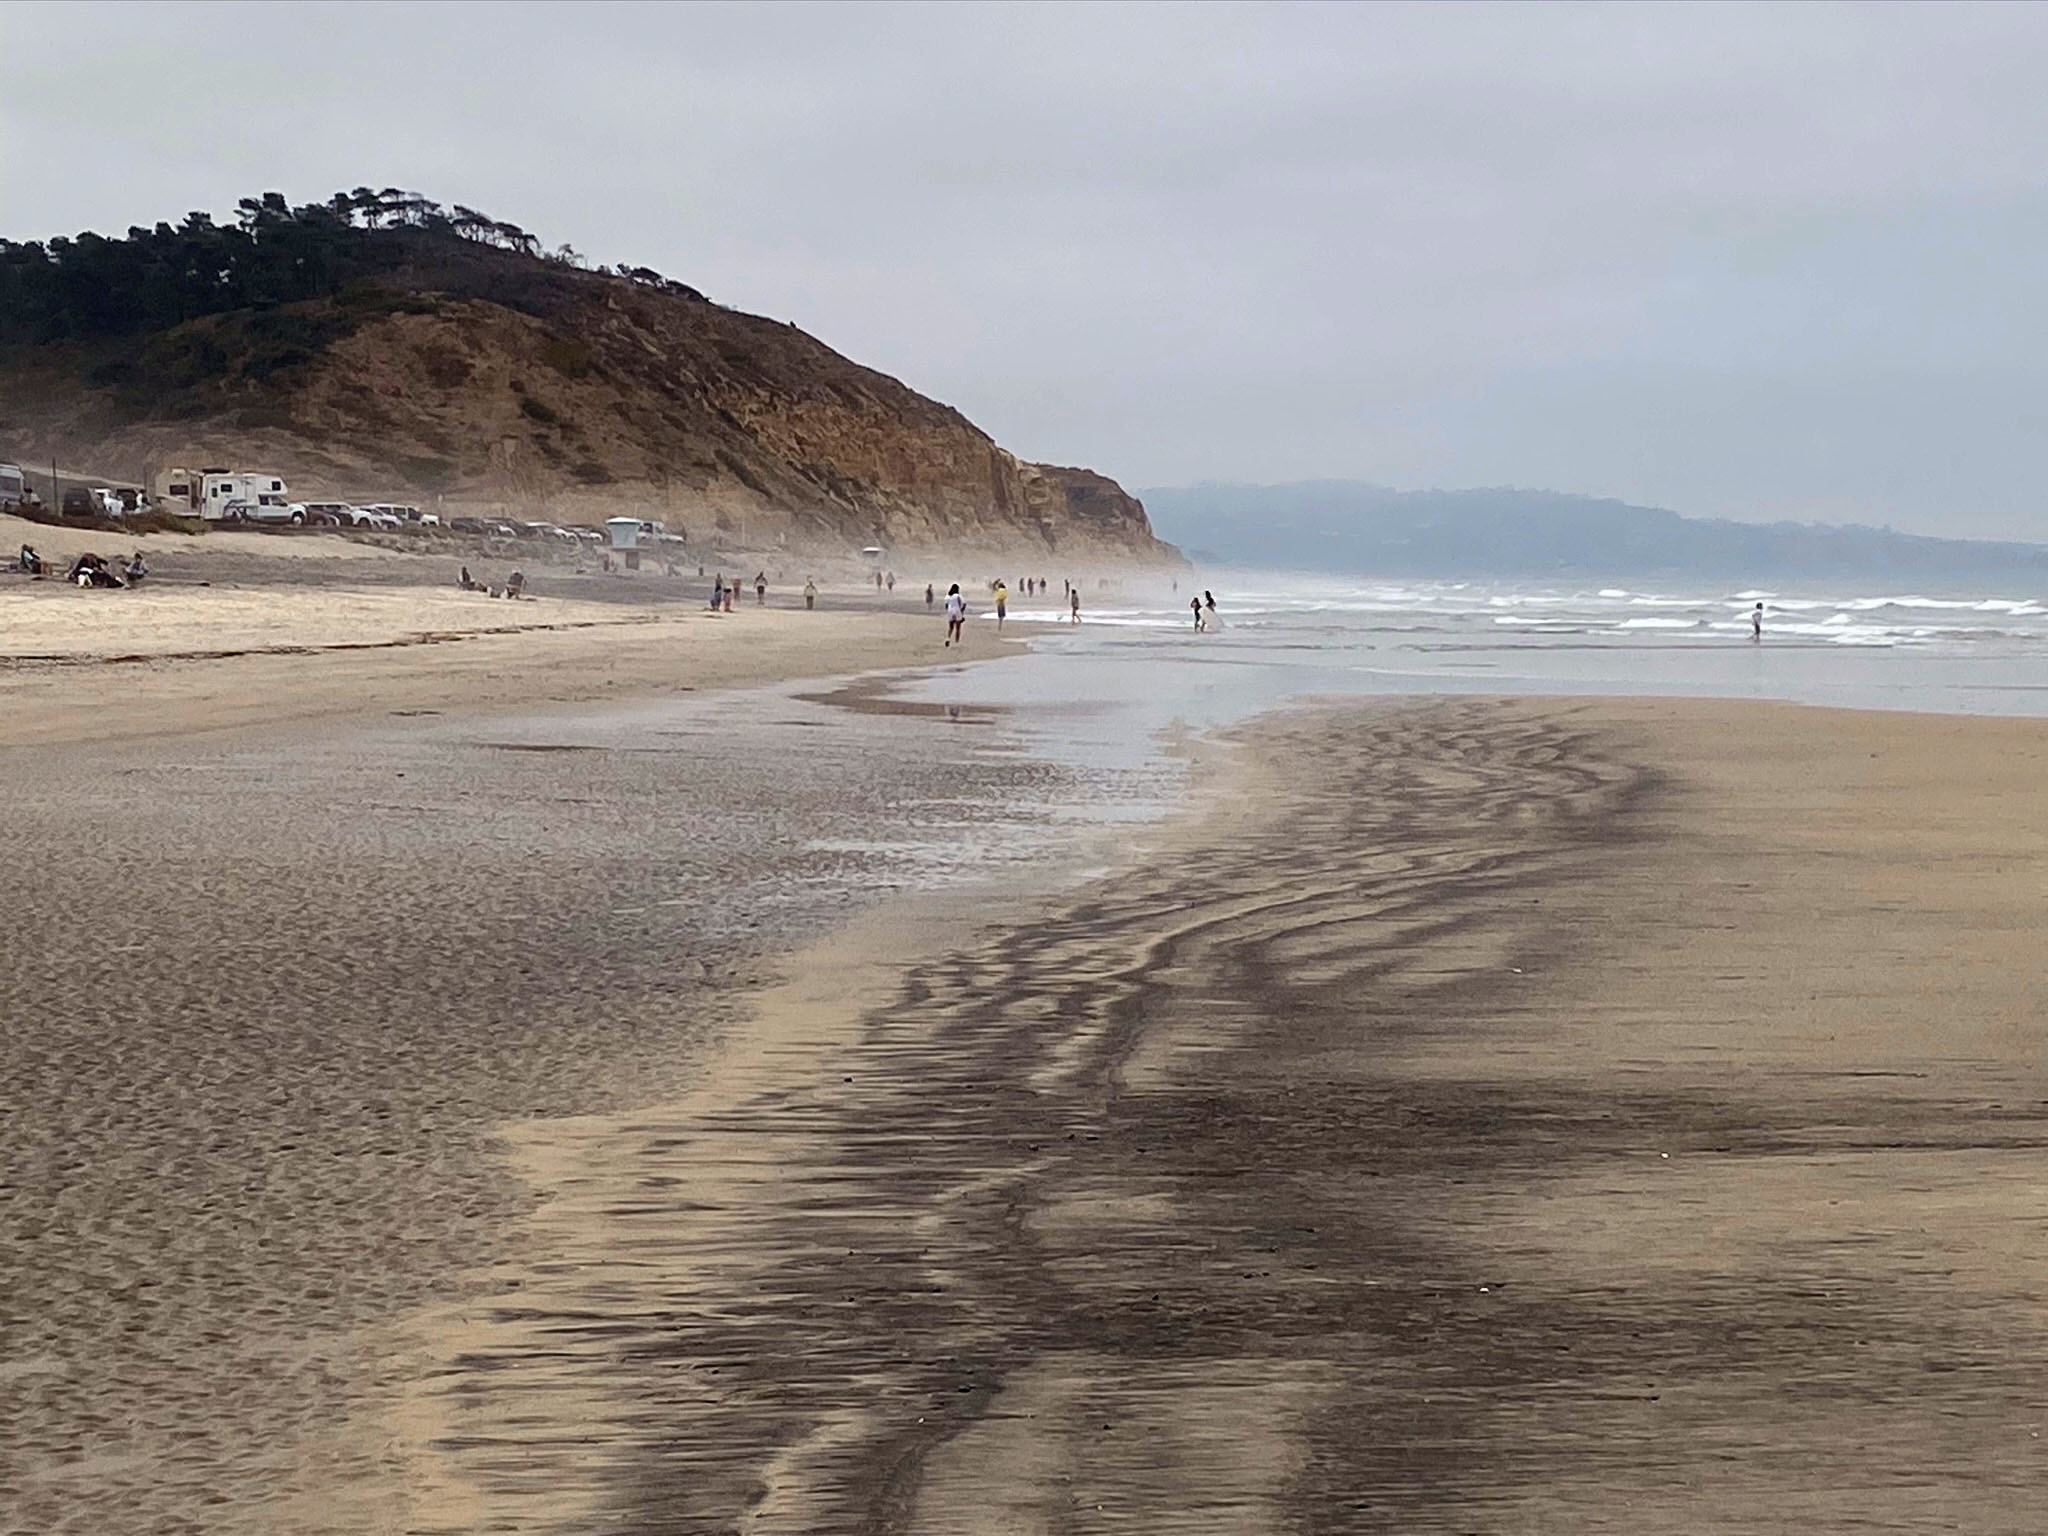
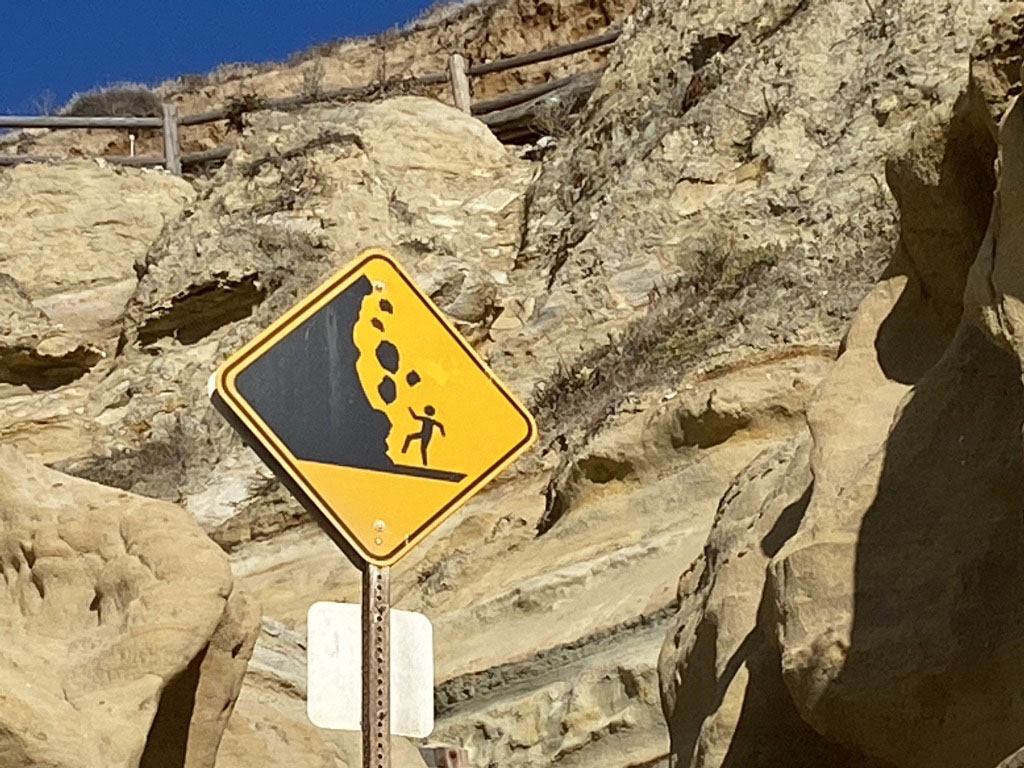
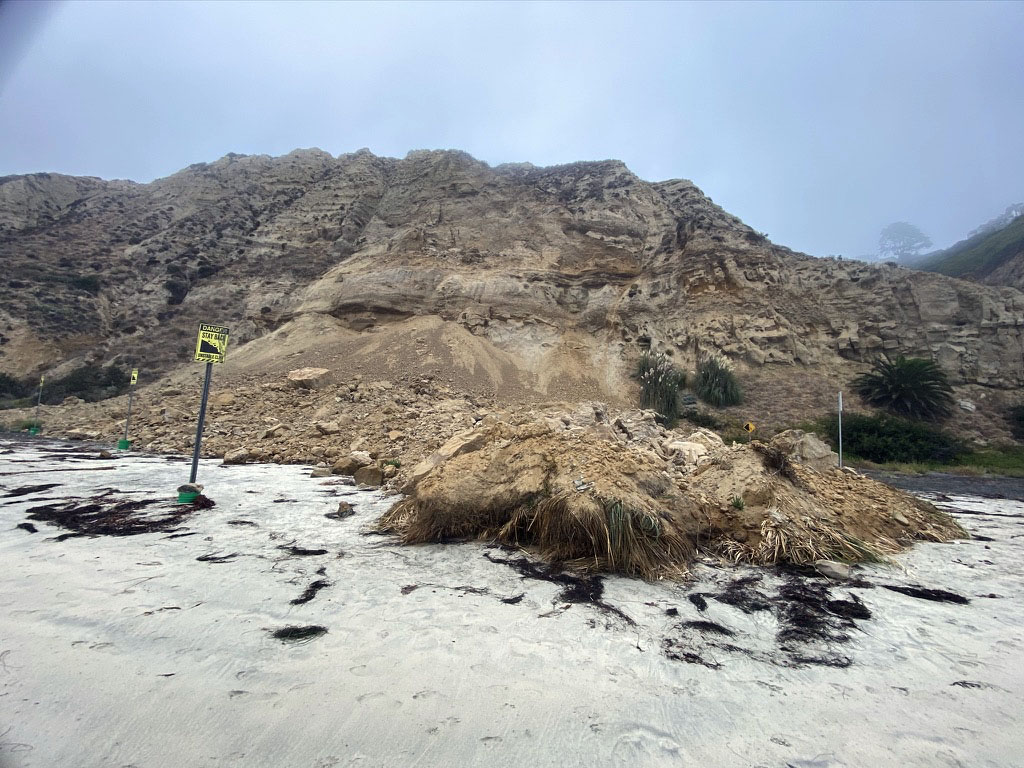
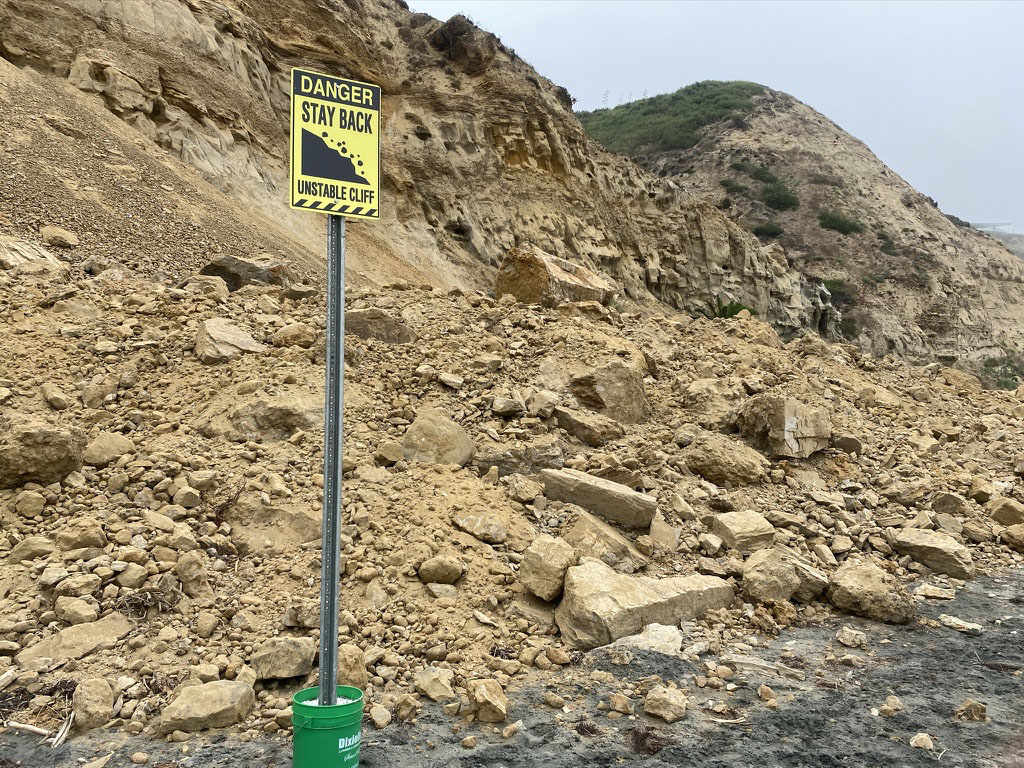
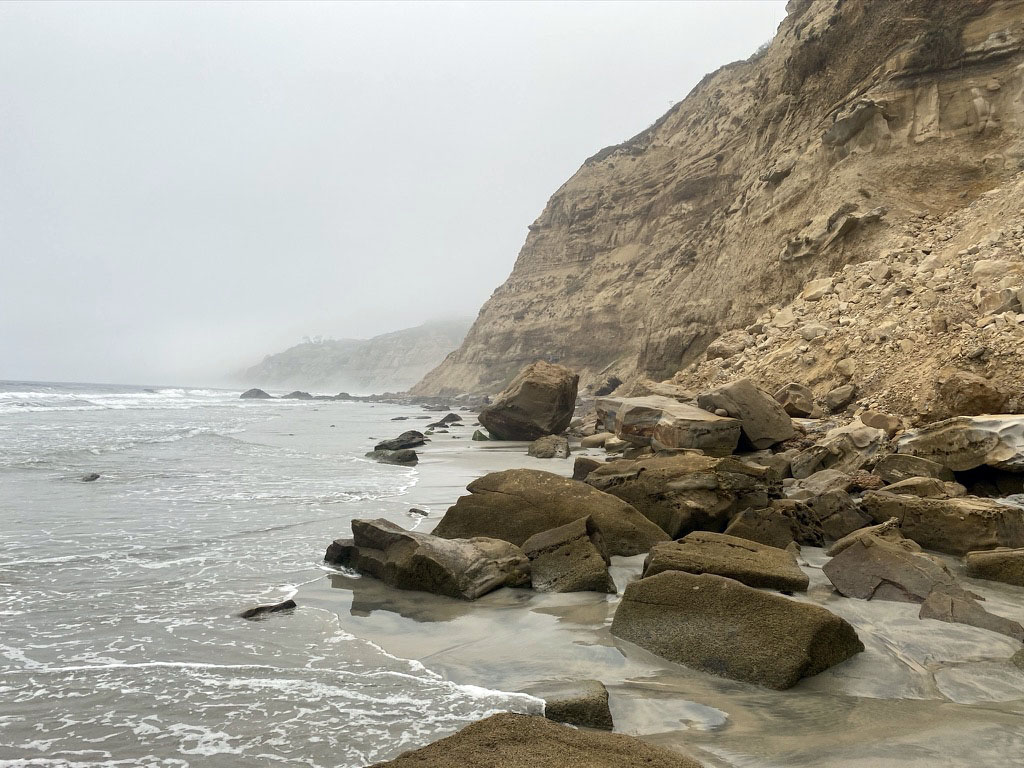
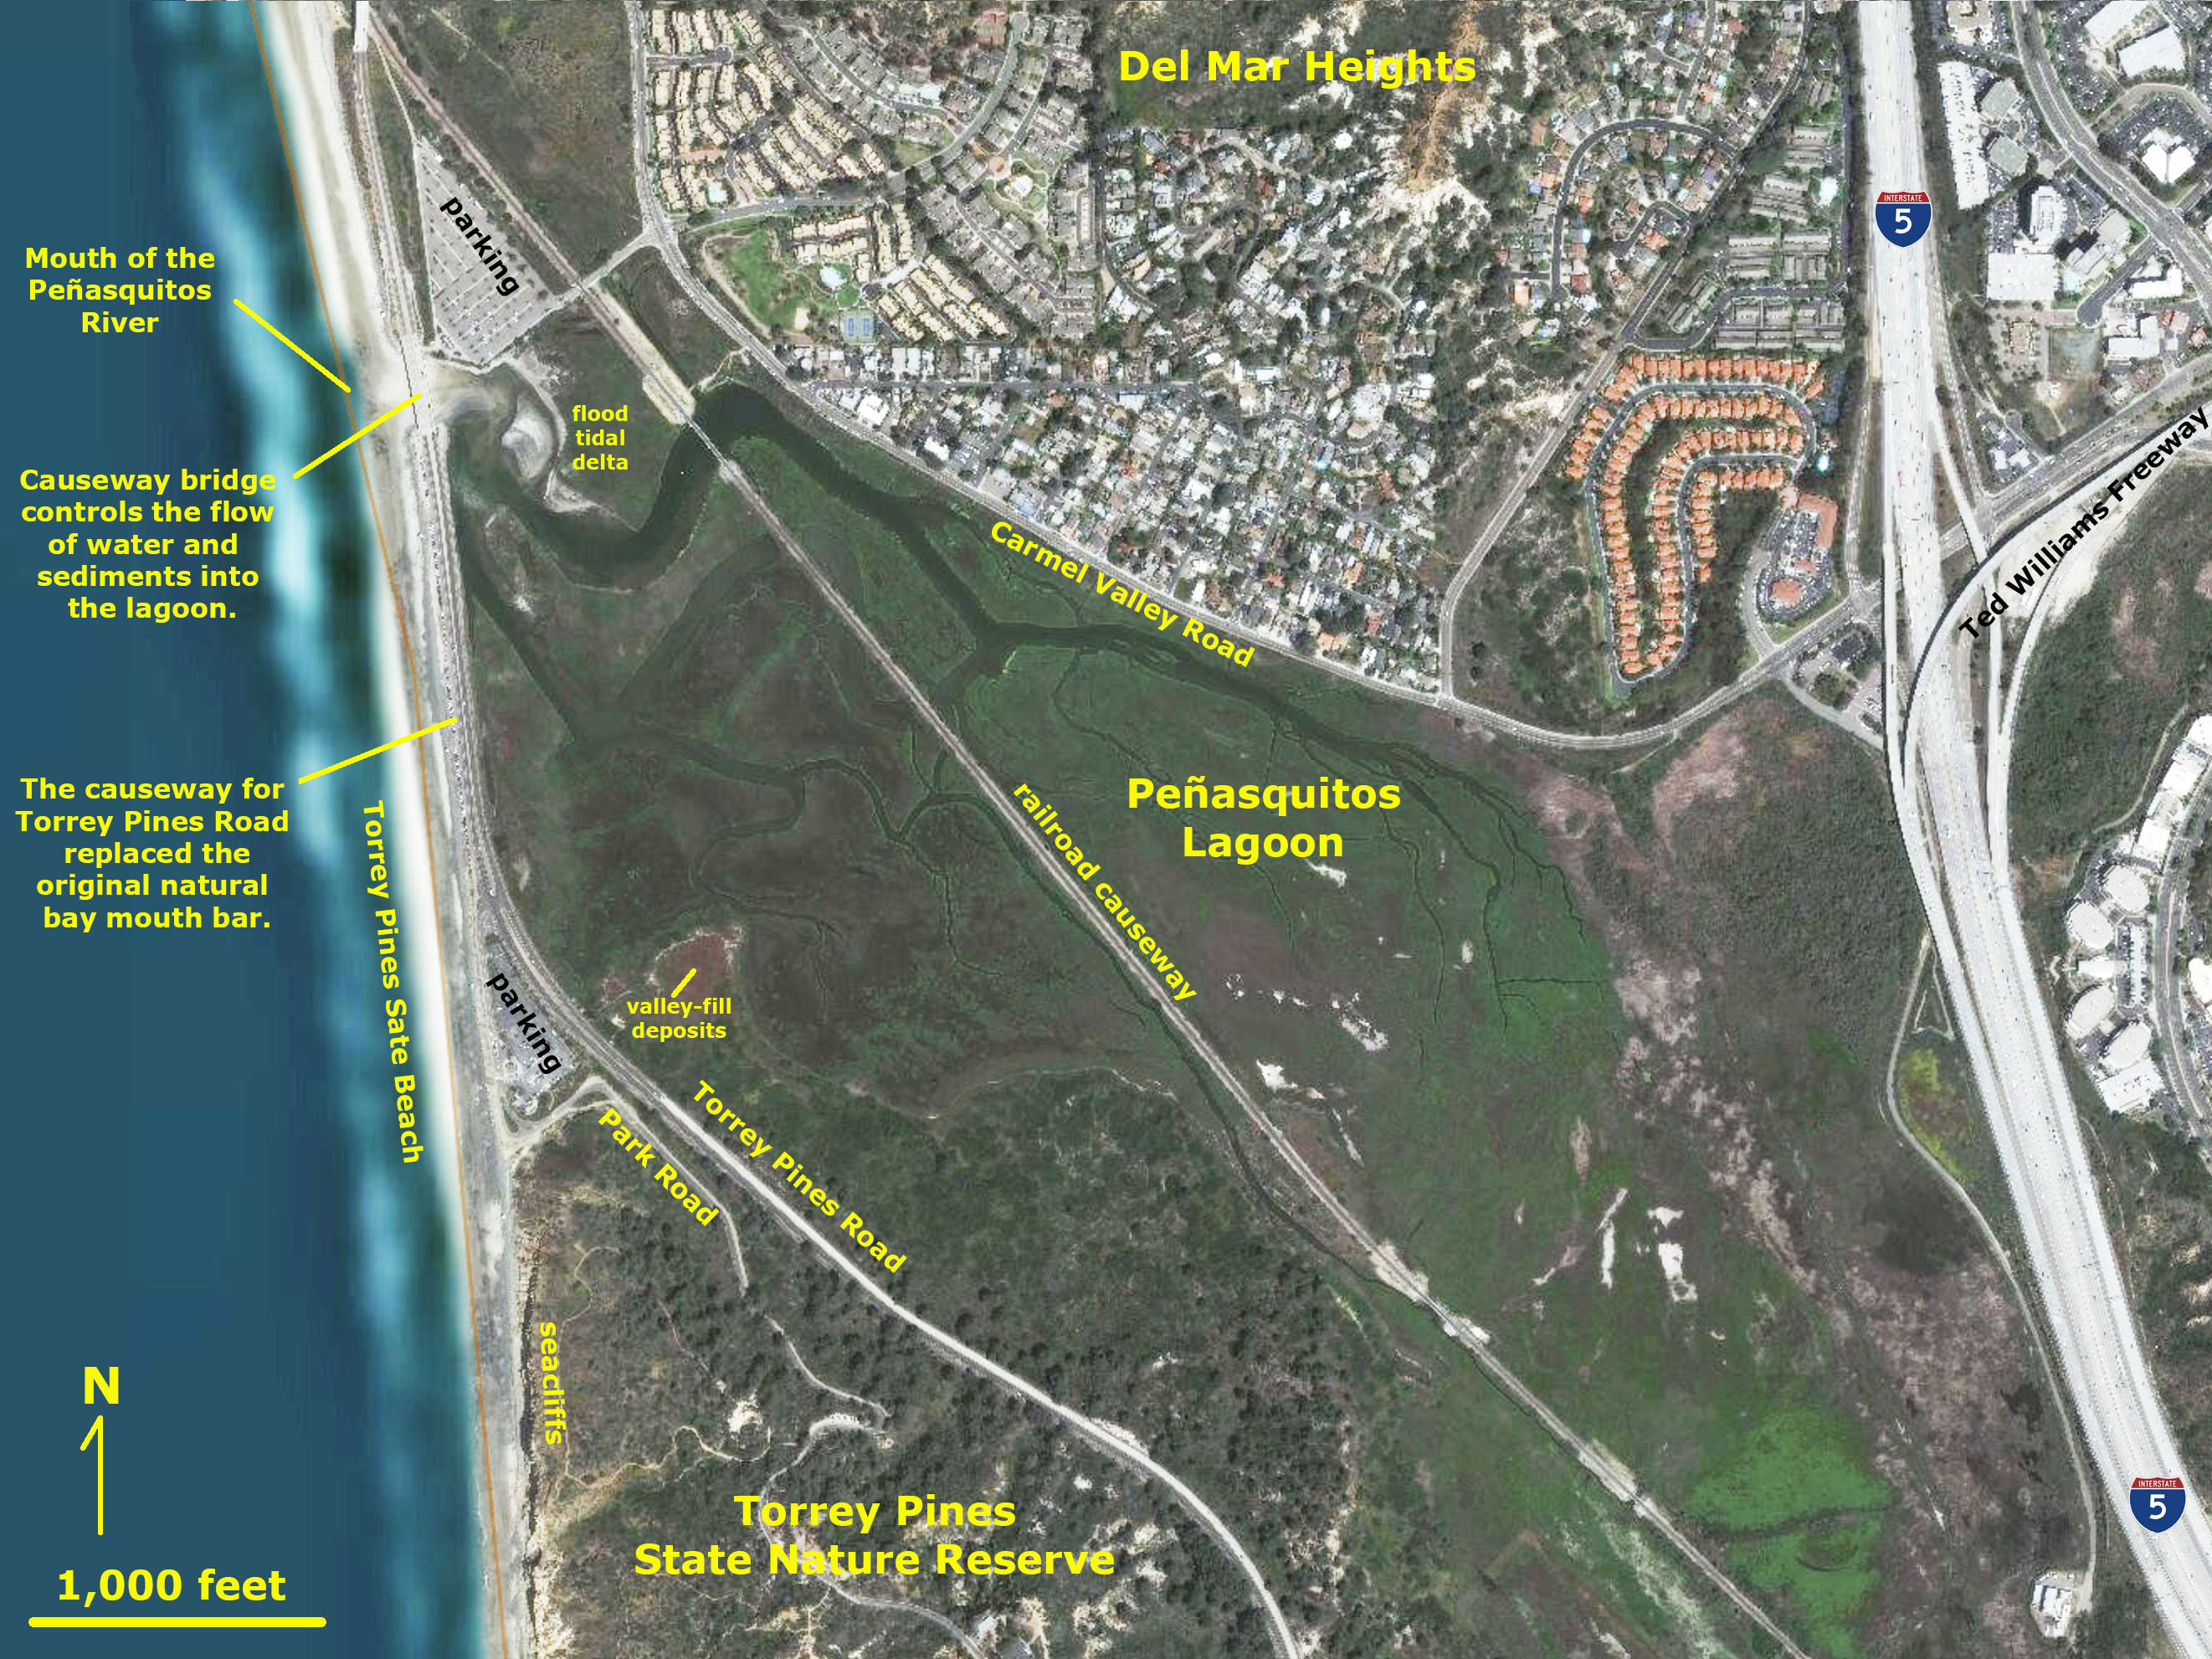
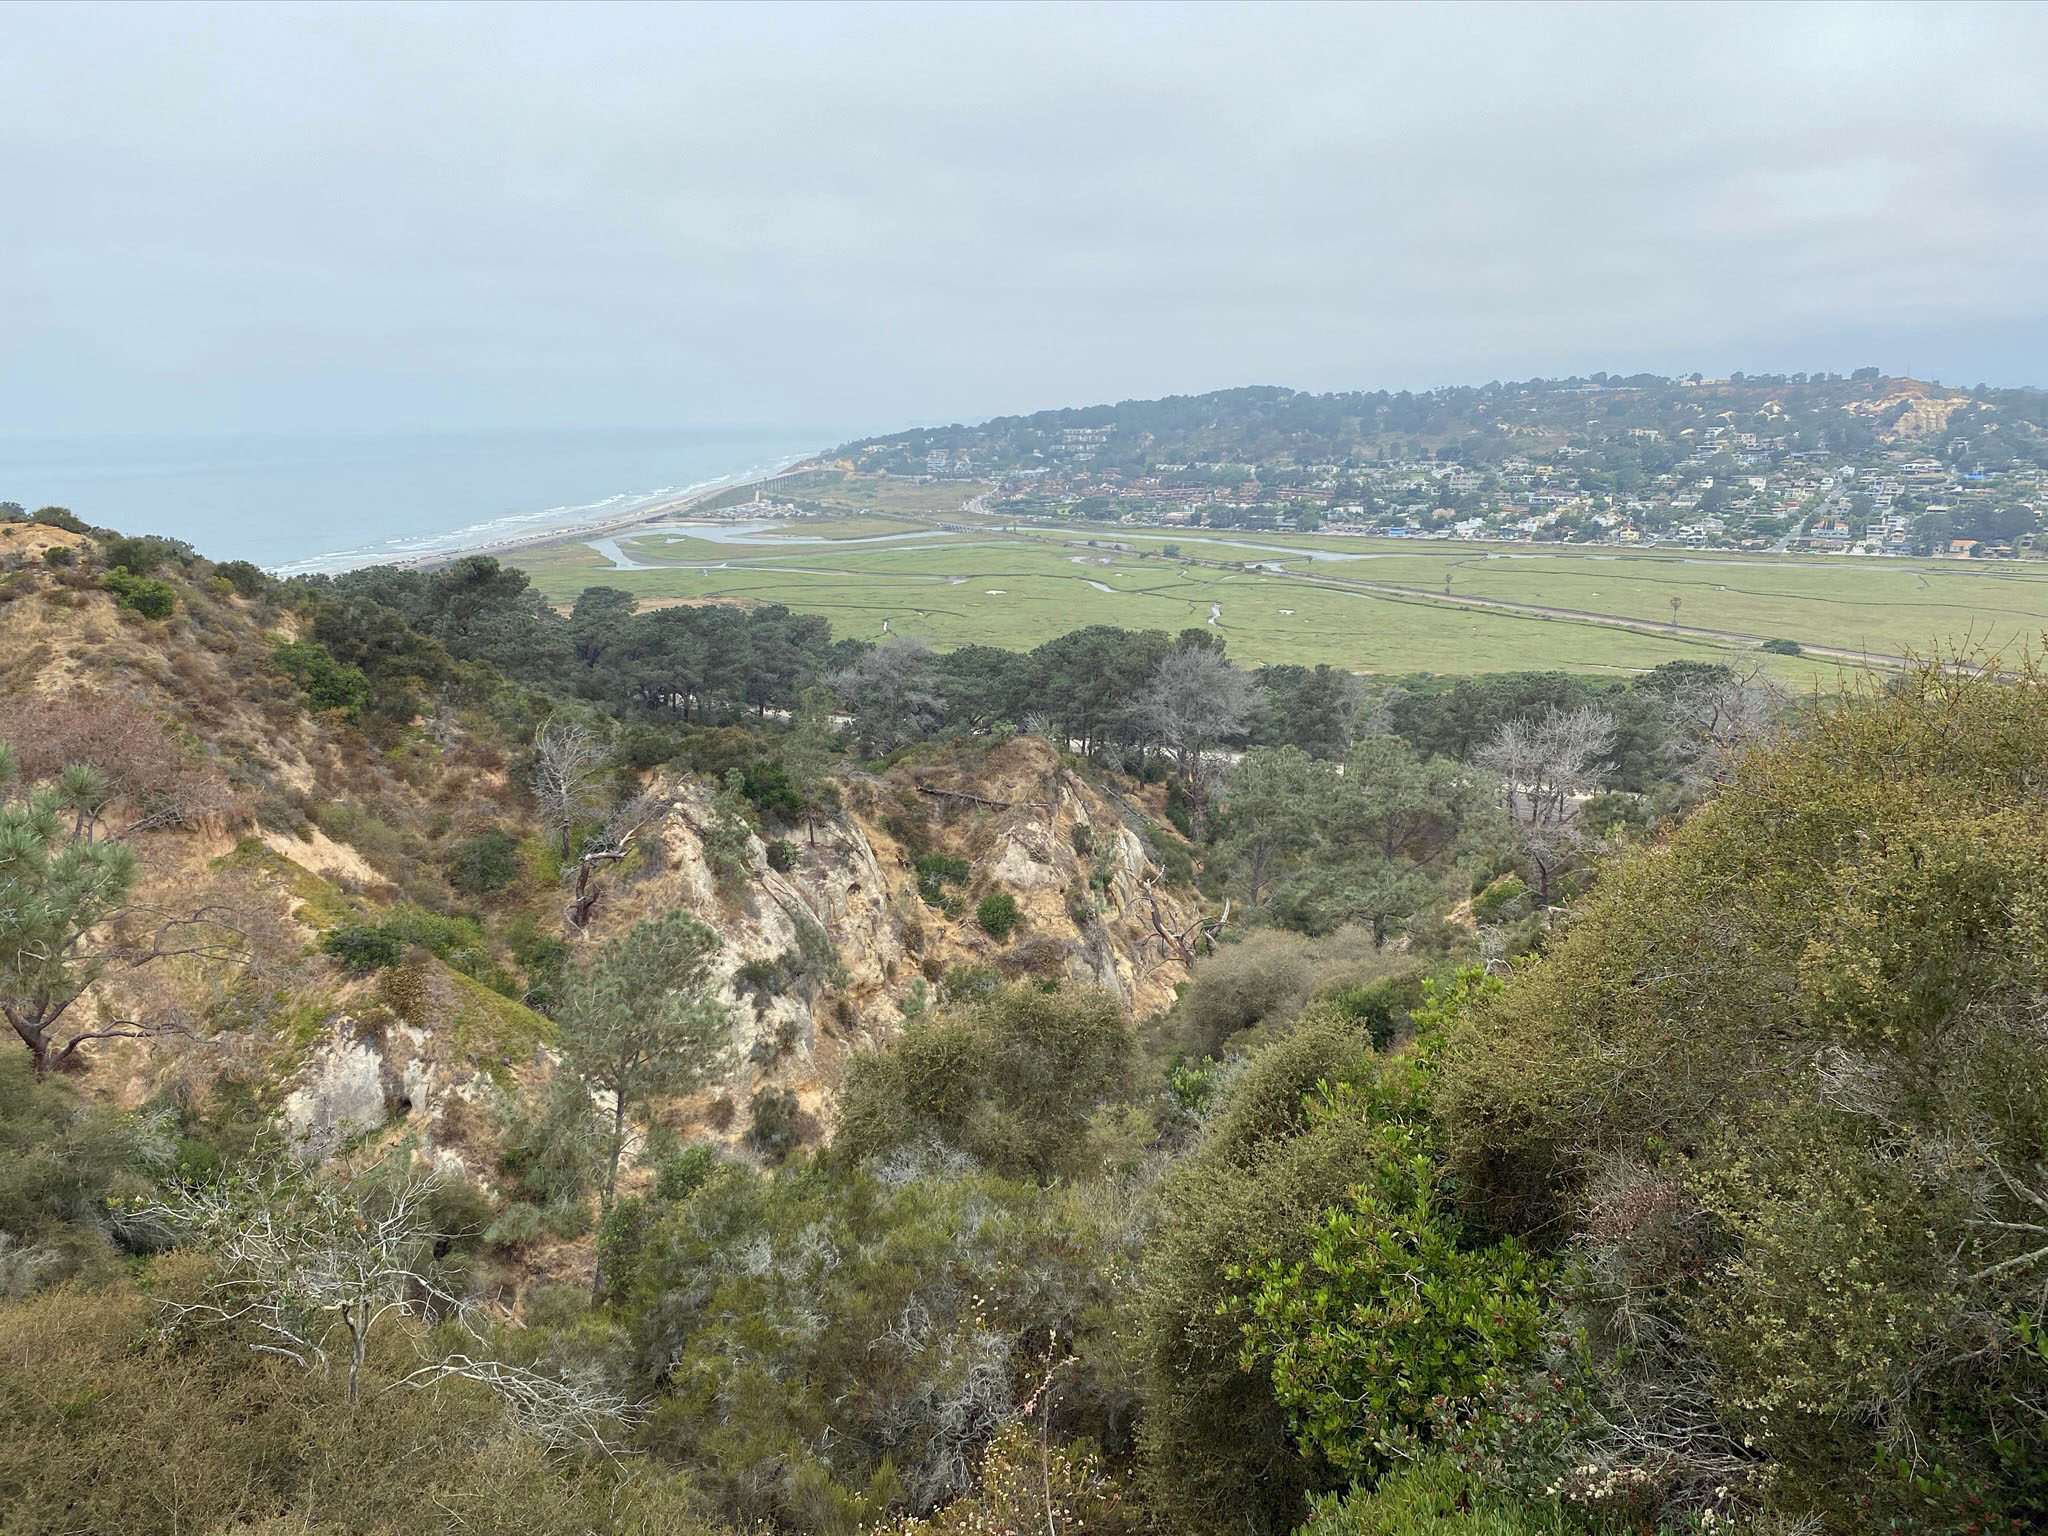
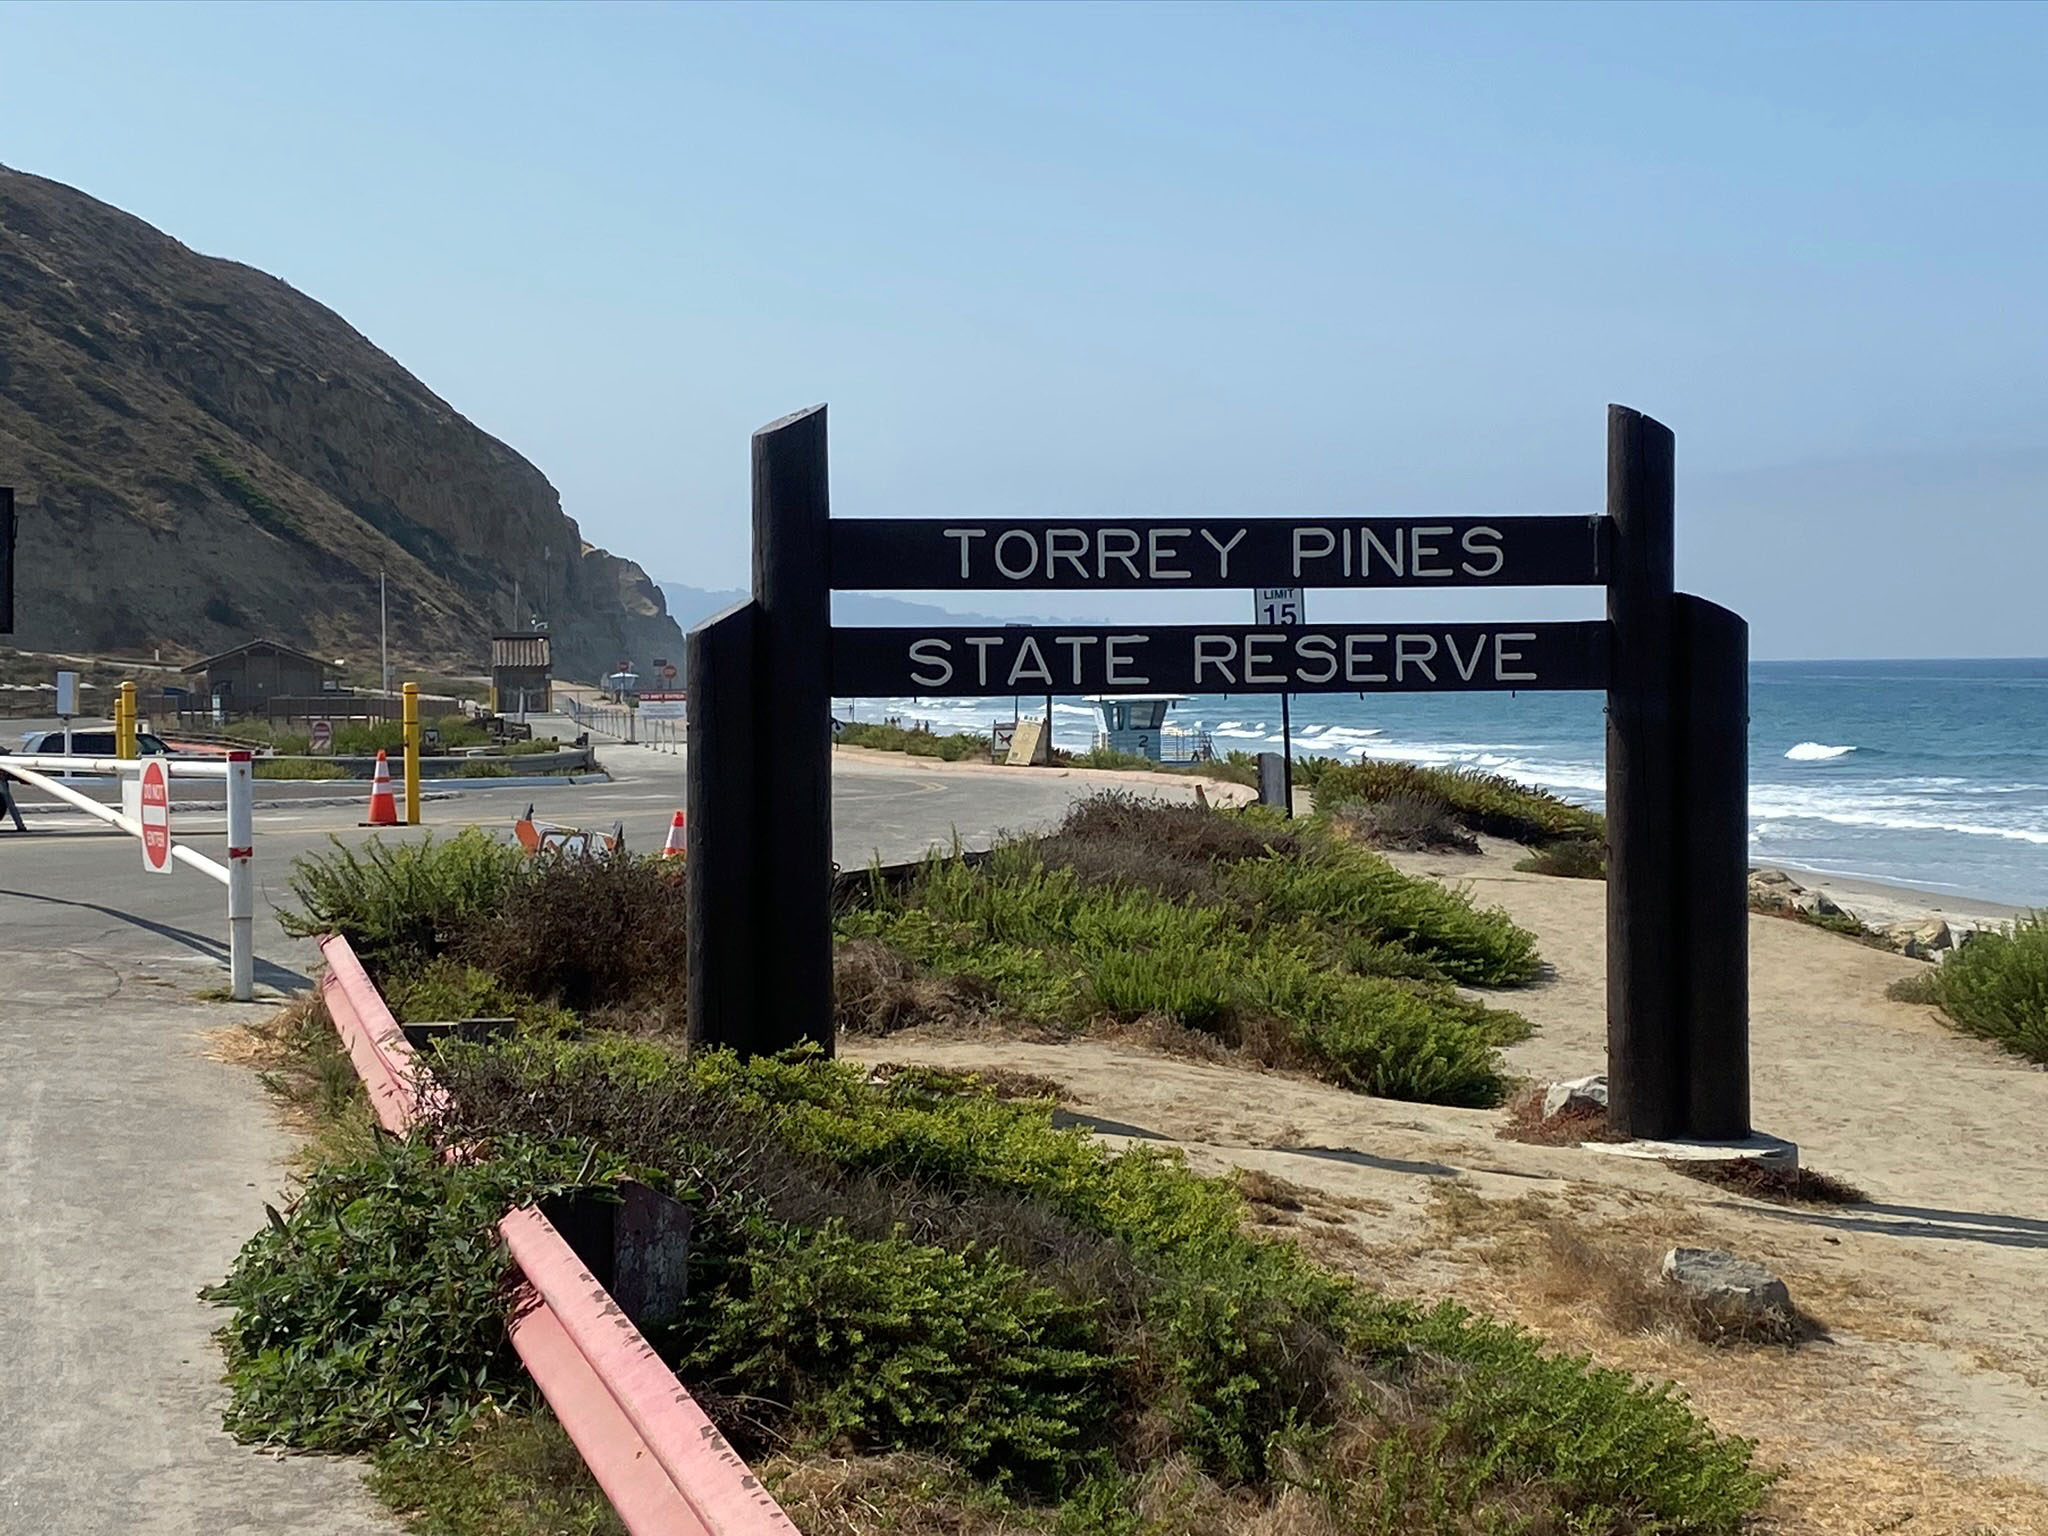
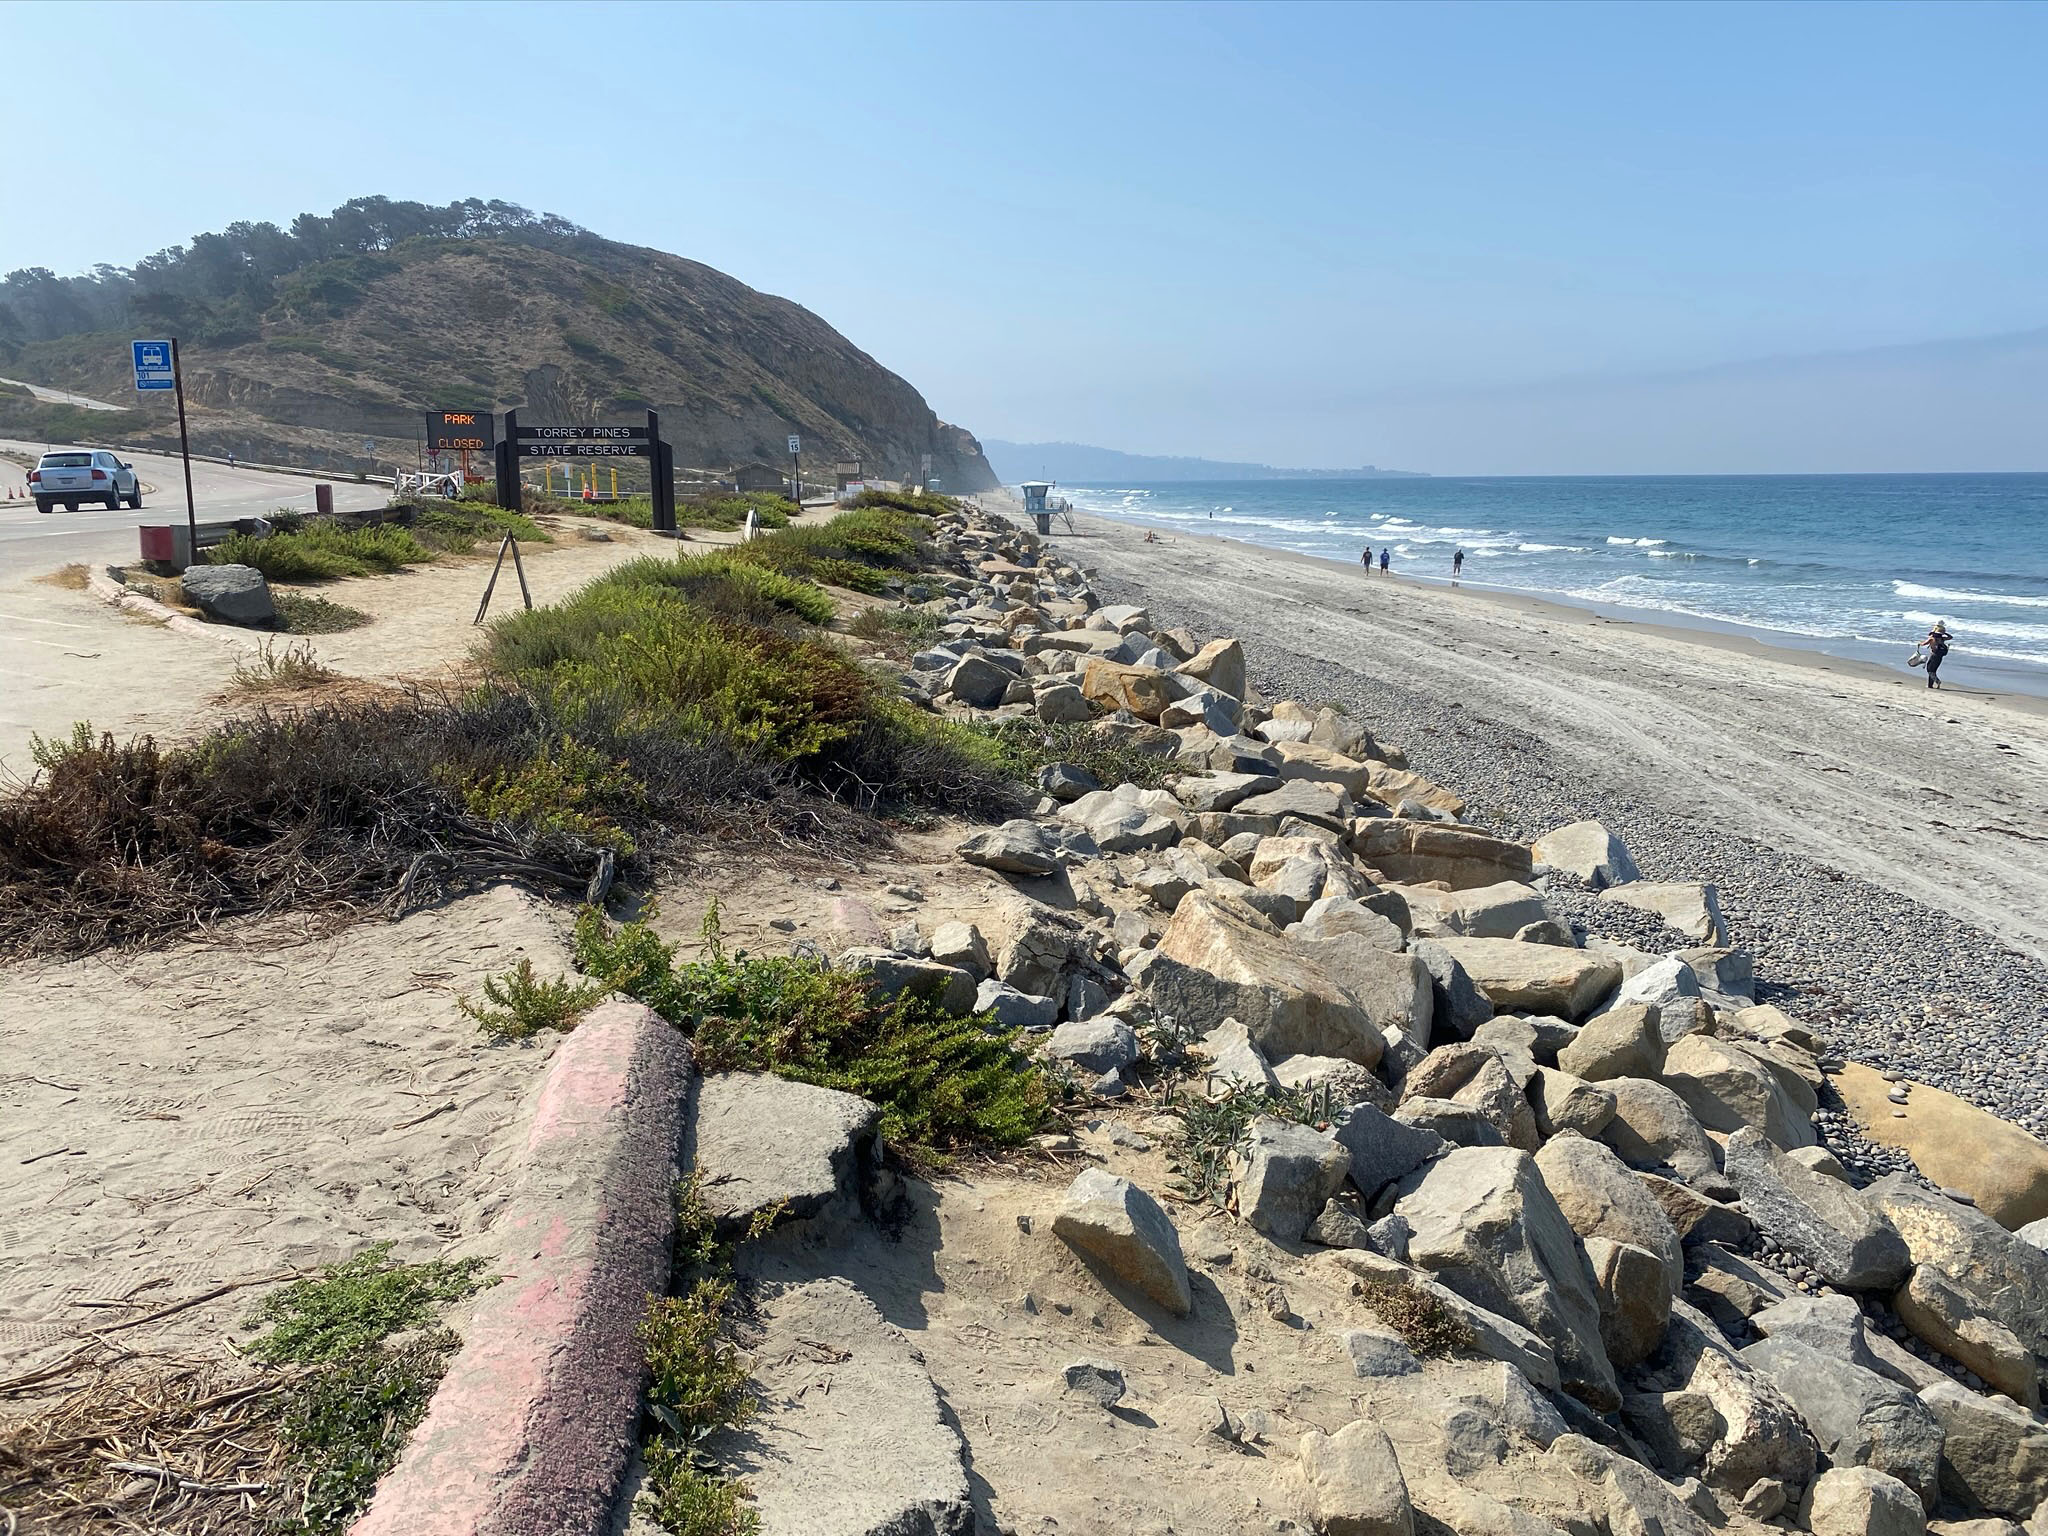
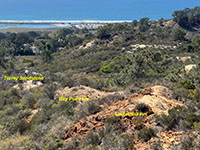
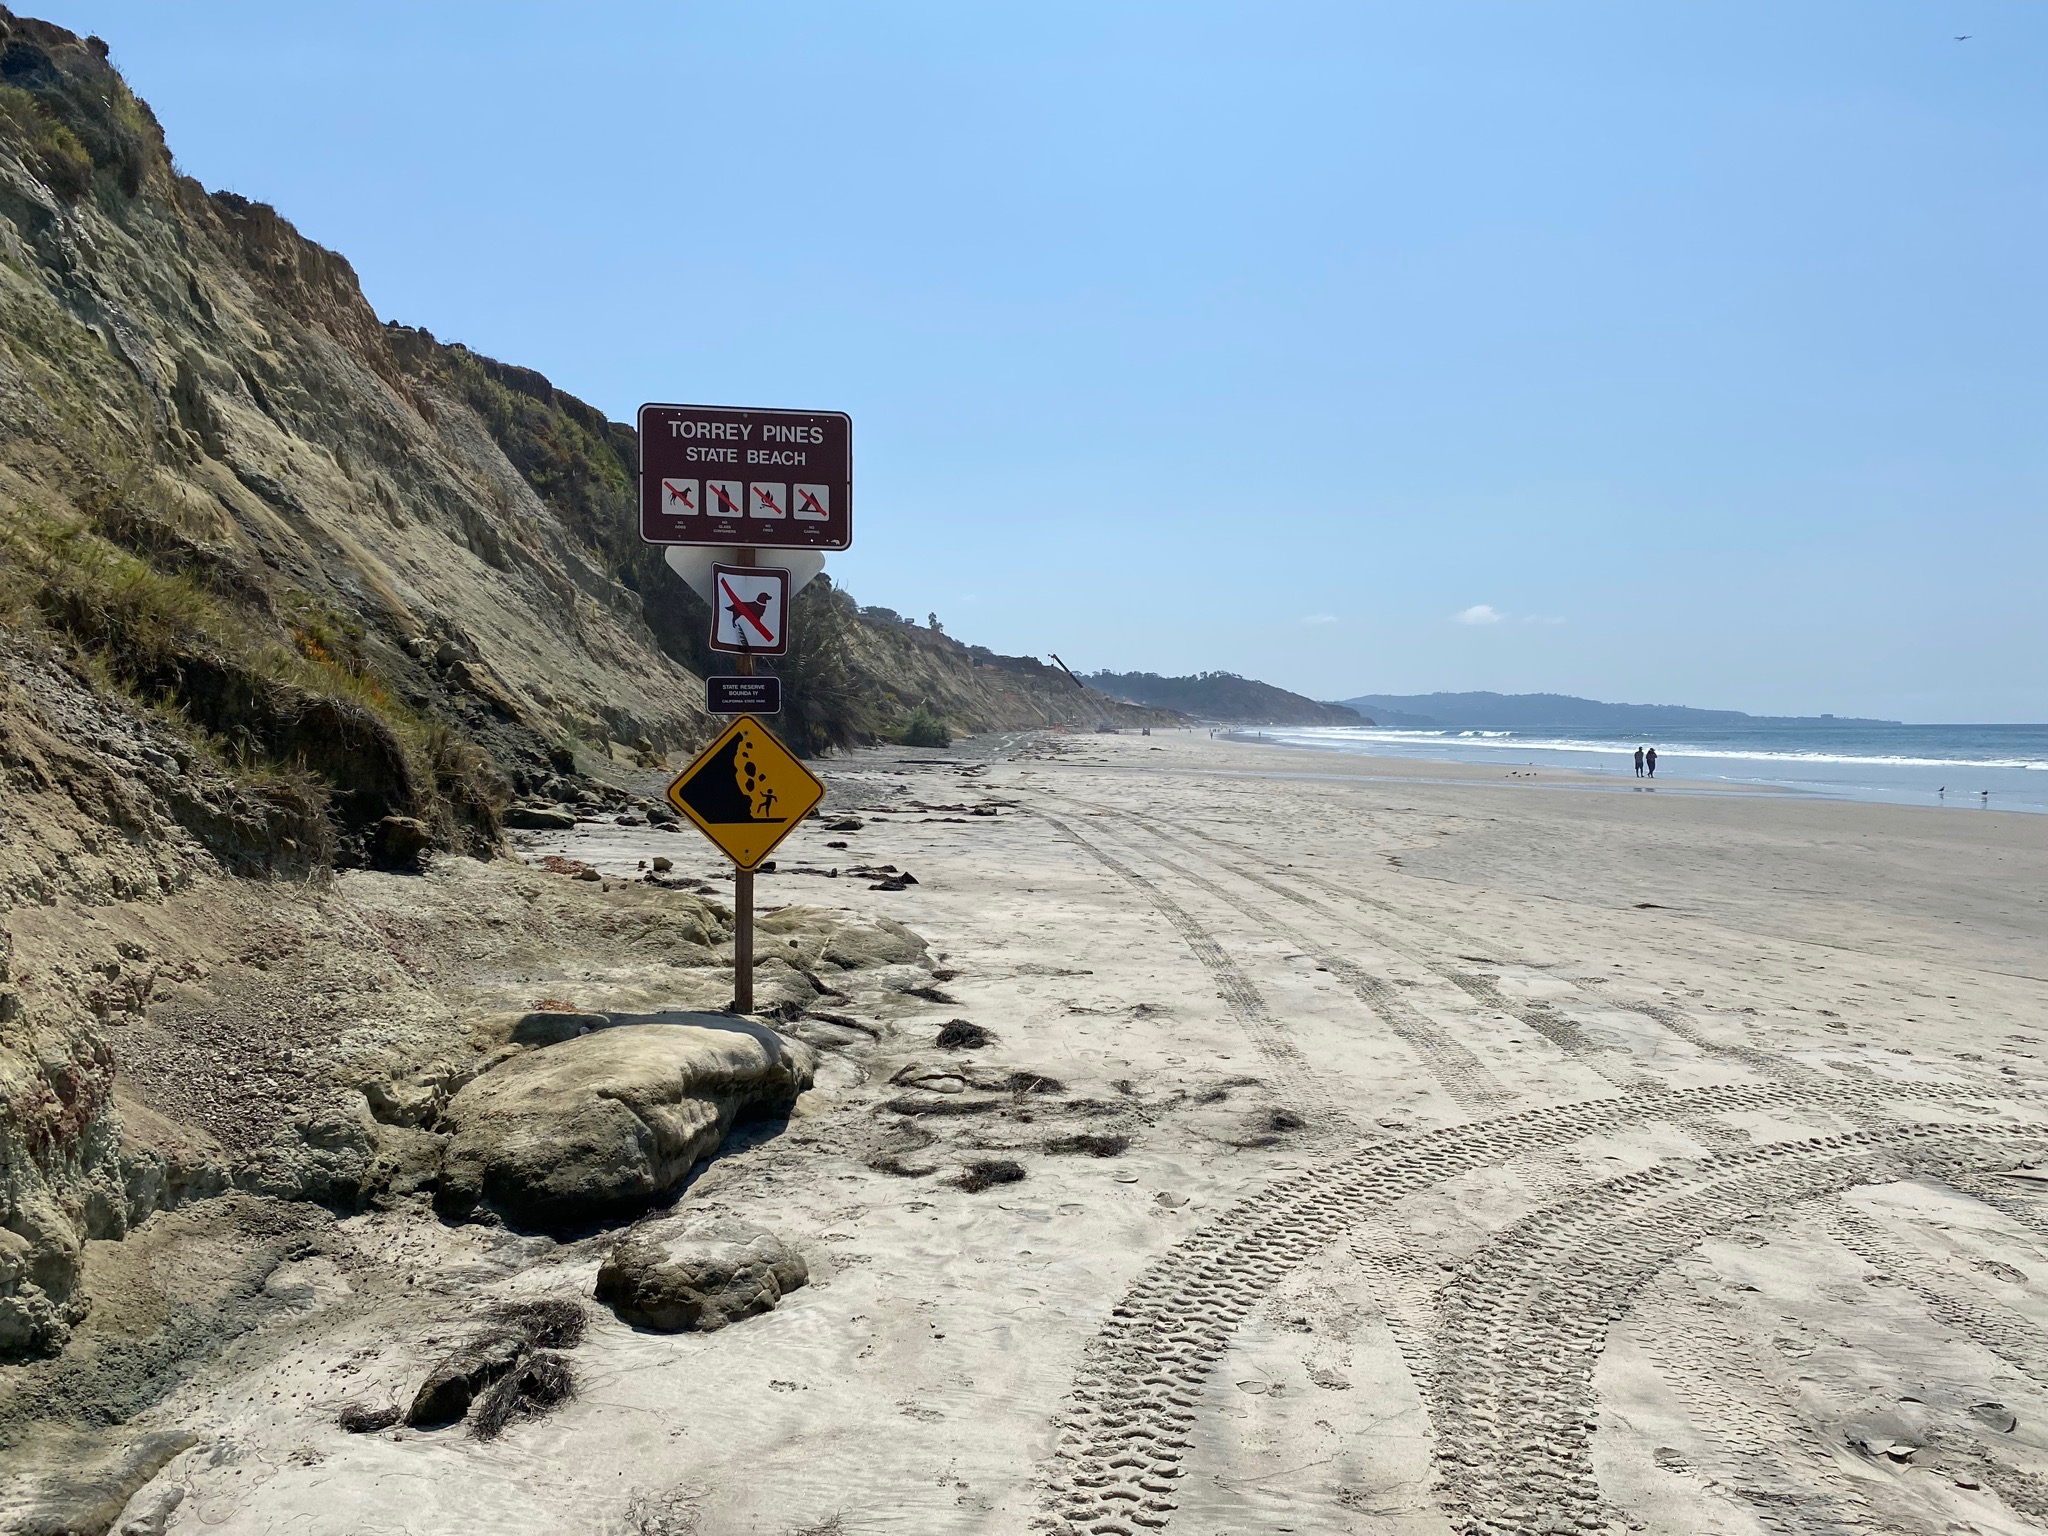
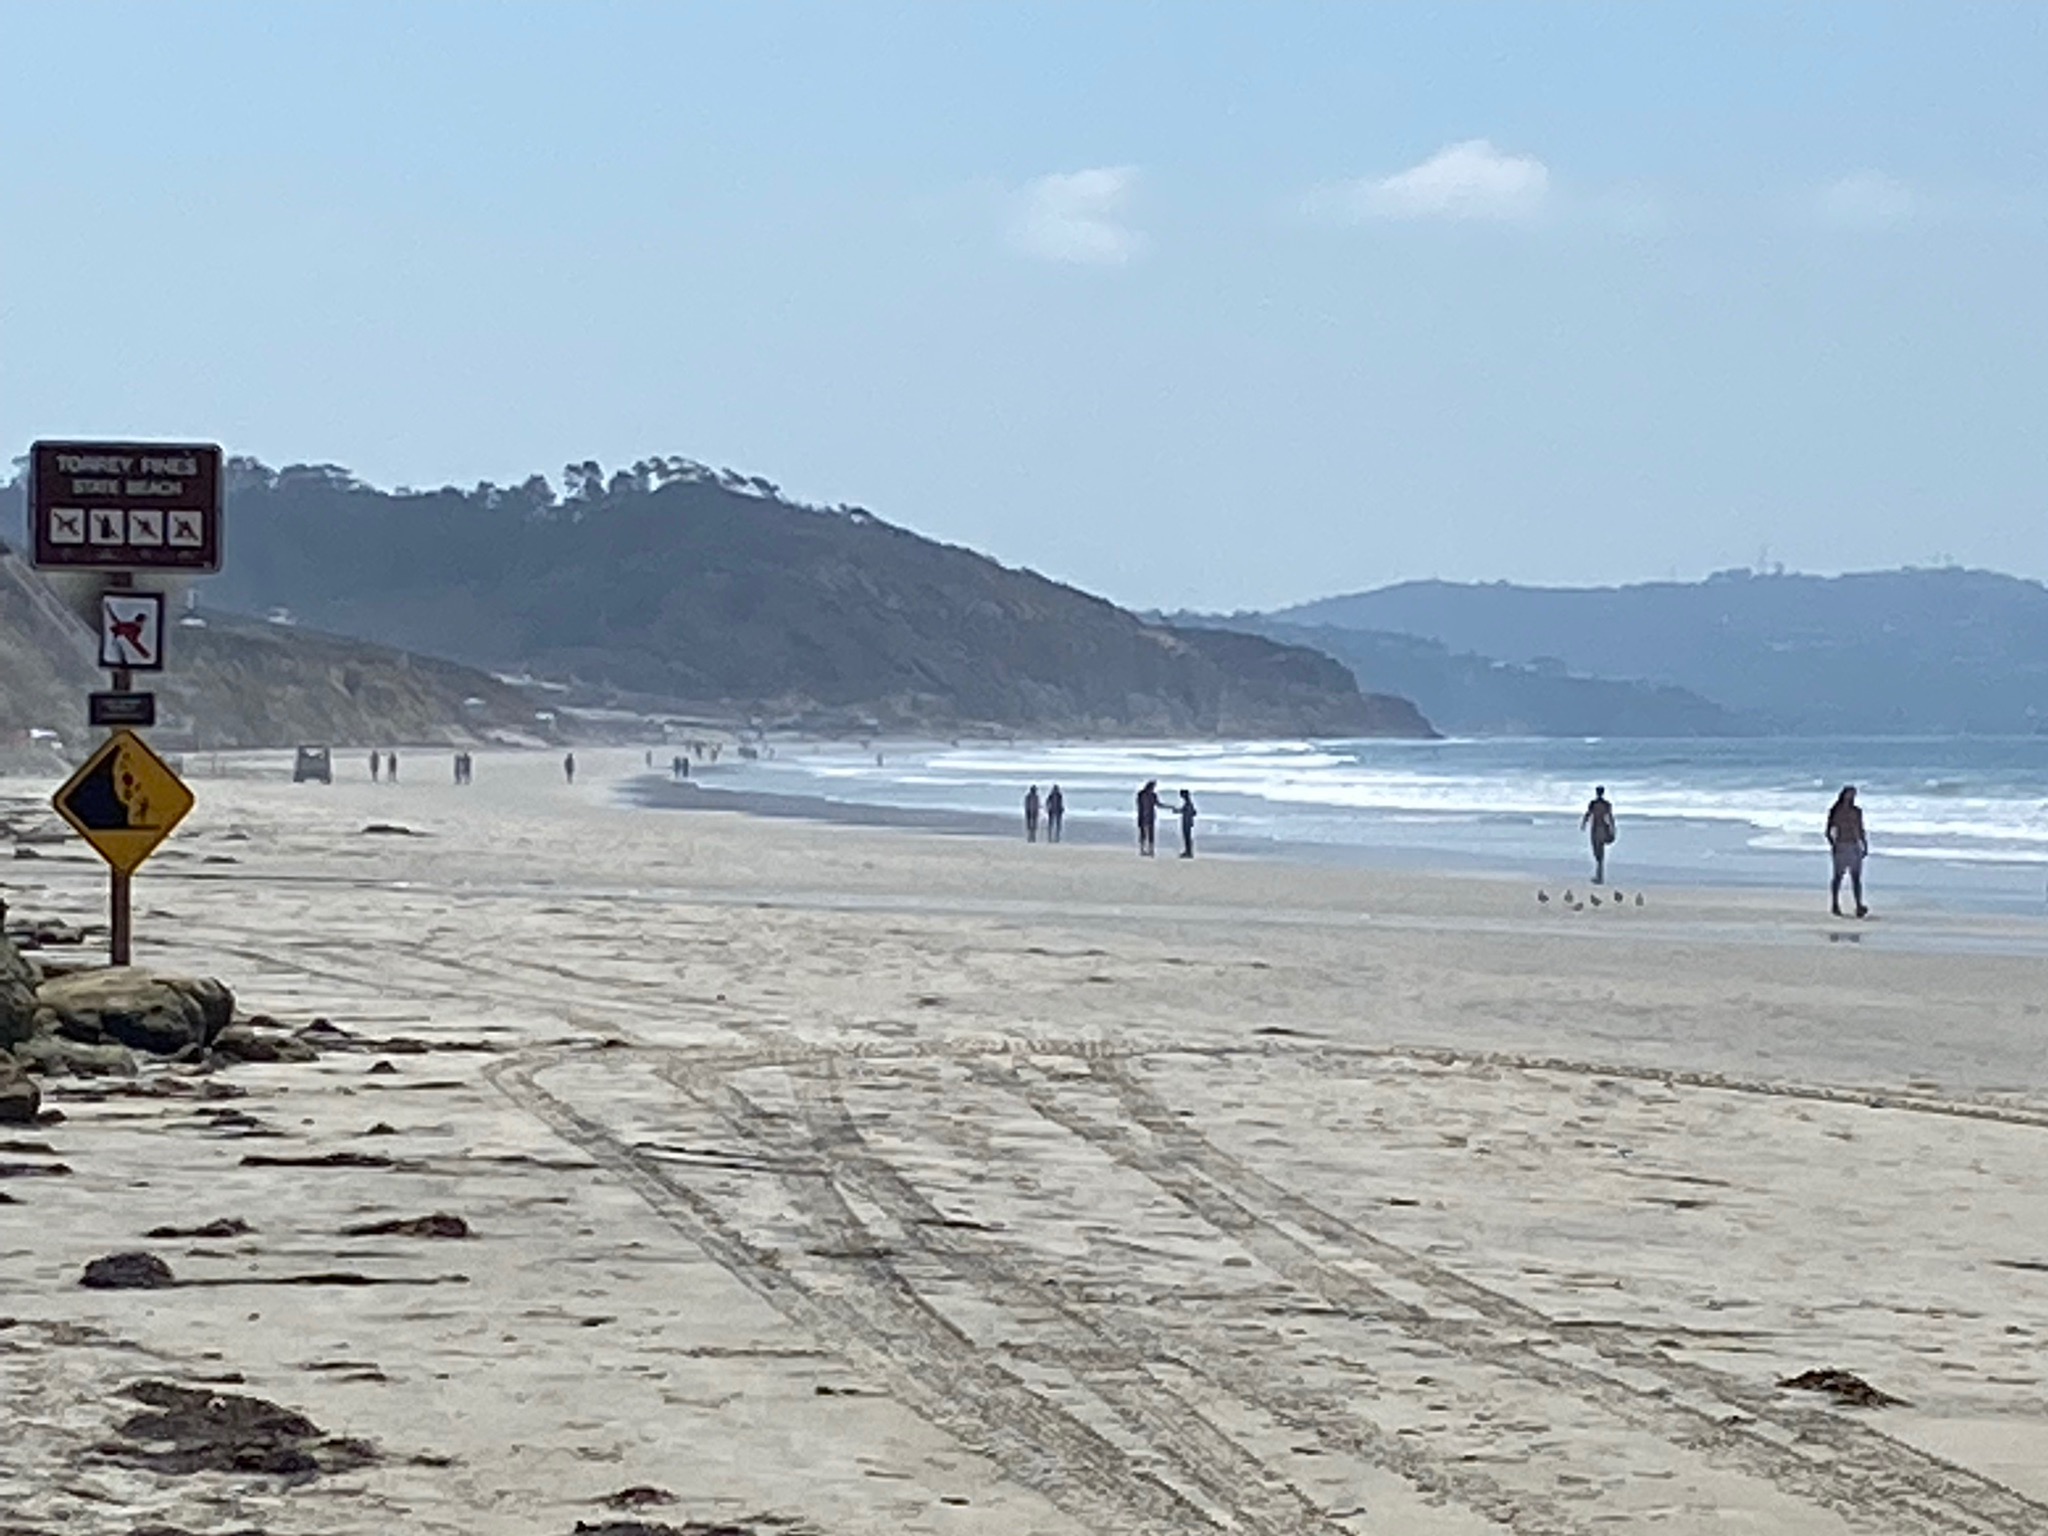
| This presentation is a general overview of the geologic features and processes shaping the landscape in the "Torrey Pines park area." The named areas in discussion include the Torrey Pines State Nature Reserve and Torrey Pines State Beach, and Blacks Beach. Figure 1 is a satellite map of the that Torrey Pines park area. Labeled features are used in the discussions below. In terms of park visitation, the beach area is the destination of most visitors (Figure 2). The beach extends along the Torrey Pines Road causeway and southward along the seacliffs to Blacks Beach and beyond to the La Jolla area. It is important to mention that visitors to the seacliff area is potentially hazardous because of rock falls and is particularly dangerous during high tides with storm wave activity (Figure 3). The upland part of the park is popular for hiking, scenic views, and wildlife observation. The park exists because of the dedicated efforts of many conservation-minded people who worked hard to protect the endangered Torrey Pines and associated coastal shrub plant community (Figure 4). The beach, cliffs and hillsides are host to abundant wildlife: birds, reptiles, mammals, and insects adapted to the seasonably dry summers and cool, moist winters. Yes, be aware or rattlesnakes (Figure 5). They are generally docile and will try to avoid you. Visit the Torrey Pines Association website for park information, rules, trail maps, history, and details of about the park area wildlife and ecology. |
Click on images for a larger view. |
 Fig. 1. Satellite features map of the Torrey Pines park area. |
|
|


Geology of the Torrey Pines Area |
|
| Figure 6 is a generalized geologic map of the region that includes the Torrey Pines park area. The colors on the map show the locations where bedrock of different ages and compositions exist at or near the surface. The location of faults, both onshore and offshore (including earthquake faults) and other topographic and bathymetric features are included on the map. Note that the Torrey Pines park area is only a small fraction of the map along the coast in the vicinity between Solana Beach and Dike Rock (show on the map). More detailed information is presented below in a general chronology starting from the oldest rocks to the modern features and processes currently shaping the landscape. Much of the discussion below focuses on stratigraphy. Stratigraphy is the branch of geology concerned with the study of rock layers (strata) and layering (stratification). All of the rock layers in the Torrey Pines park area are sedimentary in origin, made up of fragments of older rocks—weathered, eroded, and deposited as gravel, sand, silt, and clays. The sedimentary layers exposed in the seacliffs and throughout the reserve are divided into named rock formations. To be designated as a rock formation they must be different enough from each other to be visually told apart and are big enough to be differentiated on a geologic map. |
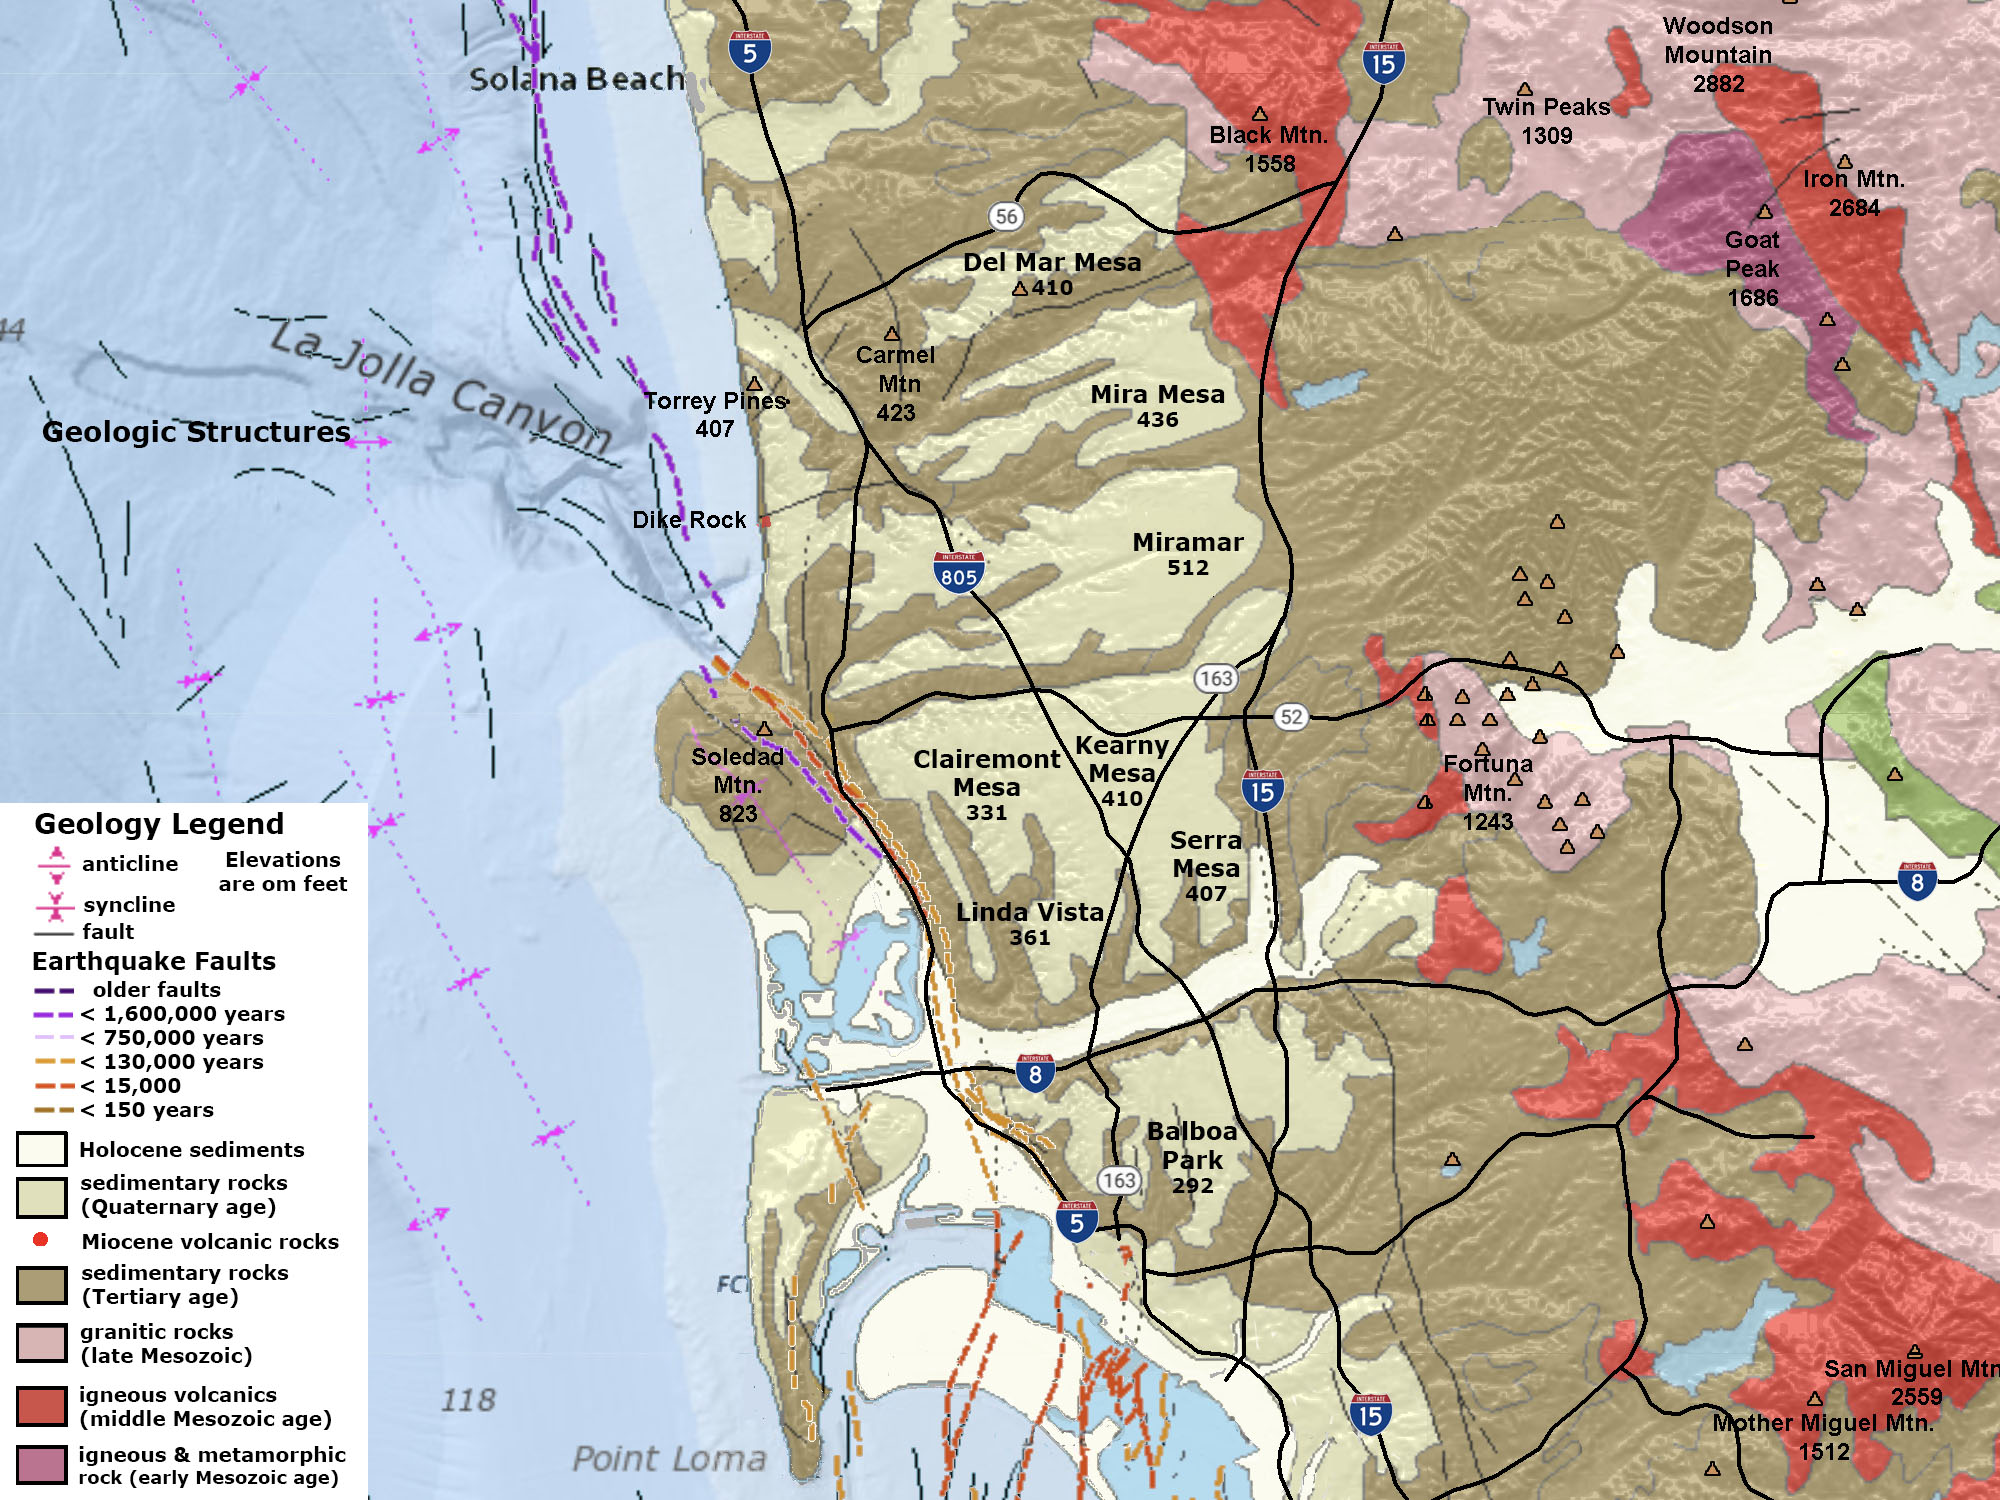 Fig. 6. Generalized geologic map of the Torrey Pines region. |
Rock Formations Exposed In The Torrey Pines Area |
Figure 7 is a generalized summary of the rock formations (stratigraphy) exposed in the Torrey Pines park area. Starting with the oldest layers exposed, these included:
The Delmar Formation, Torrey Sandstone, Ardath Formation and Scripps Formation are all middle Eocene age (around 49 to 45 million years old). These rock formations are part of a much larger package of Eocene age rock formations in the coastal San Diego region collectively designated as the La Jolla Group. Figure 8 illustrates the general depositional environments where the sediments of these rock formations accumulated. In contrast, the Lindavista Formation and Bay Point Formation are very young (geologically speaking—having been deposited under very different circumstances during periods of changing sea levels throughout the ice ages of the Pleistocene Epoch). The Lindavista Formation is middle Pleistocene (roughly 0.7 to 1.0 million years old), and the Bay Point Formation is upper Pleistocene (about 120,000 to 700,000 years old). These formations are associated with ancient marine terrace deposits that have been described in different locations in the San Diego Bay region, of which at least six are partly preserved in the park. |
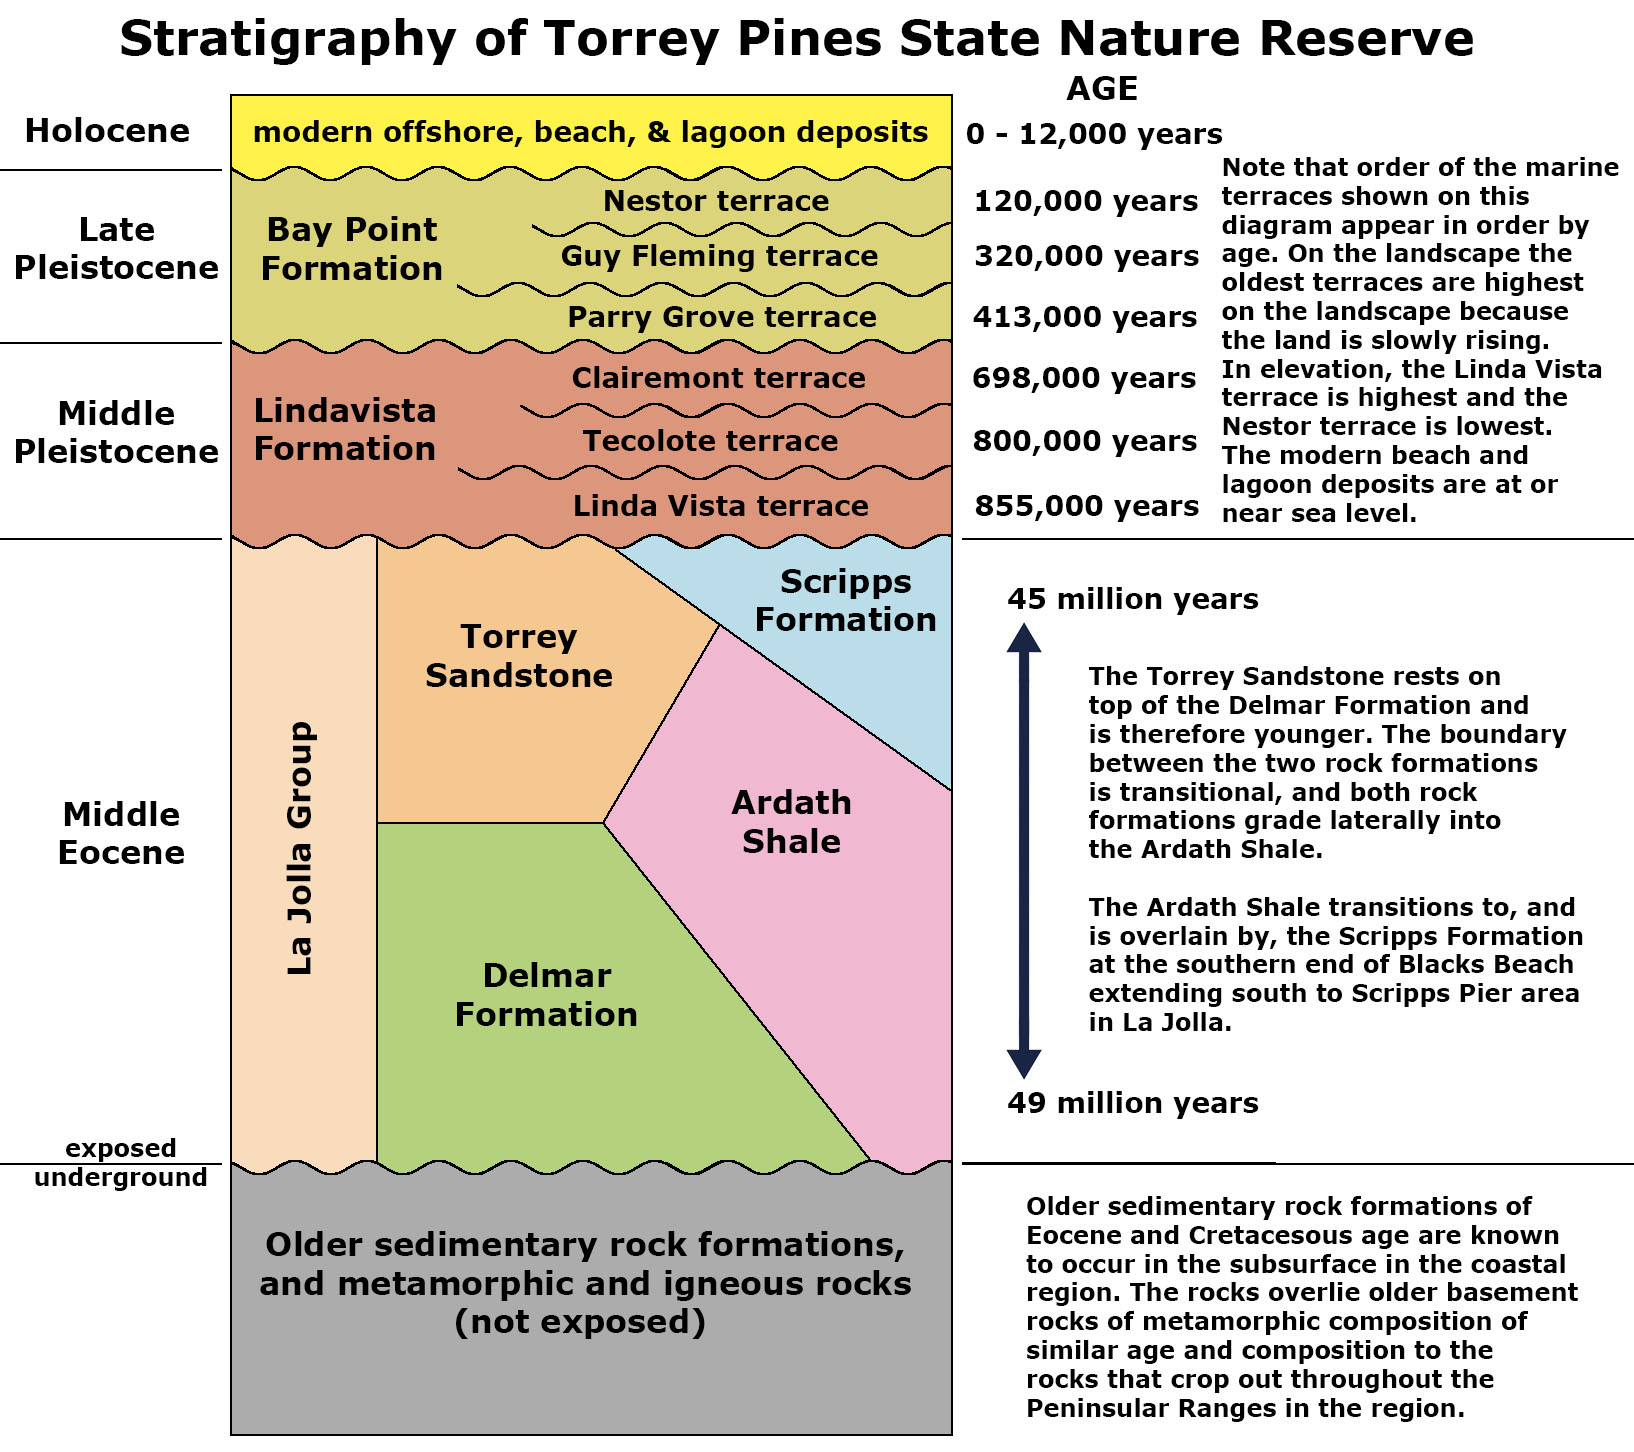 Fig. 7. Stratigraphy of the Torrey Pines Pines State Nature Reserve and park area (layers listed oldest to youngest—bottom to top). |
Sedimentary Processes In Torrey Pines Area—Then And NowProcesses shaping the coastline today are basically the same as they happened in the geologic past. However, the geometry of the West Coast during Middle Eocene time (45-49 million years ago) was very different than today. What is now San Diego County during the Eocene was part of a coastal plain west of the eroding remnants of volcanic highlands of the north-central Mexico region—the Gulf of California and the San Andreas Fault system had not formed yet. Rivers draining from the Mexican uplands drained directly in the Pacific Ocean with a principal stream (the ancient Ballena River) that dumped sediments into the ocean in what is today the coastal San Diego region (Figure 8). The sedimentary features we see in the La Jolla Group (which includes the Delmar Formation, Torrey Sandstone, Ardath Shale and Scripps Formation) were formed in shallow nearshore to offshore paralic sedimentation including alluvial, lagoonal, deltaic, littoral, and shallow neritic sedimentary environments. Paralic sedimentation (from the Greek paralia, meaning seacoast) pertain to the inter-tongued marine shelf, transitional, and coastal environments and the sediments they capture.Figure 9 also illustrates coastal sedimentary environments and features. These sedimentary features illustrate the kind of features that may have existed in the Torrey Pines park area before modern construction began in the early 20th century. The modern depositional environments have been heavily modified by the constructions of the causeways and bridges for the railroad and the Old Coast Highway (Torrey Pines Road). The flow of modern tidal channels of the lagoon is now limited to the location of the bridges. In addition, the natural supply of sandy sediment to the coastline beaches has been restricted. Seacliff erosion prevention efforts along the coast and the construction of dams on rivers and streams have reduced the sand supply that would otherwise supply sand to beaches. In an unrestricted natural environment the location of inlets and channels cutting through coastal bay-mouth bars would be constantly shifting. Now expensive dredging operations are needed to maintain channel flow and sand supply to the beach. |
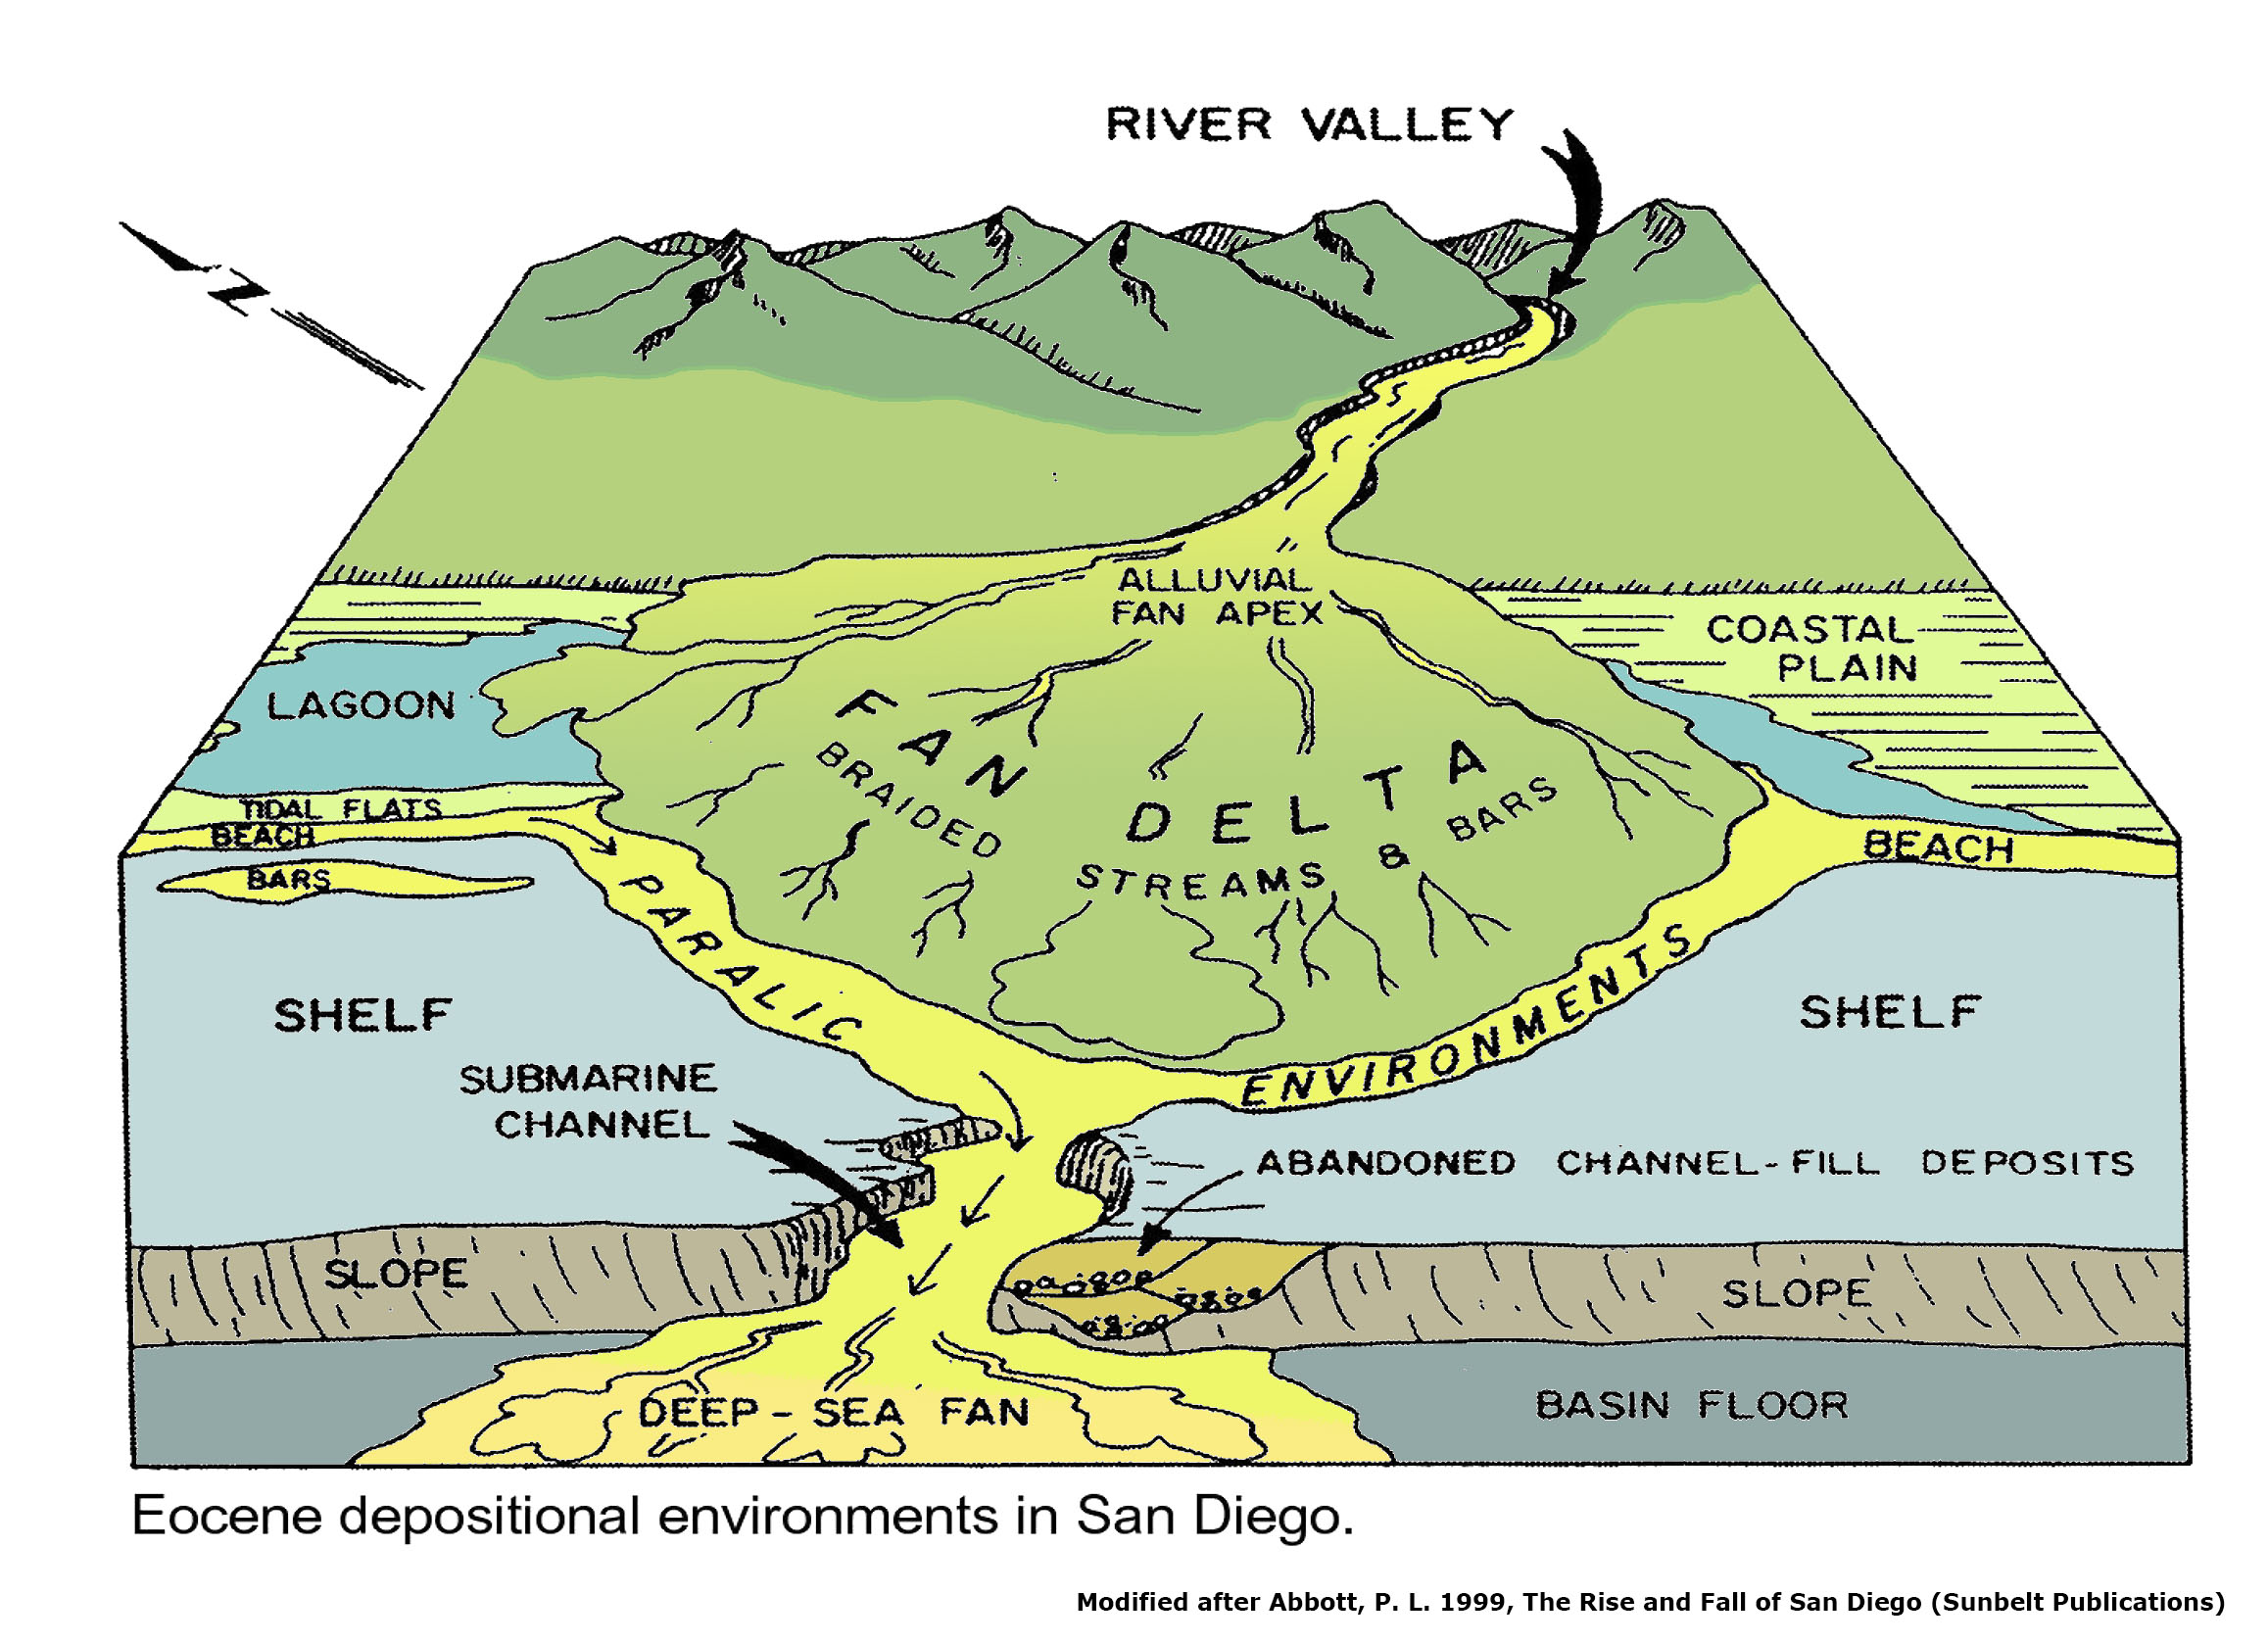 Fig. 8. Eocene depositional environments in San Diego 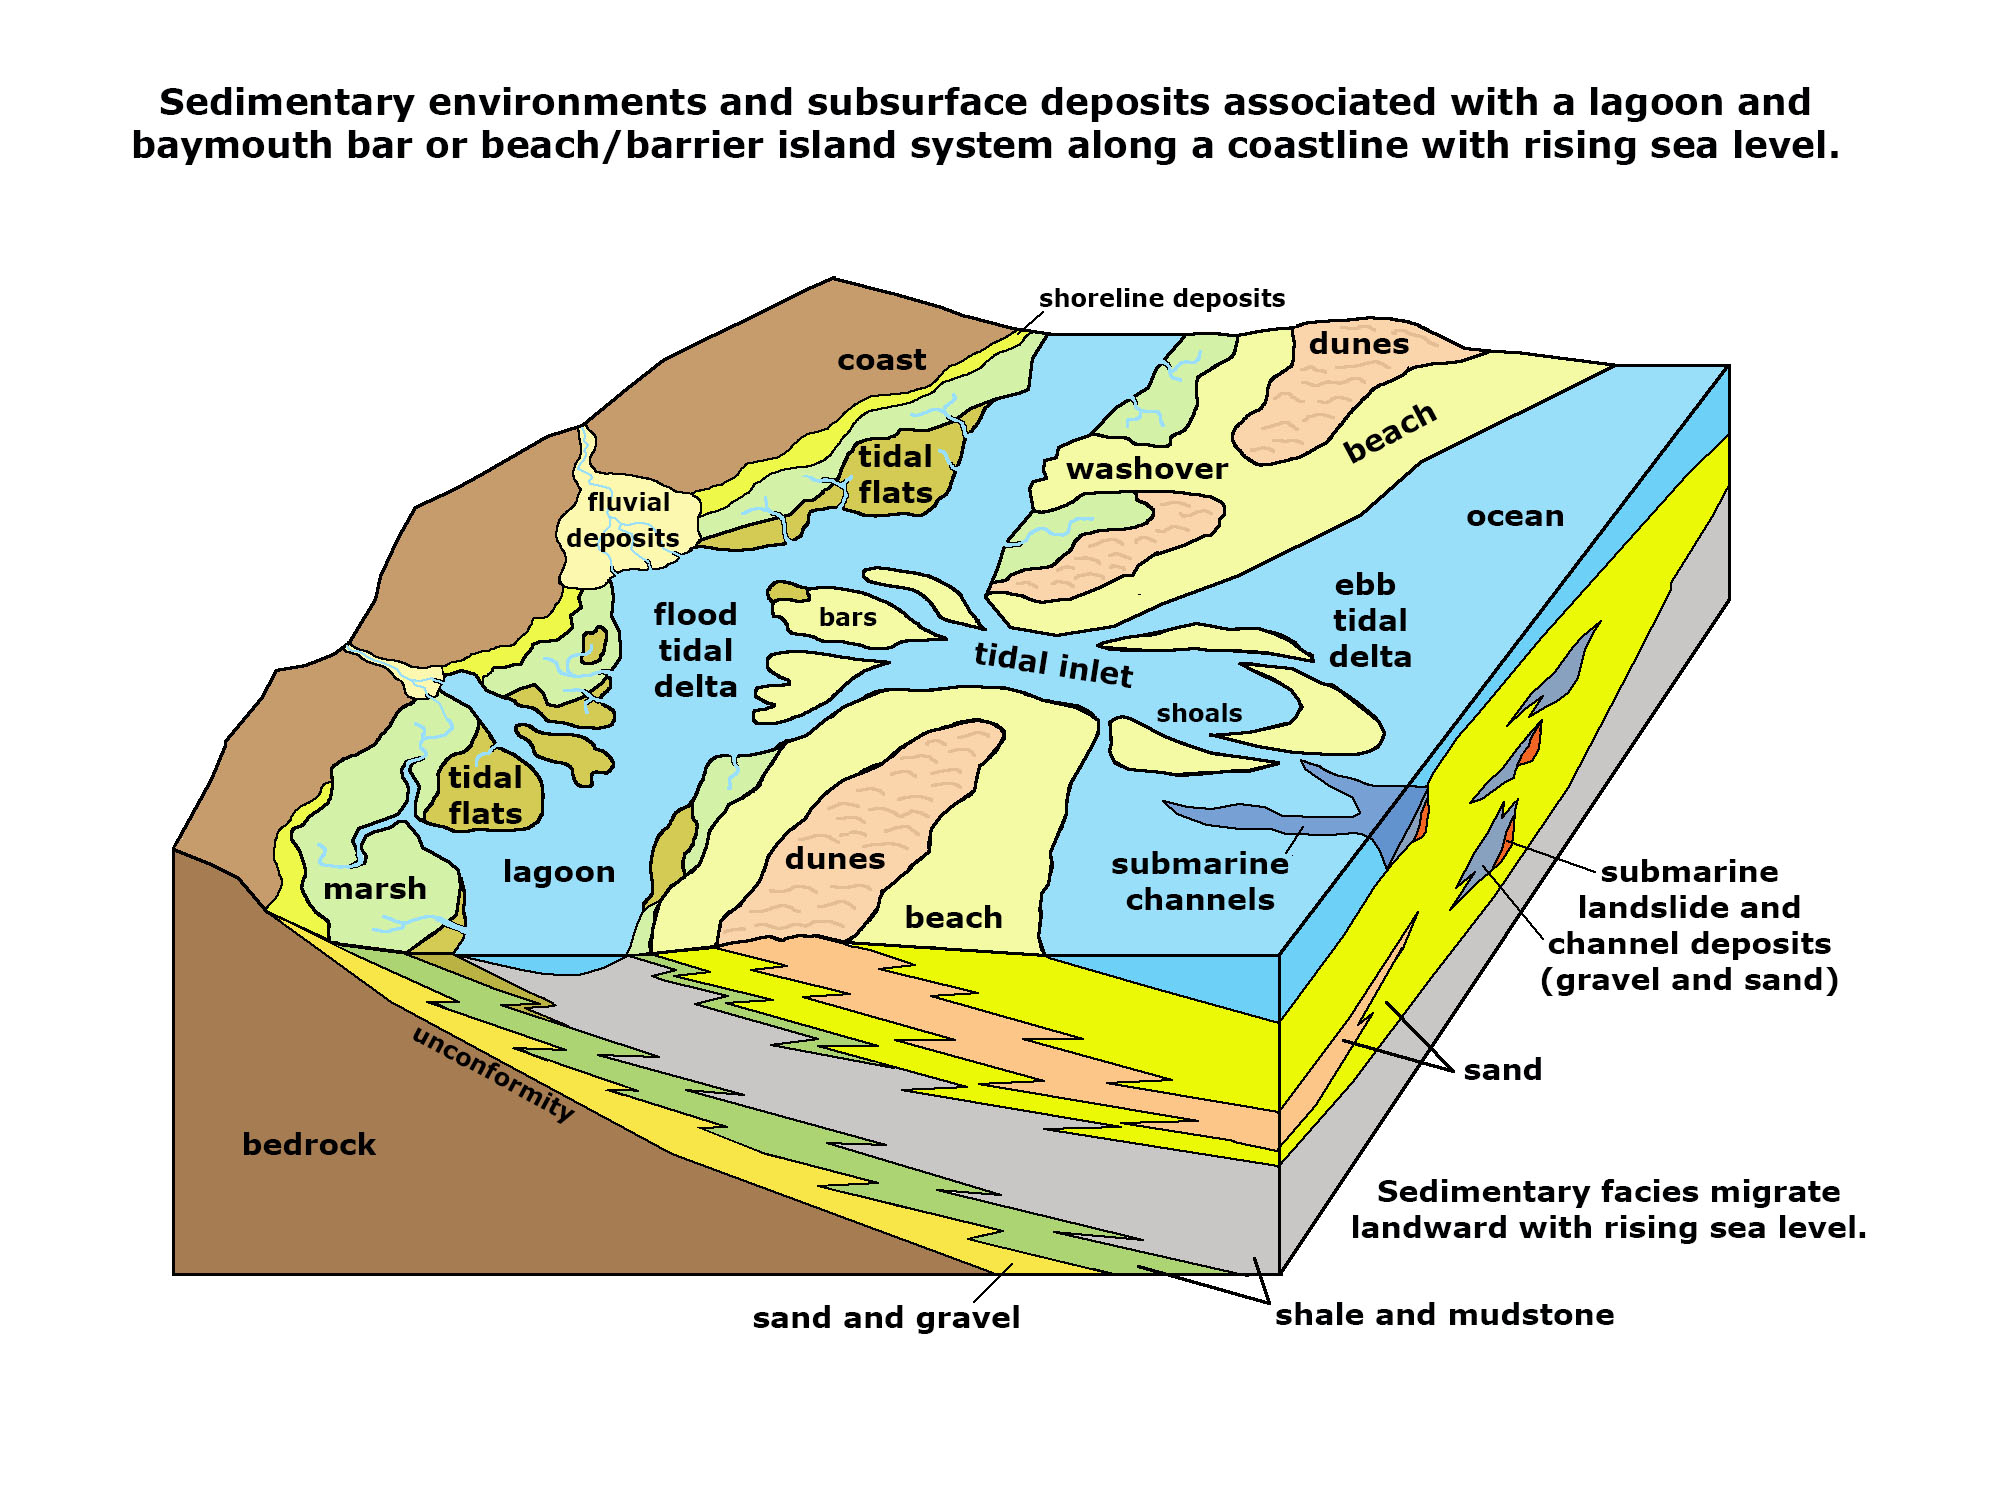 Fig. 9. Paralic sedimentary environments associated with beaches, barriers, bay mouth bars, and lagoons, and offshore |
Using Sedimentary Facies To Describe Rock FormationsThe discussions below describes sedimentary rock formations in the Torrey Pines park area. In geology, the term rock formation is used to describe a body of rock having a consistent set of physical characteristics (lithology) that distinguish it from adjacent bodies of rock. Named sedimentary rock formations occupy a particular position in sequence of layers of rock distributed in a geographical region. Rock formations can be exposed and occur below the surface. Giving a package of sedimentary rock layers a formal formation name makes it easy to communicate some information. However, the term sedimentary facies provides a better description of the origin of how the sedimentary material was originally formed.Sedimentary facies are bodies of sediments (or sedimentary rocks) that are recognizably distinct from adjacent sediments (or rocks) that resulted from sediments accumulating in different depositional environments. Sedimentary facies are masses of rock that can be recognized by its composition, structures or fossil content, and can be mapped on the basis of those characteristics. Examples include beach facies, lagoonal facies, submarine channel facies, dune facies, etc. Figures 8 and 9 illustrate sedimentary facies, showing sedimentary environments actively forming on the surface and their relationship to sedimentary facies where their associated sediments are preserved below the surface. |
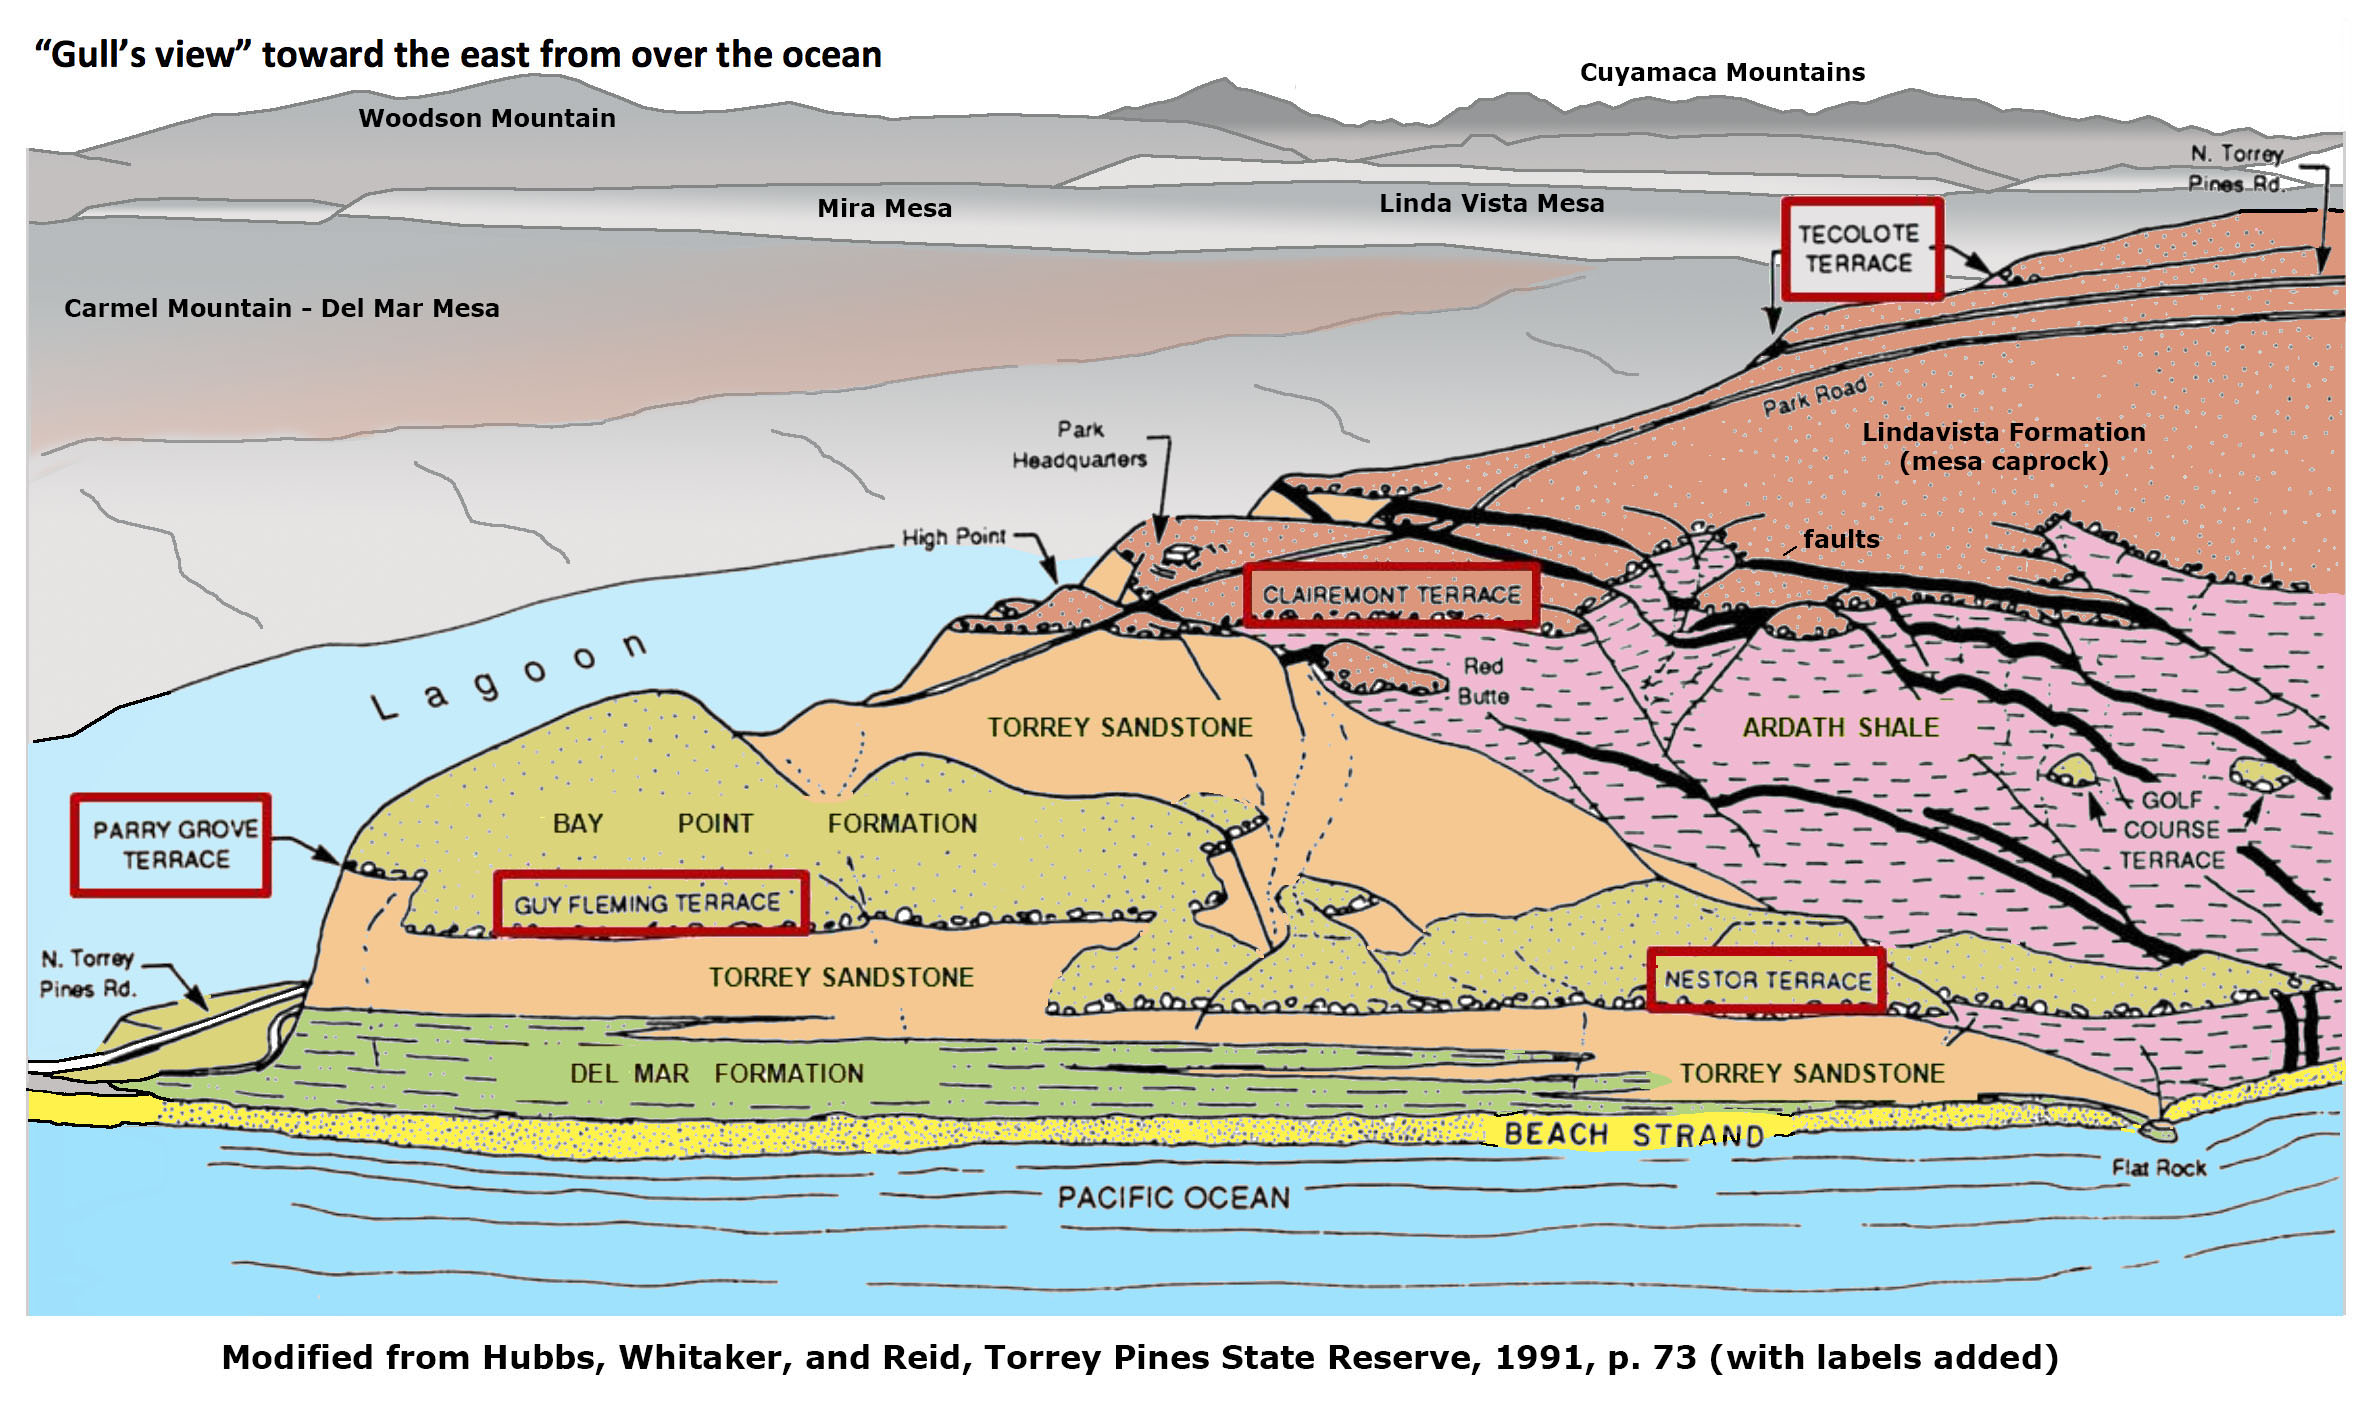
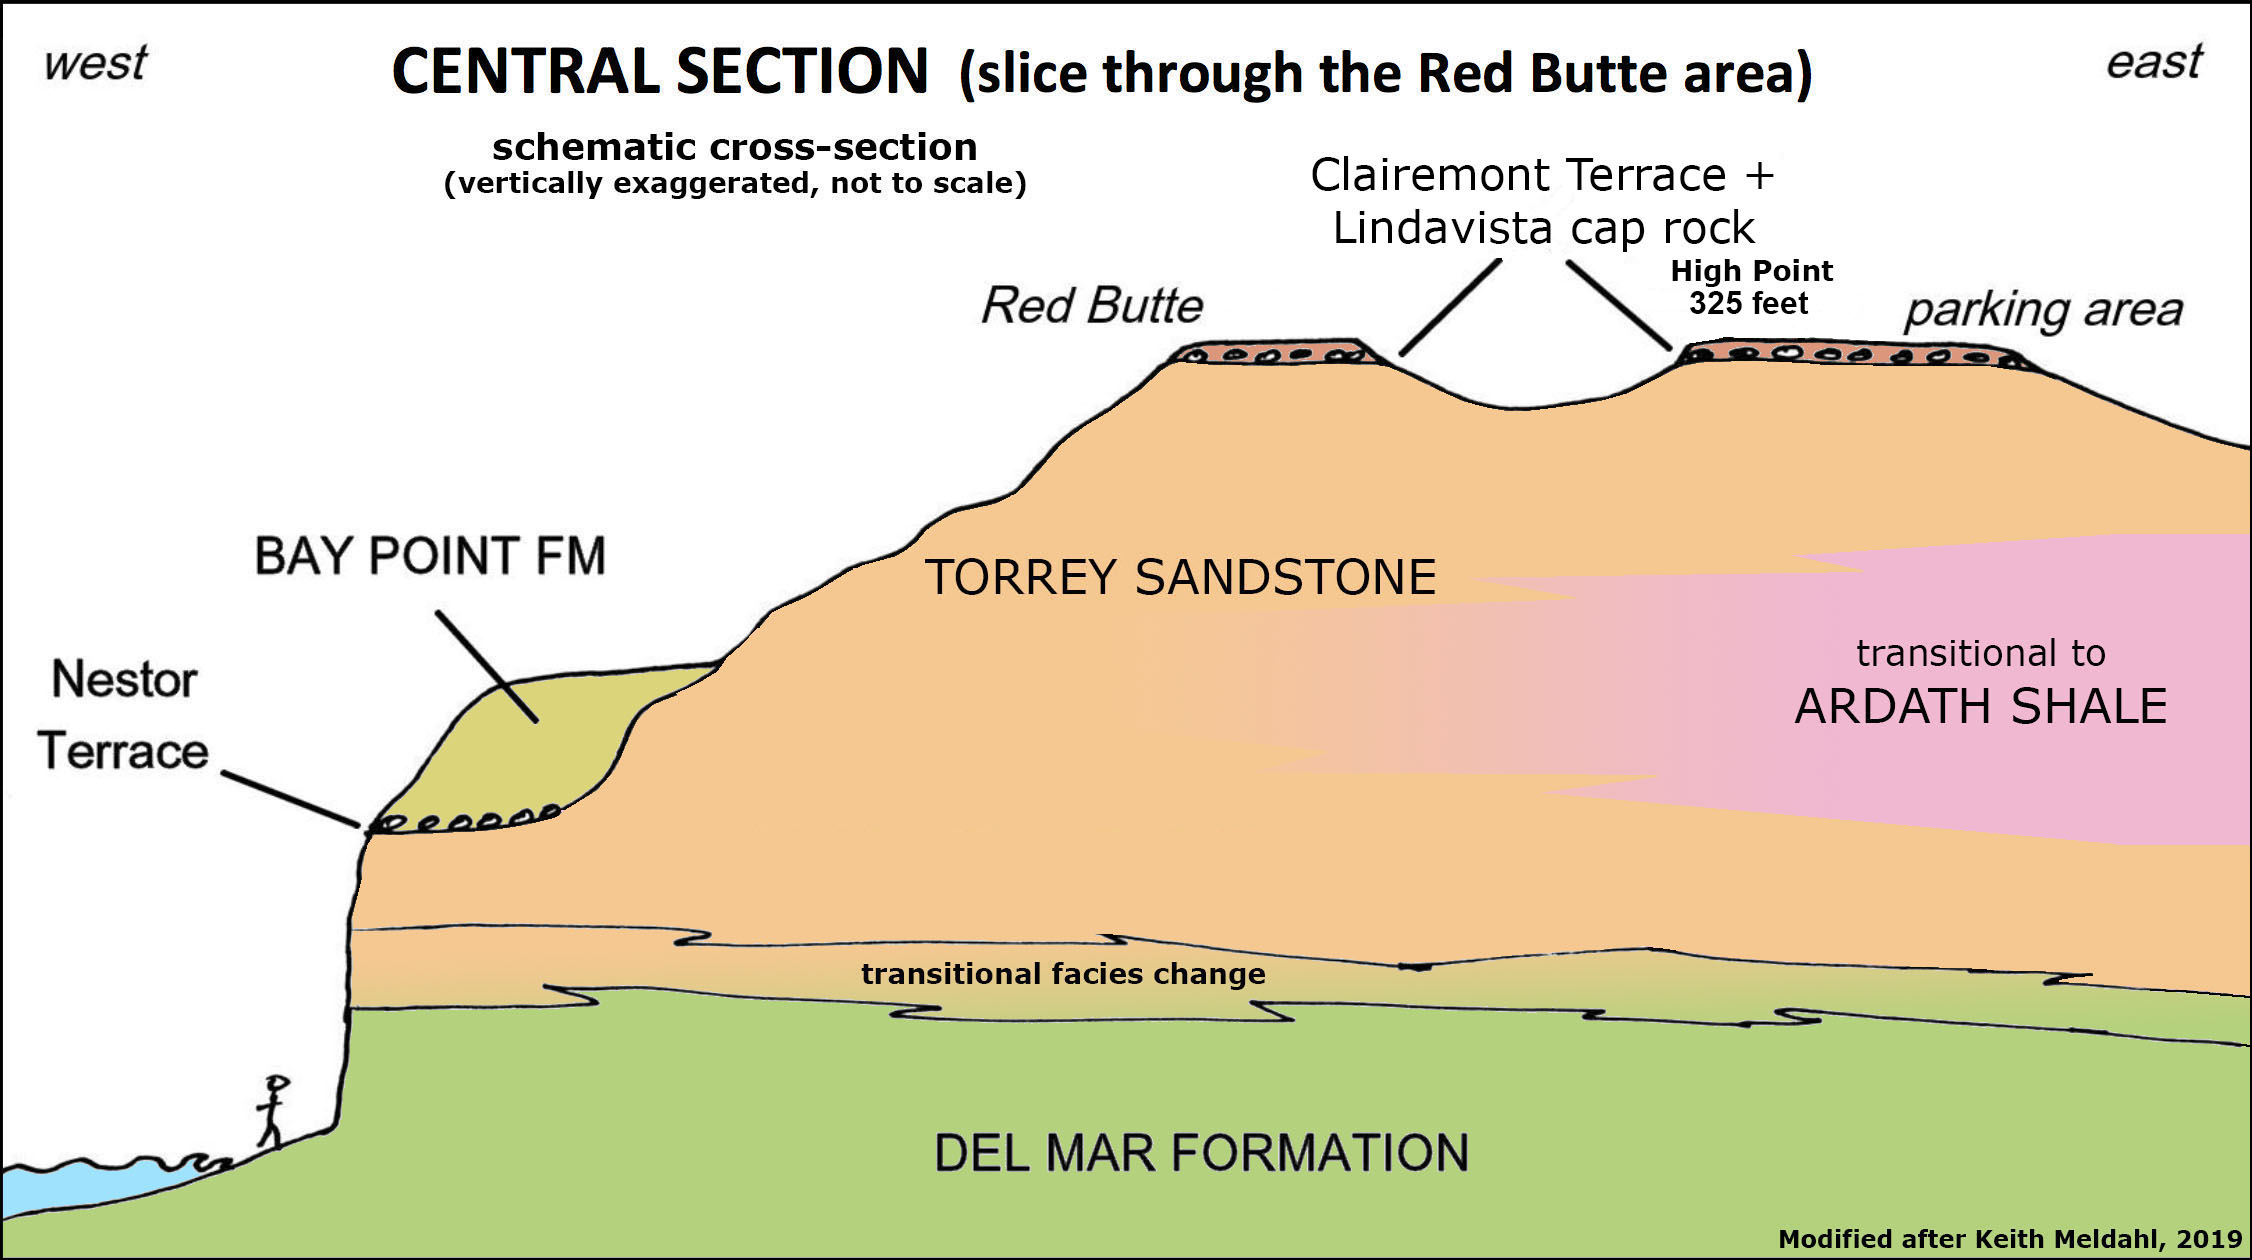
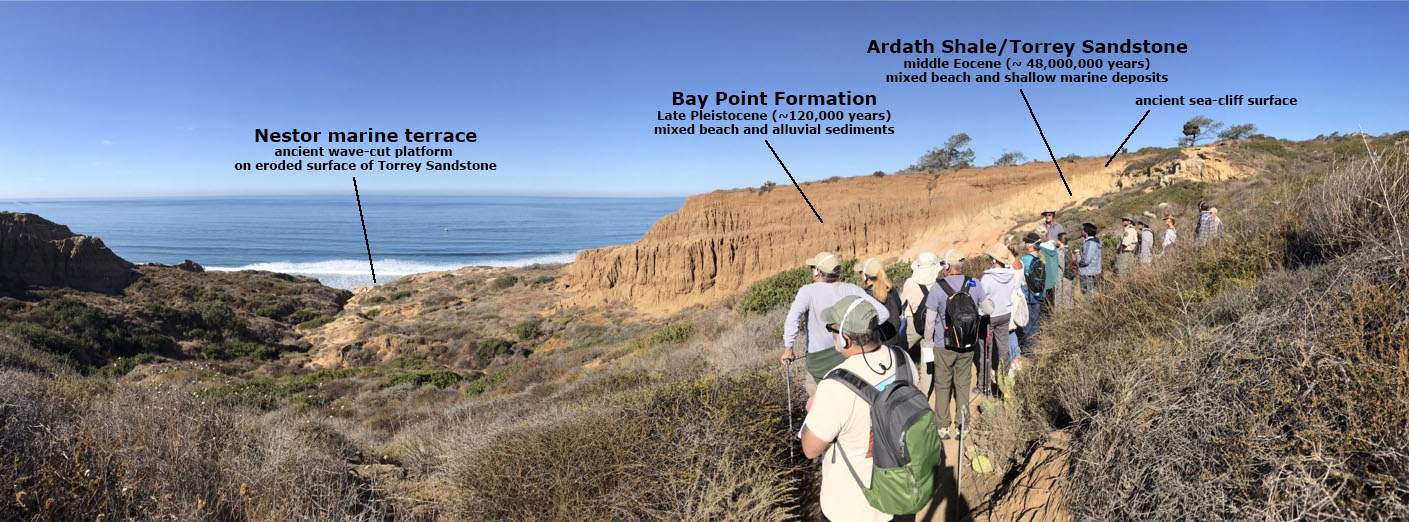
General Geology of the Torrey Pines State Nature ReserveThe landscape and geologic features in the reserve are best examined in the context of the greater geologic history story of the San Diego Region extending back hundreds of millions of years. What is visible in the reserve area is only a small portion of the larger story as described in Plate Tectonics and Regional Geology of San Diego County. The Eocene-age rock formation form the bedrock foundation in the reserve area, whereas the younger Pleistocene age formations are essentially surface-coating deposits preserved on the eroded surface of older landscapes. Looking south from Carmel Valley Road, the upland part of the Torrey Pines State Nature Reserve has the appearance of a mesa—an isolated flat-topped hill with steep sides, found in landscapes with horizontal strata (Figure 10). The mesa is actually part of a larger erosionally dissected plateau that includes the broader upland areas extending east from the coastline to the base of the mountains.Figure 11 is a slightly revised version of a classic "gull's view" geologic map illustration showing the geologic features (rock formations and faults) of the Torrey Pines mesa (modified after Hubbs and others, 1991). Figures 12 and 13 illustrate generalized east-to-west cross-sections of the Torrey Pines mesa. |
|


Rock Formations Exposed Along the Sea Cliffs of Torrey Pines and Blacks Beaches |
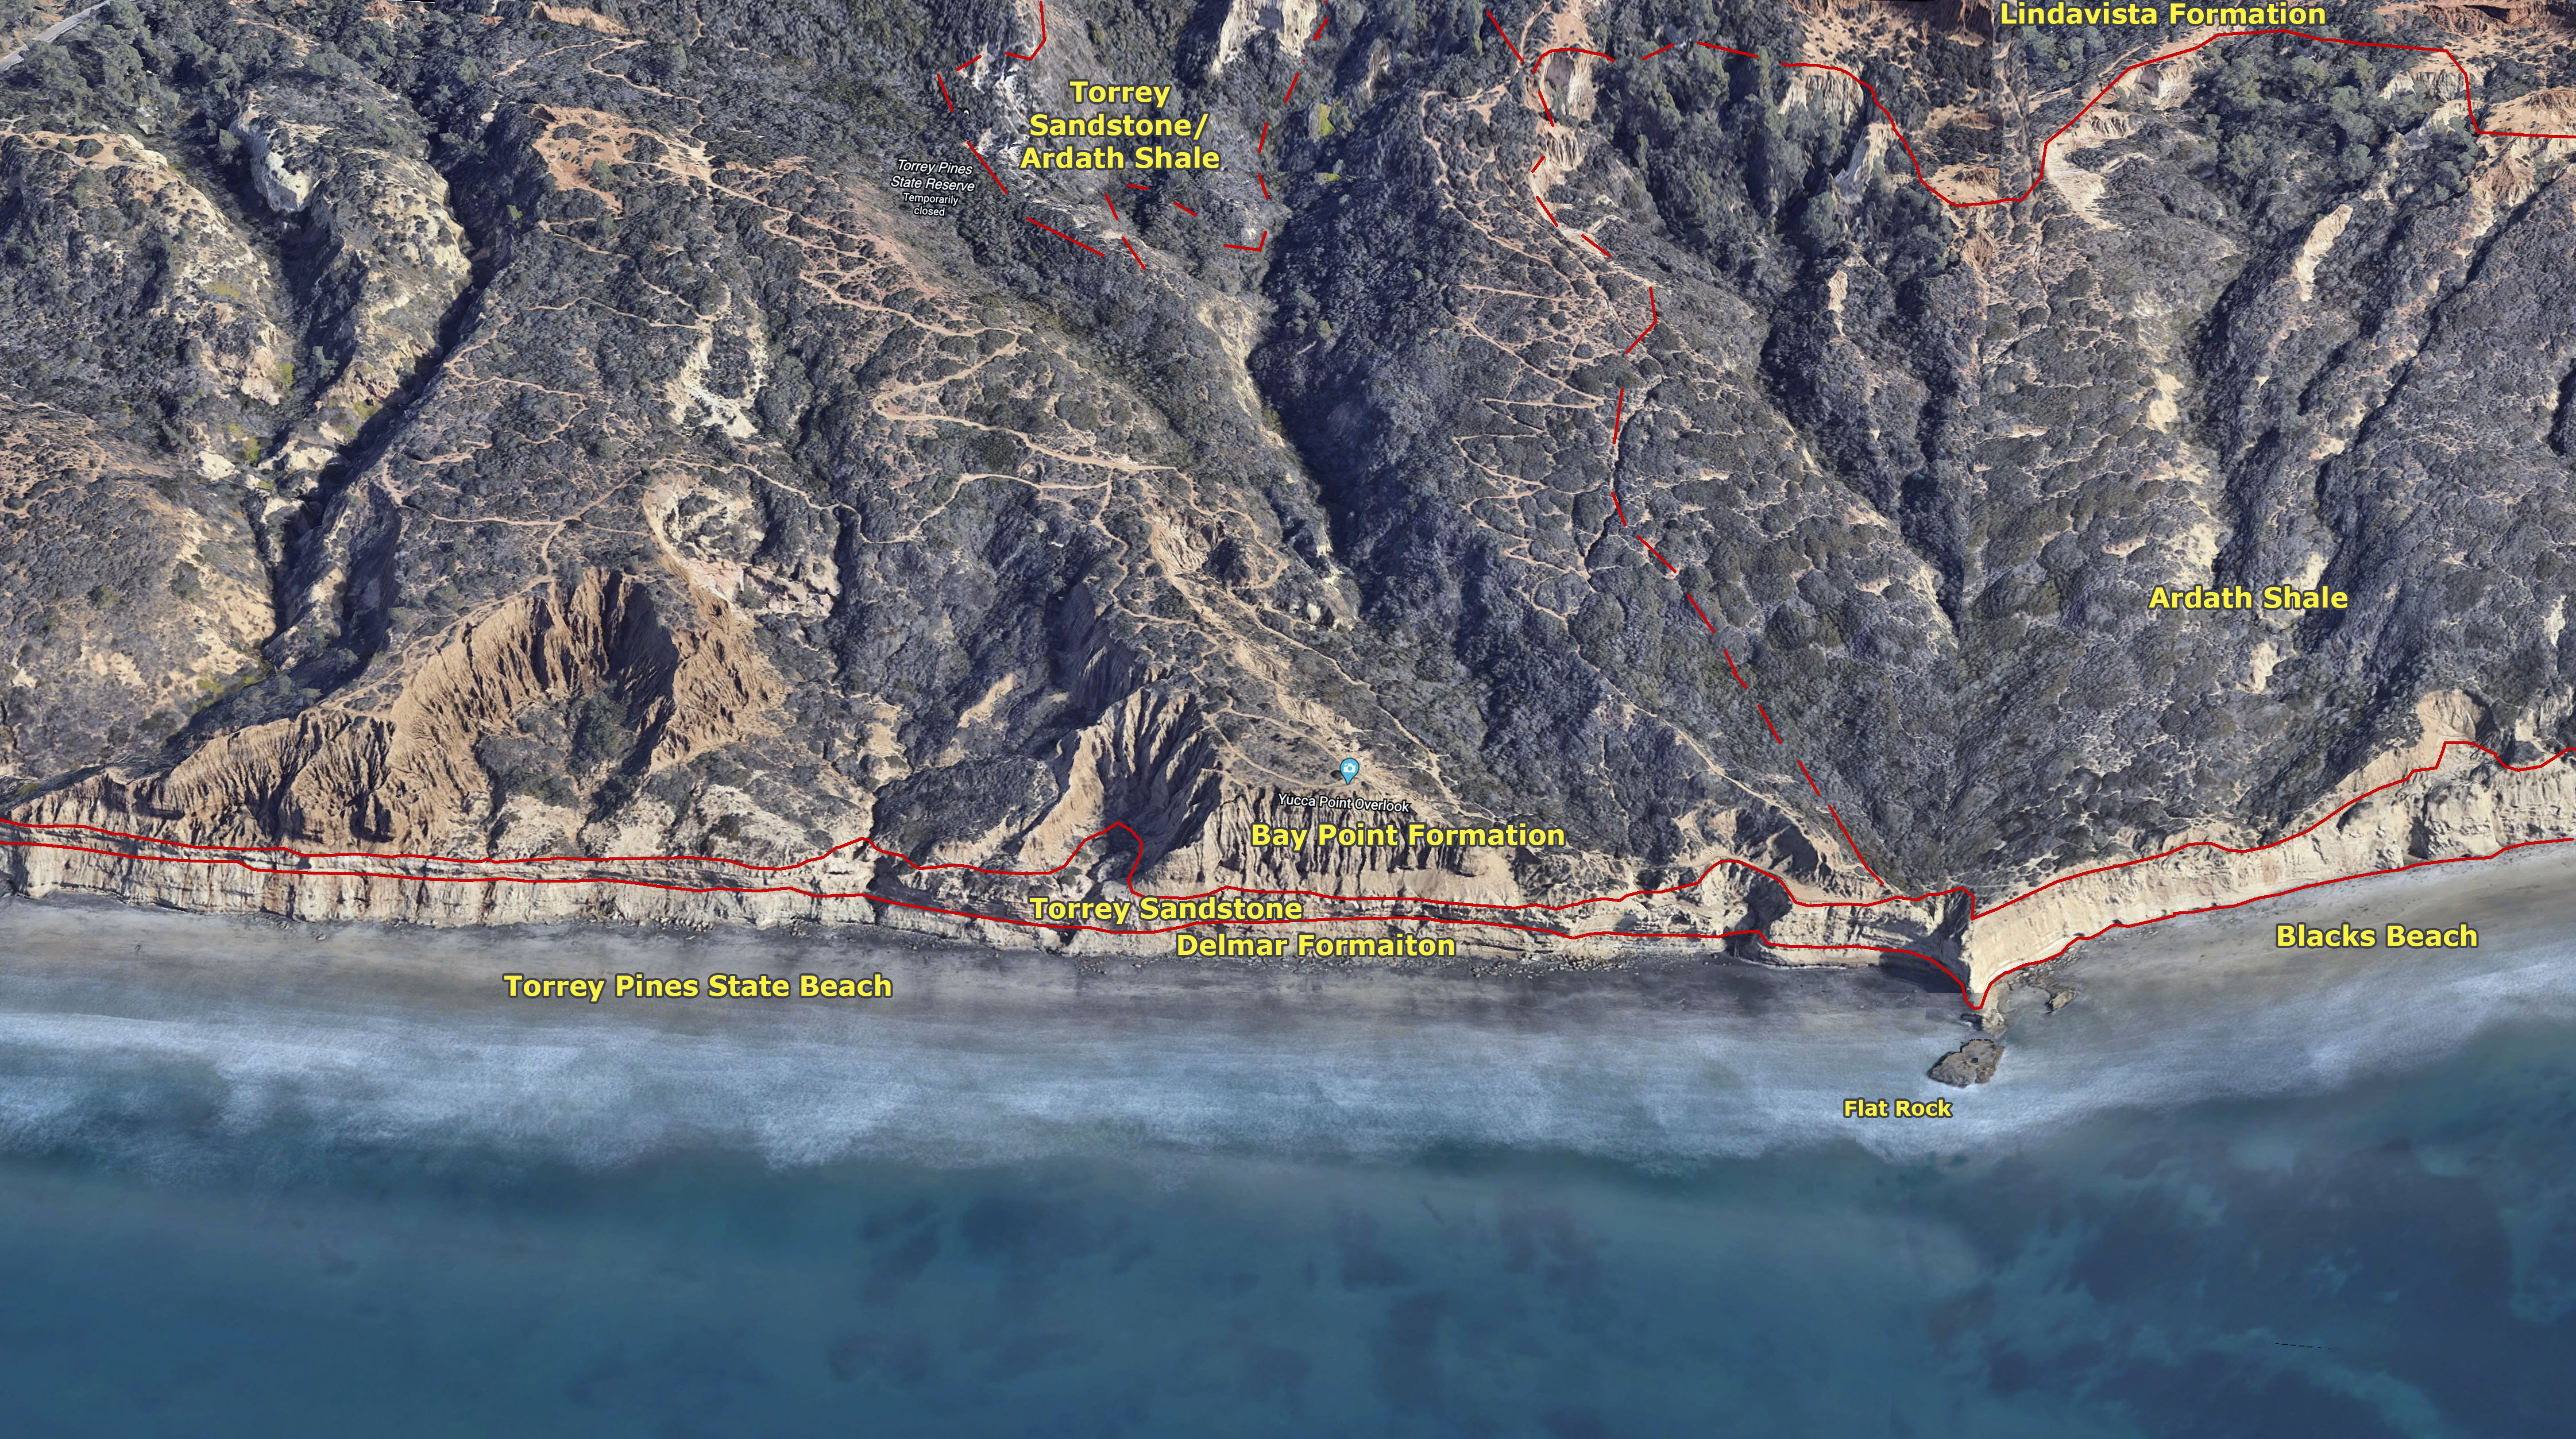
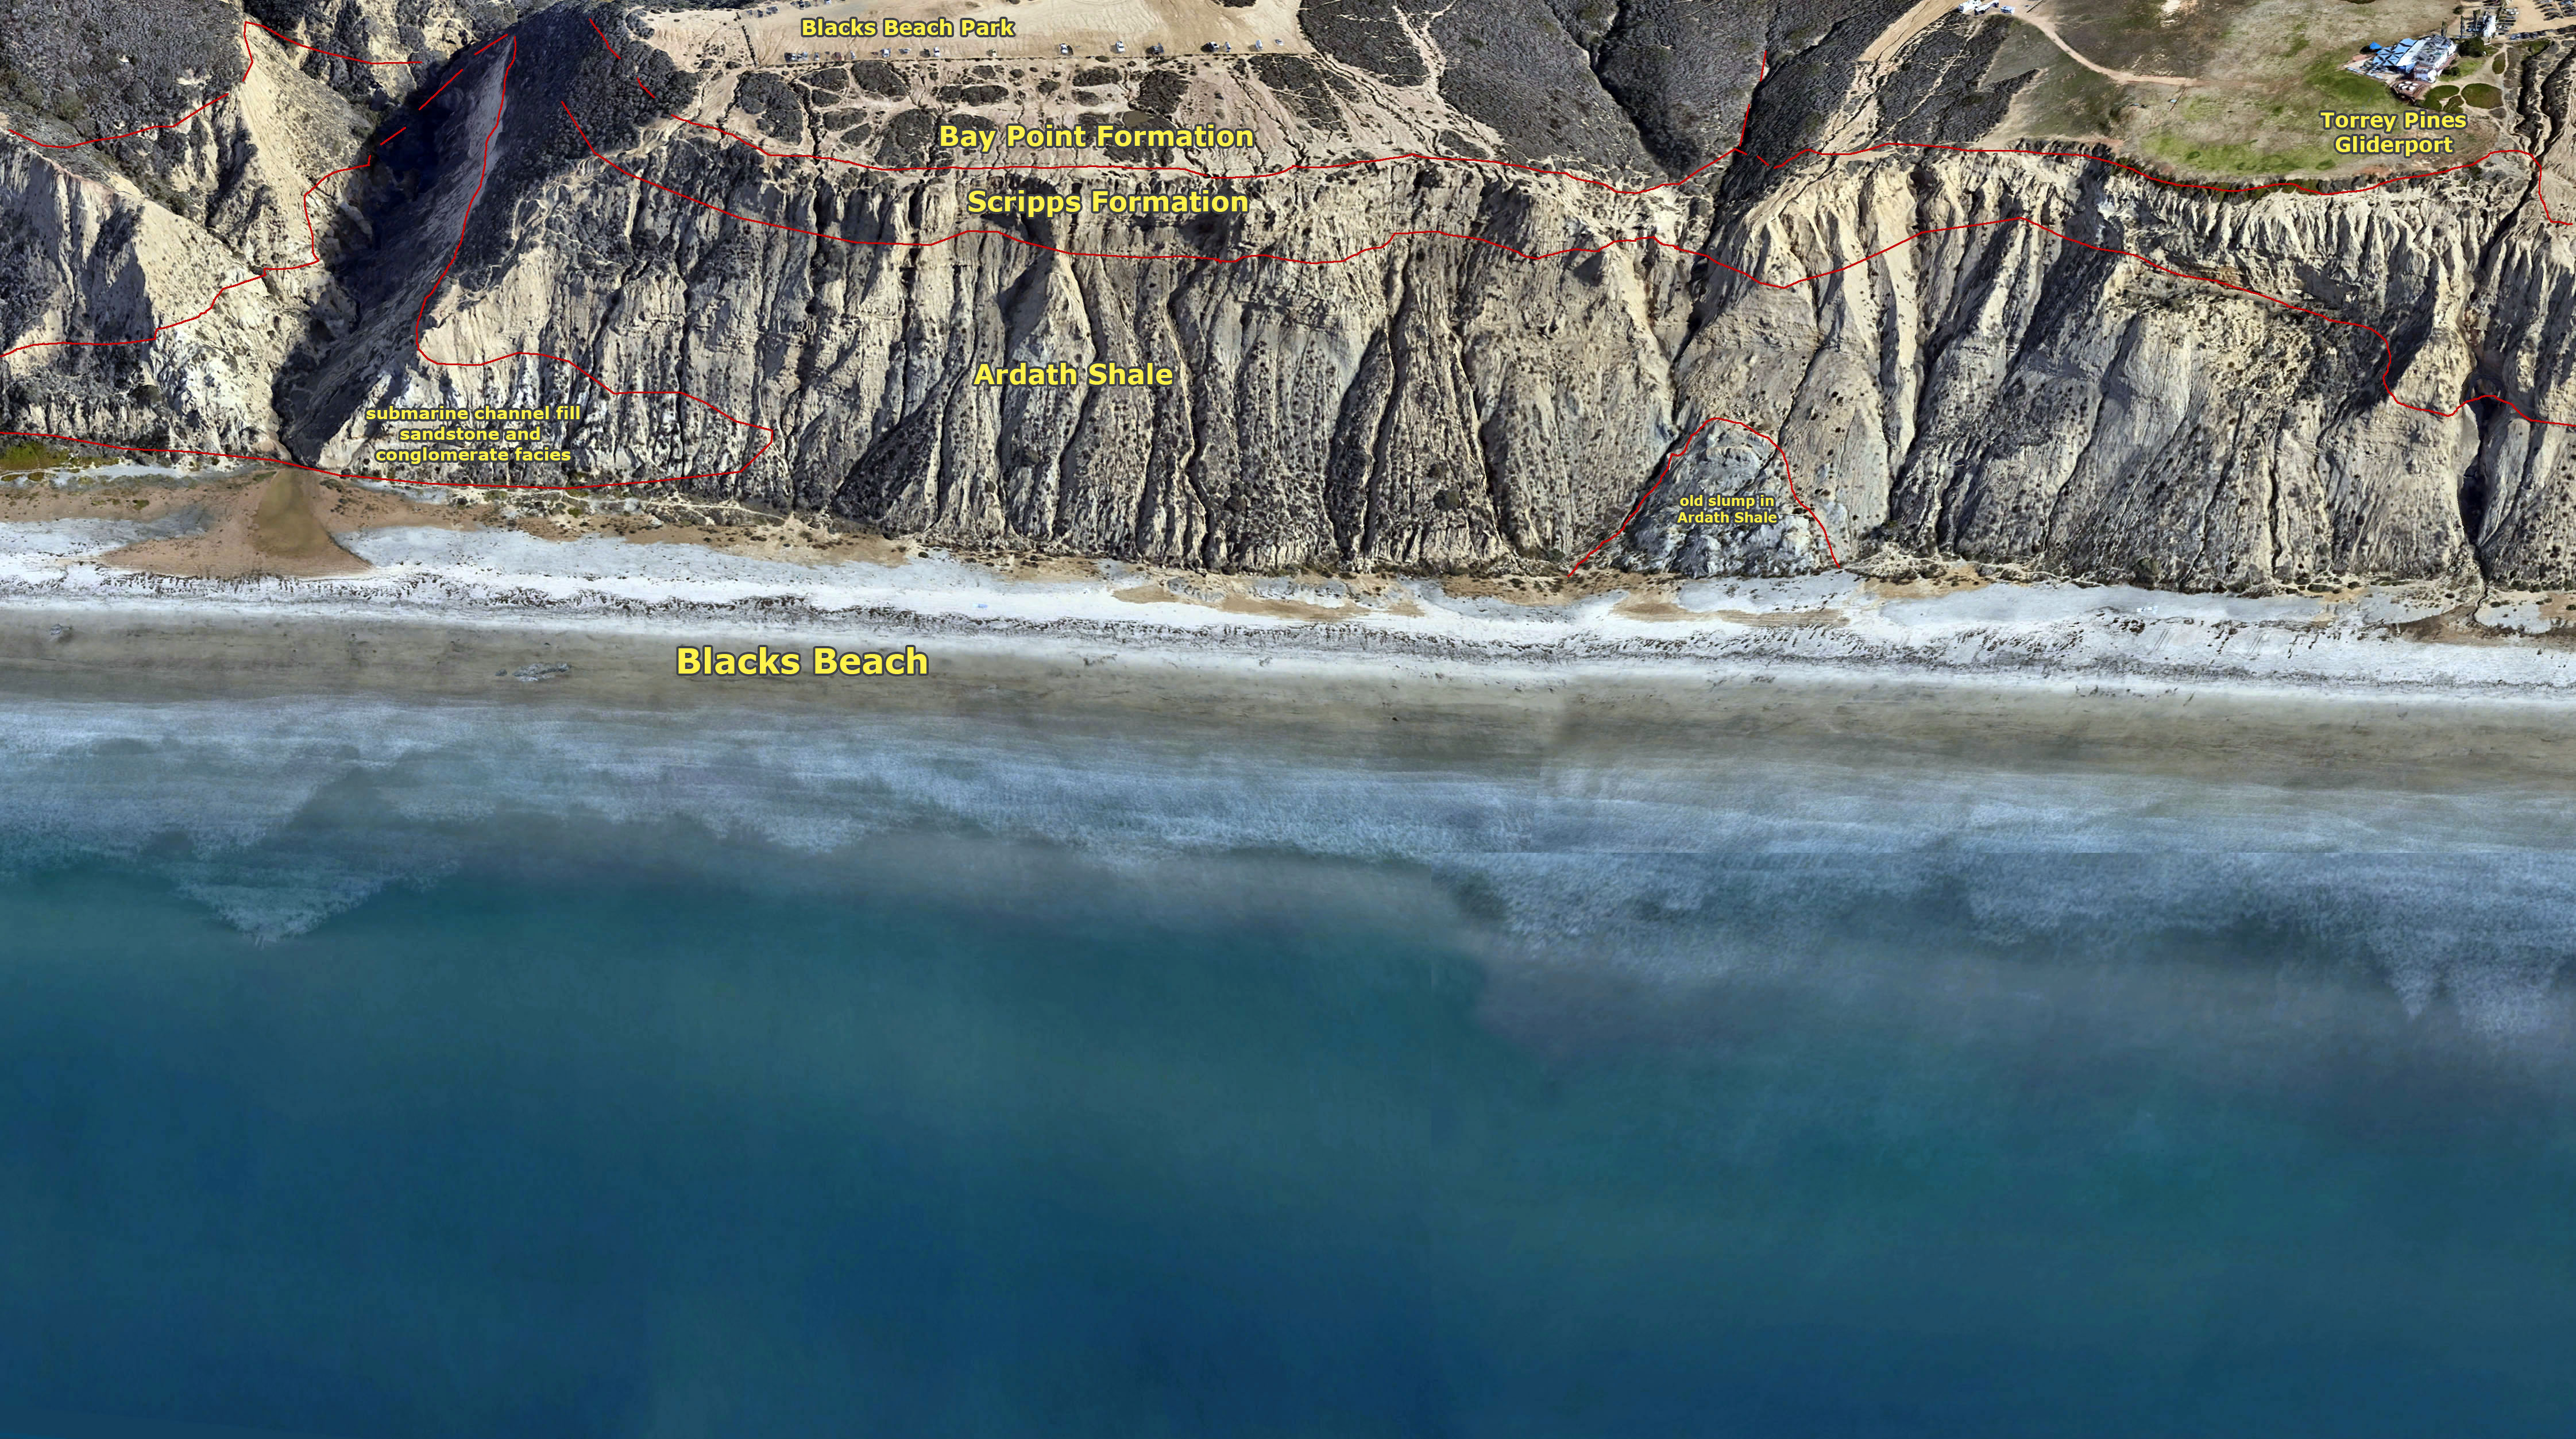
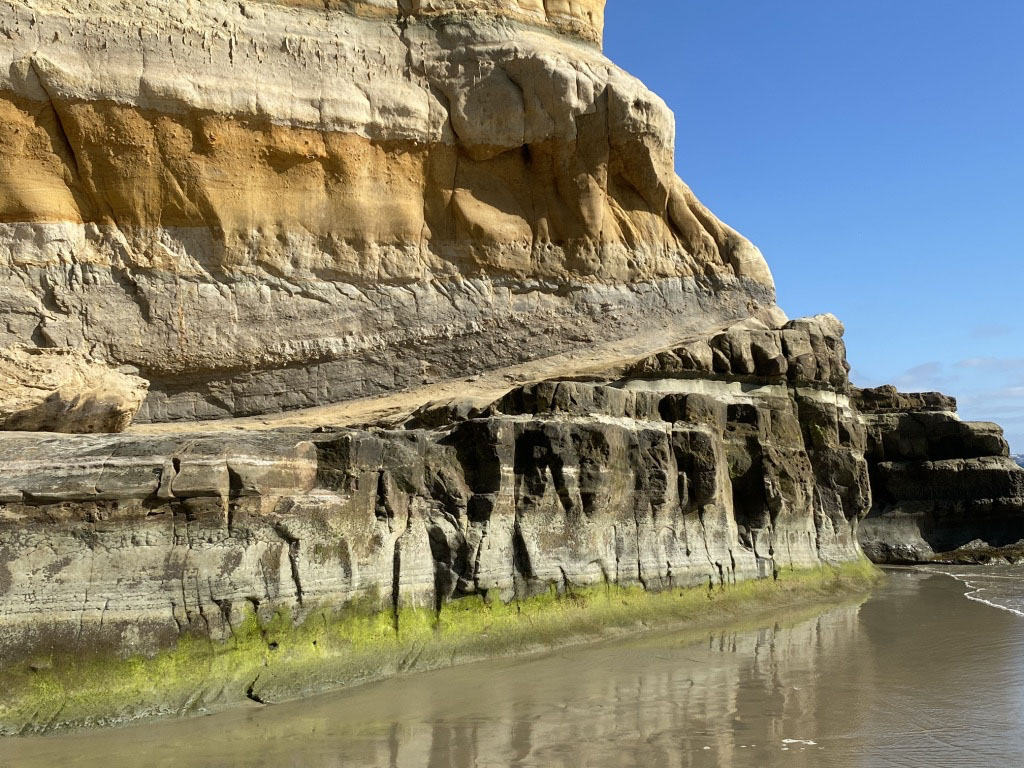
| The series of images below show an interpretation of how the Eocene-age rock formations (Delmar, Torrey, Ardath, and Scripps formations) express themselves in the sea cliffs in the Torrey Pines and Blacks Beach area between the Peñasquitos Lagoon (north) and Scripps Pier (south). The rock formations have unique characteristics that express themselves in appearance—lithology, weathering style (cliff vs. slope forming), and superposition. In some locations, the boundary between formations is transitional, either laterally or vertically. These subjective formation boundaries should be redefined by facies. |
|
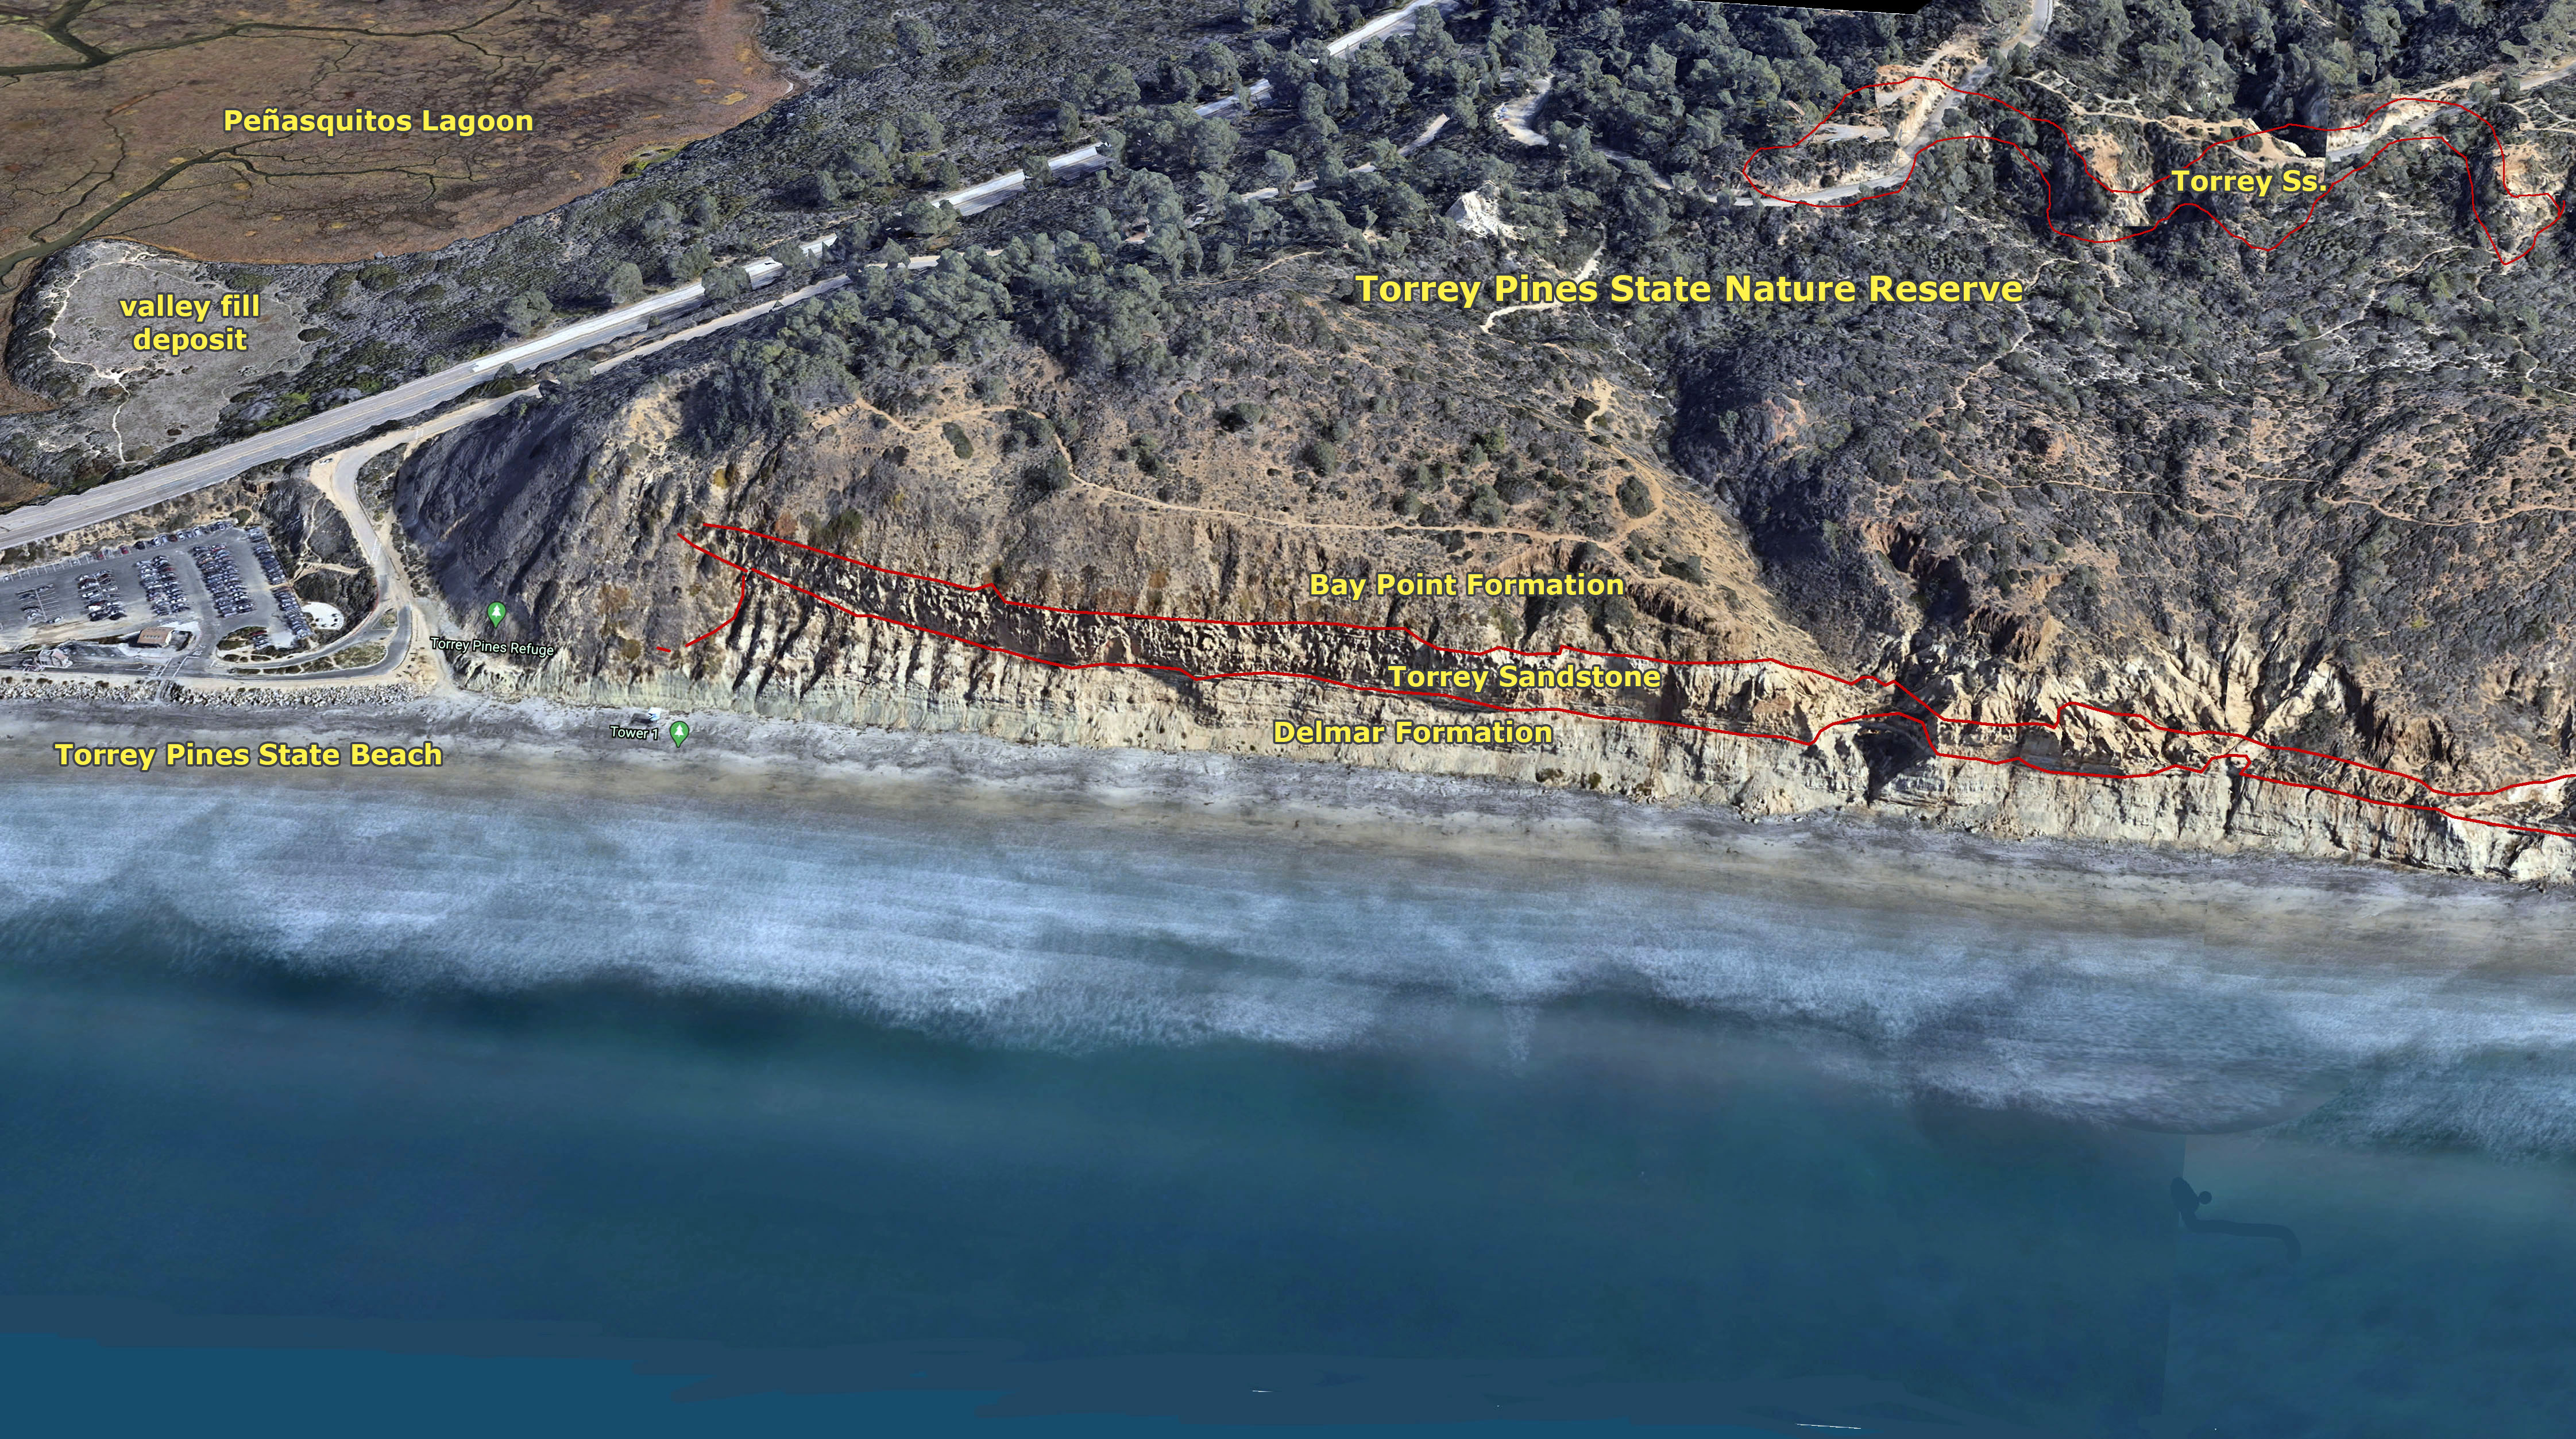

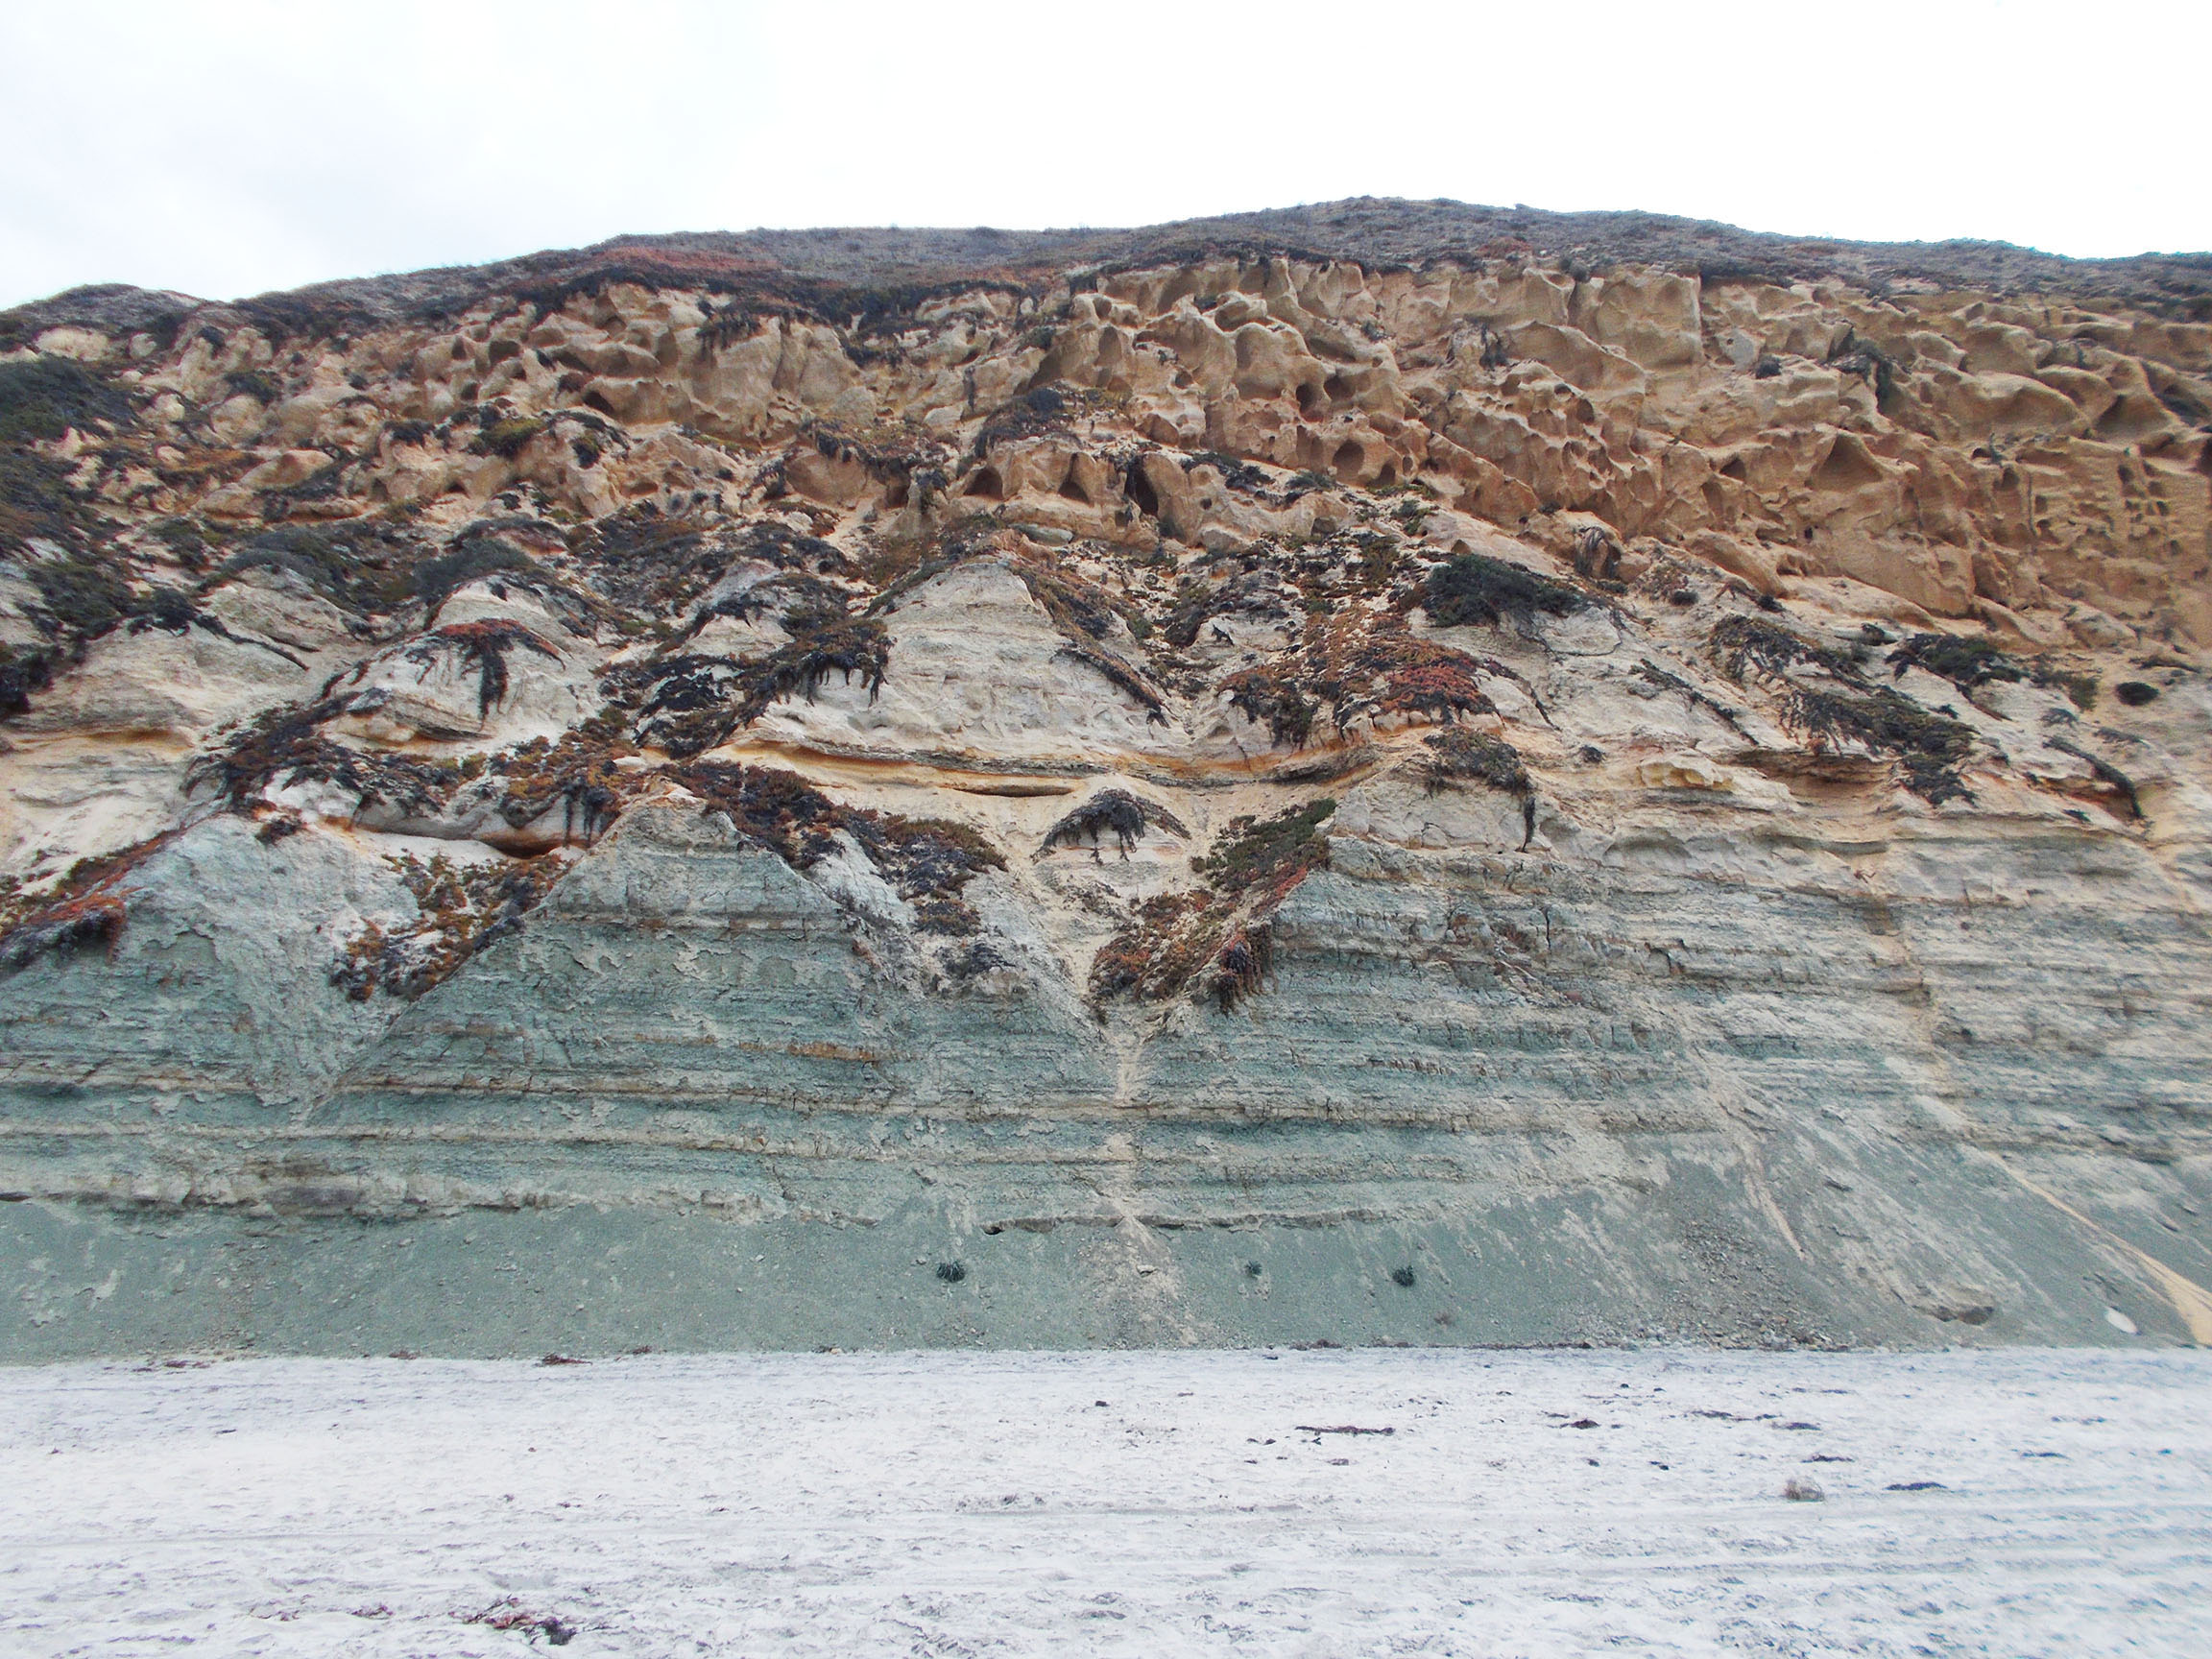
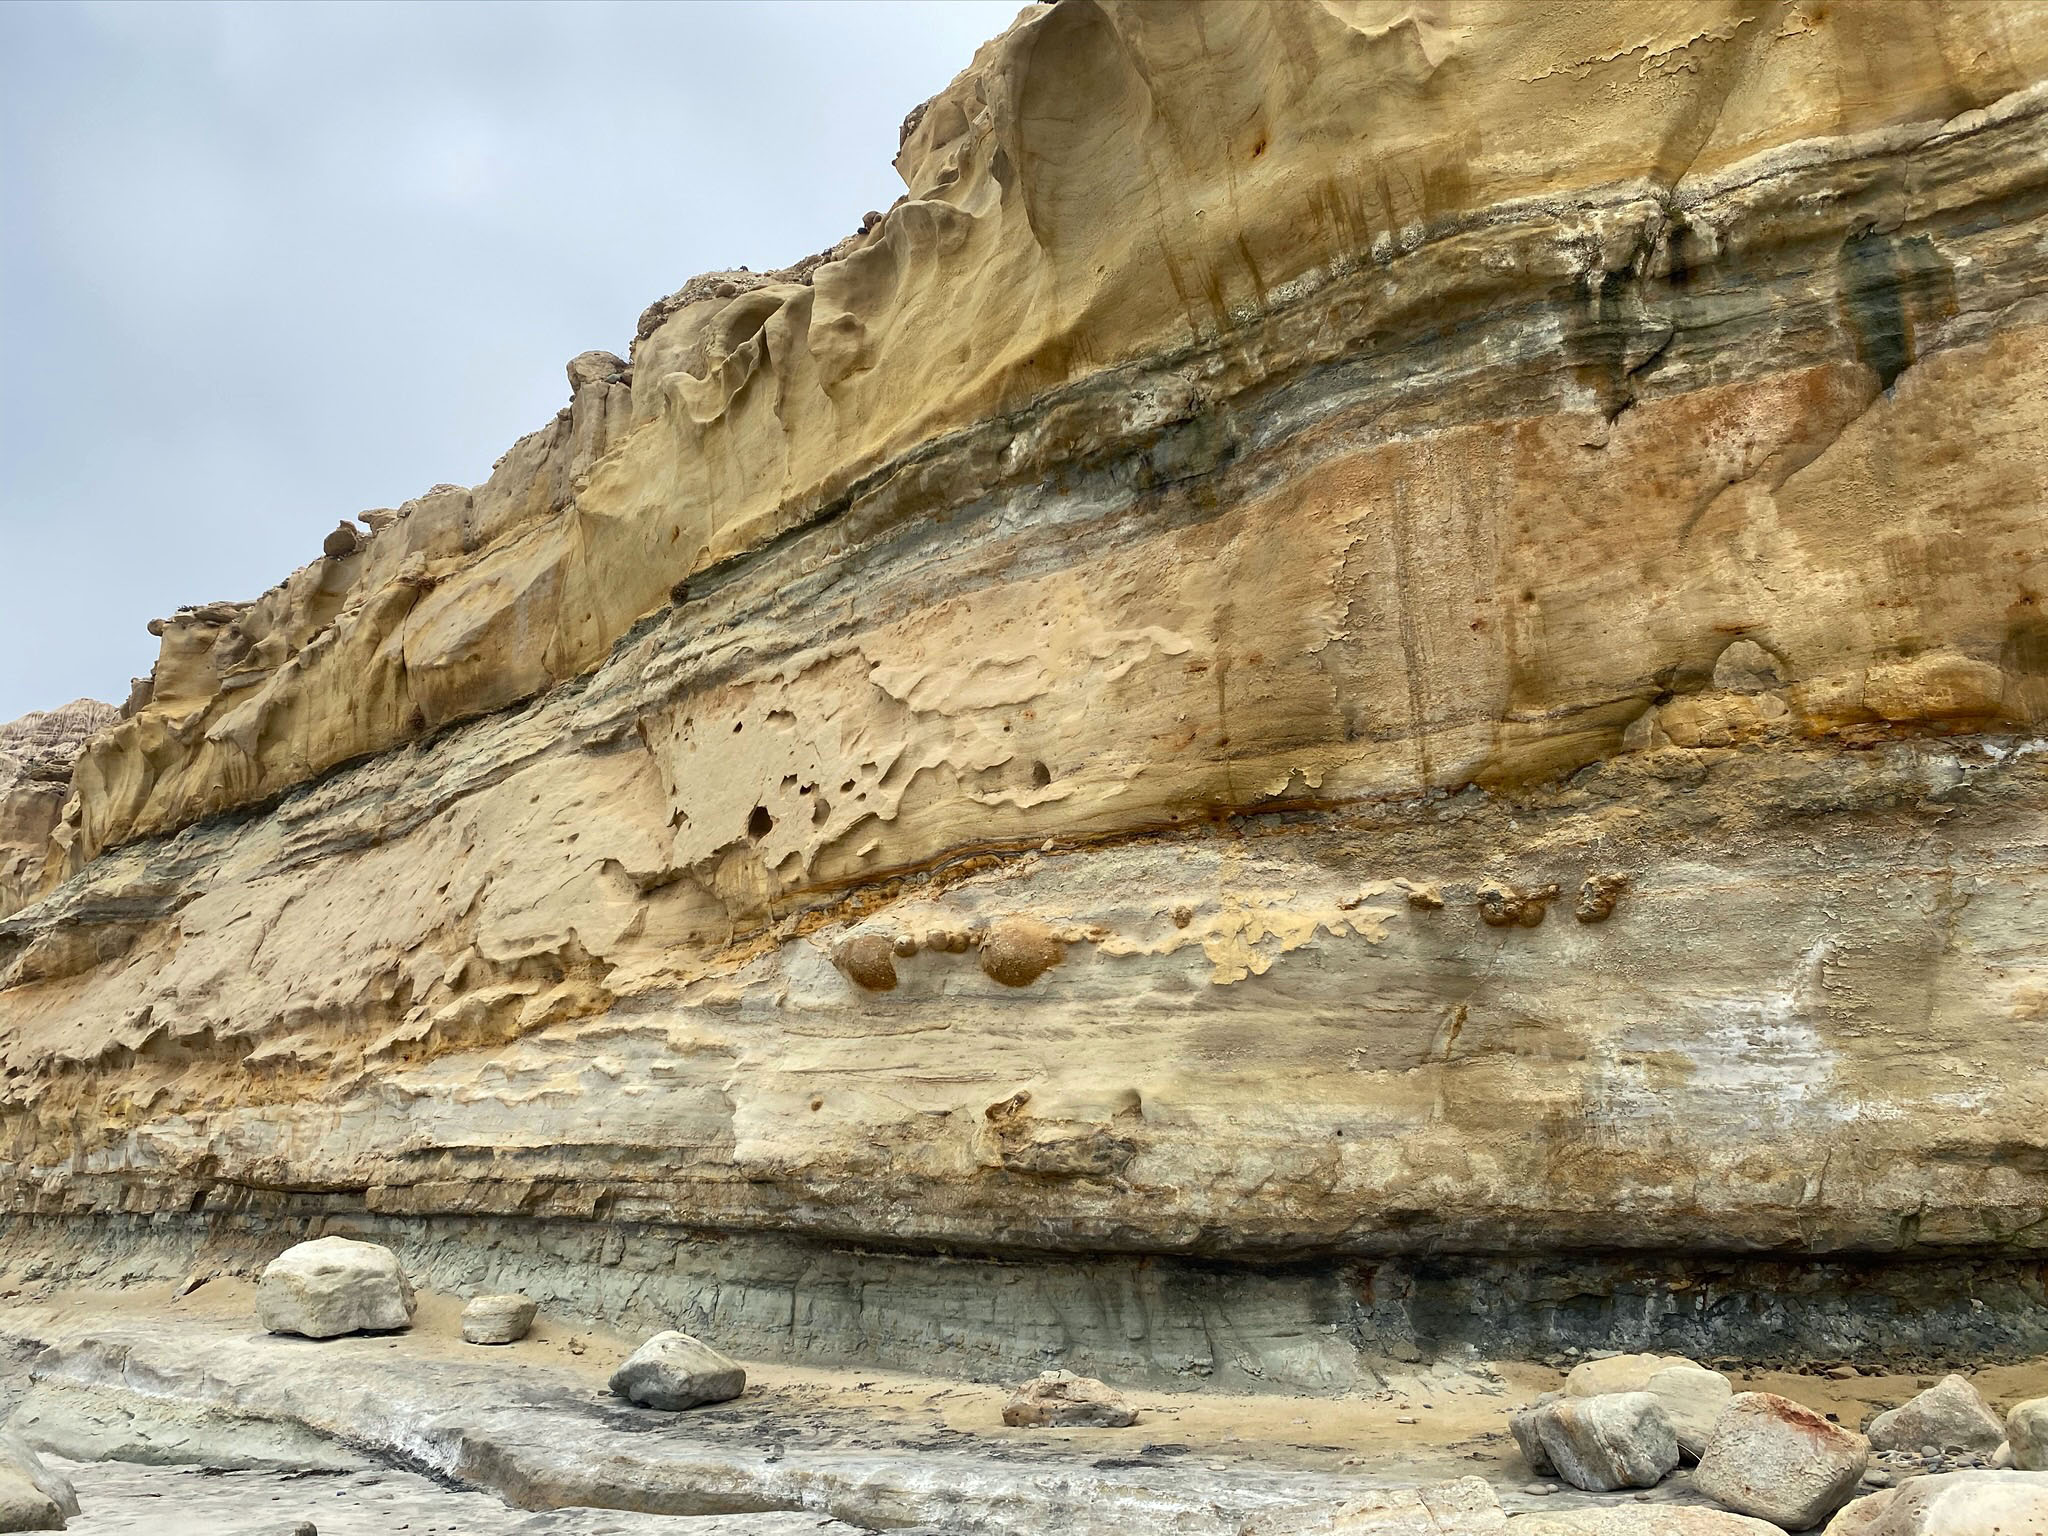
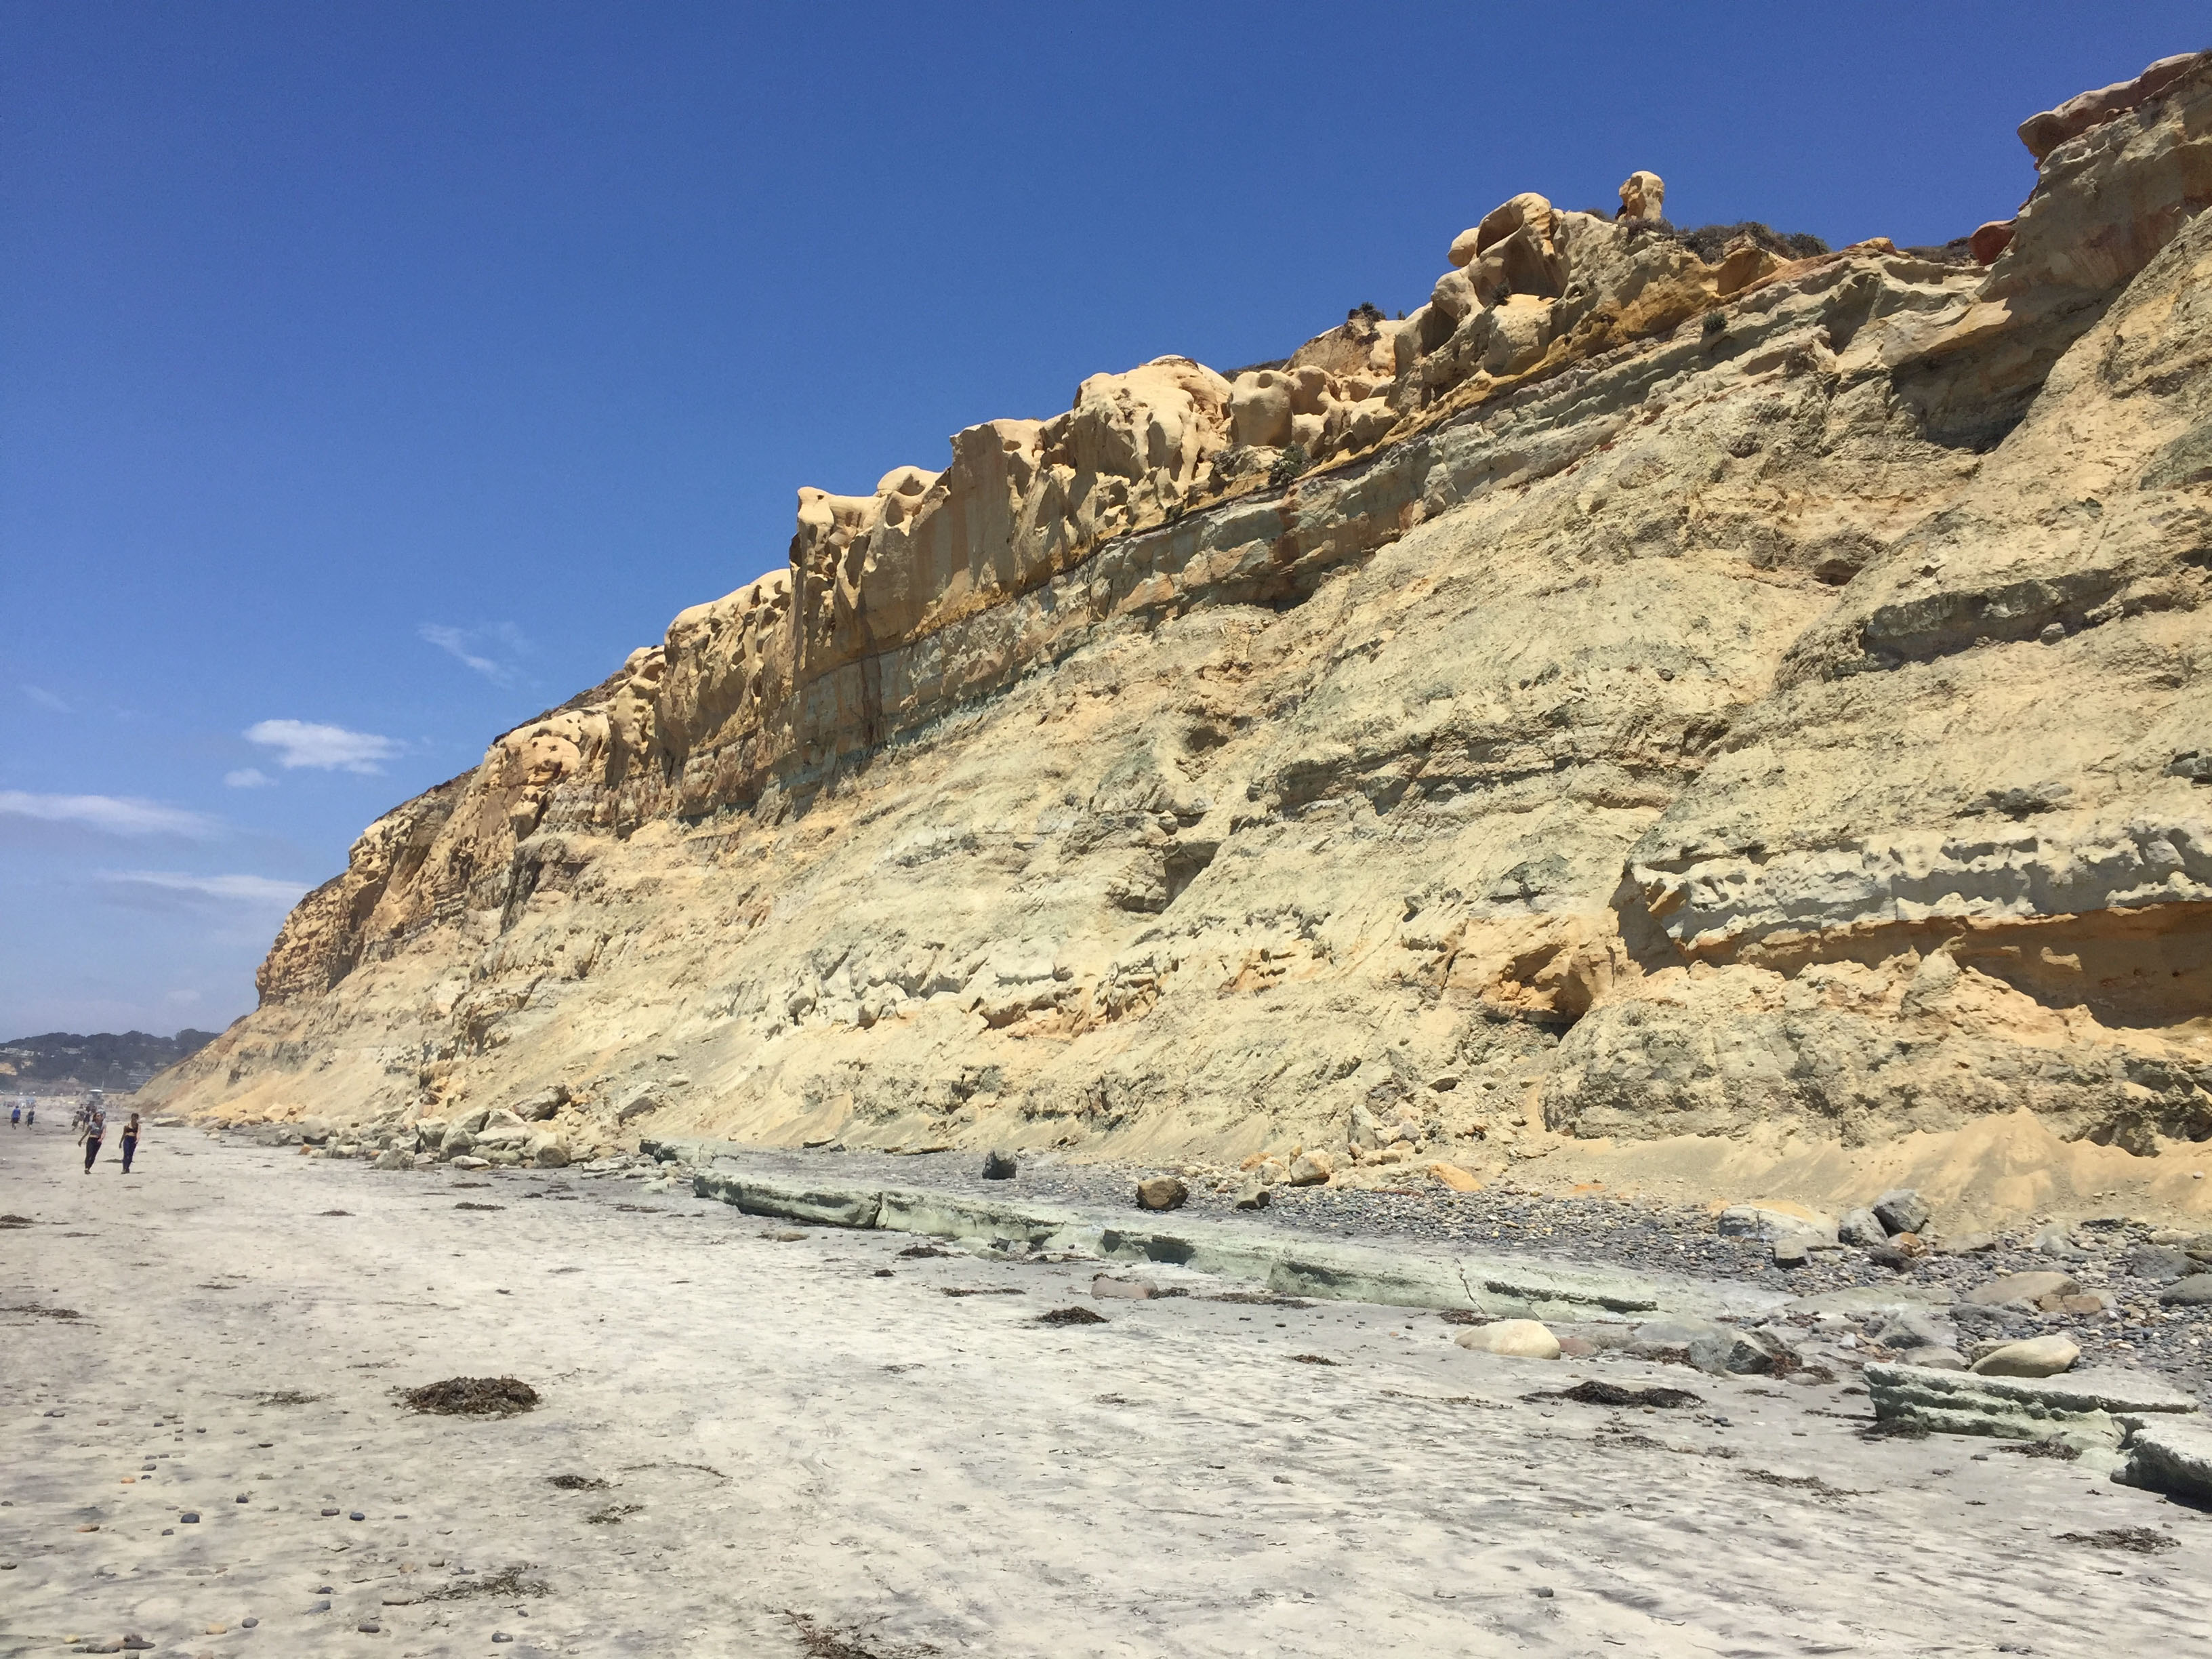
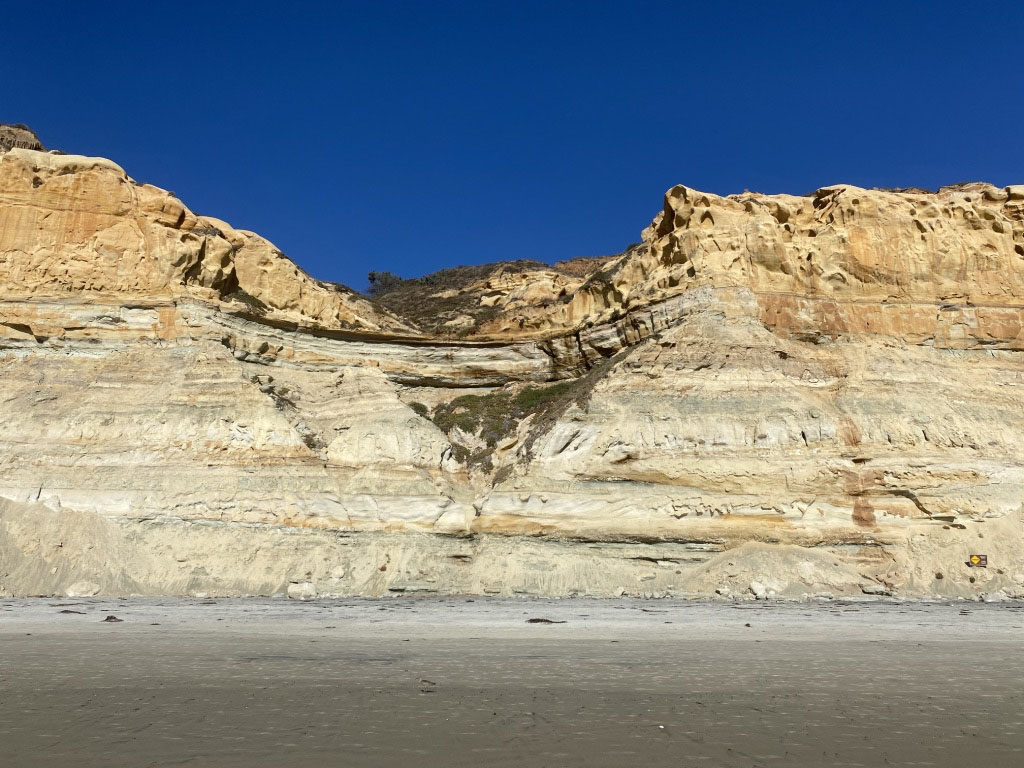
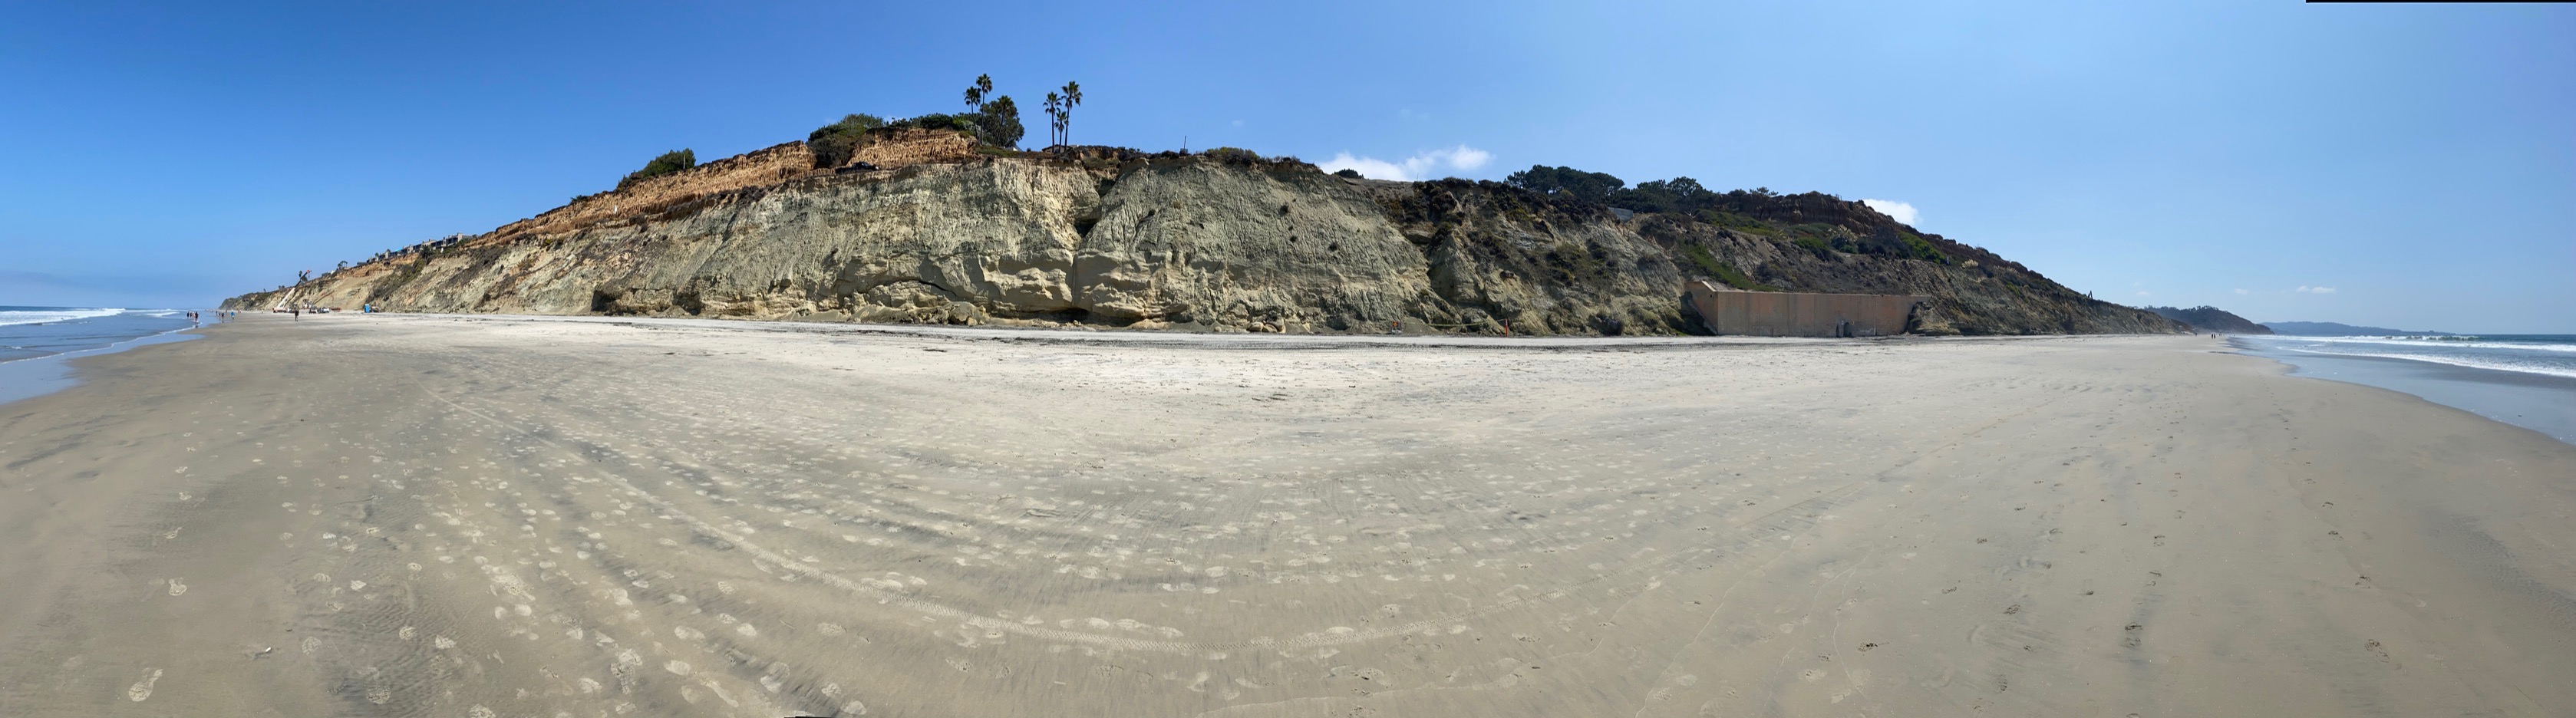
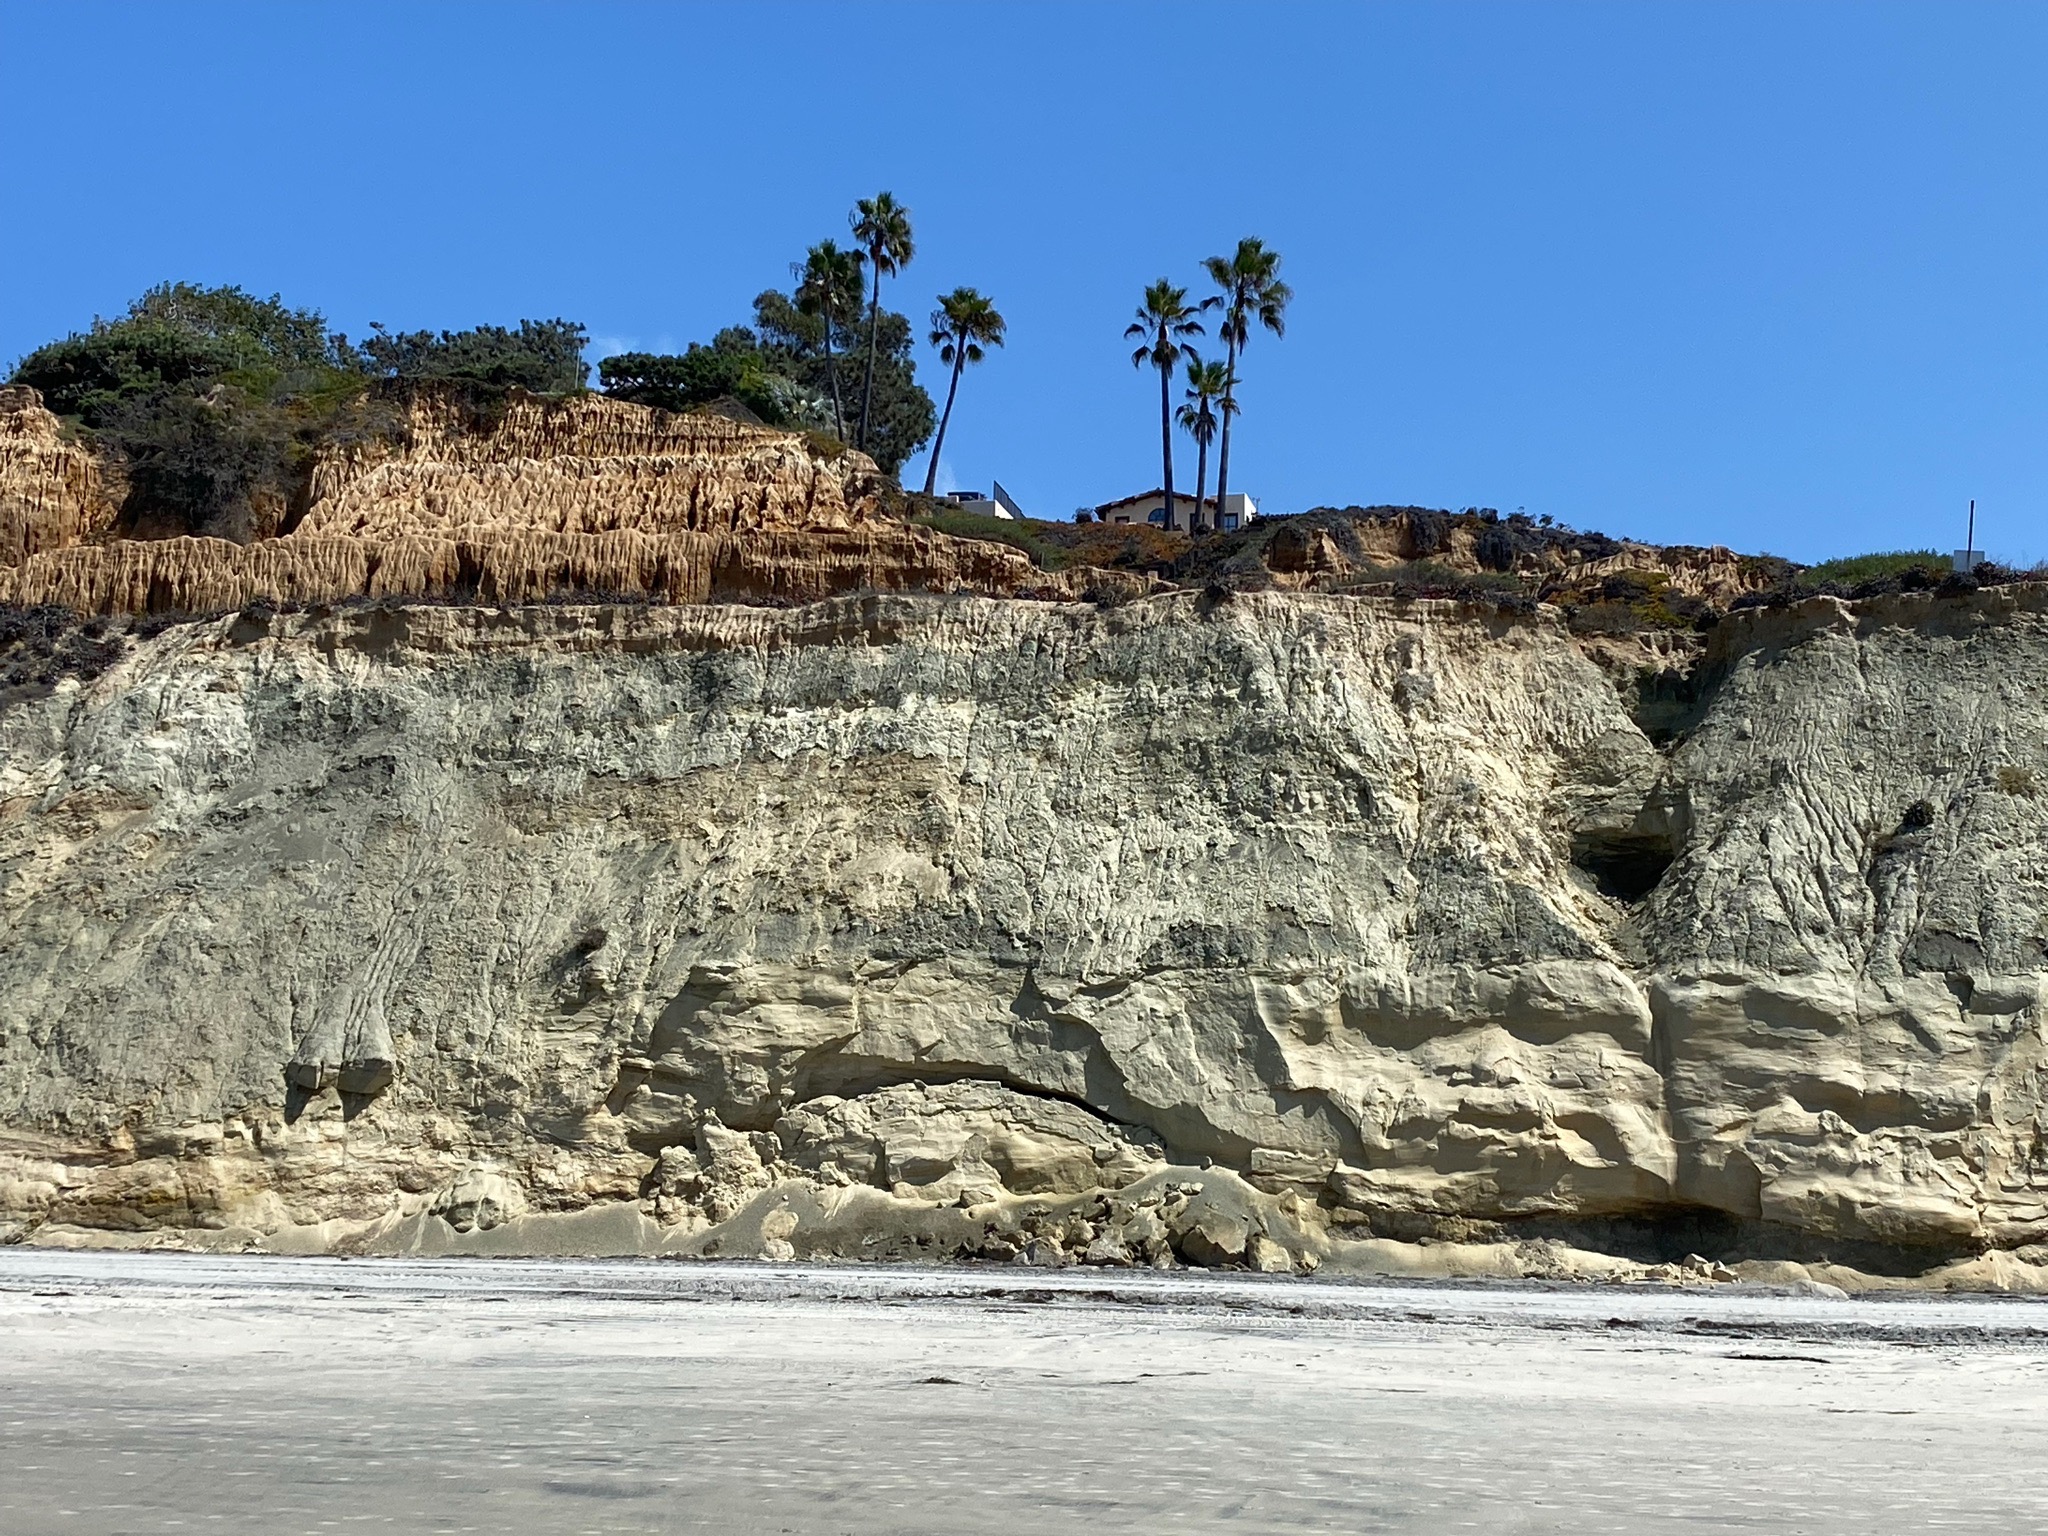
Stratigraphy of the Torrey Pines State Nature PreserveThe discussion below describes the general character of the different rock formation exposed in the Torrey Pines park area. Figure 22 show the exceptional exposures of rock formation in the sea cliffs above the beach. Note that there are many other named rock formations in the San Diego area, including many that exist in the subsurface below the modern landscape features. Those exposed in the Torrey Pines State Nature Reserve and along Torrey Pines State Beach and Blacks Beach are discussed below.The first part of the discussion focuses on the Eocene age rock formations: the Delmar Formation, Torrey Sandstone, Ardath Shale, and Scripps Formation. The next part of the discussion focuses on the much younger Pleistocene age marine terrace deposits (Lindavista and Bay Point Formations) that locally blanket (unconformably overlie) the older rock formations. |
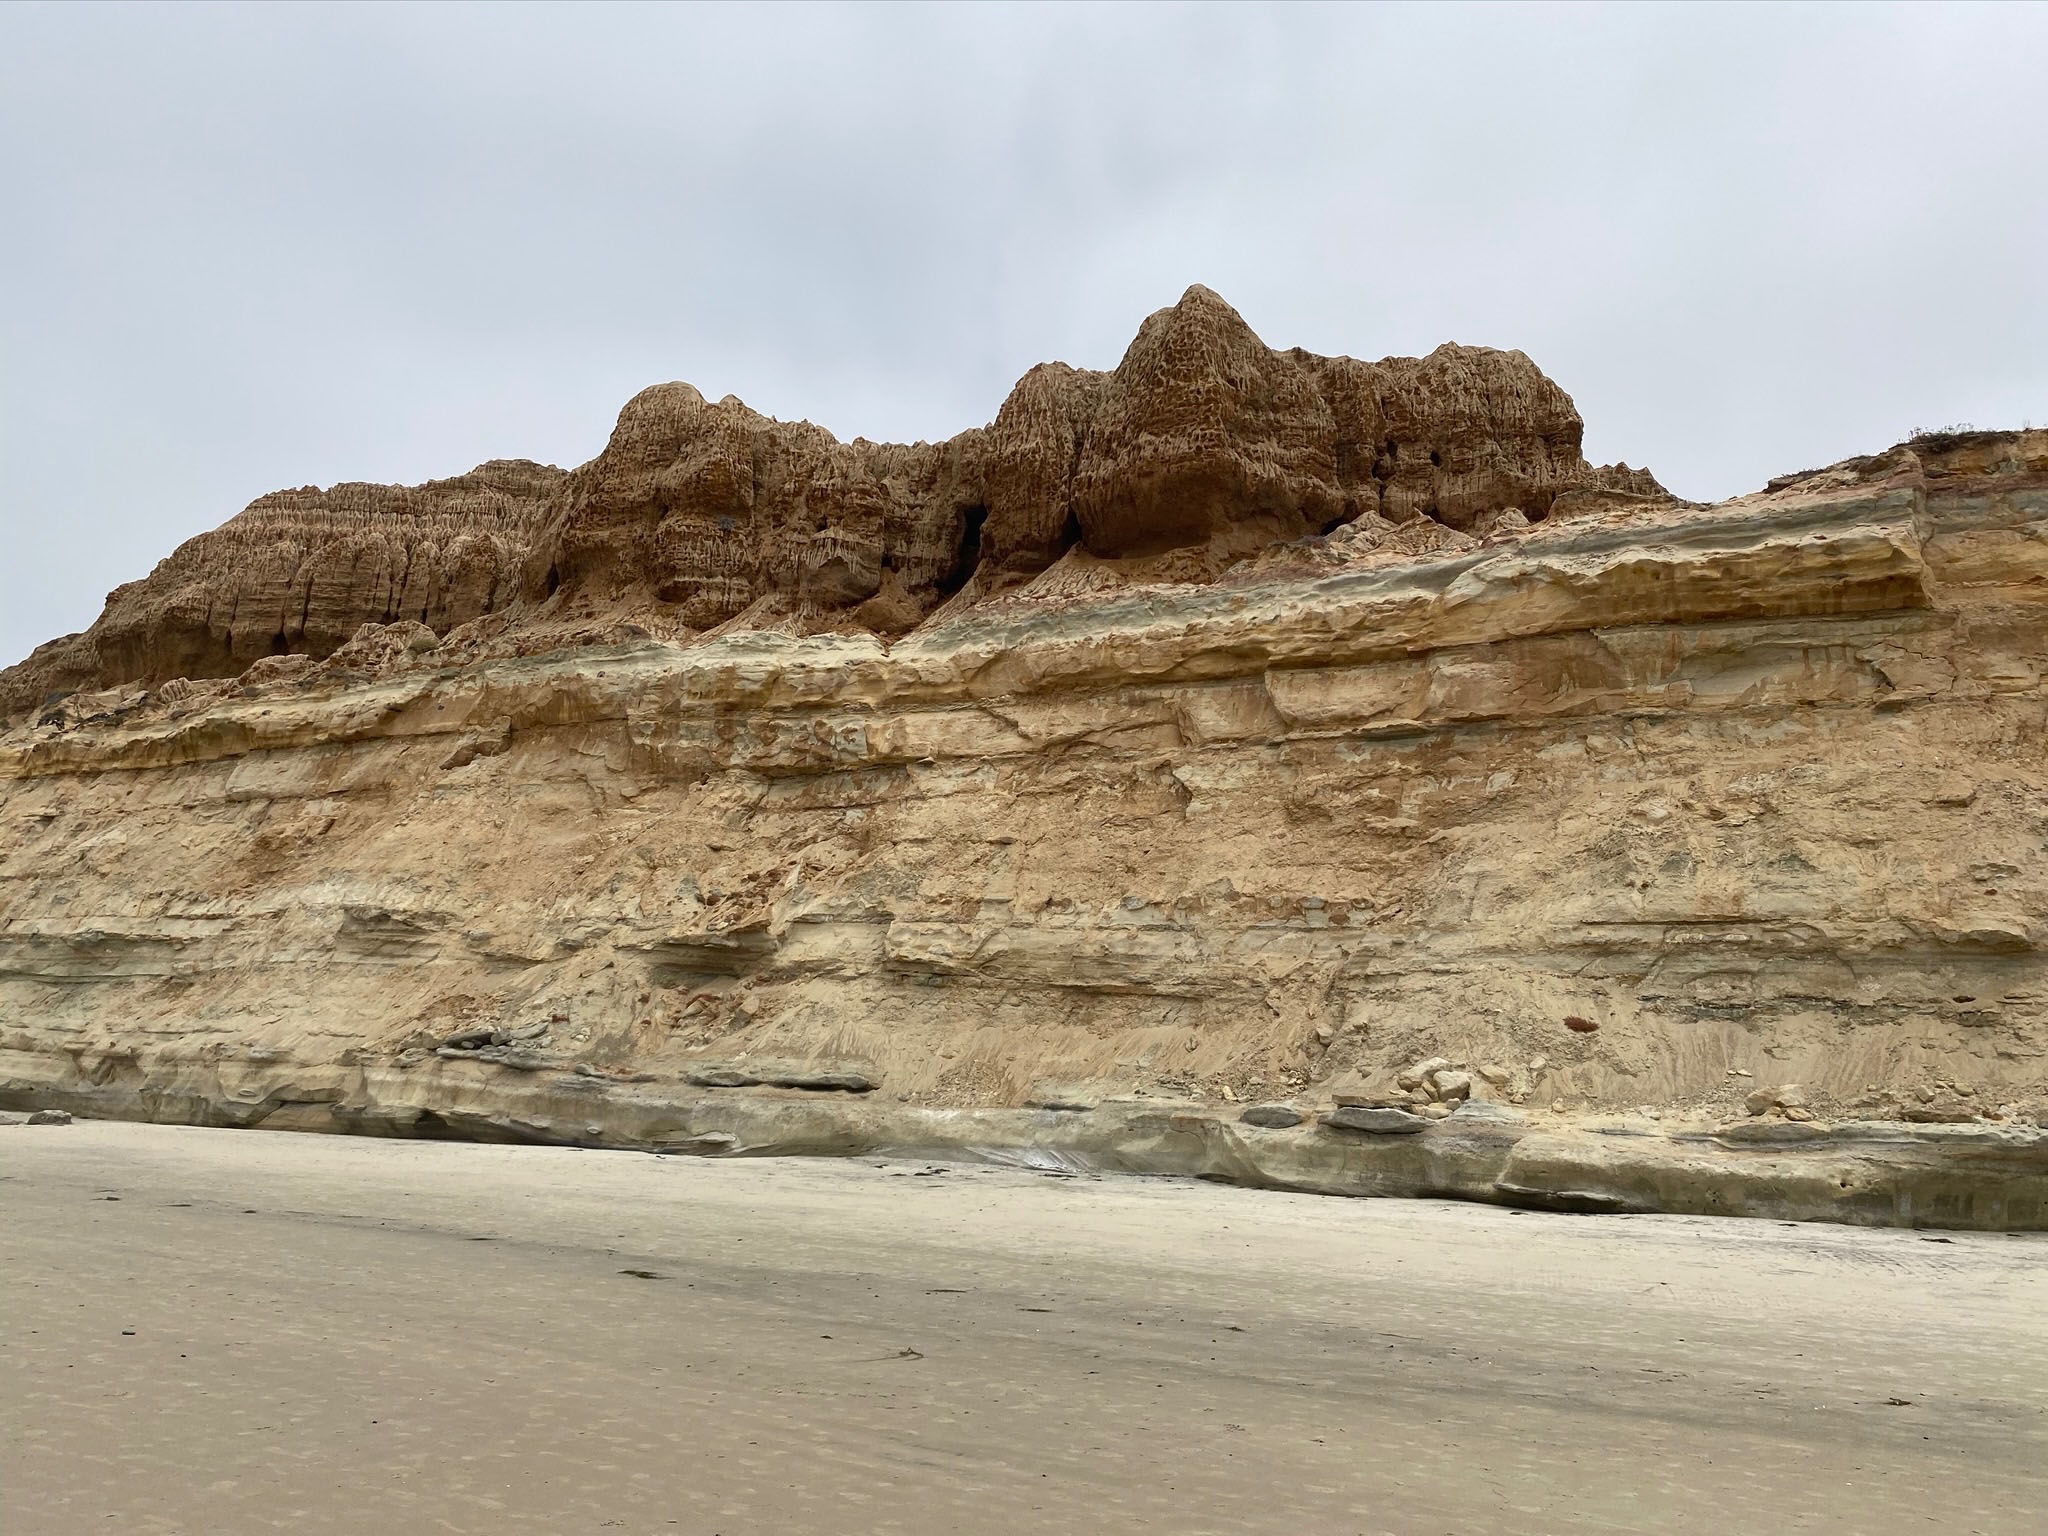 Fig. 22. View of rock formations exposed in the sea cliff at Torrey Pines. |
Delmar FormationThe Delmar Formation is exposed only at the base of the sea cliffs from just south of the main reserve entrance and parking area to just south of Flat Rock, —a small sea stack adjacent to a small headland in the sea cliff that defines the boundary between Torrey Pines State Beach (to the north) and Blacks Beach (to the south). The Delmar Formation is exposed in the lower seacliffs from Torrey Pines northward to parts of Del Mar, Solana Beach, Encinitas, and Carlsbad. Elsewhere it is not exposed (below the surface), it transitions to another named rock unit, or it is missing (eroded away or never deposited). |
|


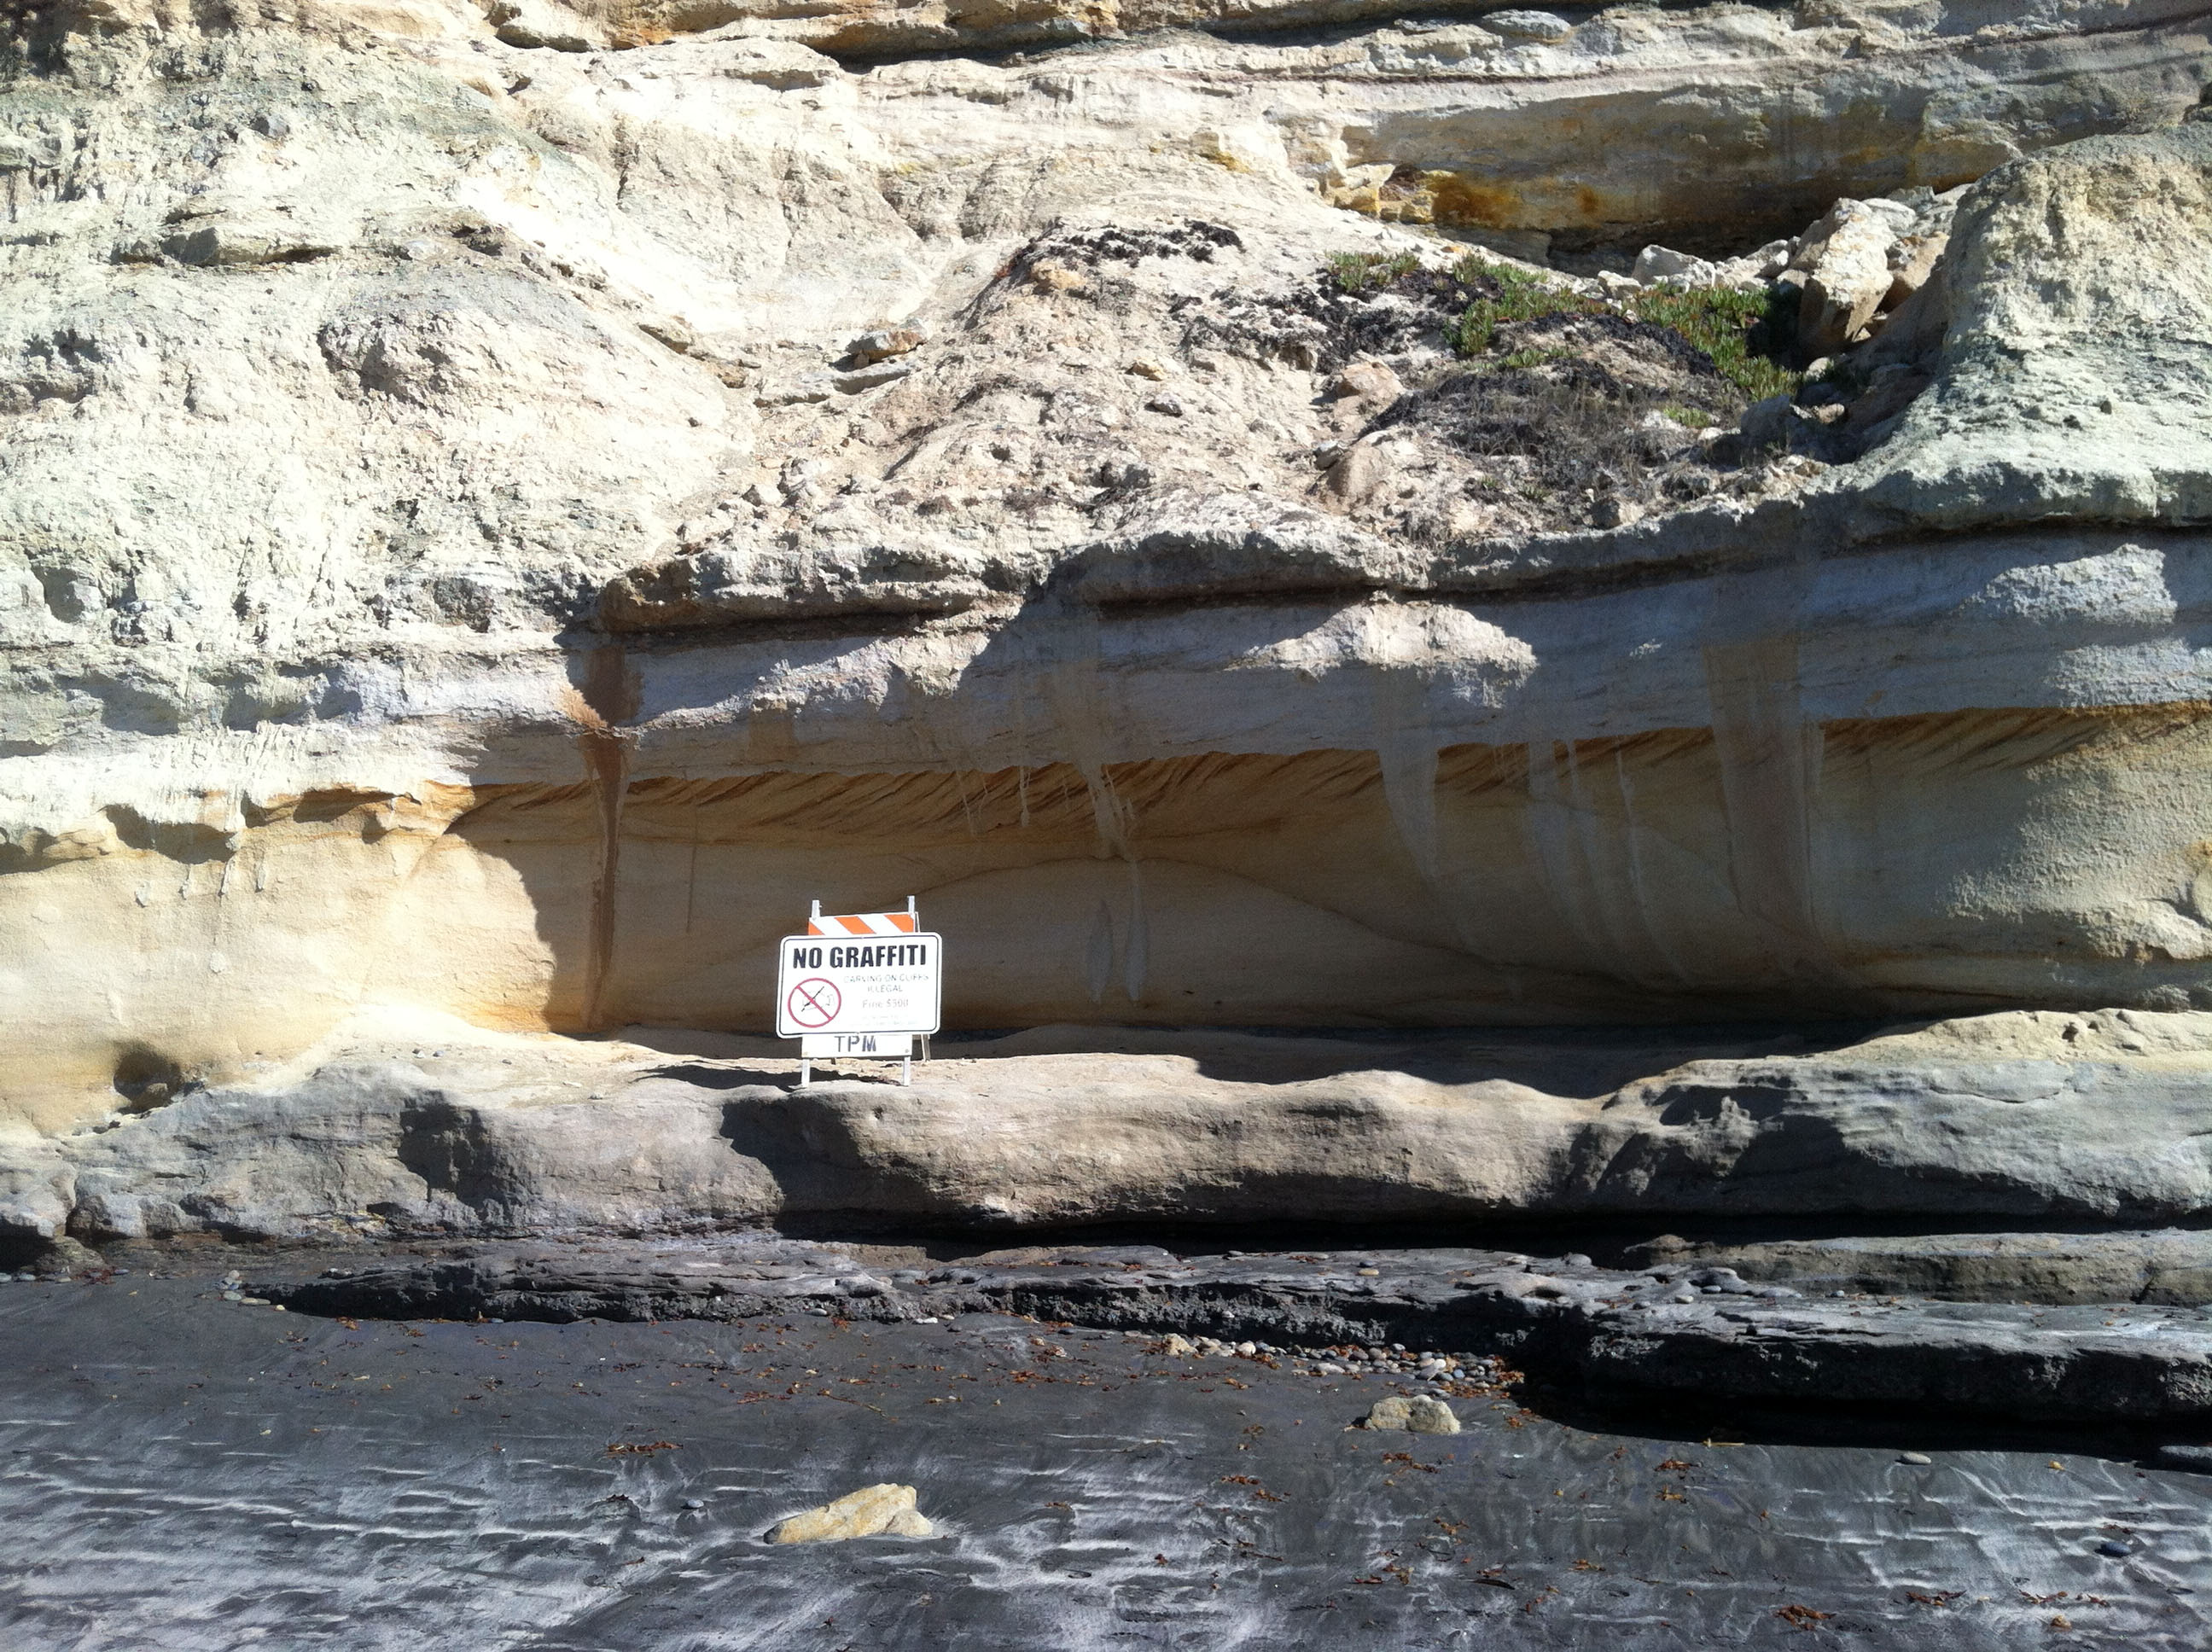
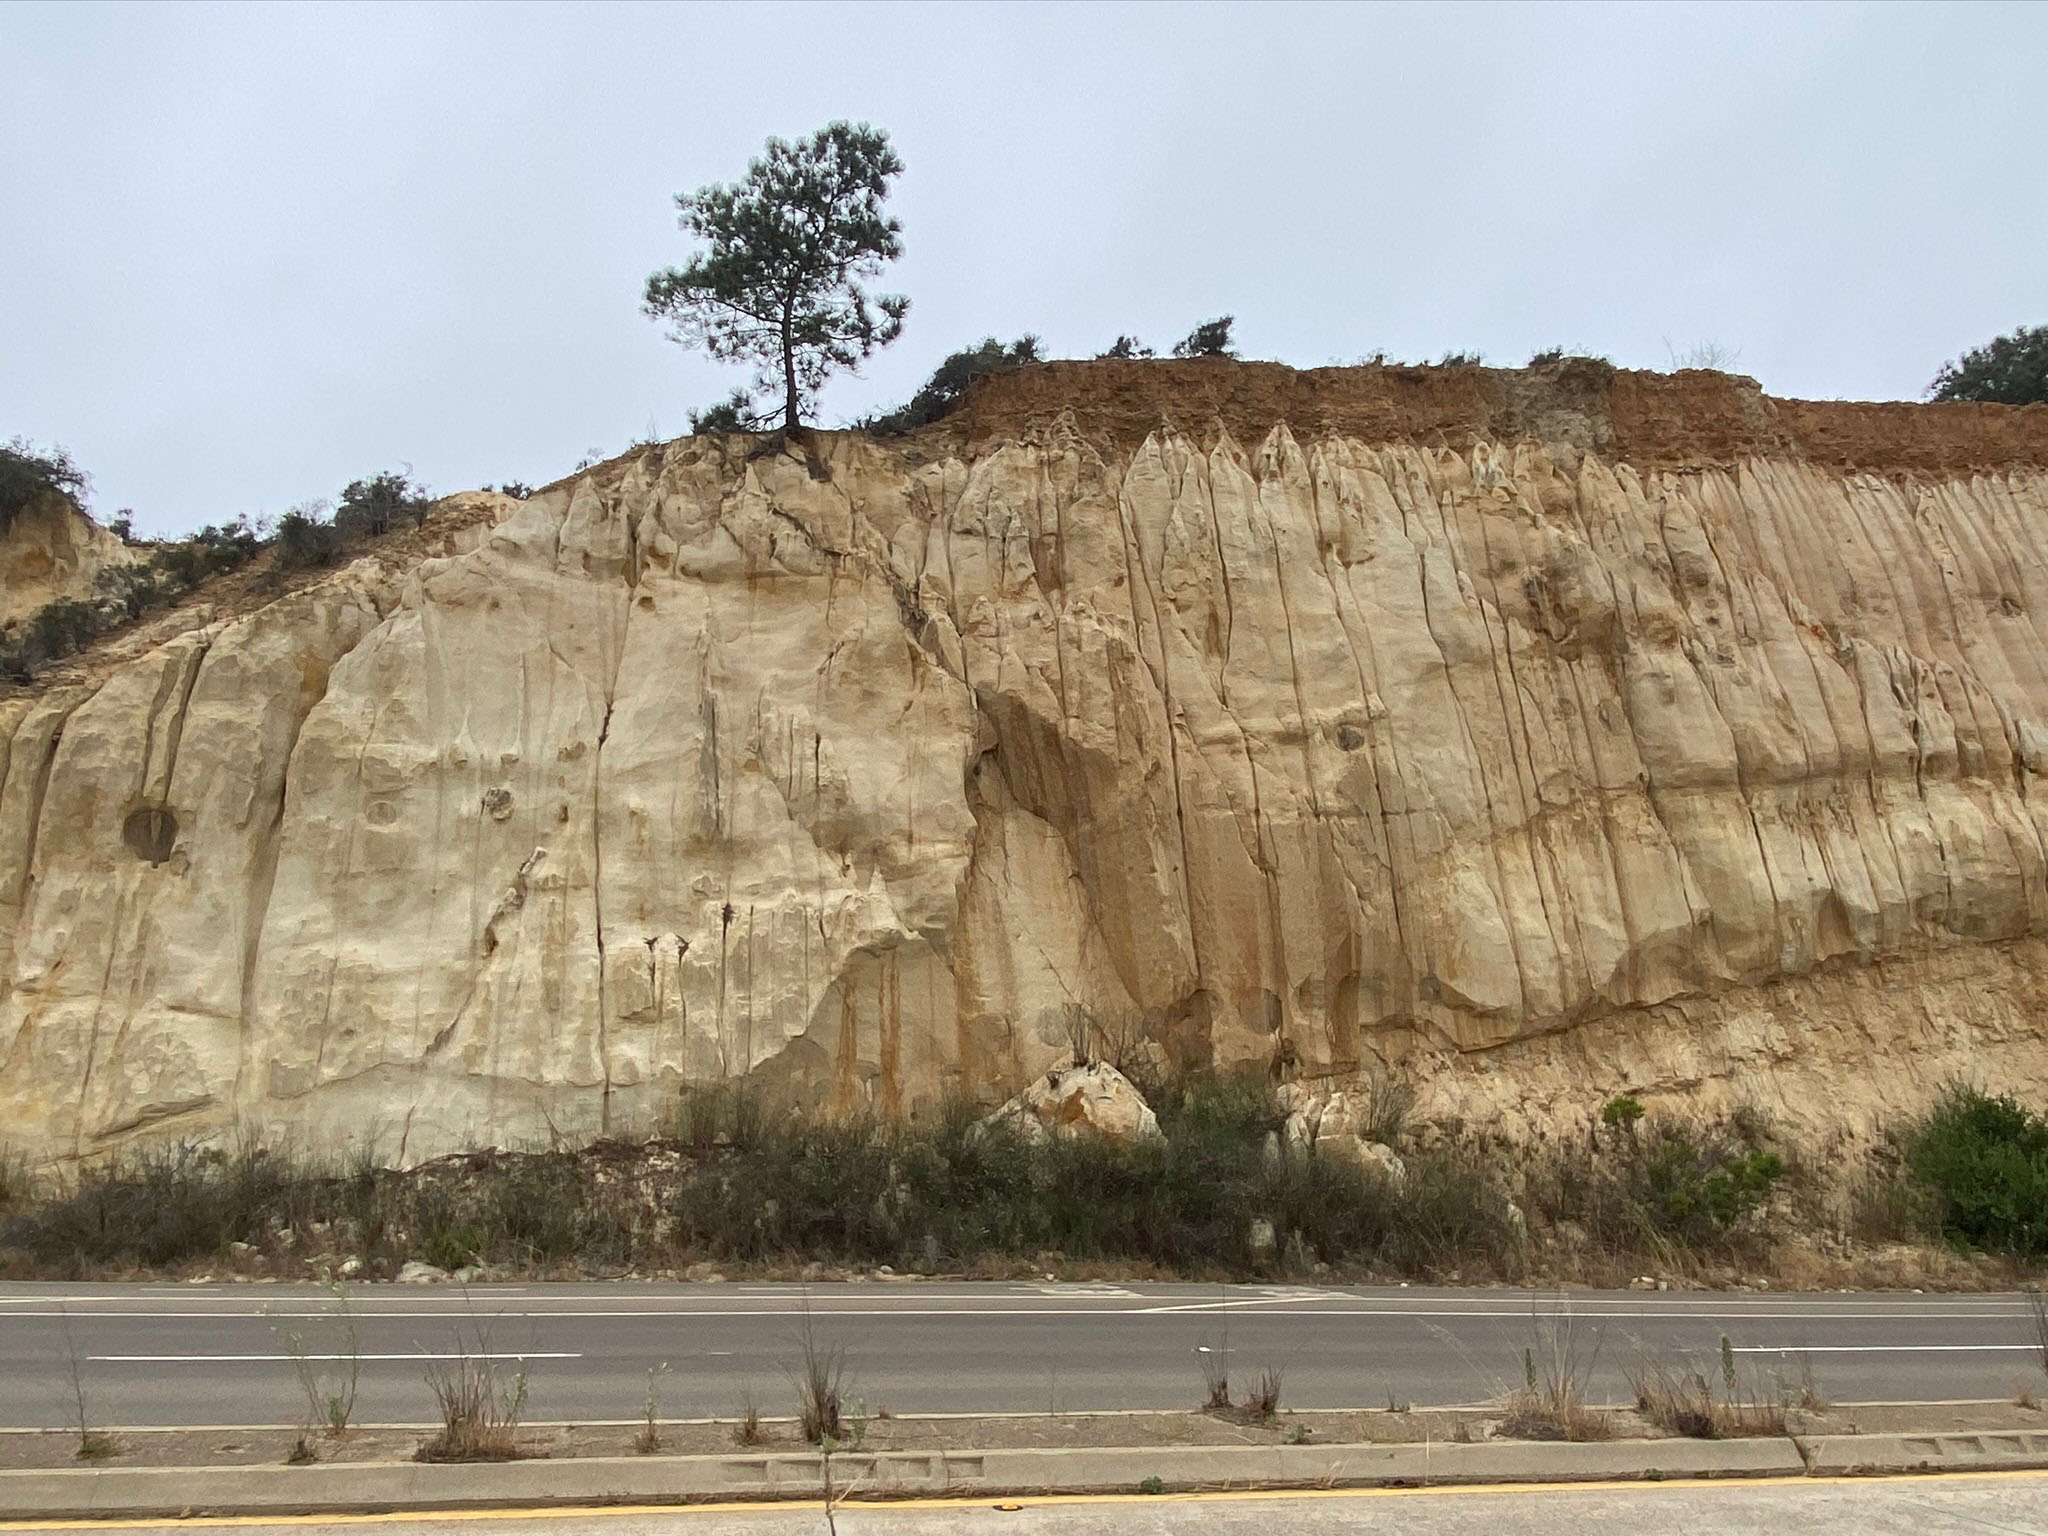
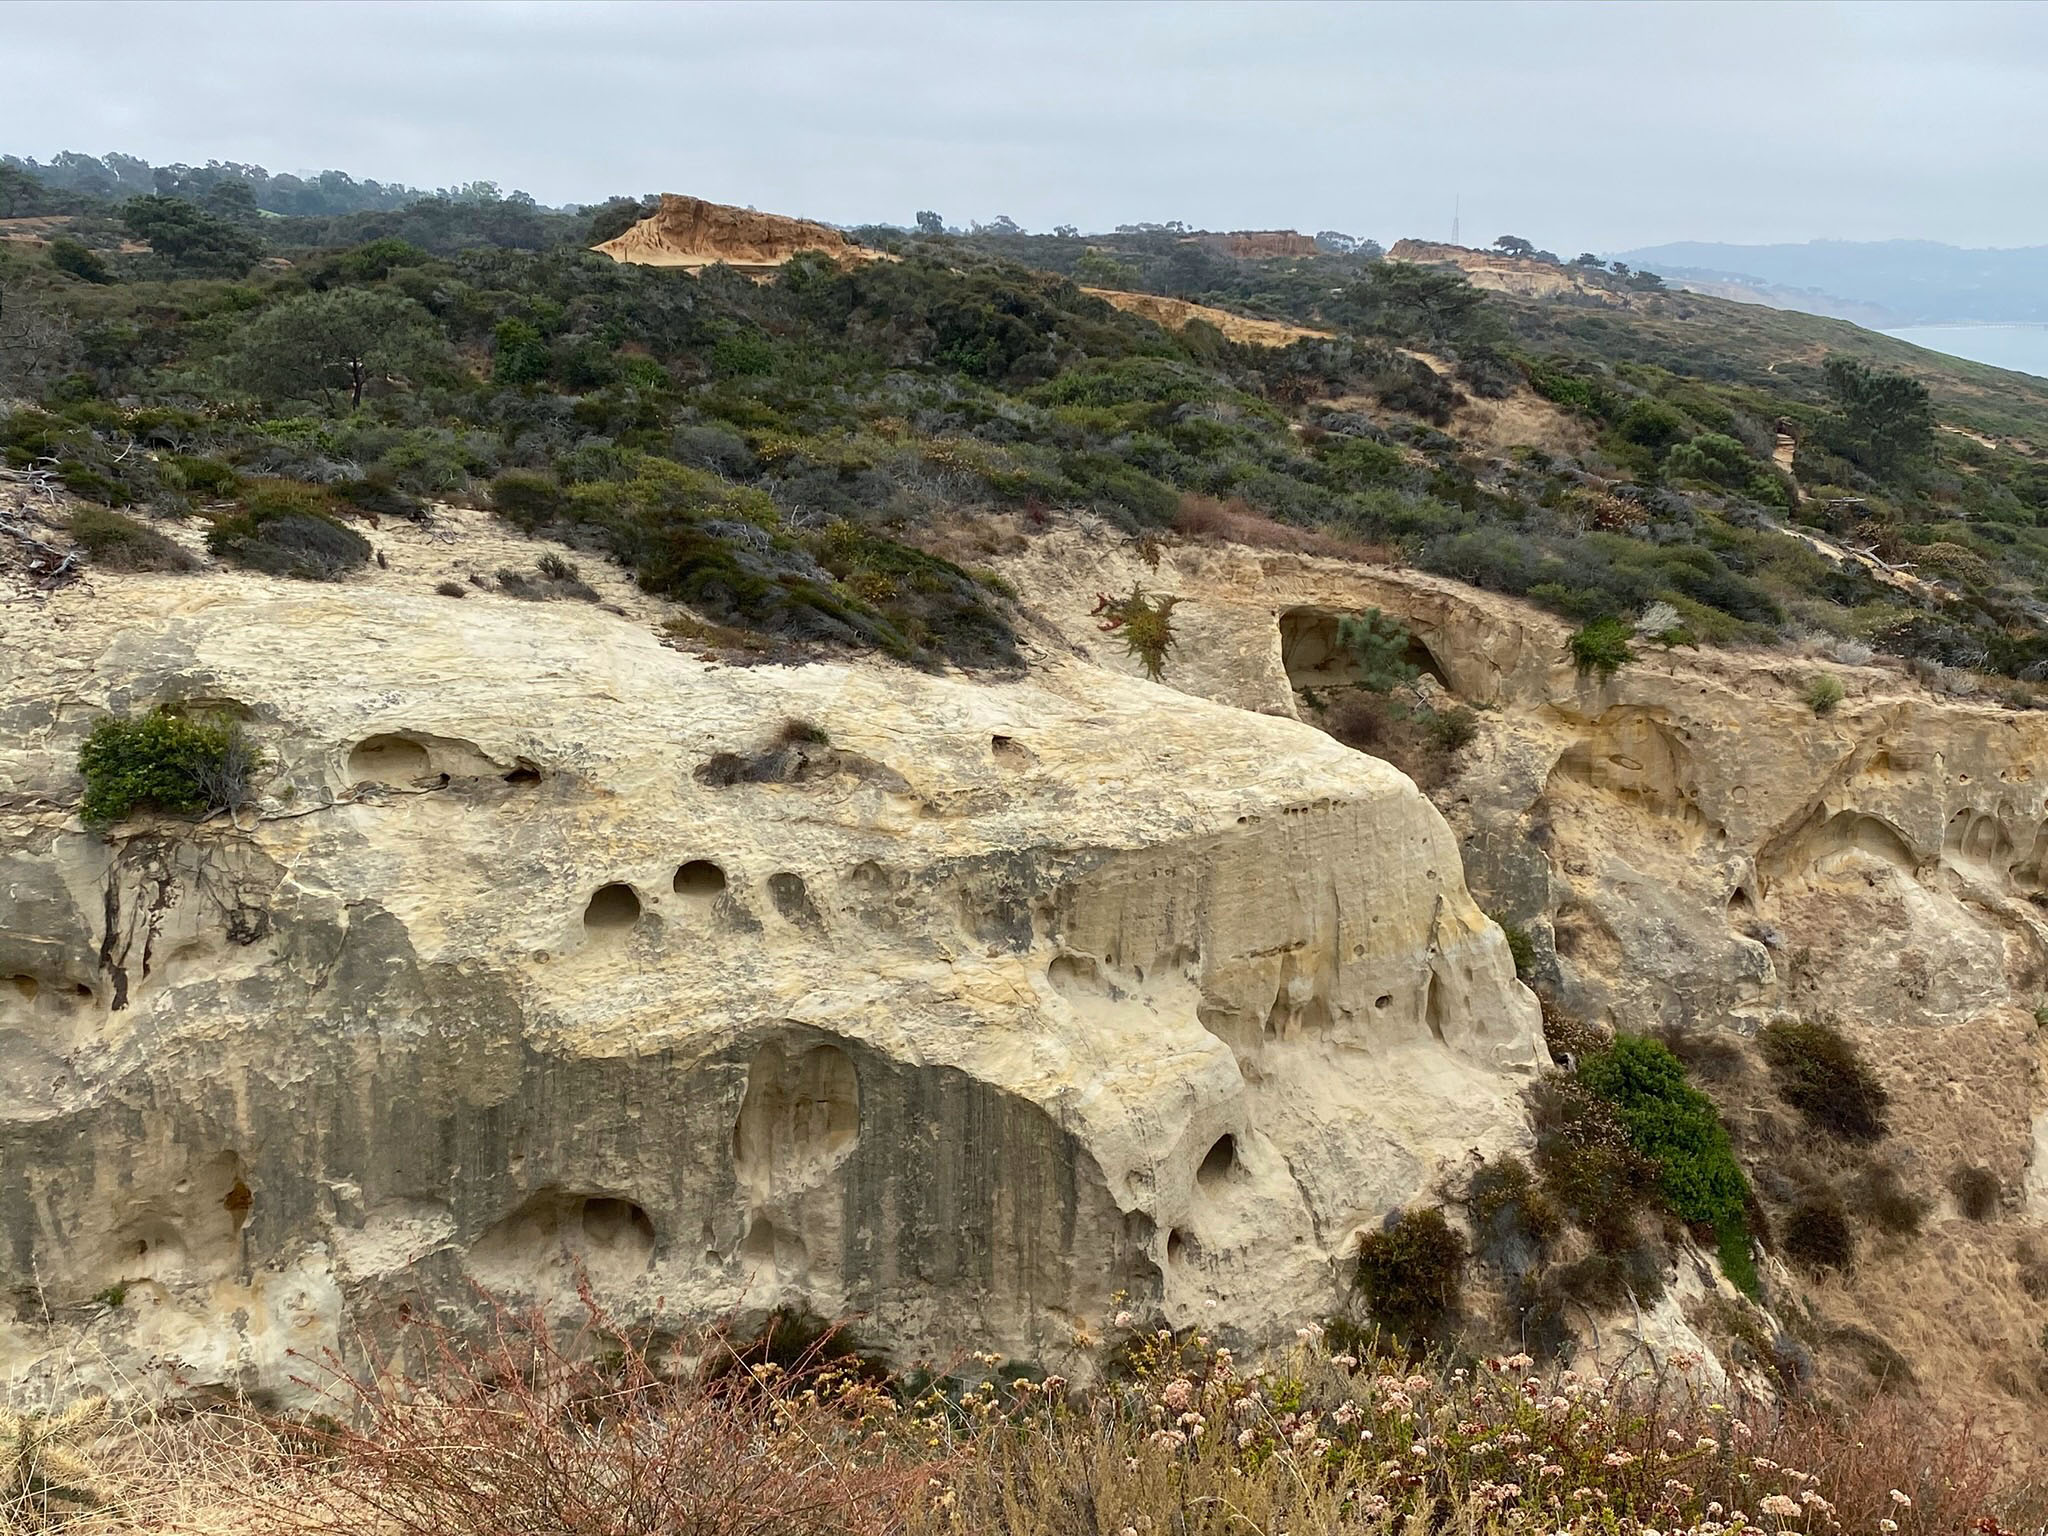
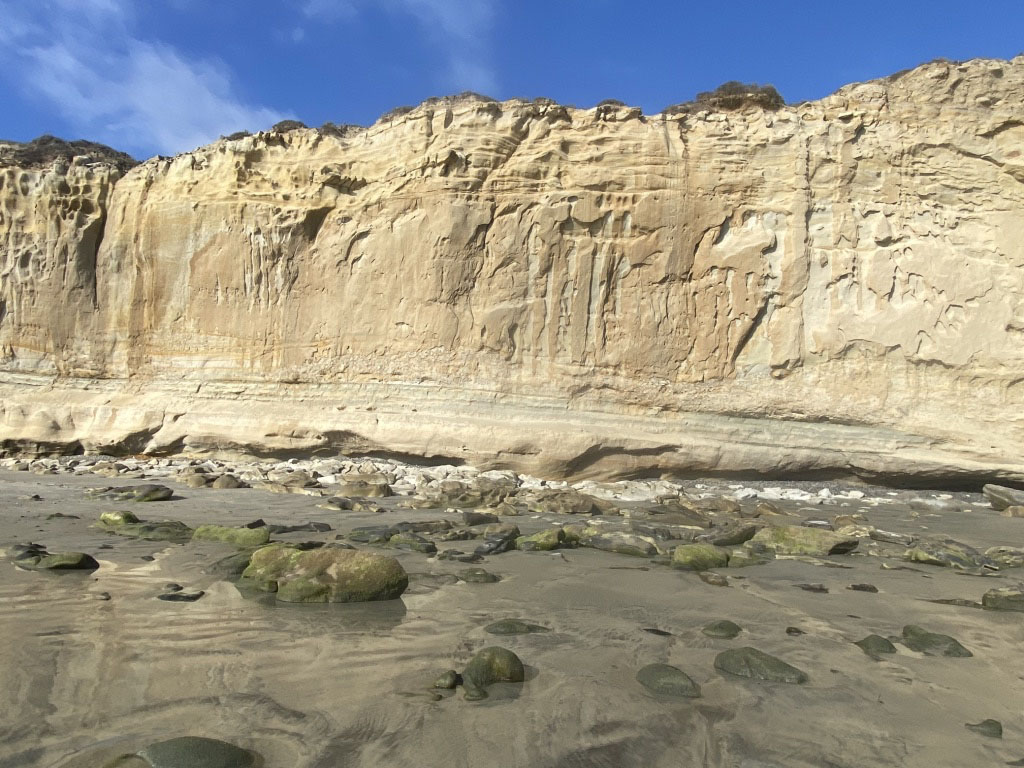
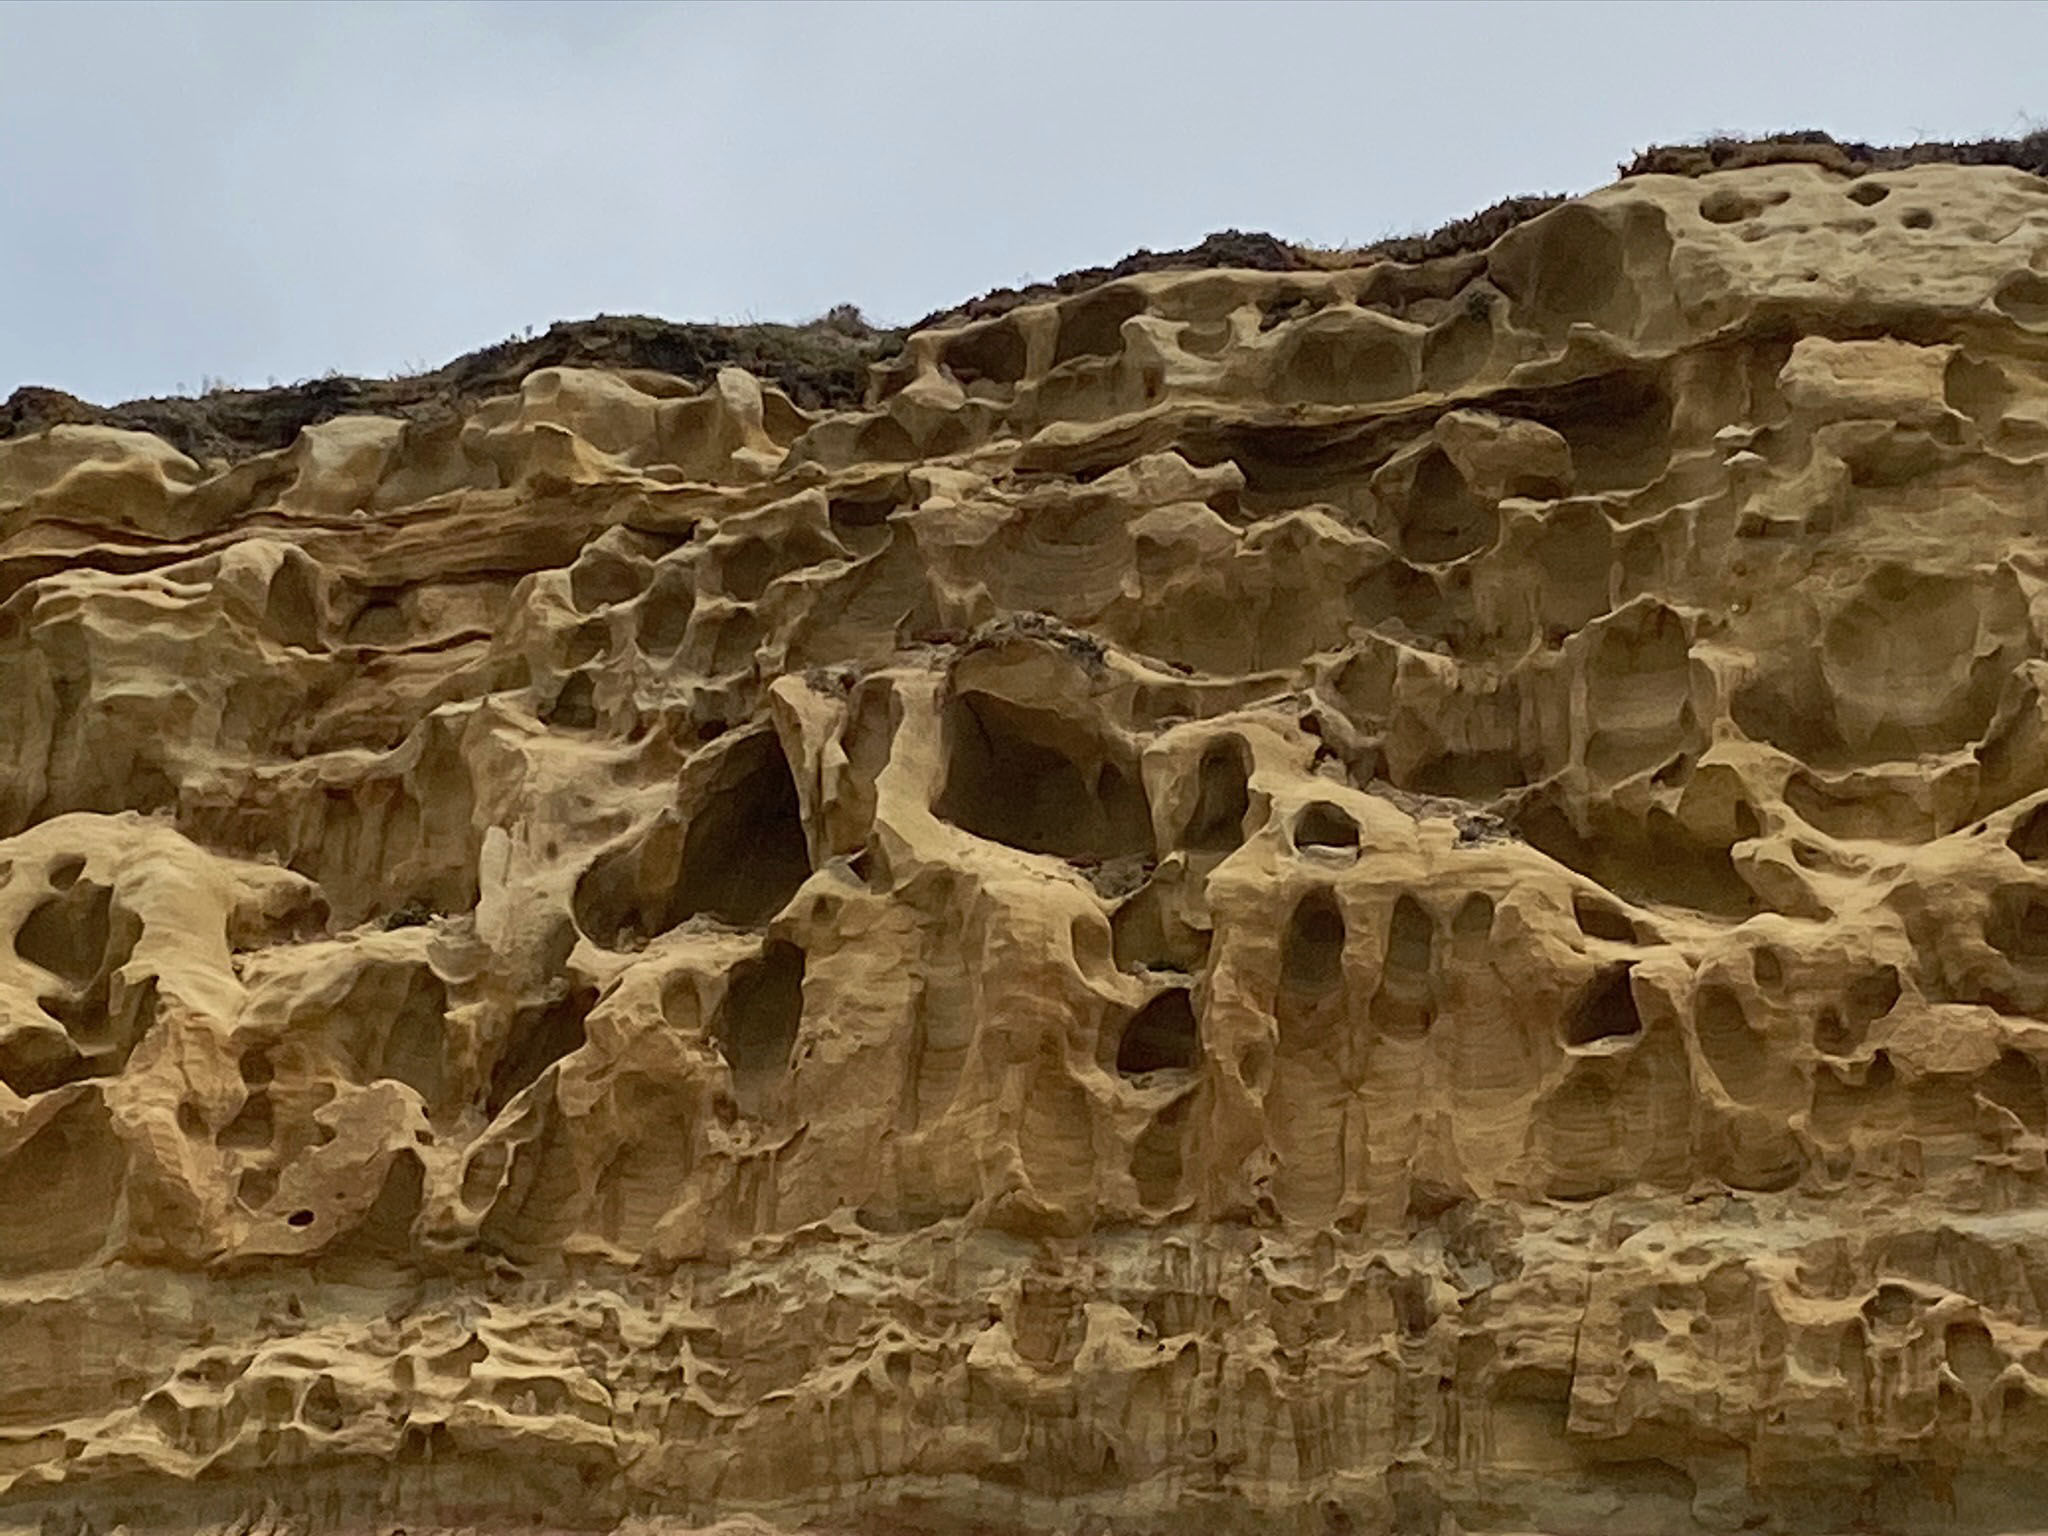
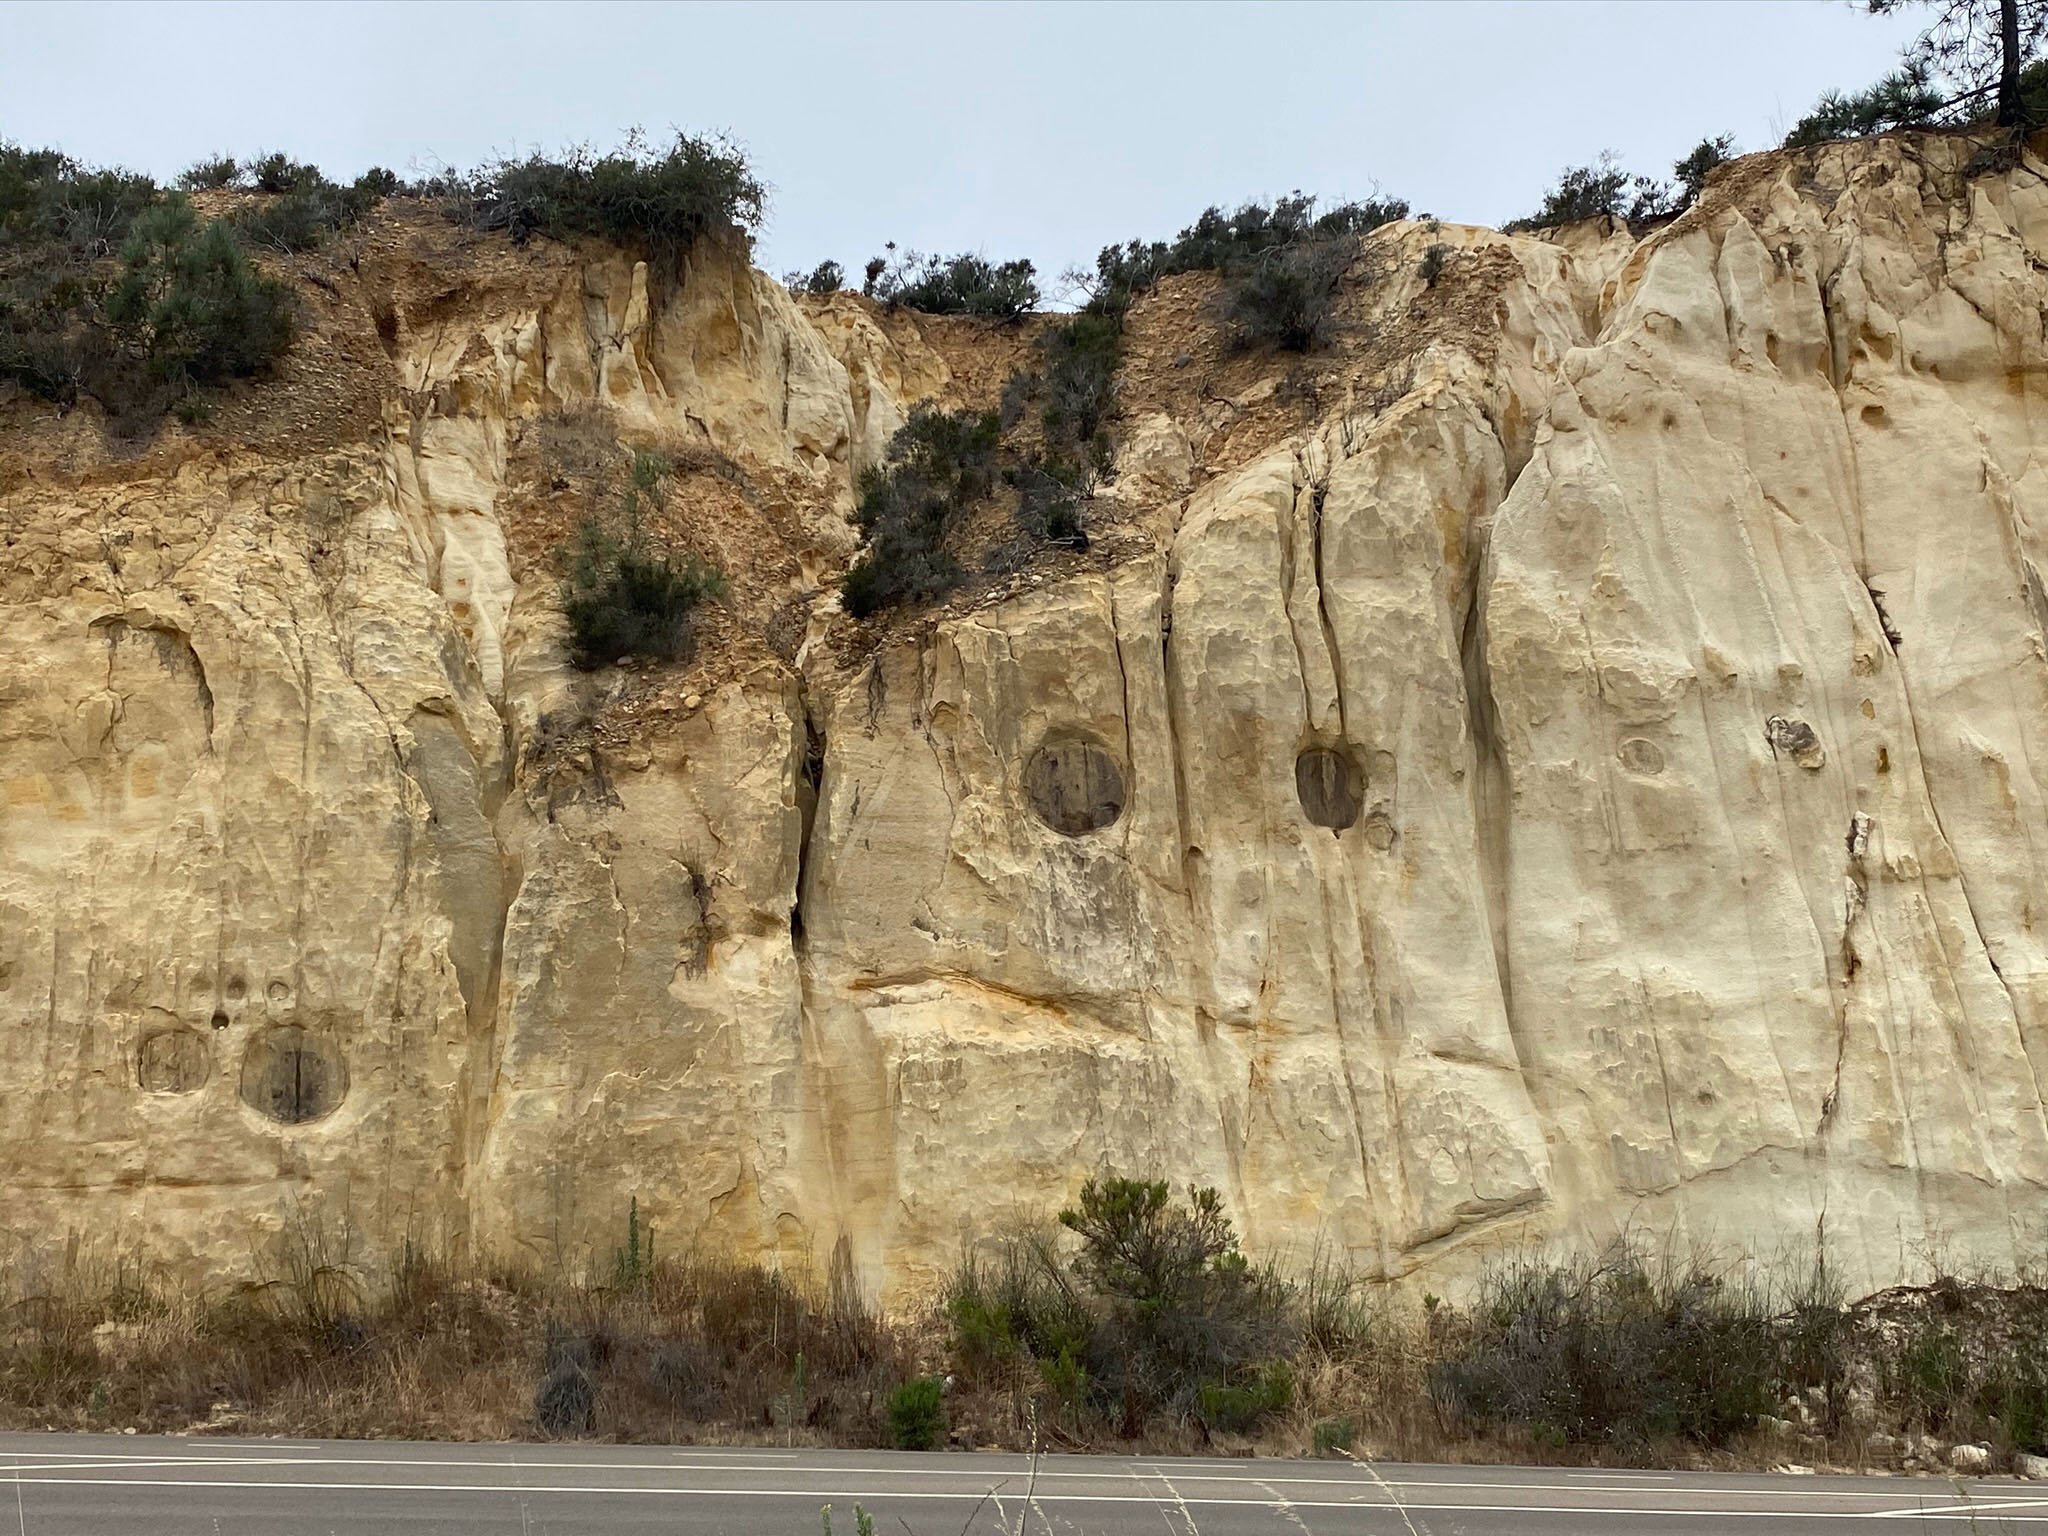
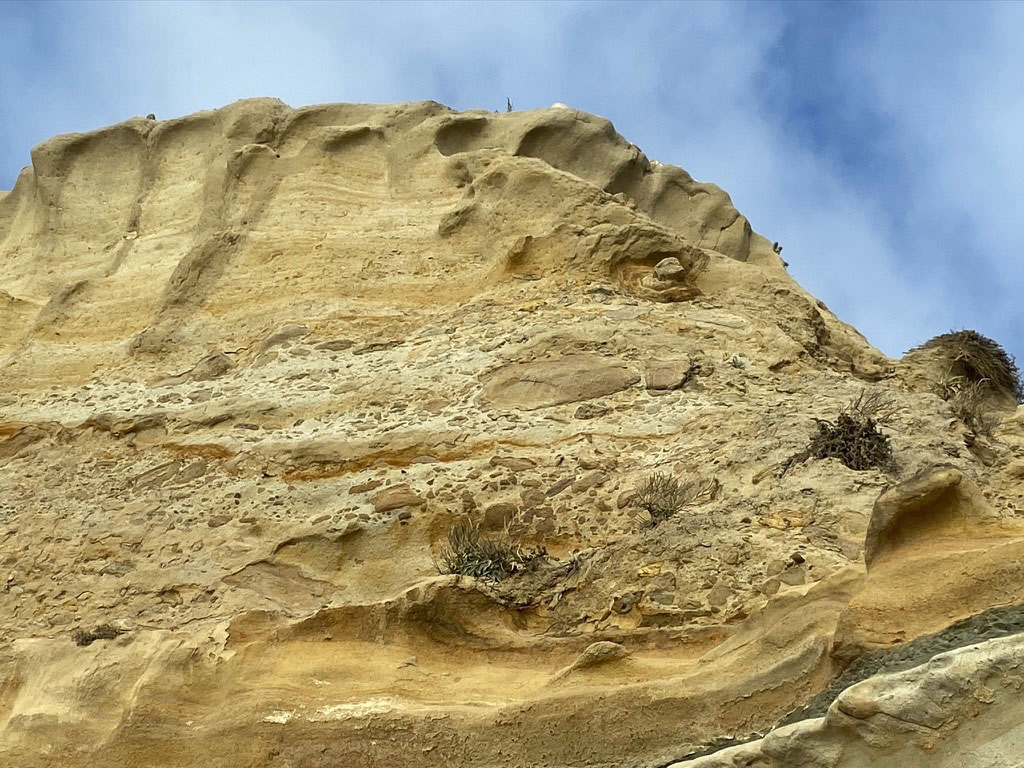
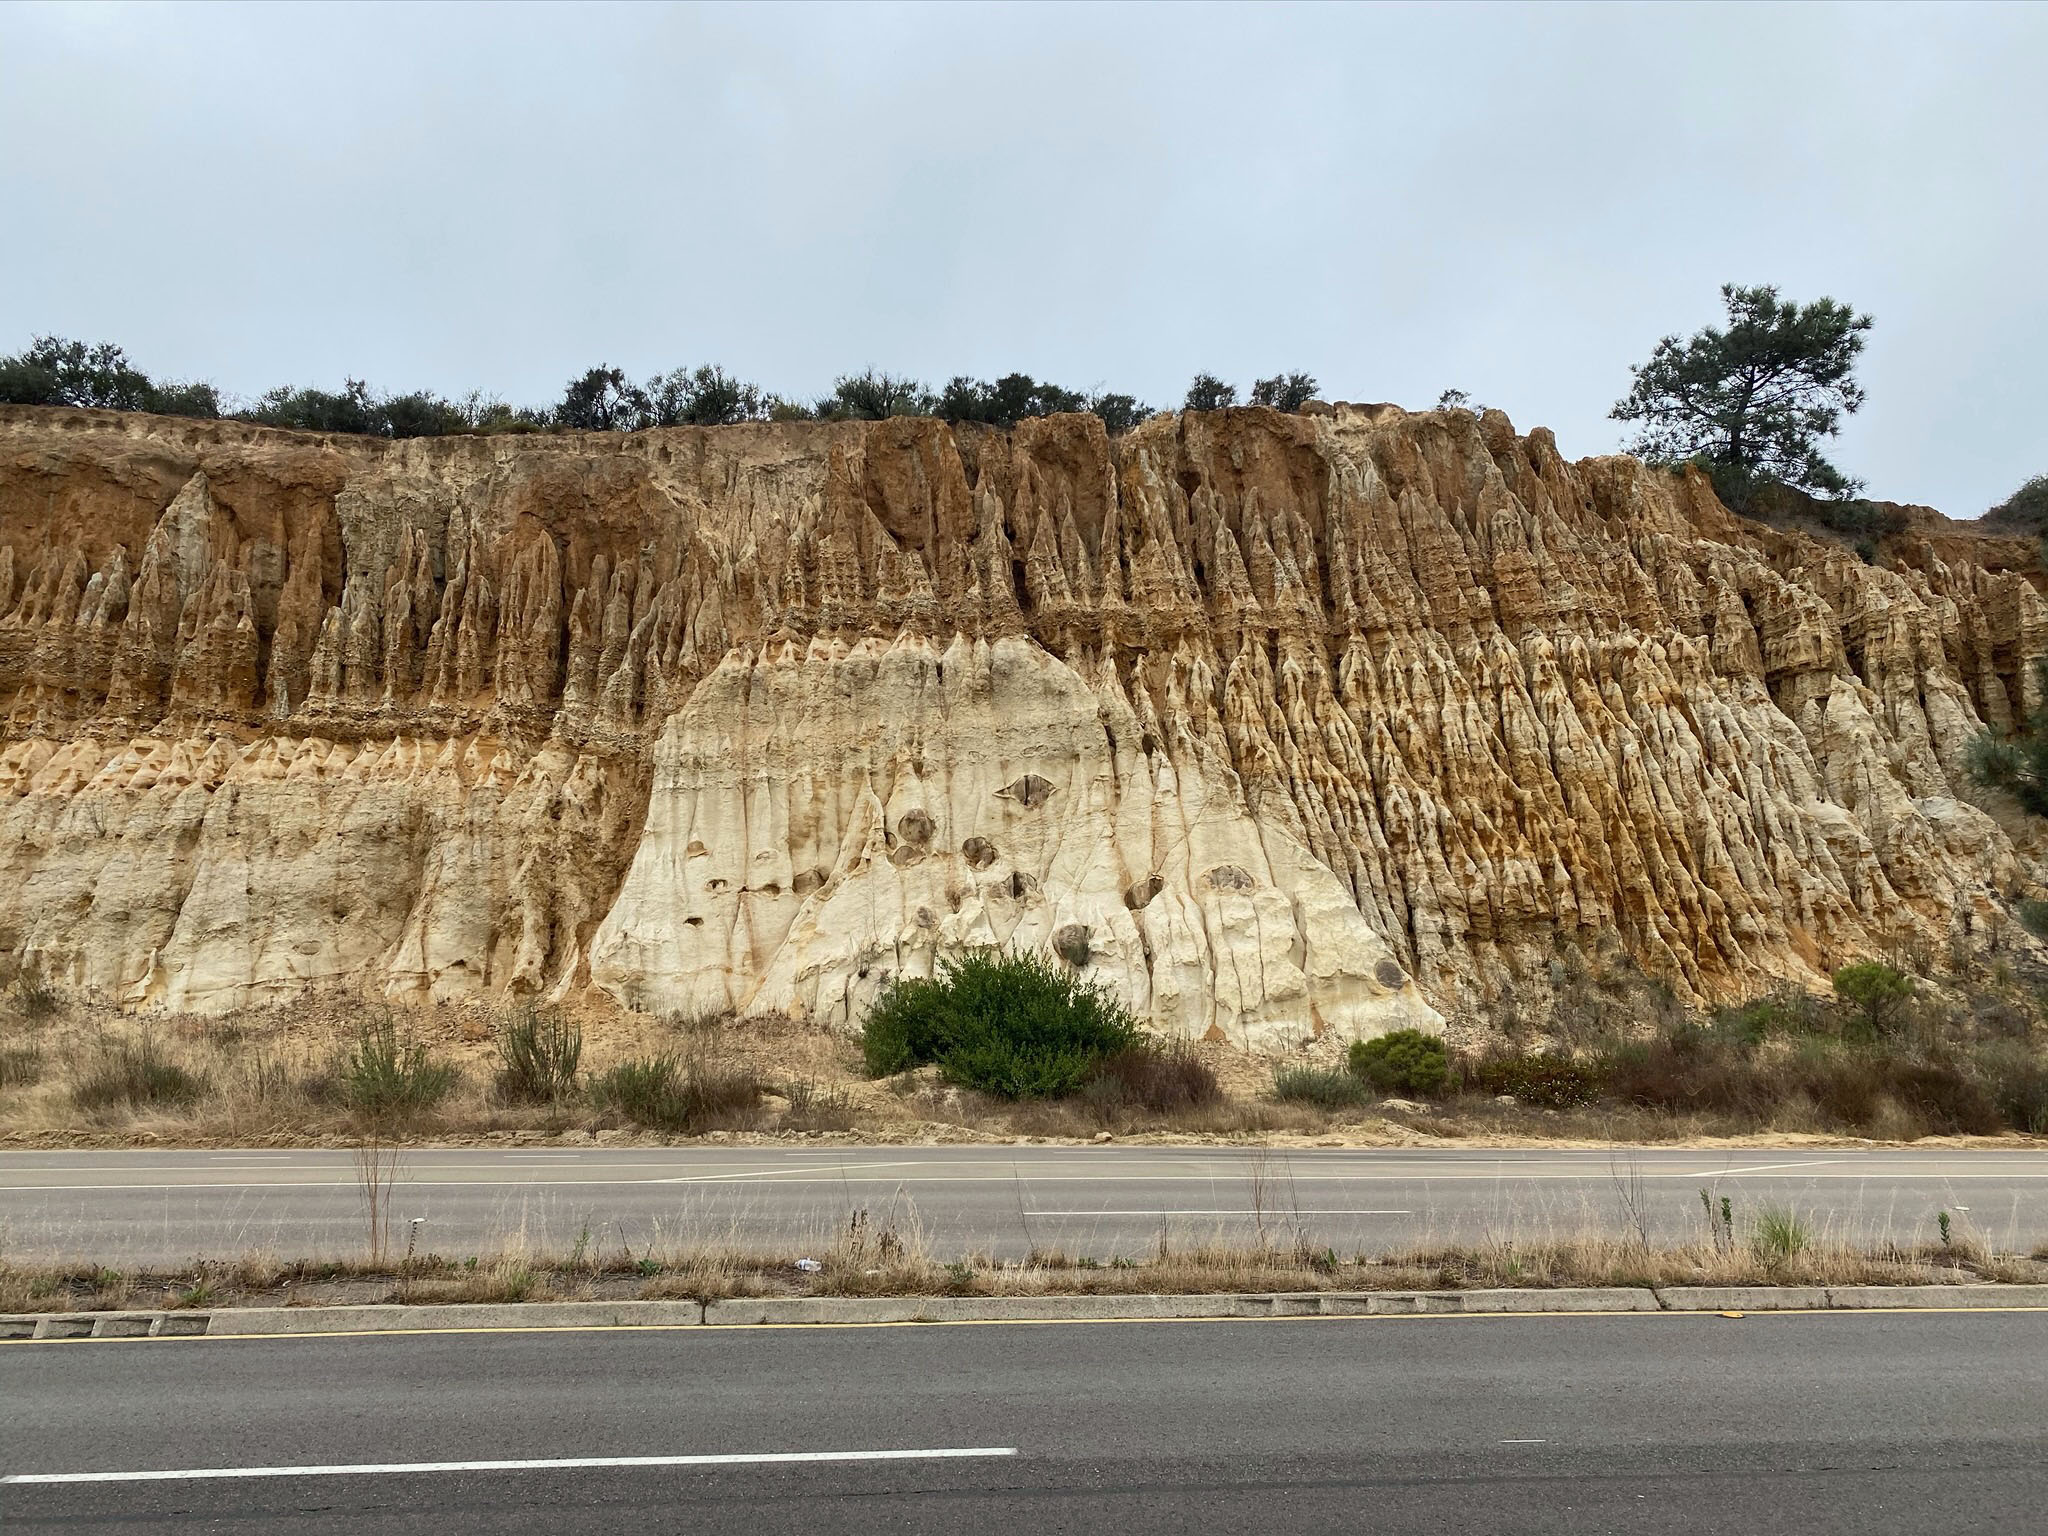
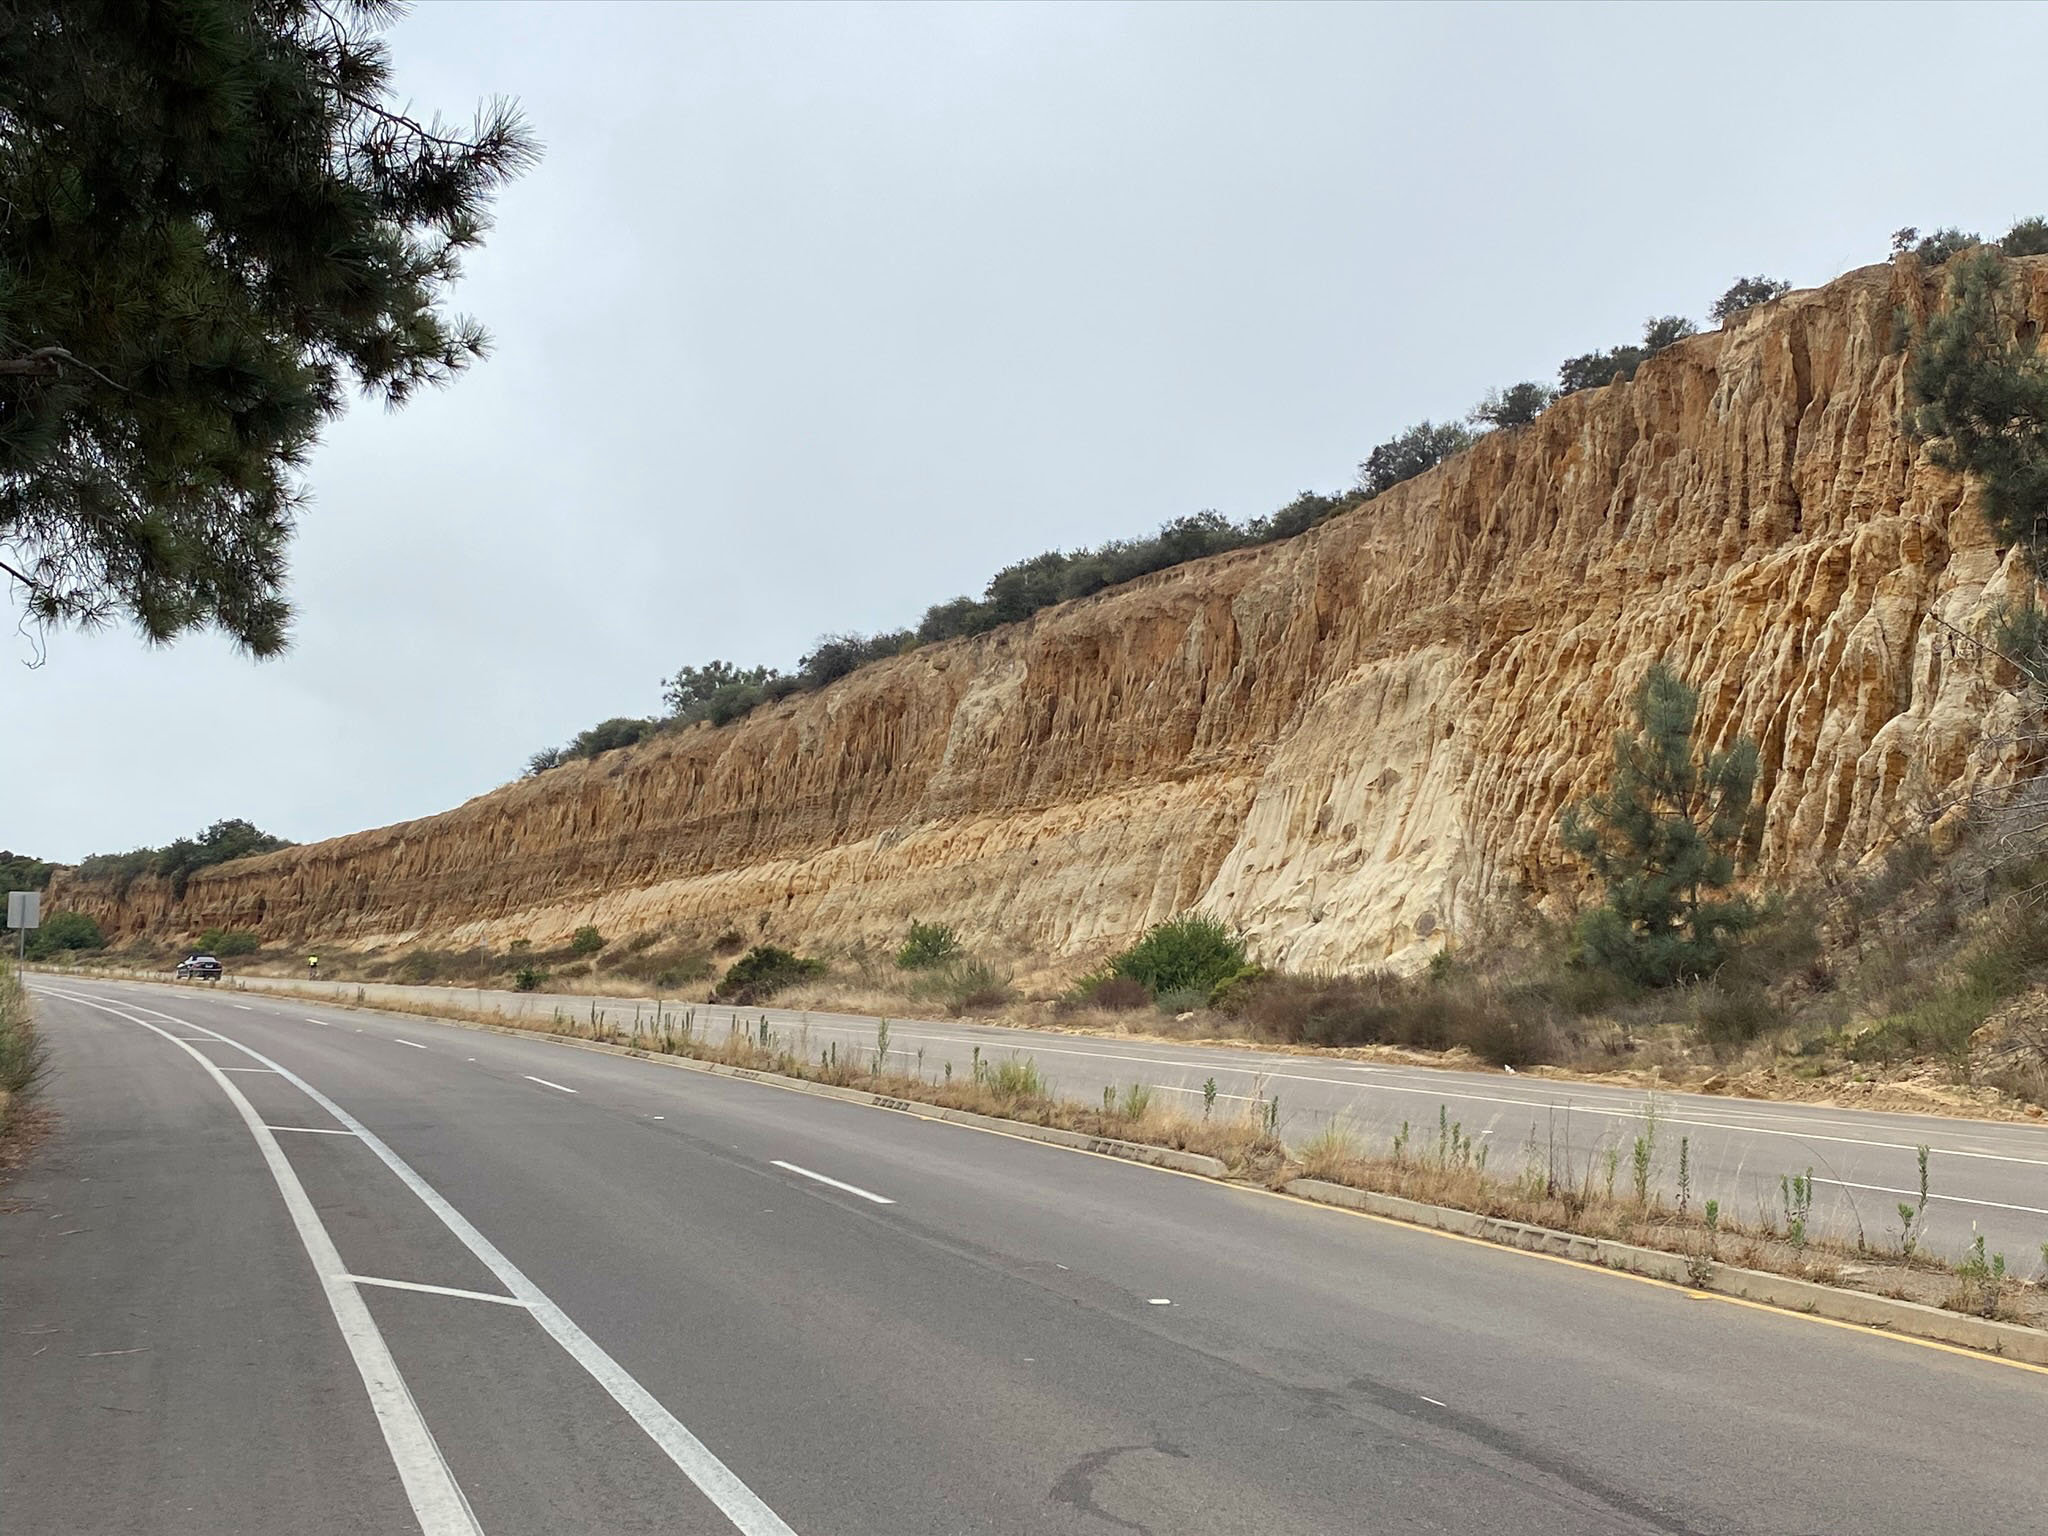
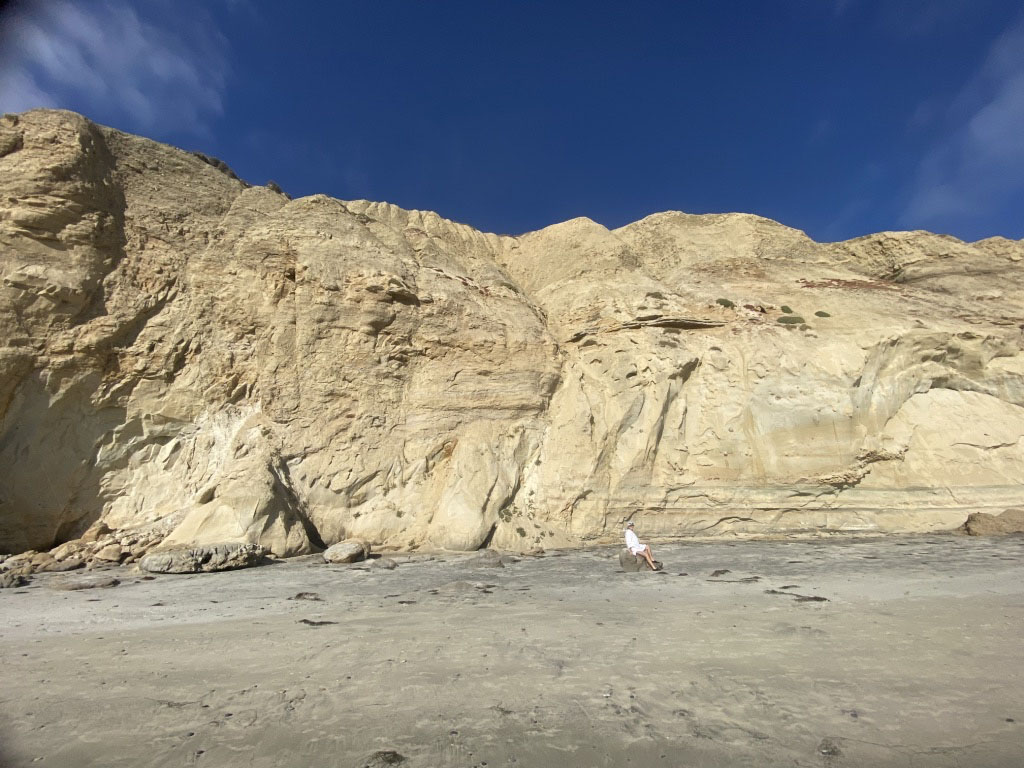
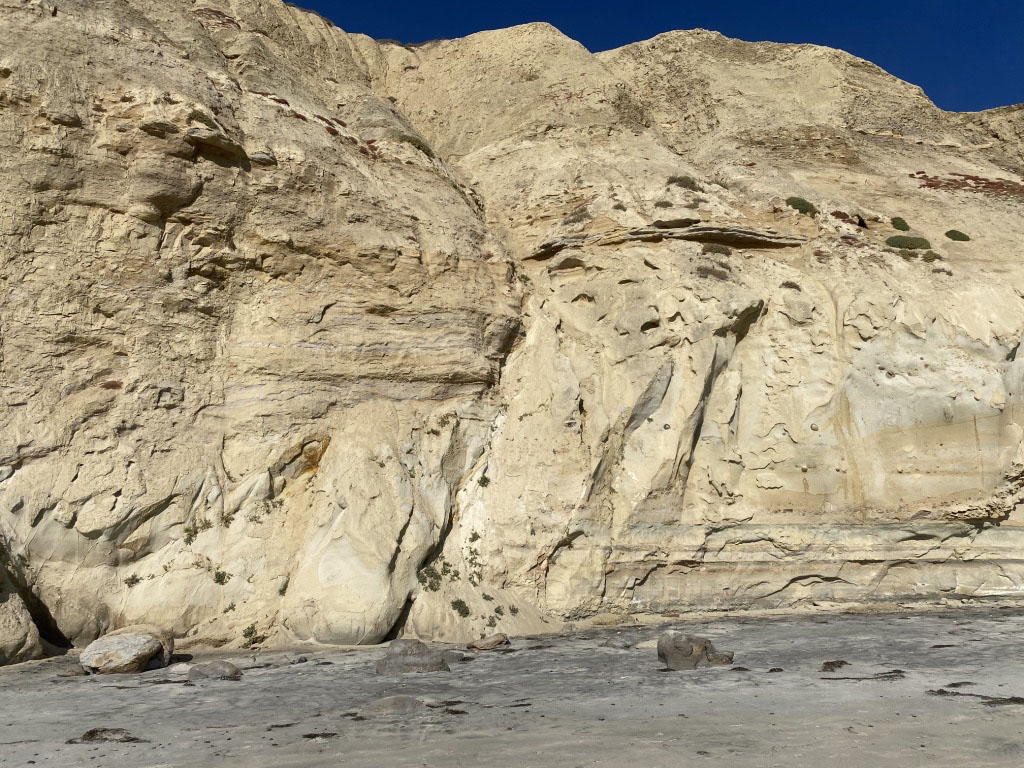
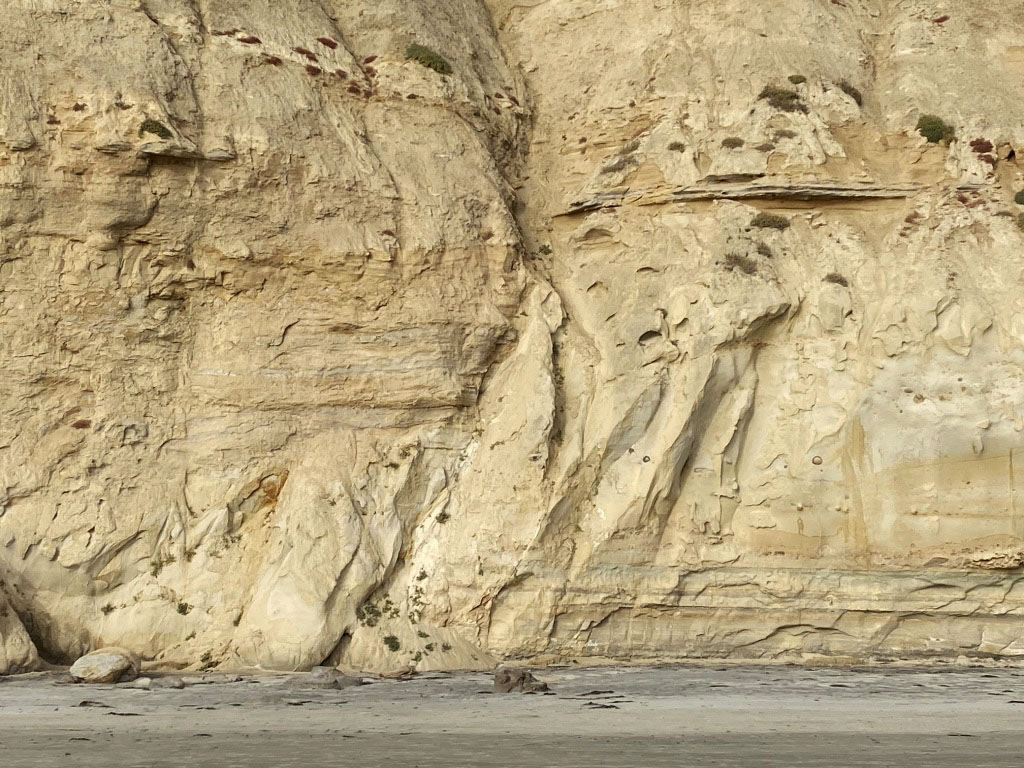
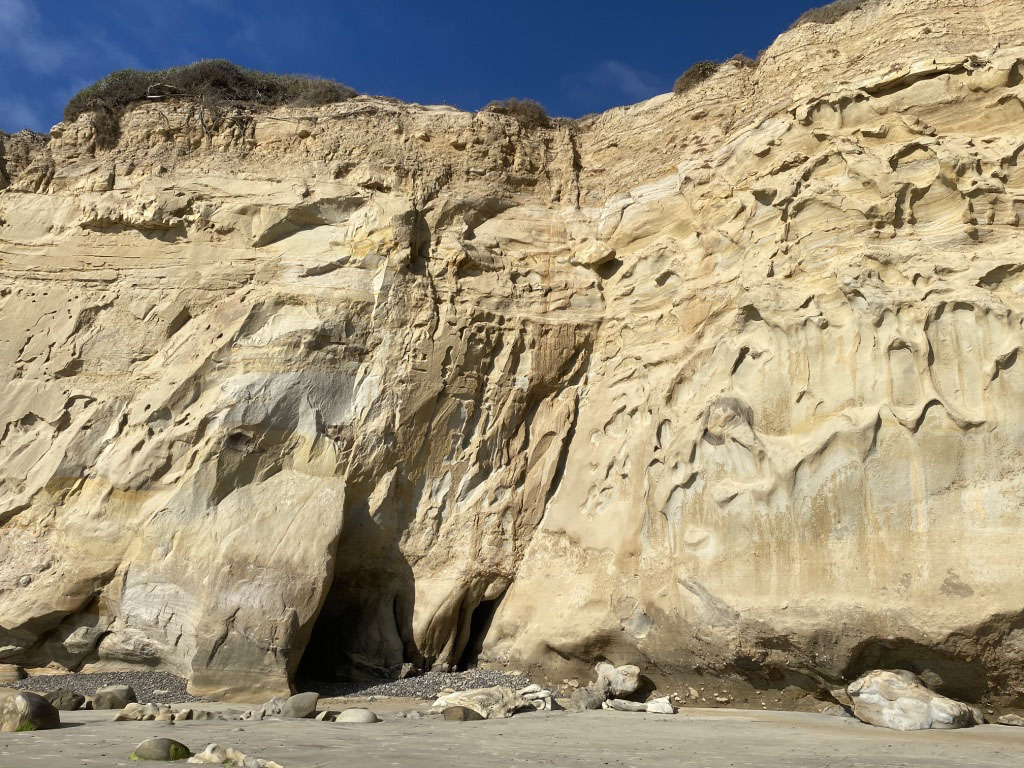
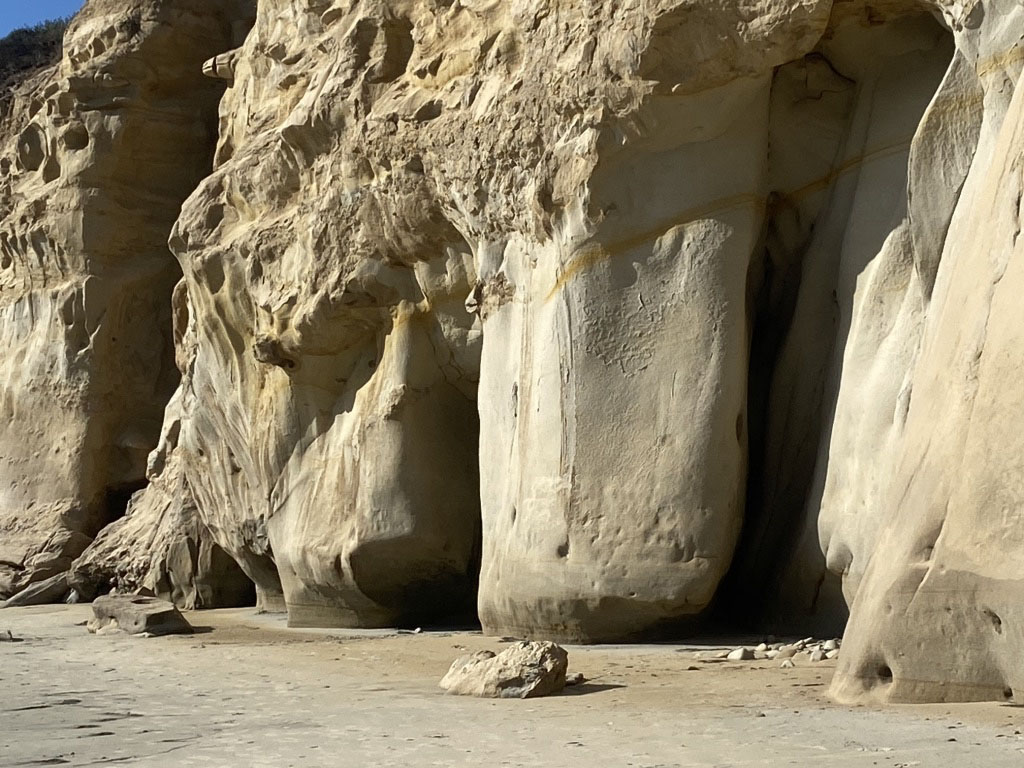
Torrey SandstoneThe Torrey Sandstone is exposed as massive white-to-buff gray cliffs throughout the Torrey Pines area. It is well exposed in road cuts along the Torrey Pines Grade (it's designated type section for comparison with other locations (Figures 43). It crops out along the upland canyons such as along the Guy Fleming Trail where the massive sandstone beds are almost 100 feet thick (Figure 44). It is also well exposed along the upper seacliffs above the beaches—both Torrey Pines State Beach and the northern end of Blacks Beach (Figures 45). The Torrey Sandstone exposed in the seacliffs display an unusual style of weathering and erosion called tafoni (Figure 46). Tafoni forms on surfaces of sandstone (and other porous rocks) where slightly salty rainwater seeps in the rock. As it seeps through the rock it dissolves some of the mineral content of the sand and cement holding the sand grains together. Then, as the weather dries out, some of the water is drawn back out to the surface where it evaporates, leaving the dissolved mineral content behind. This results in case-hardening of the surface, whereas the sandstone below the surface looses its tightly consolidated character. As fracture or gap in the case-hardened surface appears, the hole creates a space for the softer sand below the surface to dry, crumble, and be blown out by the wind. This enlarges the holes over time to create the irregular-shaped or honeycomb-shape surfaces associated with tafoni-style weathering. The holes also trap and hold moisture condensate (dew)from the air, which helps to weather the sand inside the hole. Basically same process is responsible for the formation of small wind caves found along the canyons in the Torrey Sandstone throughout the reserve area. If you sit inside one of these holes, you may observe the slight rain of sand grains drying out and falling from the roof of the small caves. |
|
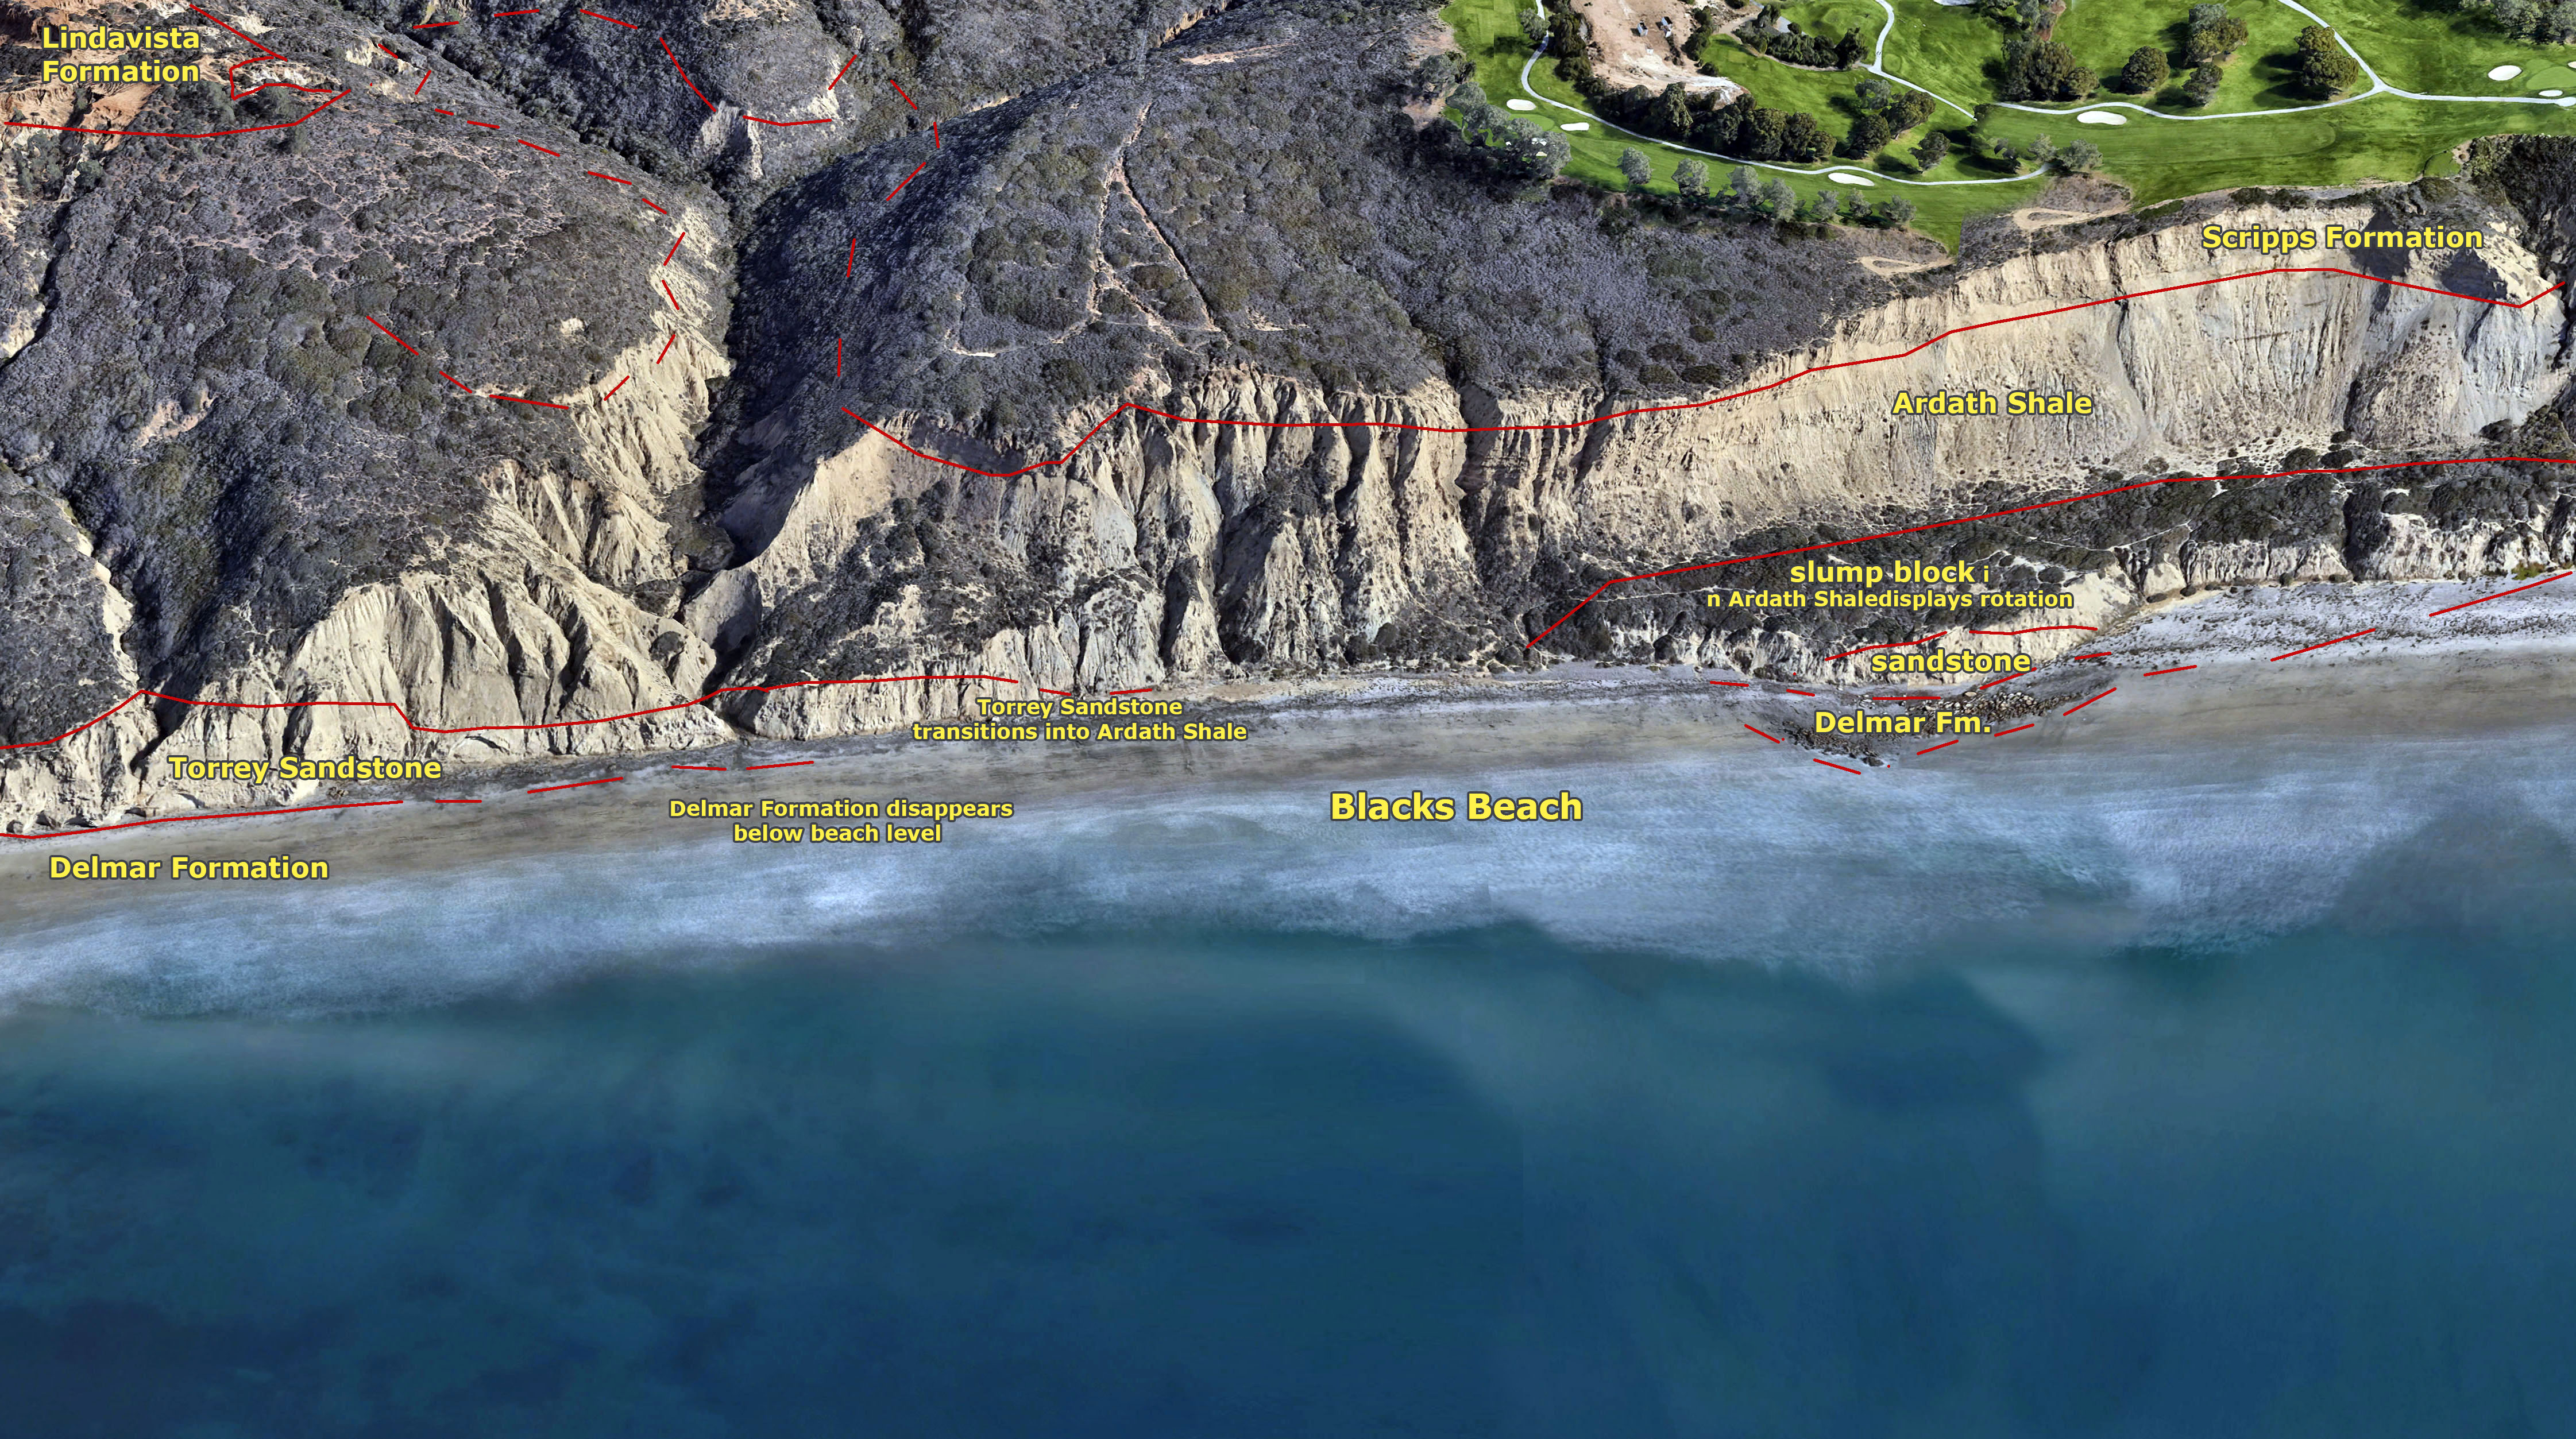
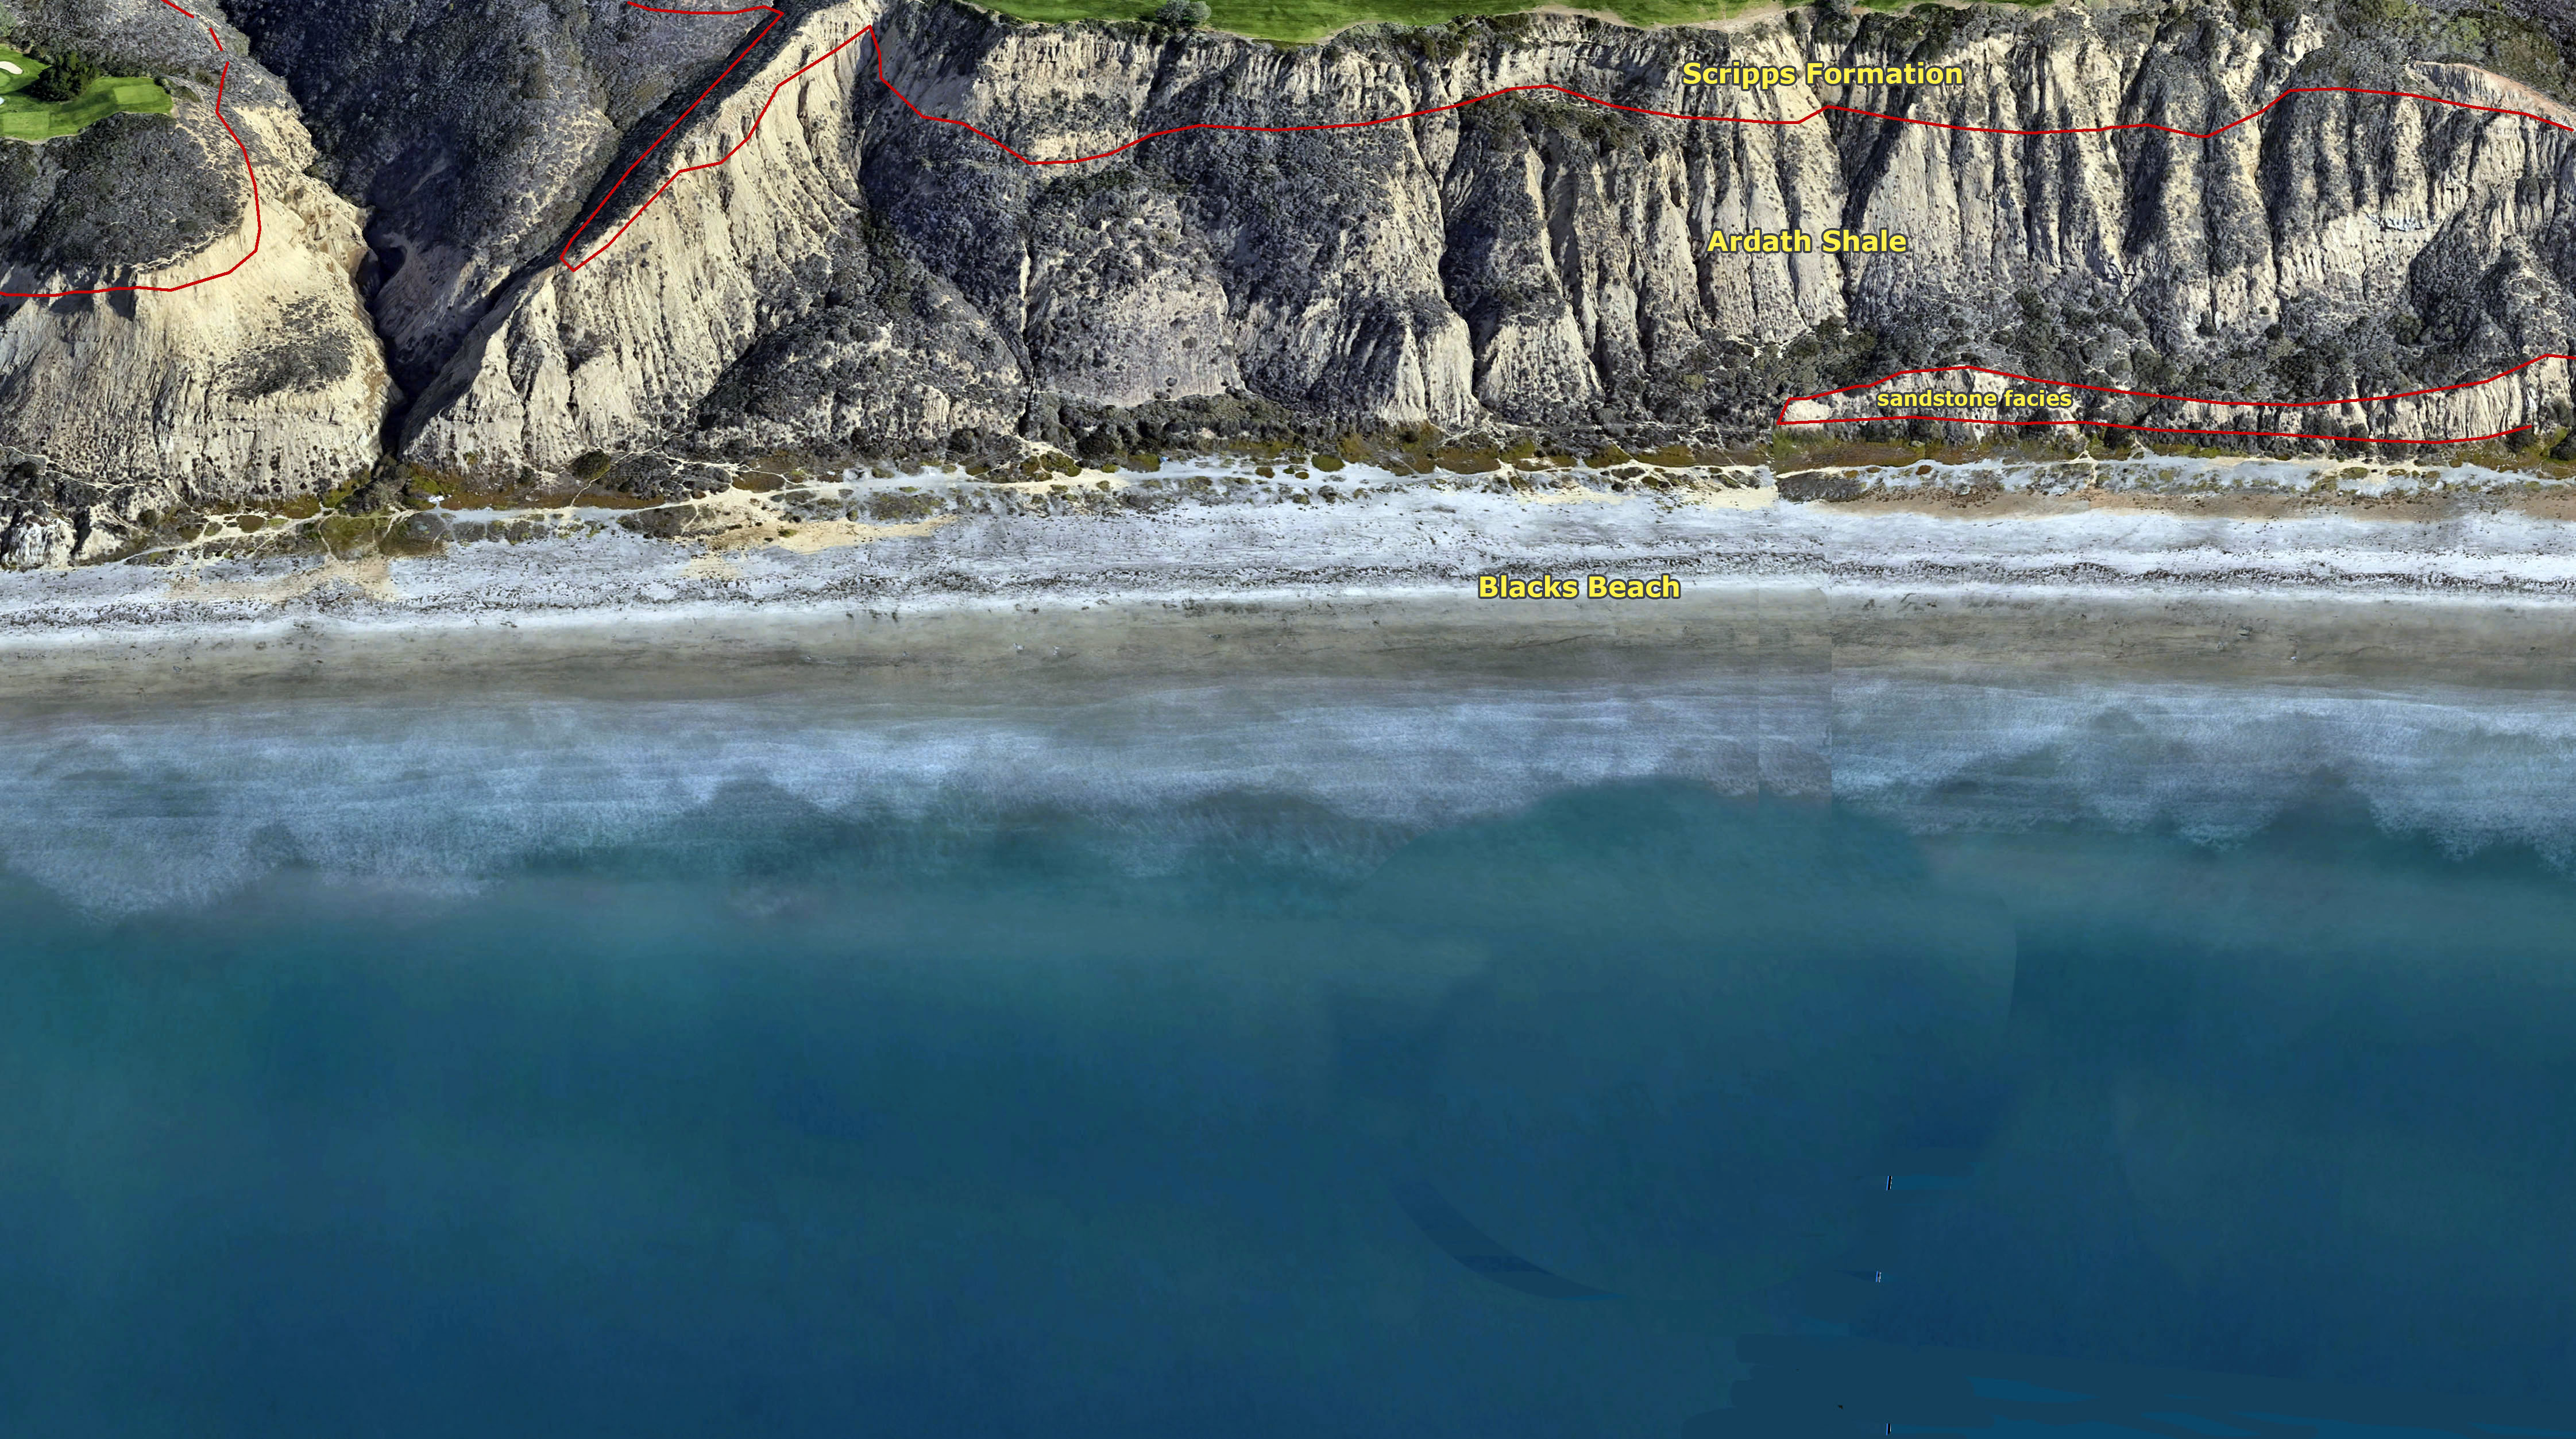
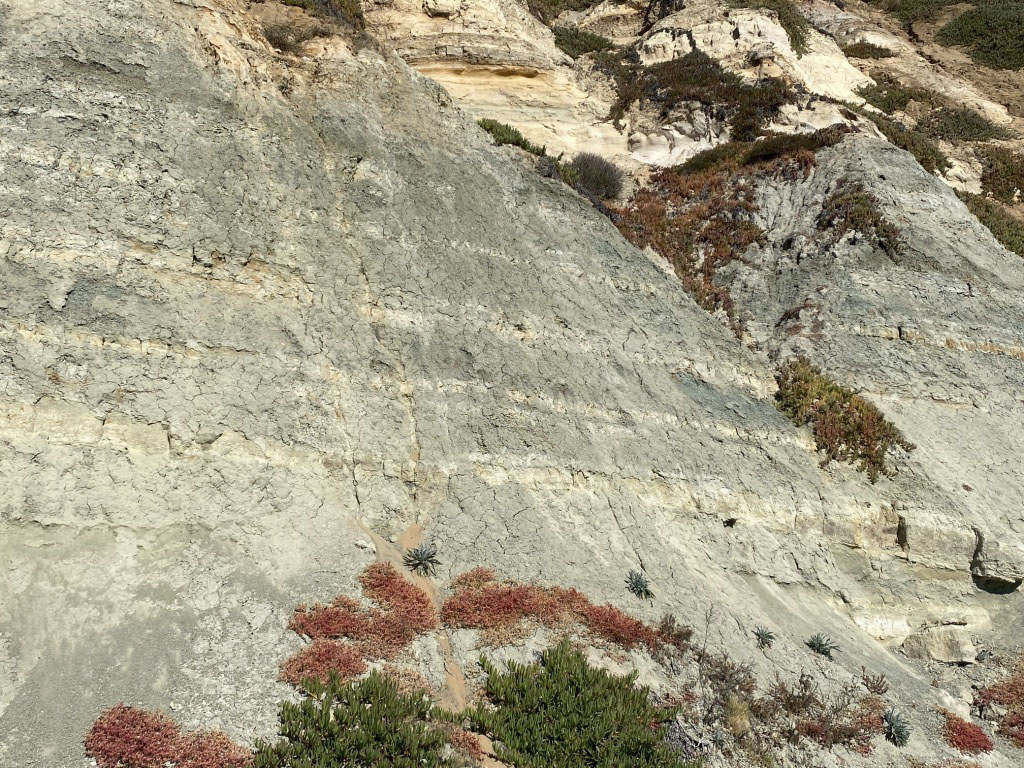
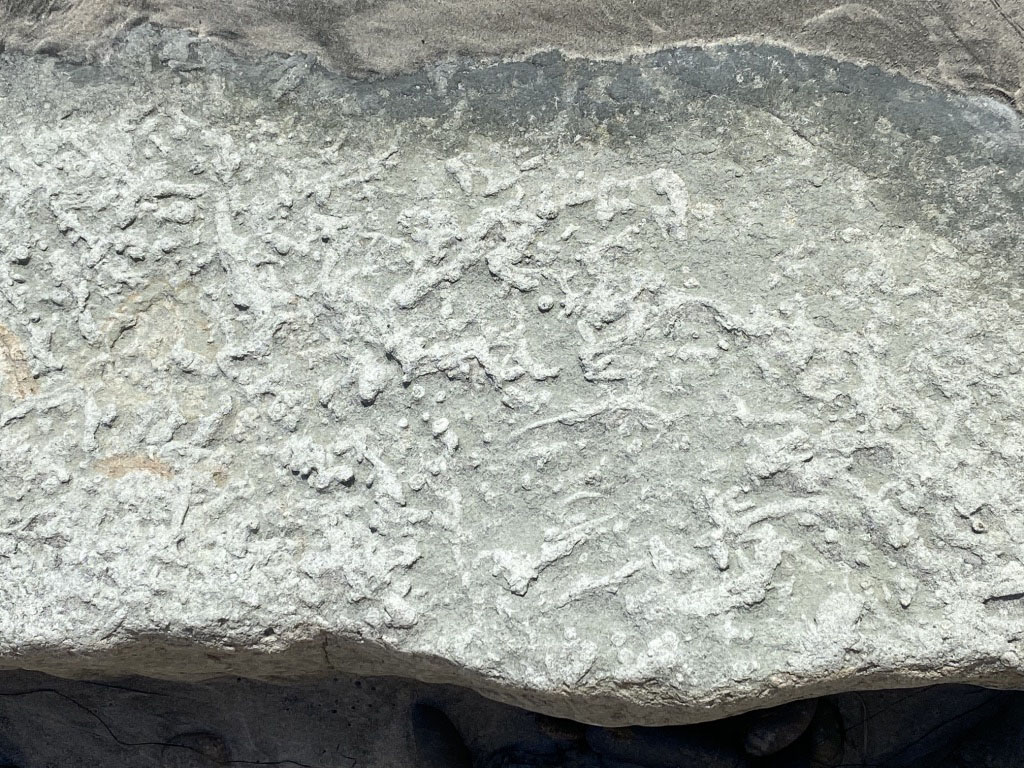
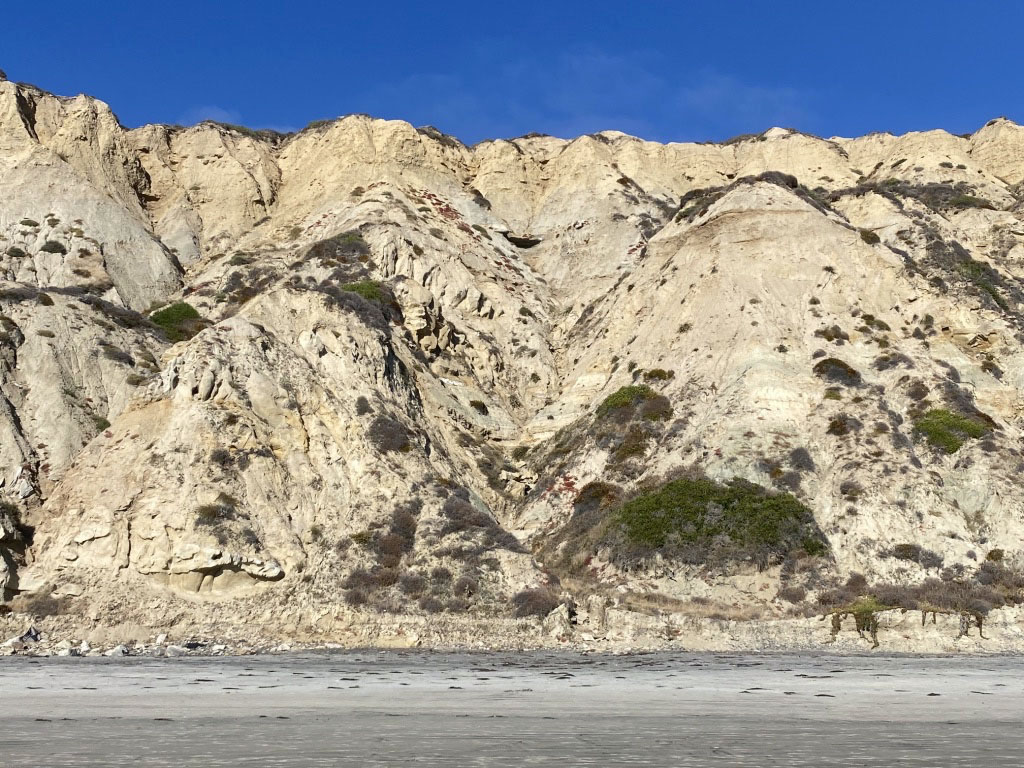
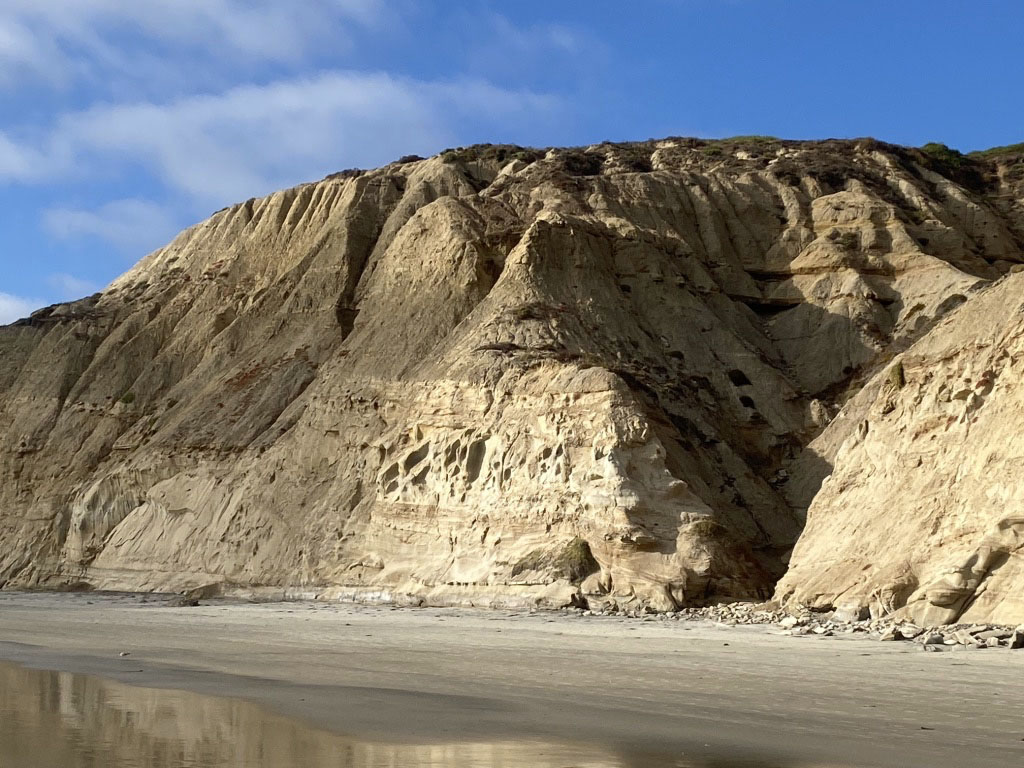
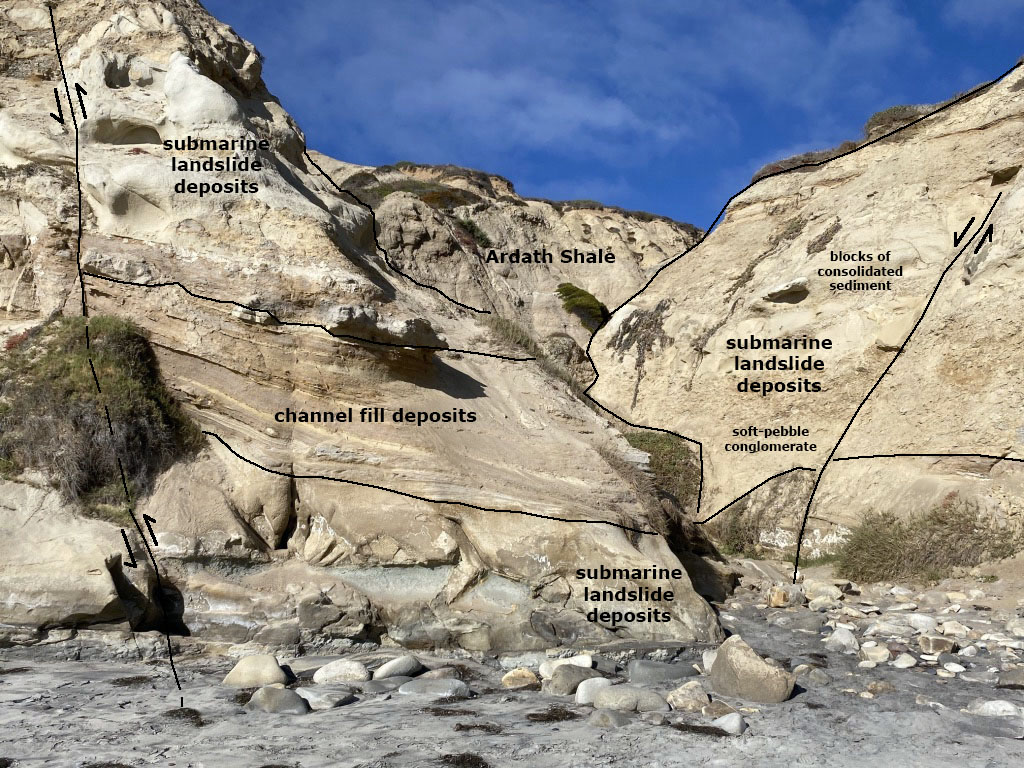
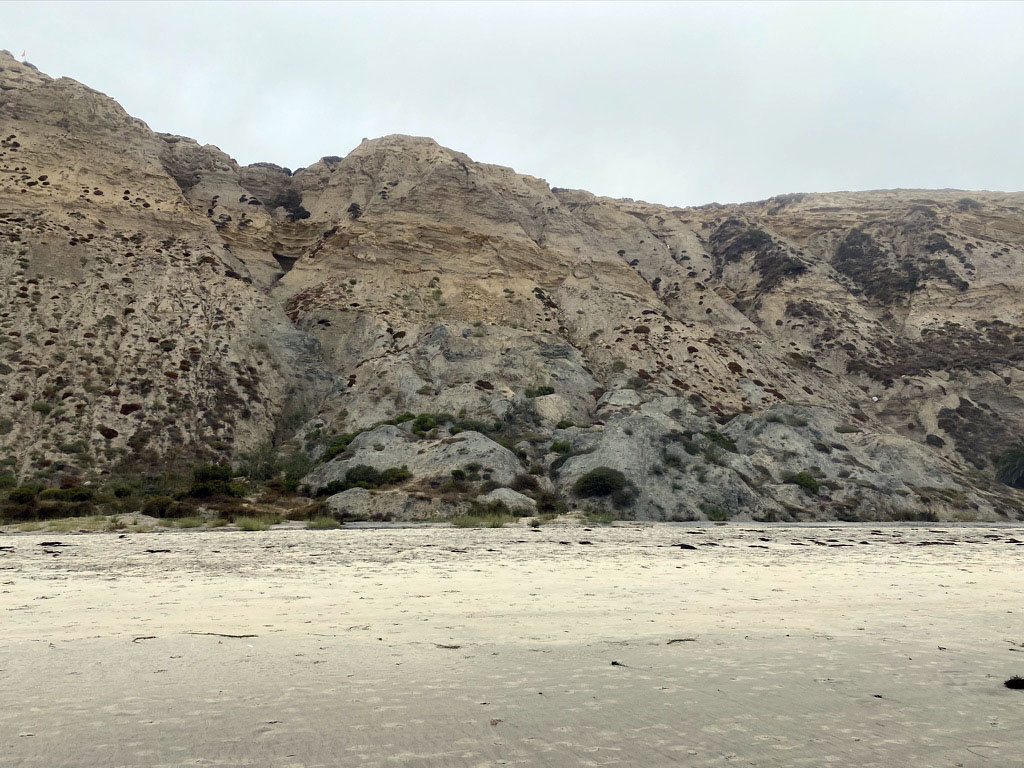
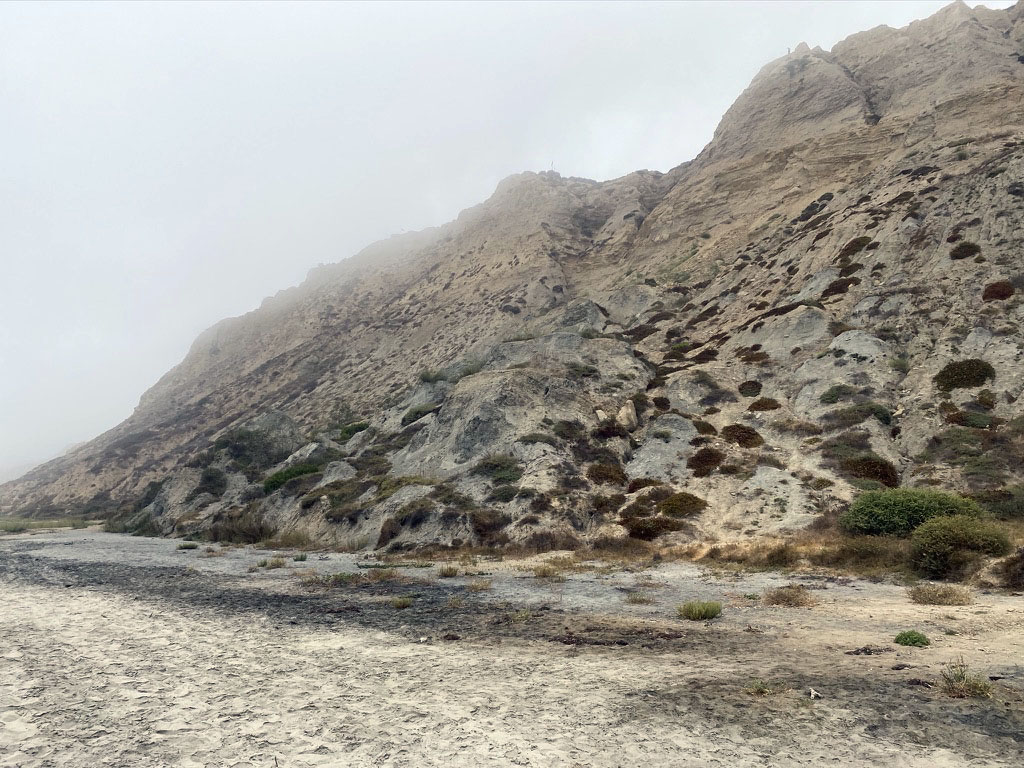
Ardath ShaleThe Ardath Shale crops out in the seacliffs in the southern part of the Torrey Pines State Nature Reserve and along Blacks Beach. It consists dominantly of poorly consolidated fine sandy, silty, to shaly mudrocks (Figure 51). Not all of the Ardath Shale is composed of shale (Figure 52). It forms the massive barren slopes above Blacks Beach (Figures 53, 54, and 55). It is transitional laterally with, and overlies, some of the massive sandstones of the Torrey Sandstone. The Ardath Shale also has large channel sand bodies with in it that locally preserve massive underwater landslide deposits (Figures 56 and 57). Further south along Blacks Beach the Ardath Shale transitions to, and underlies, a more massive sandstone and conglomerate-bearing unit named the Scripps Formation.Abbot (1999) describes the entire section of Ardath Shale outcrops exposed in the from Torrey Pines southward to Scripps Pier essentially a large submarine channel complex of middle Eocene age that has been uplifted to its current position. The submarine channel fill and landslide deposits contain gravel clasts that correlate to the Poway Group gravels, an Eocene river and alluvial fan complex preserved in patches in the upland regions between San Vicente Reservoirs and Ramona. These gravels were deposited by the ancient Ballena River—a river system that drained from the volcanic uplands of the Sonora Region of Mexico and drained to the ancient coastline of San Diego (see Figure 8). This ancient river system existed before plate-tectonic forces rifted open the Gulf of California and formed the modern San Andreas Fault system. In Eocene time, the highlands that are now the mountainous regions of eastern San Diego County were much lower, gently rolling plain that was much closer to sea level. As the Gulf of California formed, the Ballena River eventually vanished and the landscape has slowly risen to its current heights and broken by the numerous faults that now cut through the San Diego region. The Ardath Shale consists a mix of shale, silty shale, with some beds of sandstone and conglomerate that are similar in physical appearance to some beds in the other Eocene-age rock formations. However, the Ardath Shale is dominated by steep-slope-forming shale (not the nearly vertical cliffs of the sandstone and conglomerate beds). The soft shale beds erode easier forming alcoves beneath waterfalls (Figure 57) and is susceptible of forming slumps (Figures 58 and 59). The Ardath Shale probably was deposited in deeper water offshore where waves and current energy allowed the finer sediment fractions to accumulate. The Ardath shale has intermittent wedge-shape sand bodies with some conglomerate beds that represent deposition in submarine channels that filled with submarine landslide deposits and coarser sandy material transported by turbidity currents draining off the continental shelf from the ancient Ballena River delta. The Ardath Shale transitions to the Scripps Formation towards the southern end of Blacks Beach (Figure 60). |
 Fig. 51. Shale exposed in a fresh landslide that tumbled from the Ardath Shale along Blacks Beach. 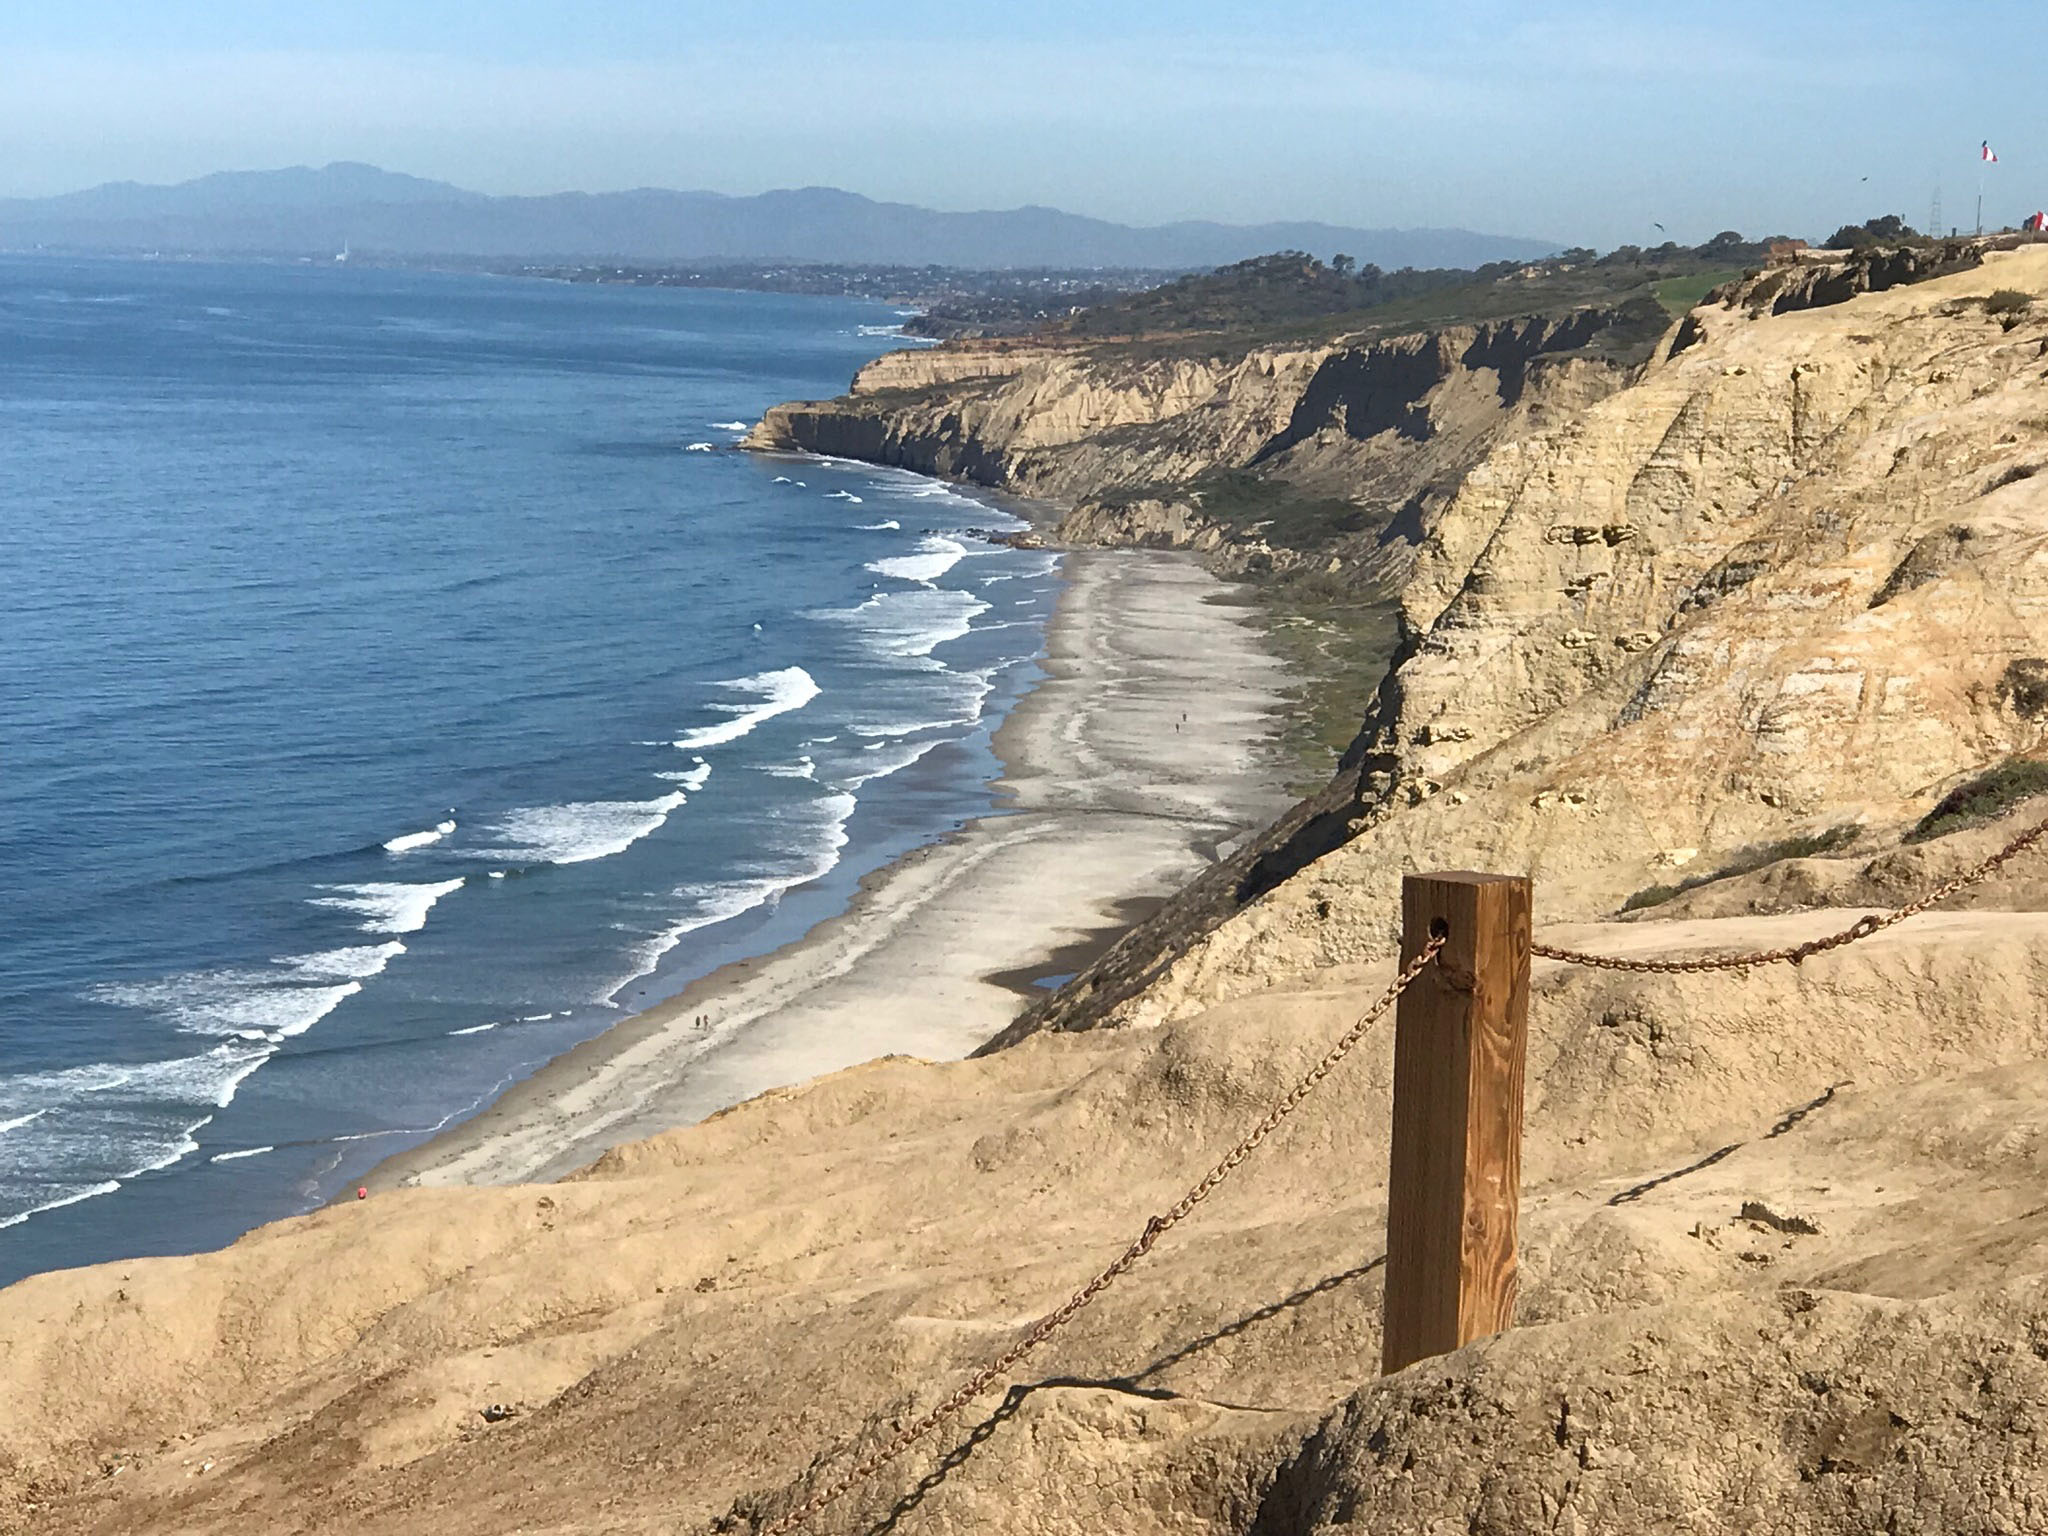 Fig. 52. View looking north along the seacliff composed of Ardath Shale at Blacks Beach at the south end of Torrey Pines State Nature Reserve as seen from the Torrey Pines Gliderport area. |
|
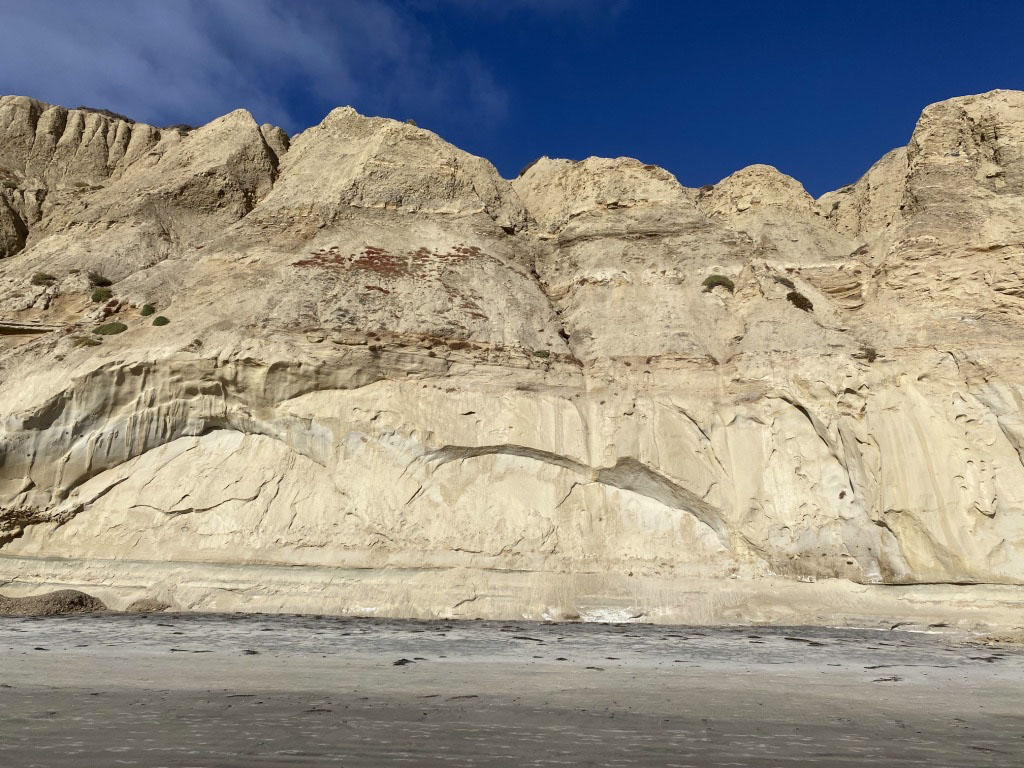

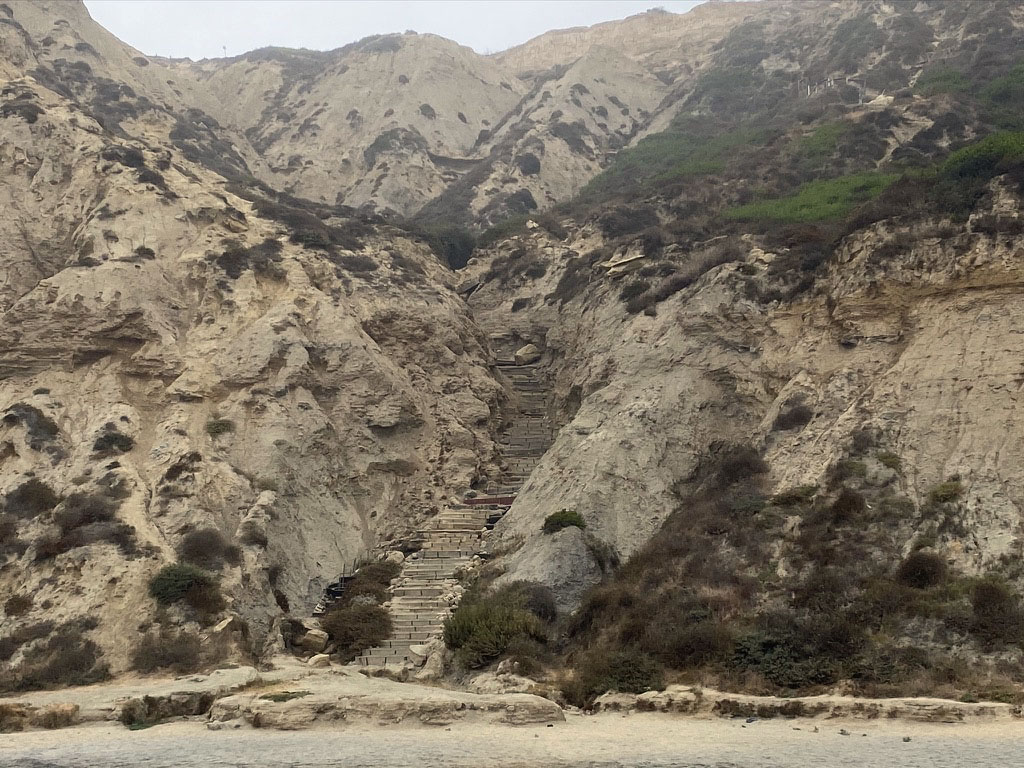
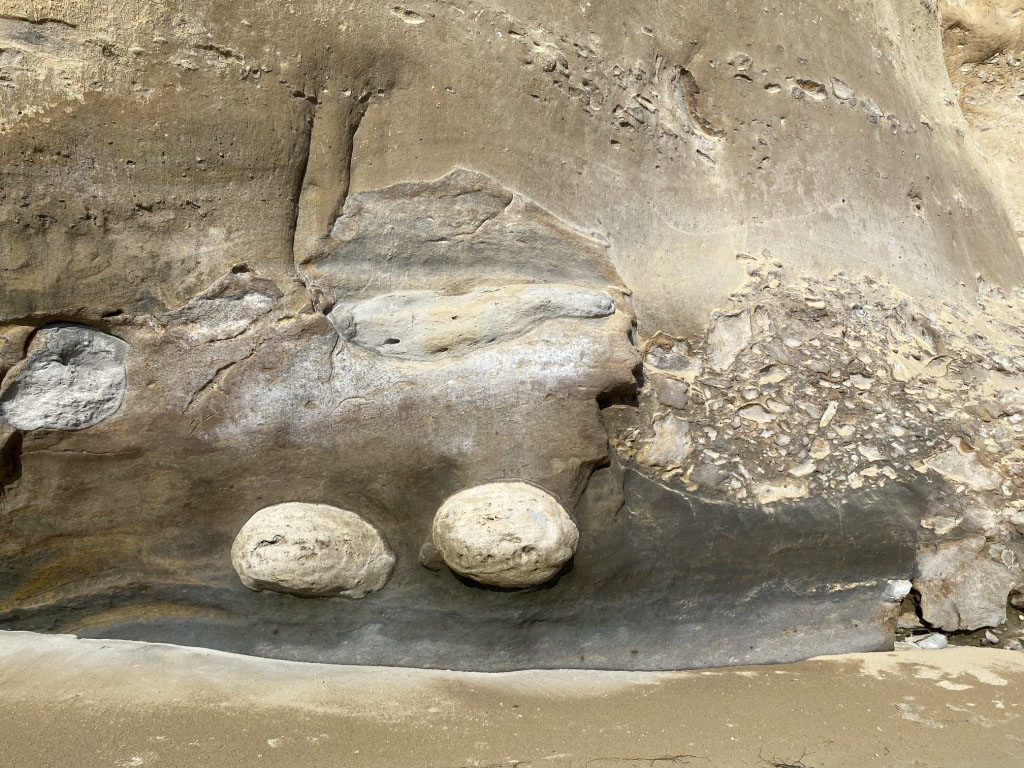
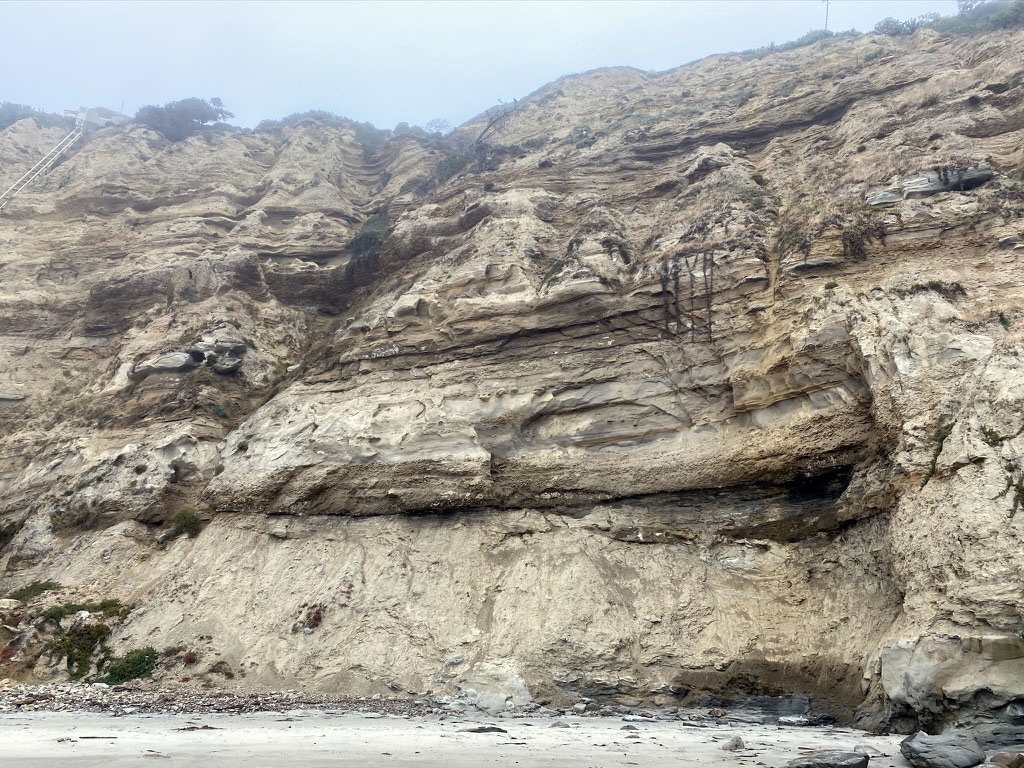
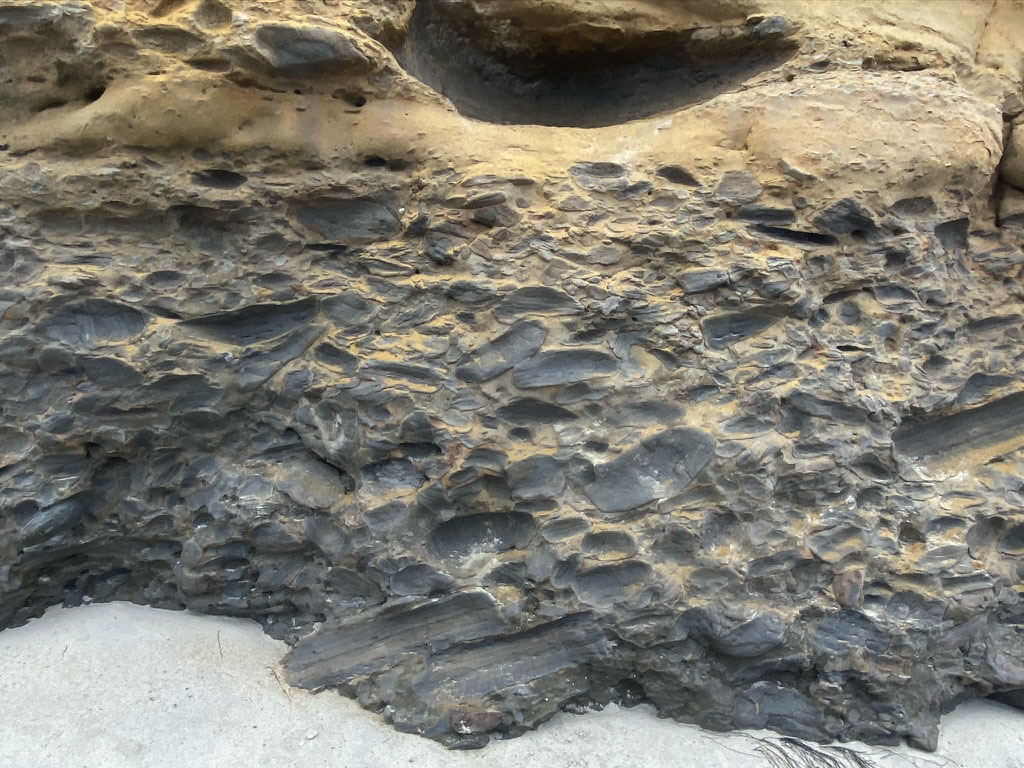
Scripps FormationAs you walk north on the beach from Scripps Pier in La Jolla, a seacliff rises from near sea level to nearly 100 meters (330 feet). The entire rock sequence exposed in the seacliff has been assigned the named Scripps Formation and its type area was designated in a canyon near the south end of Blacks Beach about 1 kilometer north of Scripps Pier (Figure 61). The Scripps Formation extend northward as a massive wedge of sediments for about 1.5 miles consisting mostly as massive bed of conglomerate and sandstone (Figure 62). North of the type area hat gradually transitions into and overlies the Ardath Shale midway to the northern end of Blacks Beach. Canyons cutting bisecting the sea cliff produce the rugged scenery in the vicinity of Torrey Pines City Beach (Figures 63, 64, and 65).The sediments of the Scripps Formation have characteristics that support an interpretation that they were deposited in an offshore setting associated with a river delta fed coarse-grained that poured sediments onto the continental shelf into submarine channels or canyons that extended into a deeper water settings father offshore along the continental shelf margin of an Eocene fore-arc basin (see Figure 8). Some of the sediments were deposited in turbulent, high-energy settings, resulting in beds of conglomerate (Figure 66), ripped-up materials and beds of contorted sediment associated with submarine landslide deposits (Figures 67 and 68). Massive pod-shaped beds of sandstone appear to fill in channels cut into older finer-grained sediments originally deposited in quieter-water settings. The Ardath Shale represents those quieter water settings farther away (north) along the continental away from the delta complex of the ancient Ballena River system. |
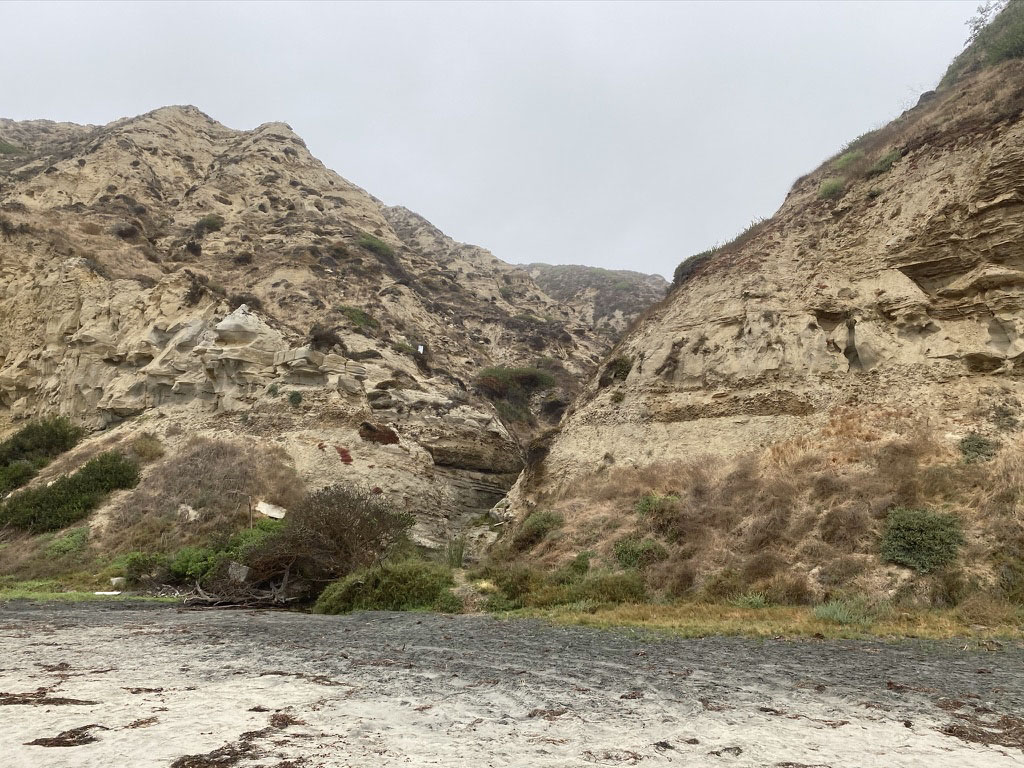 Fig. 61. The Scripps Formation type area is located in a canyon along Blacks Beach about 1 kilometer north of Scripps Pier. |
|

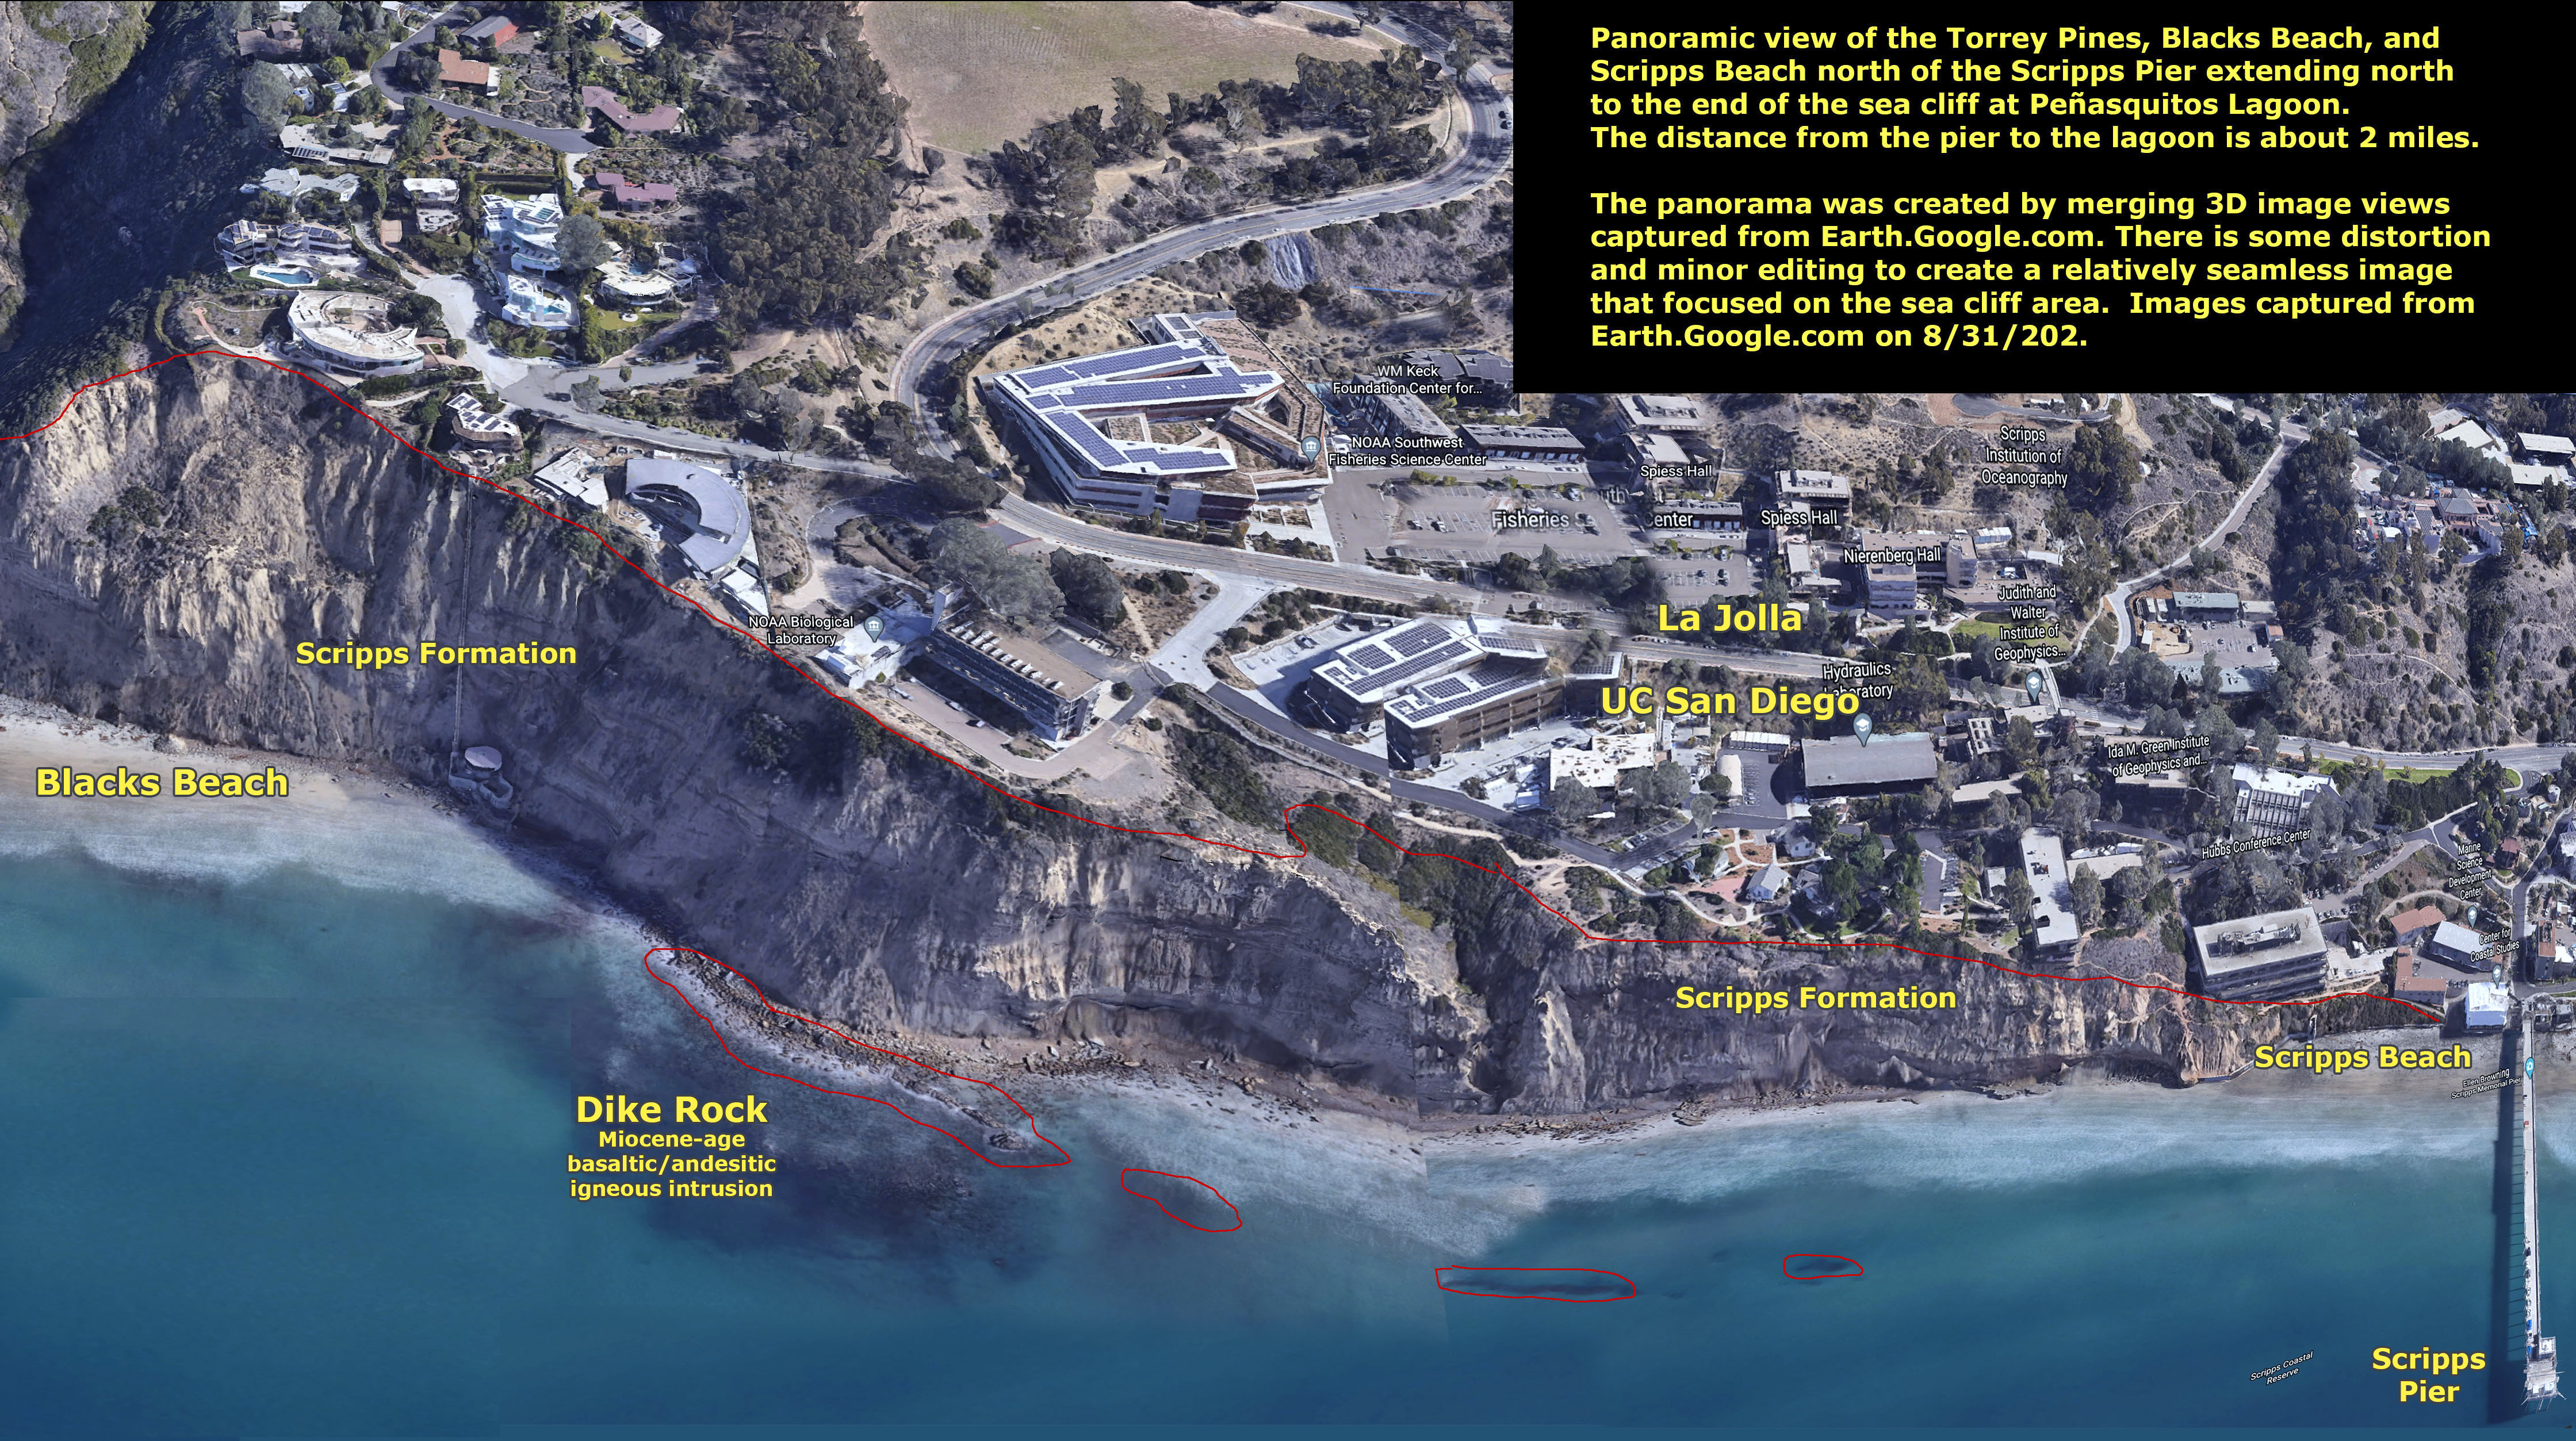
A Gap In the Rock Record At Torrey Pines—Eocene to PleistoceneIt should be noted that depositional processes continued in the San Diego region after the deposition of the Eocene-age sediments representing the the Delmar, Torrey, and Ardith formations, but they are not preserved in the park area. There is significant gap in time represented by the unconformities between the rock formations of Eocene age and those of Pleistocene age—a gap of about 44 million years—representing a long period of non-deposition or erosion of materials that may have once covered the region. Sediments and volcanic ash beds of Early Oligocene age (30-28 million years ago) are preserved as the Otay Formation in the southeastern part of San Diego County. What is inferred from evidence here and elsewhere around the world was that there was a significant drop in sea level in late Oligocene time (Brown, 1996). This means that the land along the coastline and shallow marine settings would have been exposed to sub-aerial erosion.Perhaps more important were the big changes in the plate-tectonic setting of the region began in Miocene time. The western coast of the central and northern Mexico began to bulge and rift apart. This slowly creating the spreading center and transform faulting that would eventually flood to create the Gulf of California and the San Andreas Fault system in southern California (Figure 70). This tectonic activity is what created the Peninsular Ranges of Southern California and Baja. Before this happened, the region that is now the mountainous areas of San Diego County was a low, eroded coastal plain. The surface of this ancient plain s is partly preserved in the high country plateaus of eastern San Diego County). Some sediments preserved as the San Onofre Breccia on Camp Pendleton (northern San Diego County) that it contains material that was eroded from ancient ocean crust that is now exposed on Catalina Island and other parts of the Channel Islands. These sediments are about 17-14 million years old—Early to Middle Miocene age (Tan and Kennedy, 1996). These sediments indicate that Catalina Island and the other islands and seamounts off the coast of Southern California (large fault-bounded blocks of crust) were at one time attached to the San Diego coastline. Geologists named this offshore region the Borderlands (Figure 71). Another clue about what was happening in Miocene time was the intrusion and eruption of volcanoes along the San Diego coastal region. Three locations where remnants of these volcanoes are preserved include the Morro Hills volcanic field (near Bosnall), The Calavera Hills volcano (in Carlsbad), and nearby, Dike Rock exposed on the beach between Blacks Beach and Scripps Pier see Figure 72; also the location of Dike Rock on Figure 21). These volcanic areas show that molten material deep within the crust found passage to the surface along the regional developing fault system. These small volcanic areas and their inactive faults possibly represent “aborted rift zones” that did not continue to split and move apart and away like the ones that created the basins, seamounts and islands that exist offshore (shown in Figure 71). Basically, a coastal plain that existed along the San Diego coastline in Miocene was torn apart. The numerous earthquake faults throughout the San Diego region are a continuation of that plate-tectonic activity. |
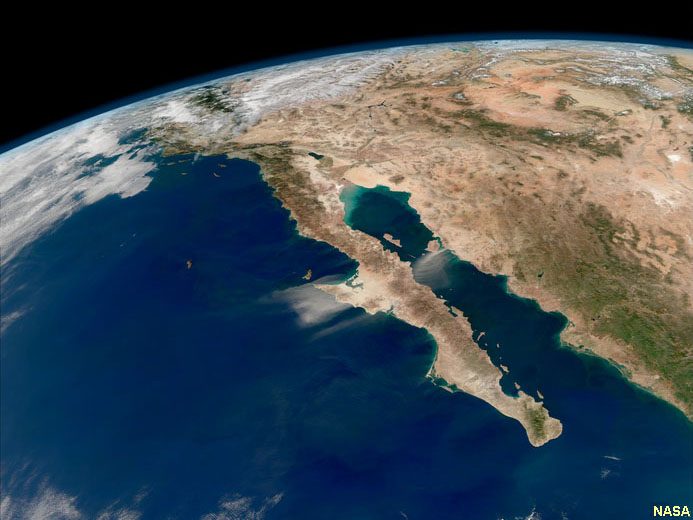 Fig. 70. Satellite view of Baja California and the southern end of the San Andreas Fault. 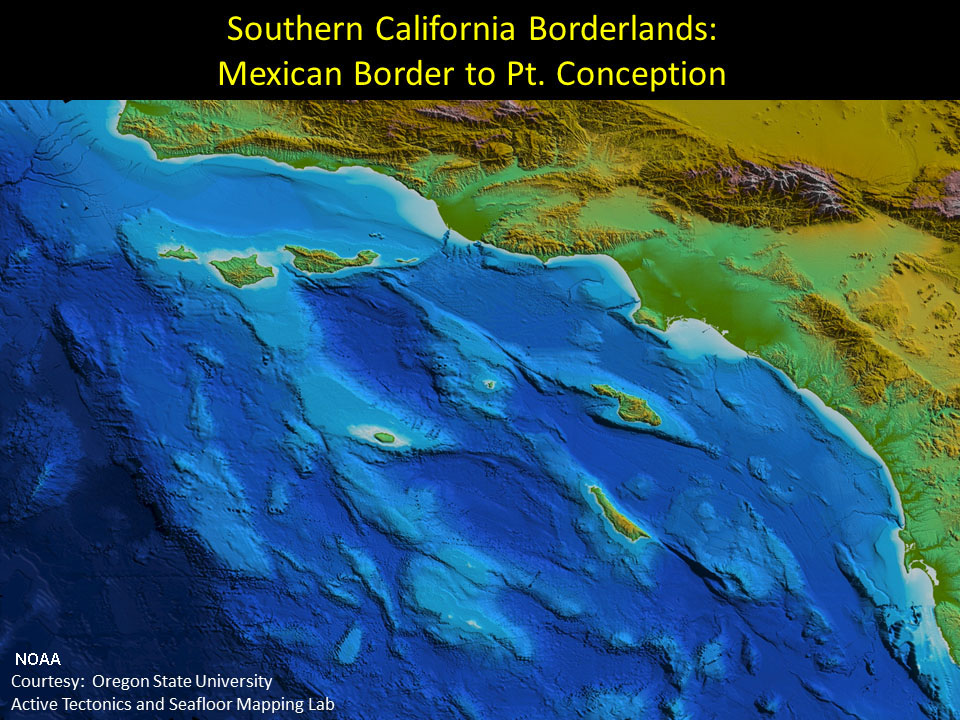 Fig. 71. Map showing offshore bathymetry of the Southern California Borderlands that consists of large fault-bounded blocks associated with with seamounts, basins, and islands. Fig. 71. Map showing offshore bathymetry of the Southern California Borderlands that consists of large fault-bounded blocks associated with with seamounts, basins, and islands.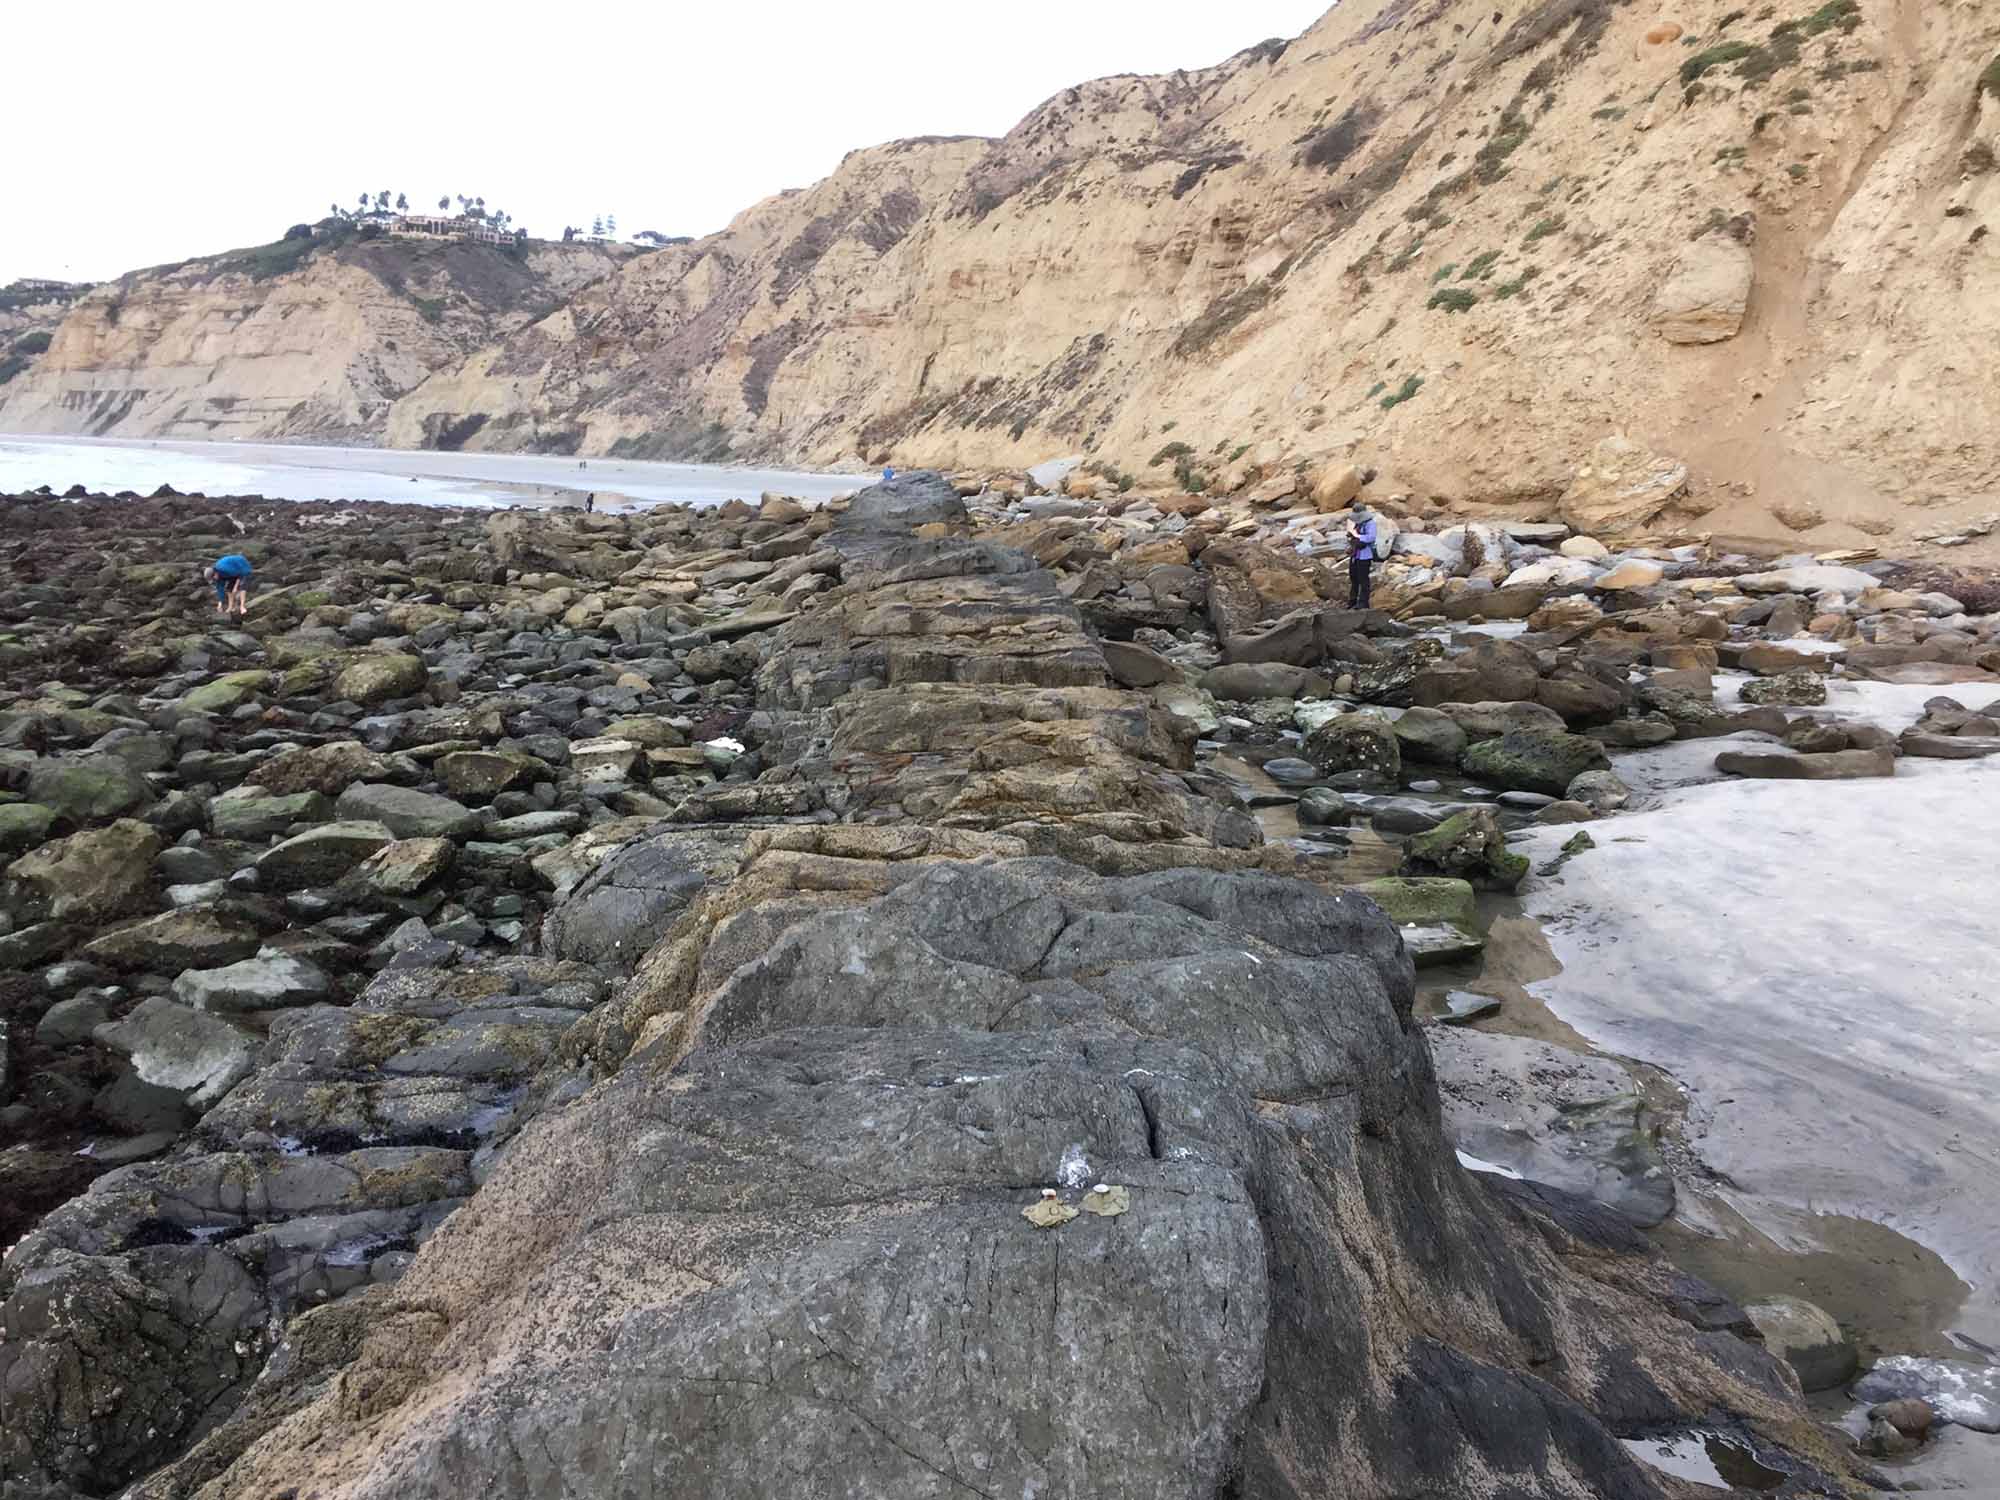 Fig. 72. Dike Rock is a dark volcanic rock exposed along the southern end of Blacks Beach. The sea cliffs in the background are Scripps Fm. |
| Note that Dike Rock is one of the largest accessible tide pool areas along the coast north of La Jolla. Be caution when hiking through this area because the rocks may be unstable. For a good summary tide pool sea life, see Life in the Rocky Intertidal Zone (Cabrillo National Monument brochure). |
Ice Ages of the Pleistocene: Impact on the San Diego Area (Torrey Pines) |
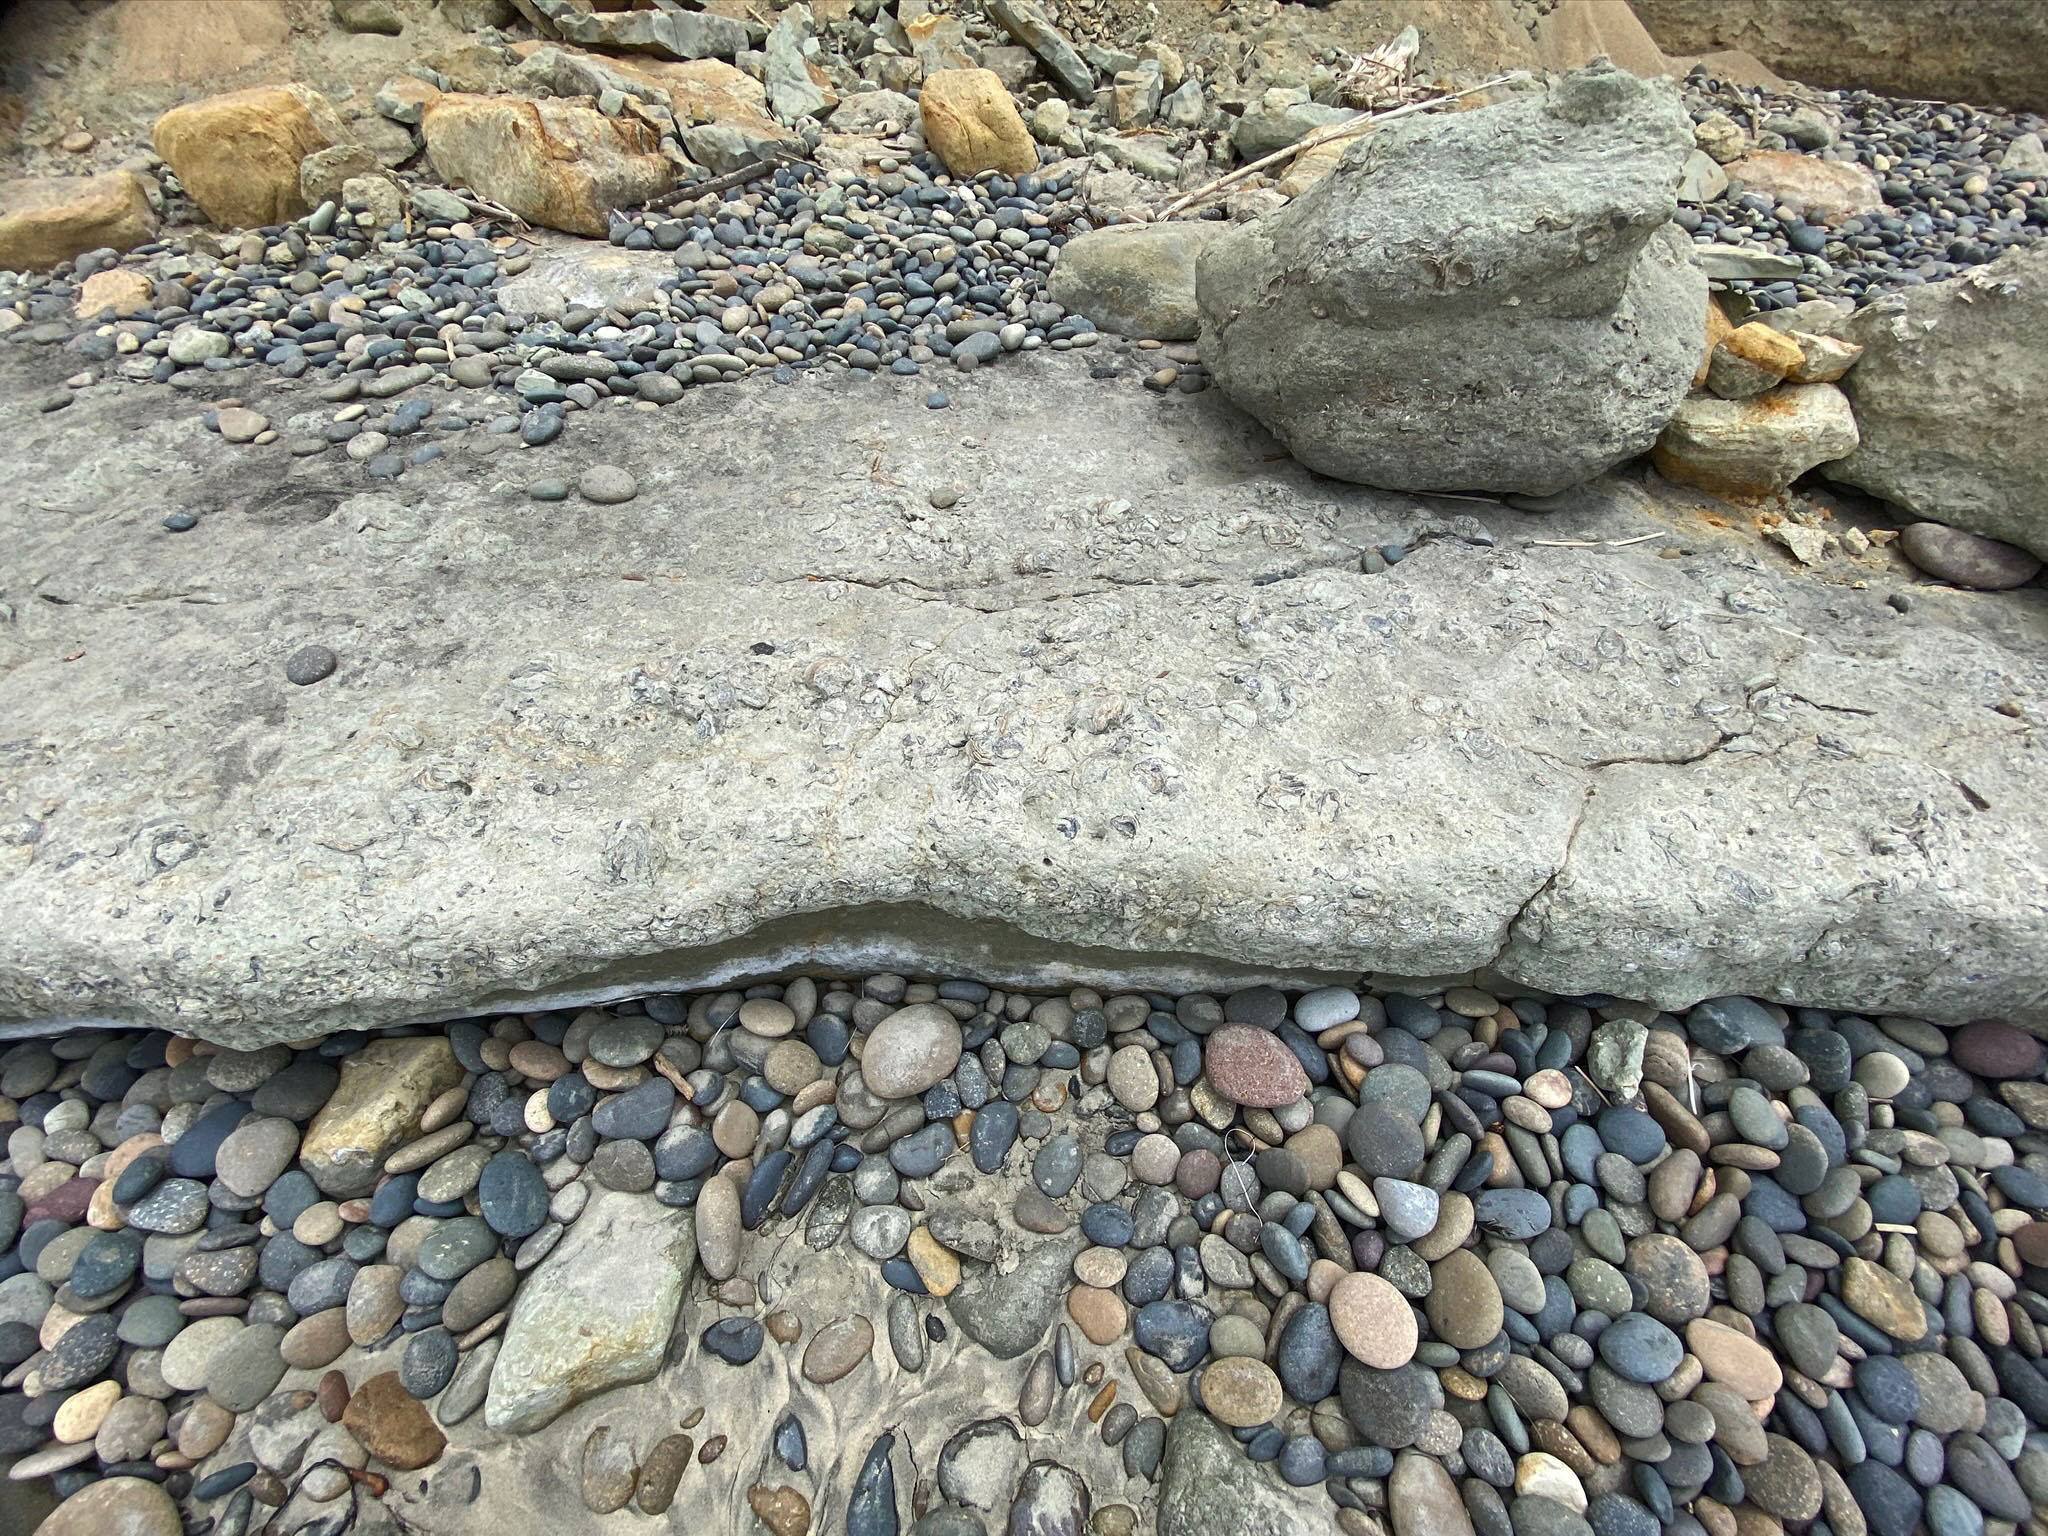
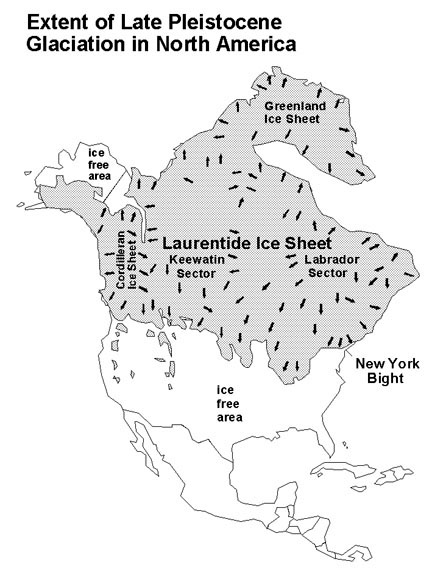
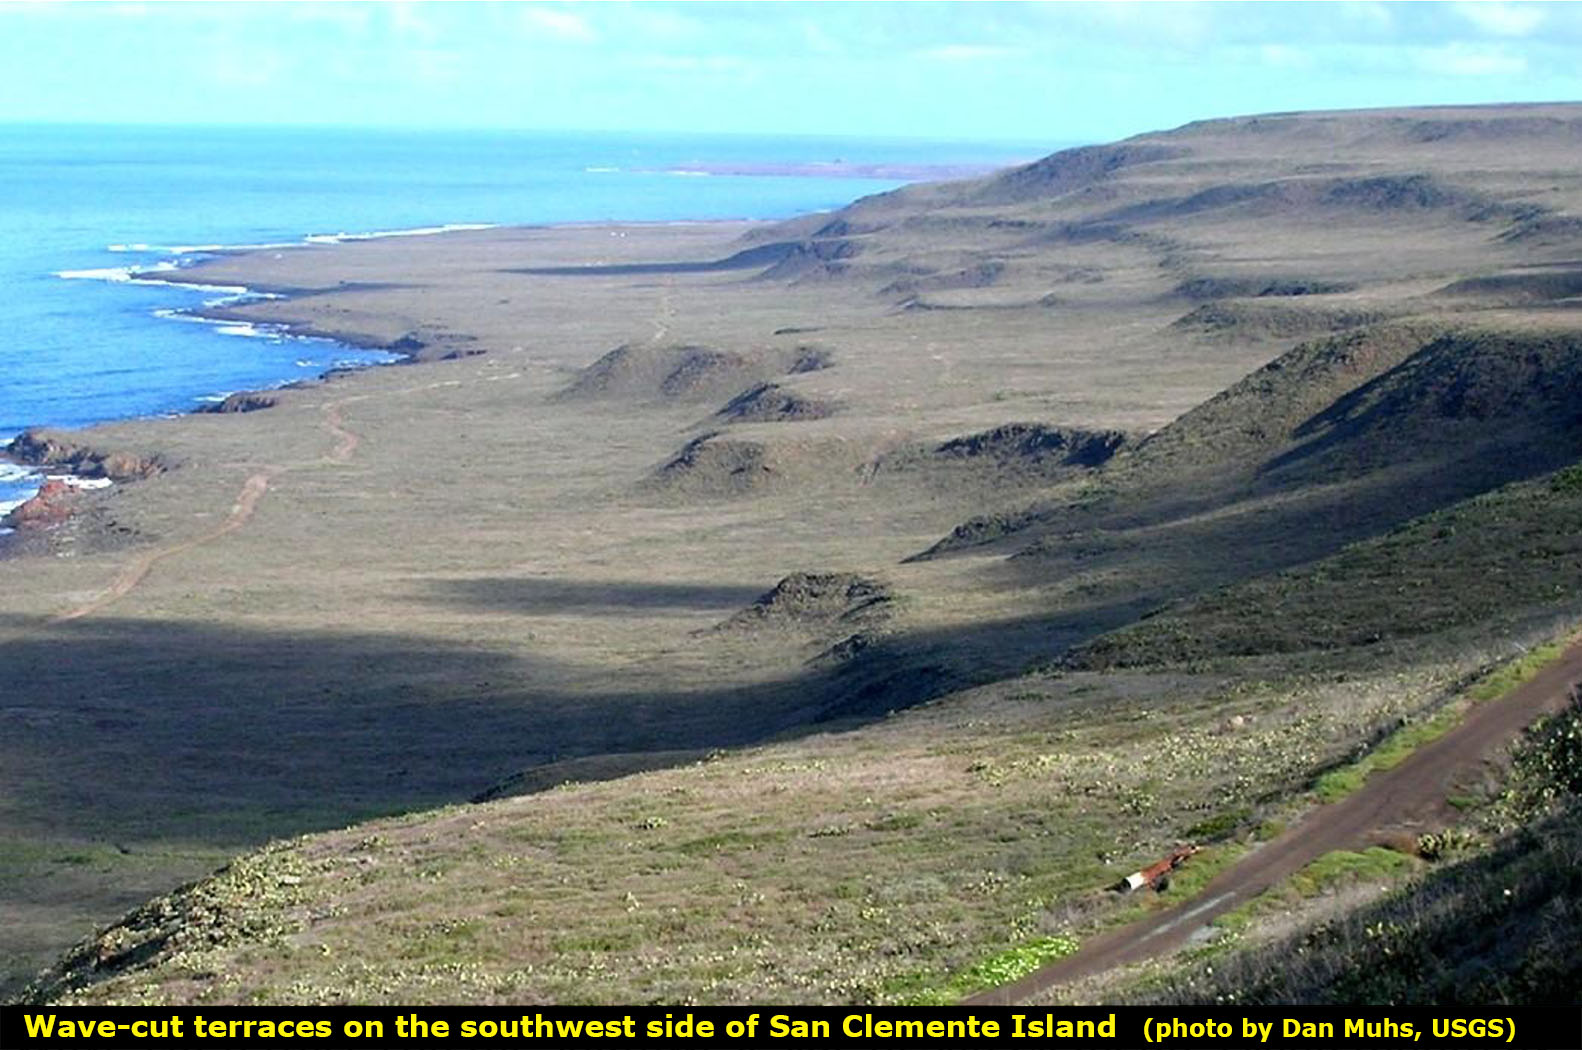
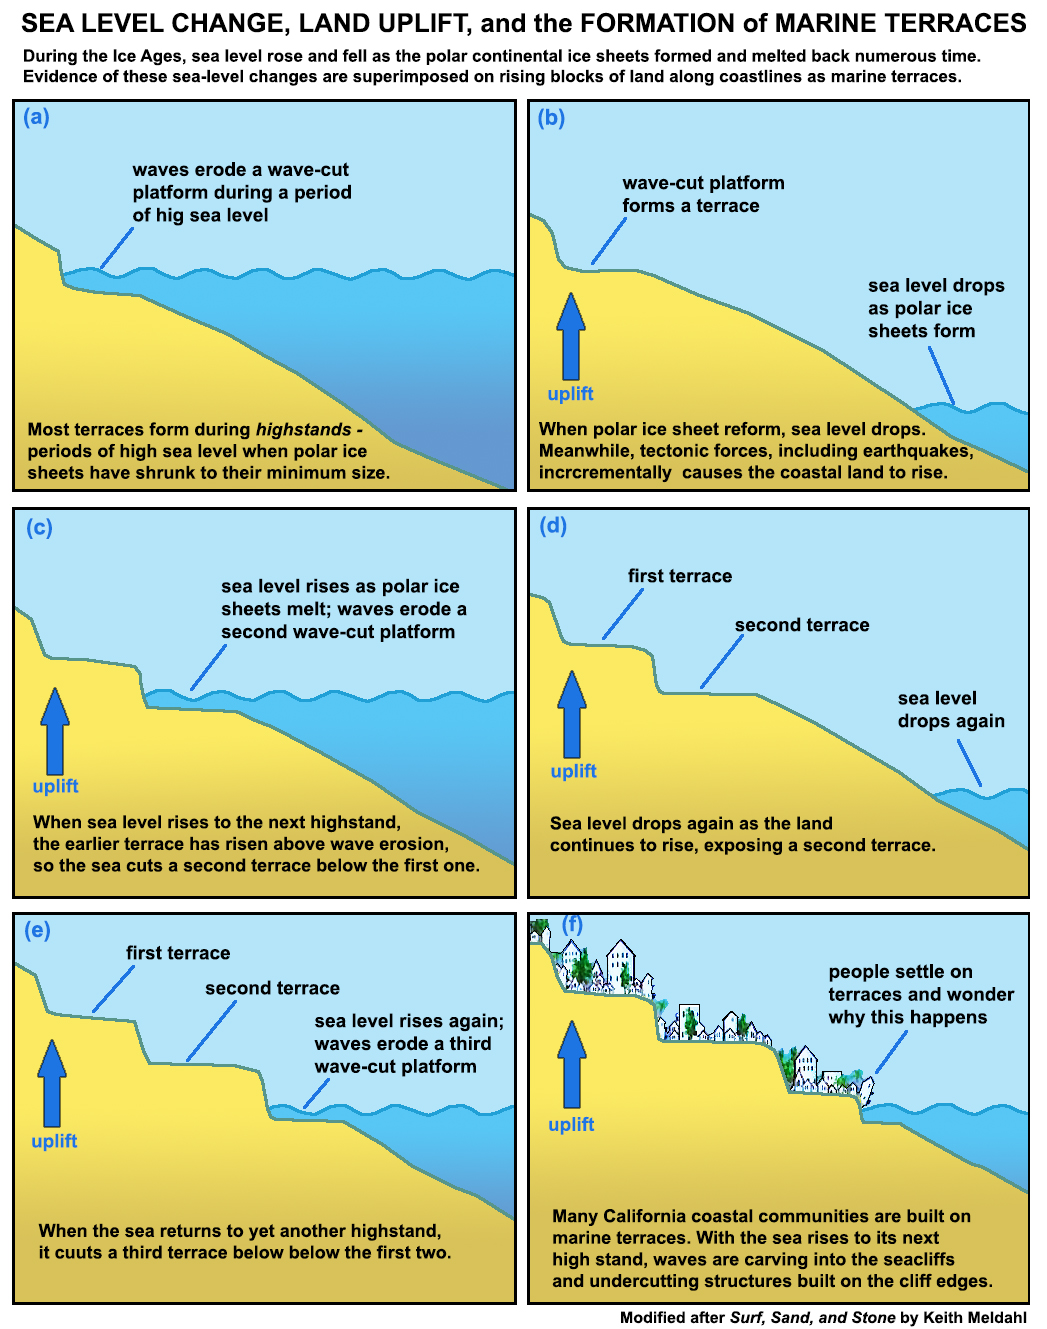
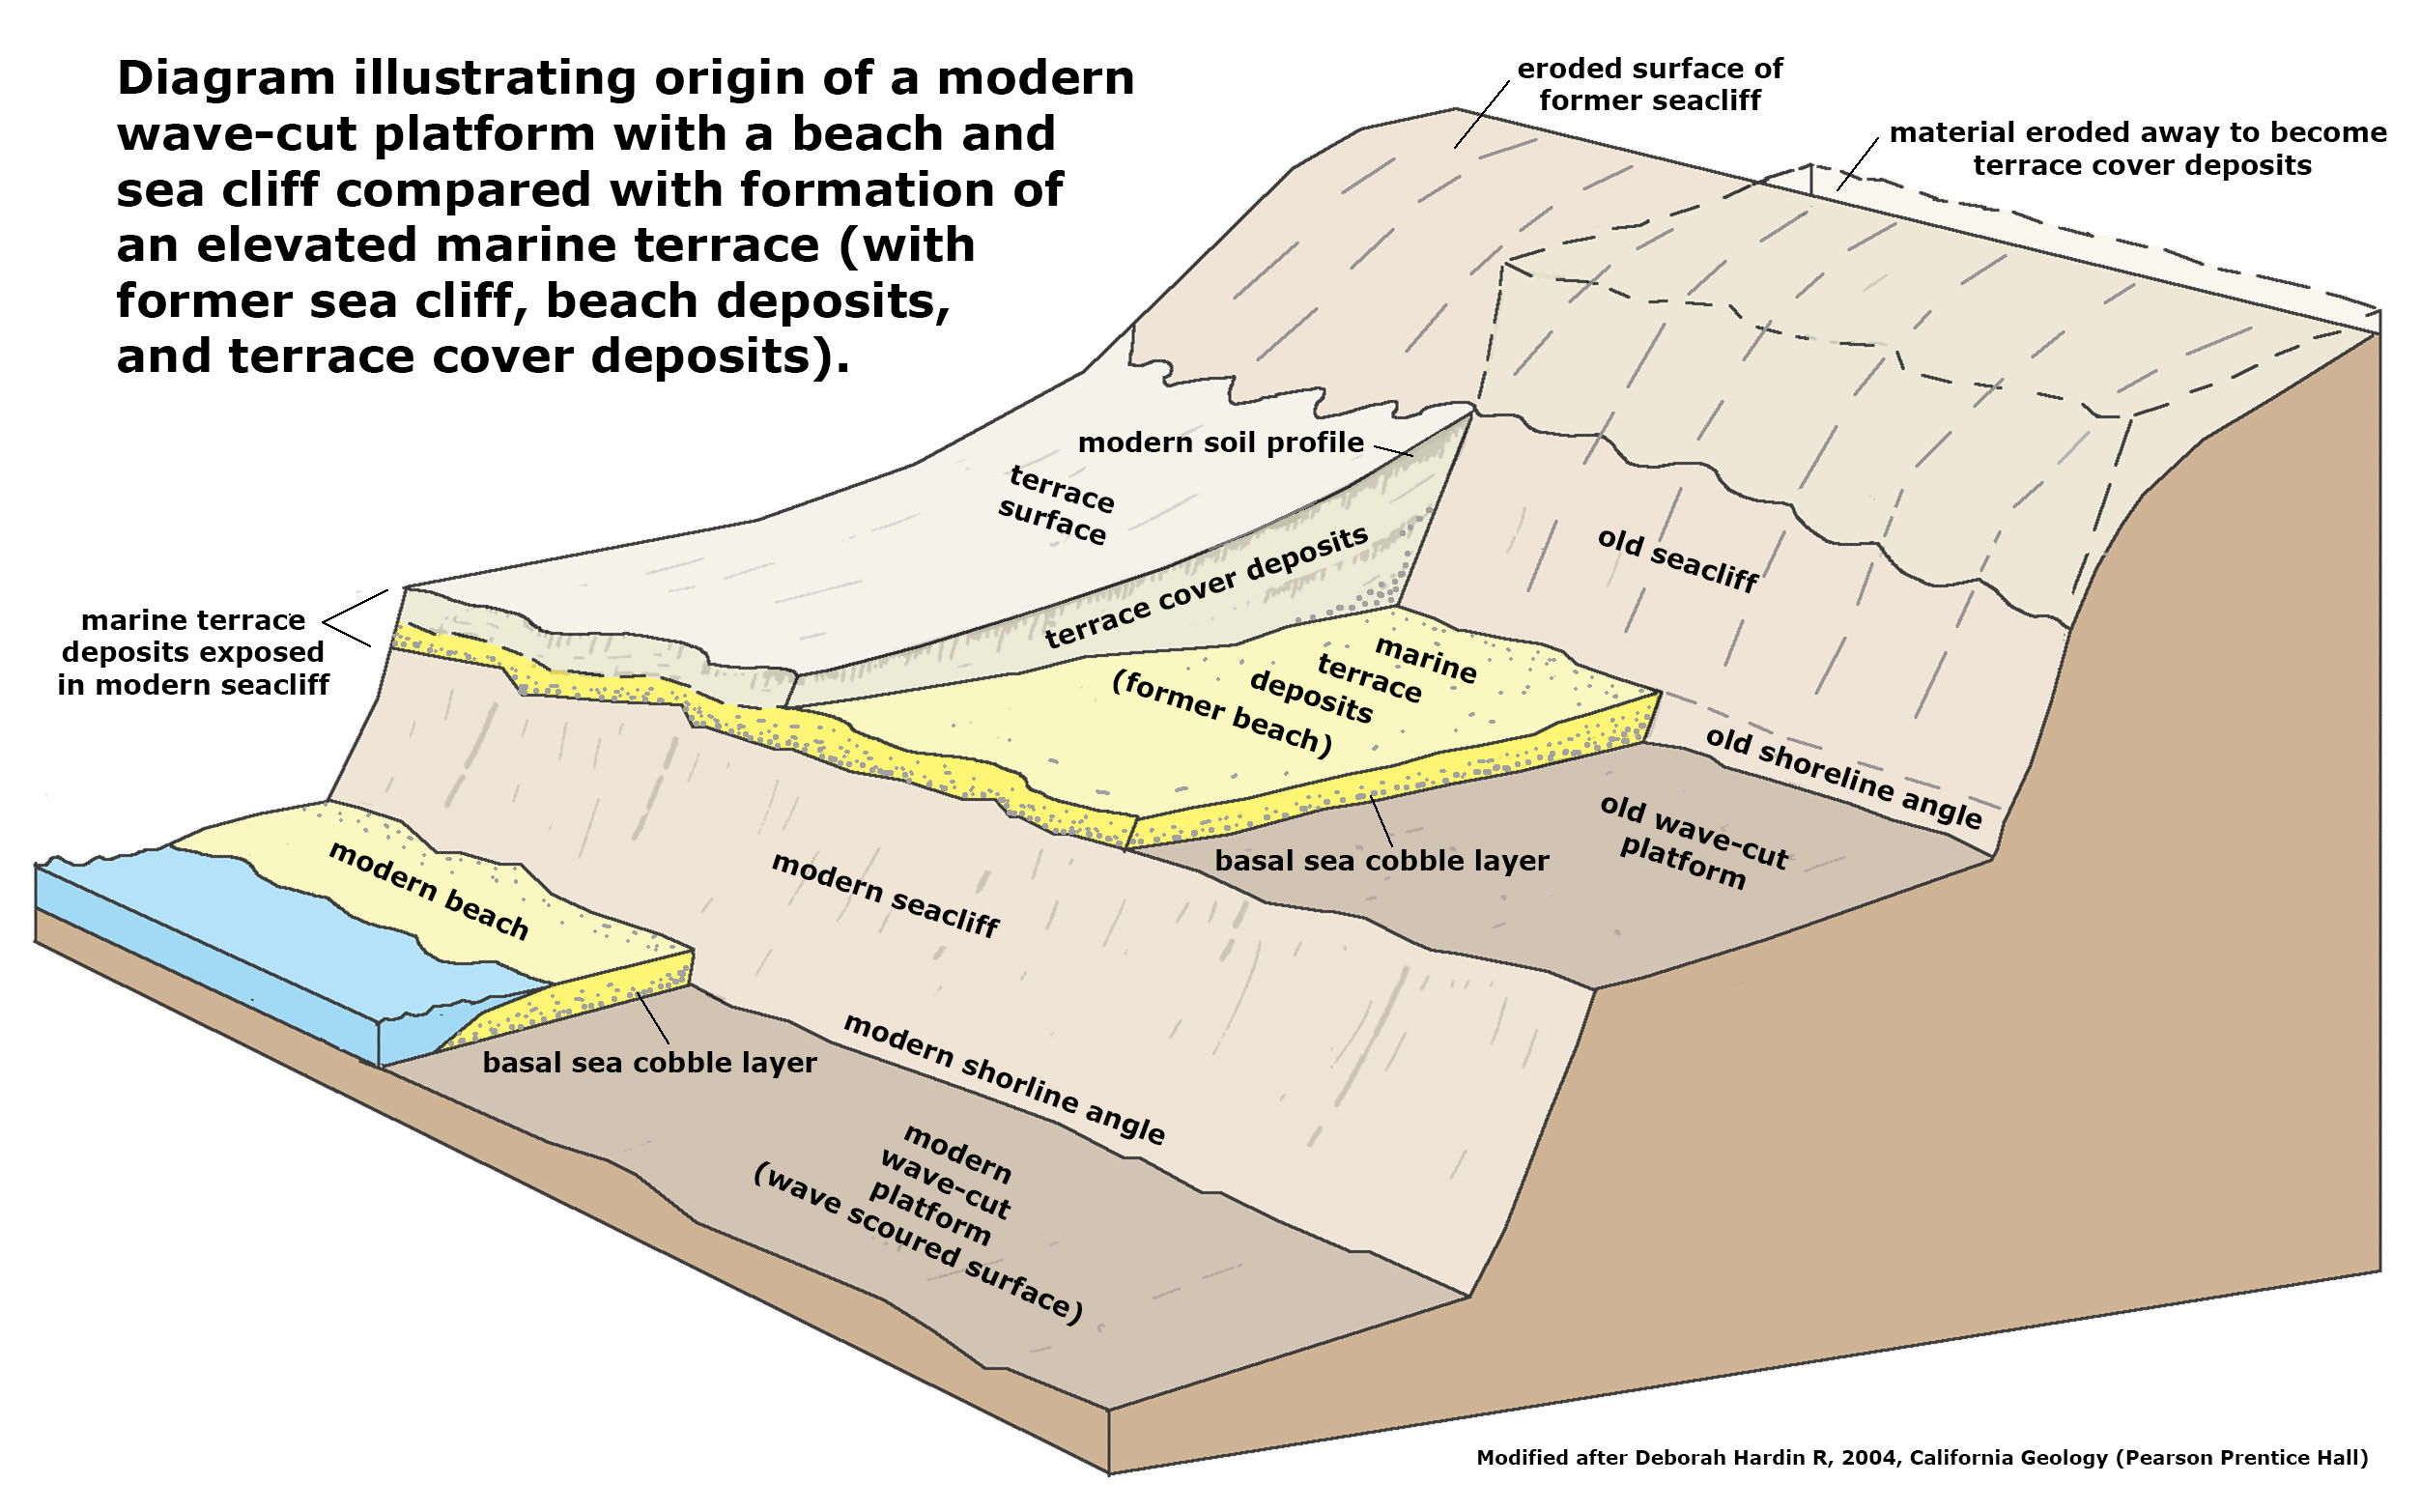
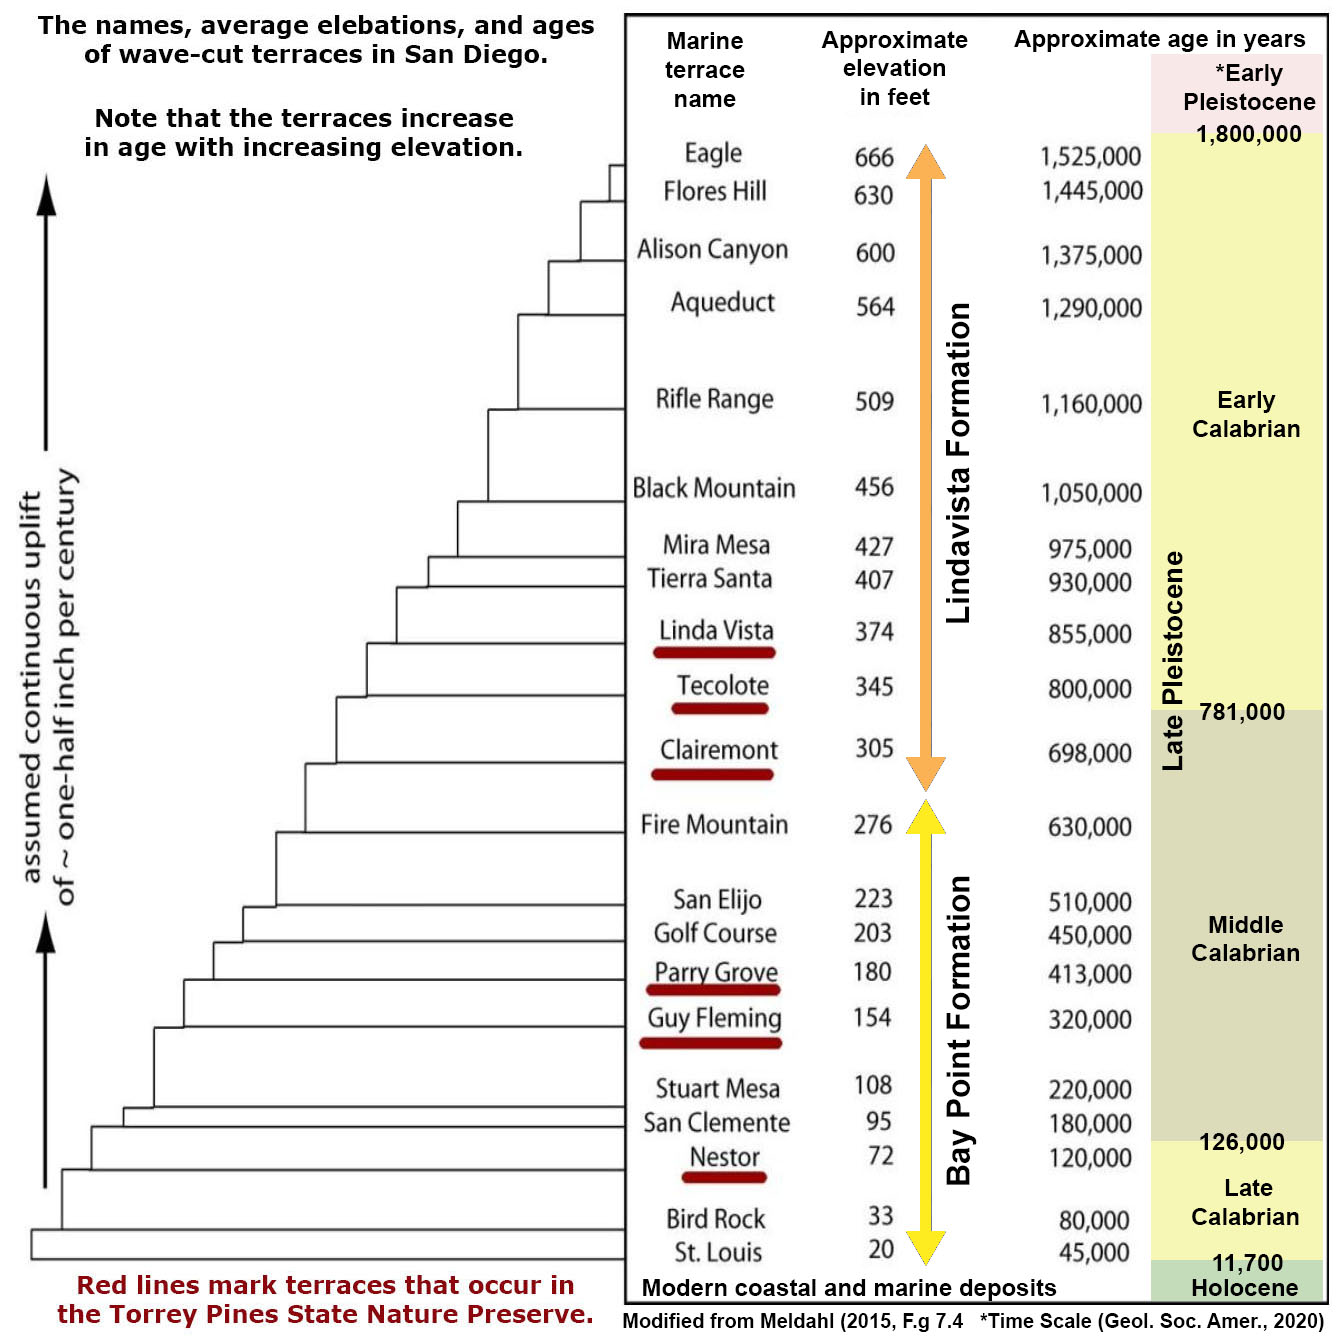
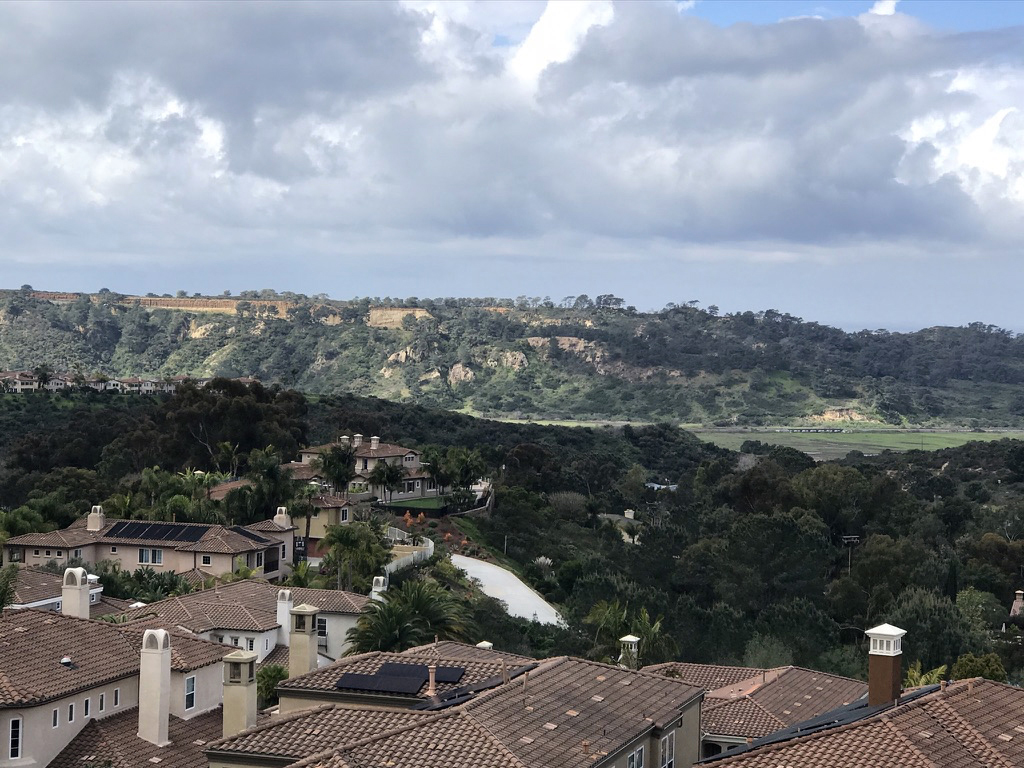
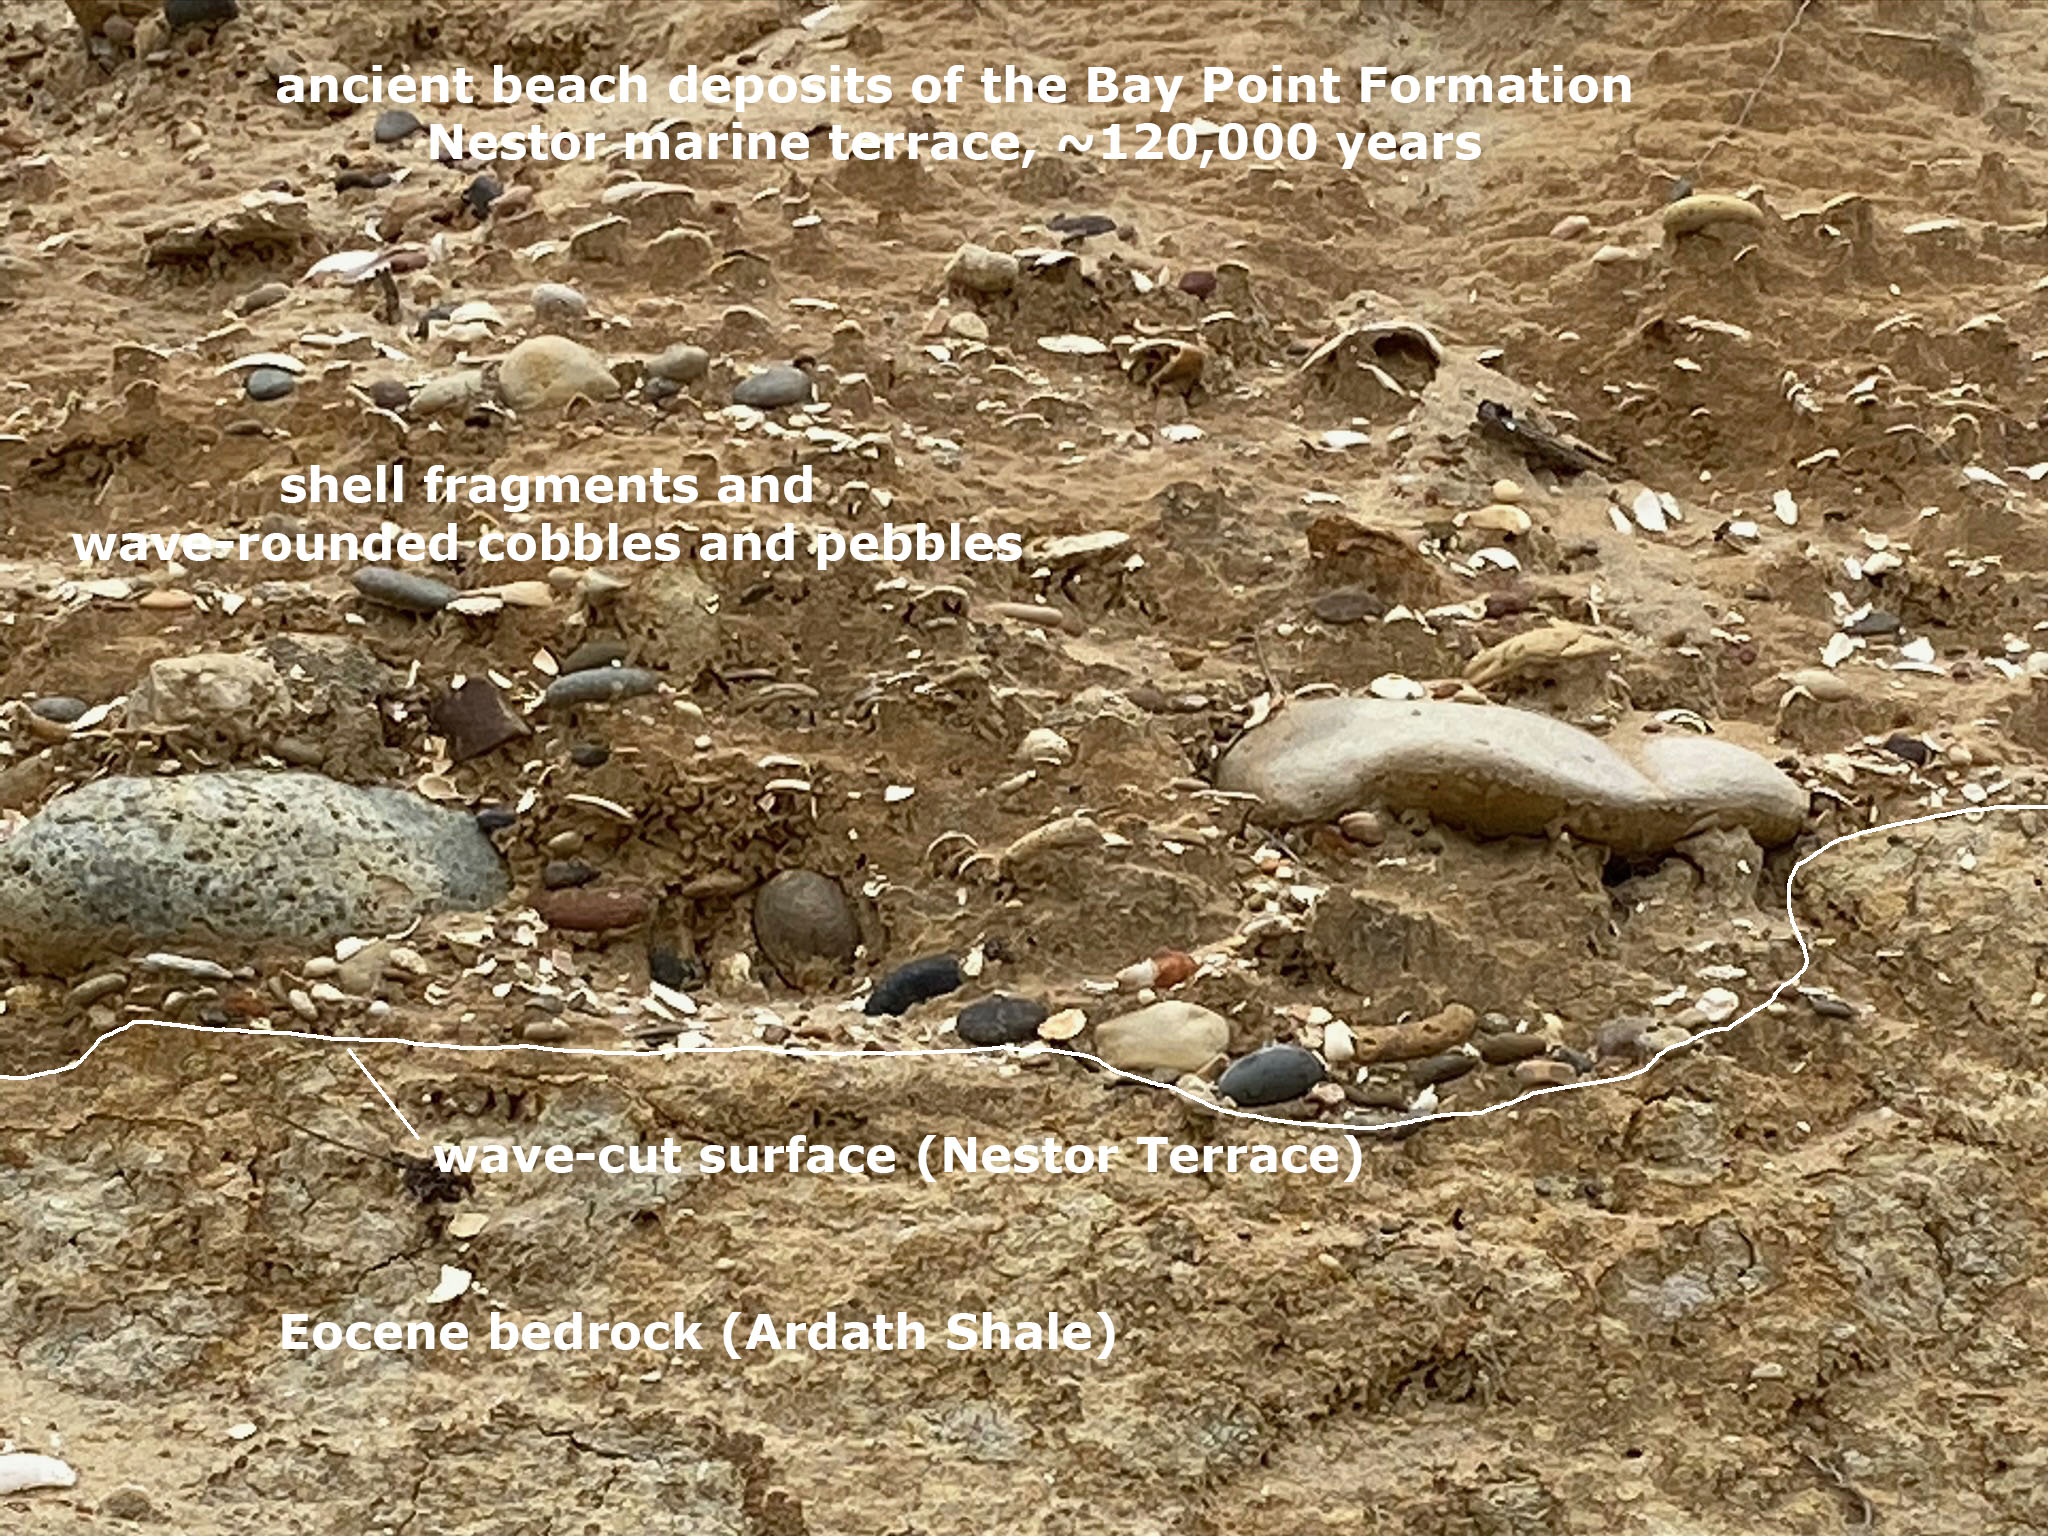
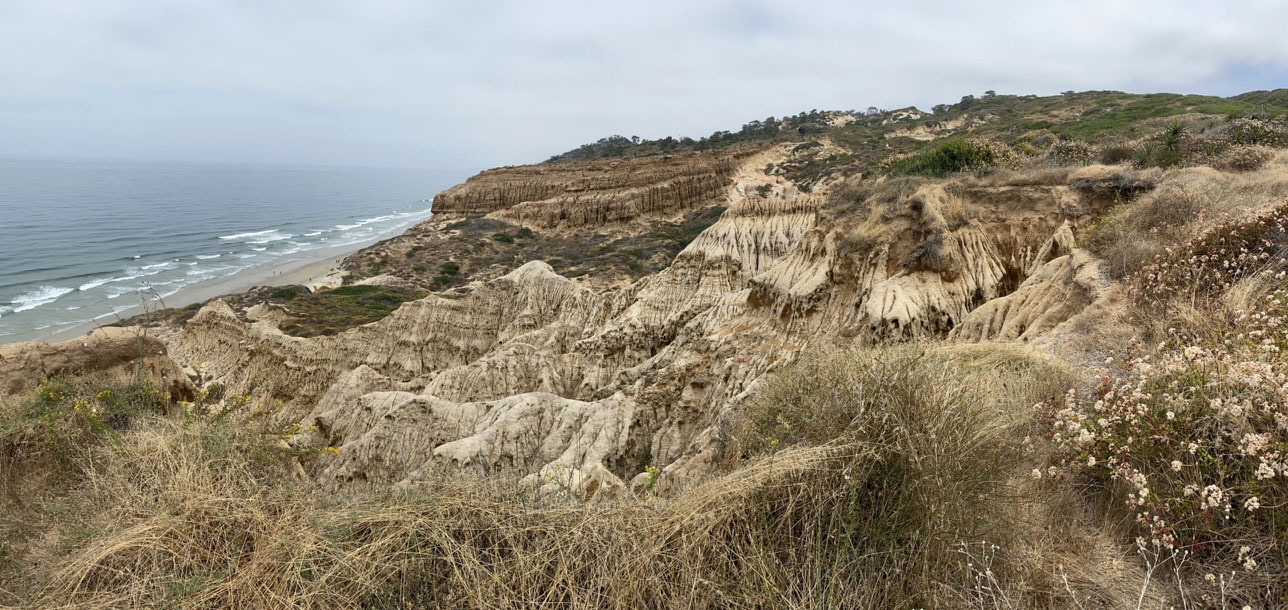
The Ice Ages of the Pleistocene Epoch began about 2.4 million years ago, and the last ice age ended about 11,500 years ago (although they are still occurring in Greenland and Antarctica, at least for now). In that time period there were at least 16 glaciations (possibly as many as 20 have been suggested). A glaciation is the process or result of large areas of land being covered by extensive polar ice sheets. At the peak of the glaciations, continental ice sheets covered much of northern North America, northern Europe, Siberia, and ice caps covered many mountain ranges around the world (Figure 73). Some of these glaciation periods lasted longer and were more extensive than others. Marine TerracesFigure 75 shows an undeveloped coastline on San Clemente Island that preserves a series of elevated marine terraces and associated sea cliffs along rising coastlines. Figure 76 shows how each marine terrace is linked to a peak in high-standing sea levels during the interglacial periods between glaciations. Figure 77 illustrates how wave-cut platform and seacliffs form when sea level is slowly rising, about the pace the land is rising—tectonic forces (including earthquakes) over time cause sections of the coastline to rise. When the next glaciation cycle begins, sea level falls relative to the rising land surface, so the shoreline rapidly retreats seaward while the land continues to rise. The old wave-cut platform becomes a new marine terrace. As a result, each fall and rise in sea level creates an new "step" (marine terrace and seacliff) along a rising shoreline.Figure 78 shows features comparing the modern wave-cut platform and sea cliff to a marine terrace. Old wave-cut abrasion platforms where the ocean cut steps can be recognized by layers of wave-polished and rounded cobbles that accumulated by density of the shallow seabed. Cobbles tossed by waves was part of the action that initially carved the wave-cut platforms and adjacent sea cliffs. Layers of rounded beach cobbles are locally preserved at at the base of the younger beach sand, dune sand, and alluvial sediments that buried the steps (wave-cut platforms). The older "steps" (wave-cut platforms with seacliffs) are not obvious in some places because they have been mixed and covered with slope wash and stream sediments (sand, mud, and bedrock fragments; alluvium and colluvium). Stable areas have a modern soil profile with plant cover. They cut by canyons, eroded into badlands, and in some places, locally faulted (discussed below). Geologists have mapped locations of sixteen elevated marine terraces in Southern California region, many are named for features in the Torrey Pines area (Figure 79; after Kennedy & Tan, 2005). Terraces are determined by detailed mapping and elevation measurements of ancient terrace shoreline and wave-cut platforms. Perhaps the easiest way to see the marine terraces is to look south from Torrey Pines Beach or a park overlook towards La Jolla. The stairs-like steps are clearly visible highlighted along the skyline (Figure 80). In Torrey Pines Reserve, they found the following terraces: Linda Vista, Tecolote, Clairemont, Parry Grove, Guy Fleming, and Nestor (oldest to youngest, respectively; see the terrace locations indicated on park area map locations in Figure 11). The younger Bird Rock and St. Louis marine terraces features may be partially preserved along Peñasquitos Lagoon and possibly in small locations along Black Beach down to La Jolla. These marine terraces (and associated sedimentary deposits) have been dated to correspond to two named rock formation: the Lindavista Formation of early Late Pleistocene age (about 800,000 to 1.5 million years), and the Bay Point Formation of Late Pleistocene age (younger than 800,000 years). These two formations are discussed below. |
|


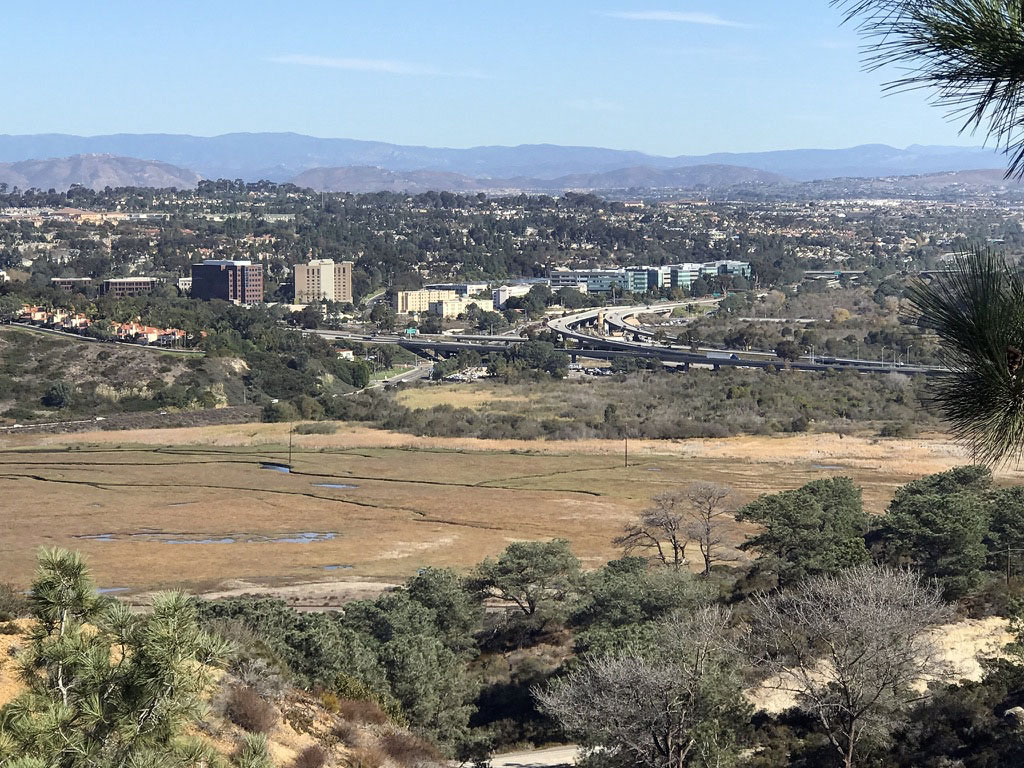
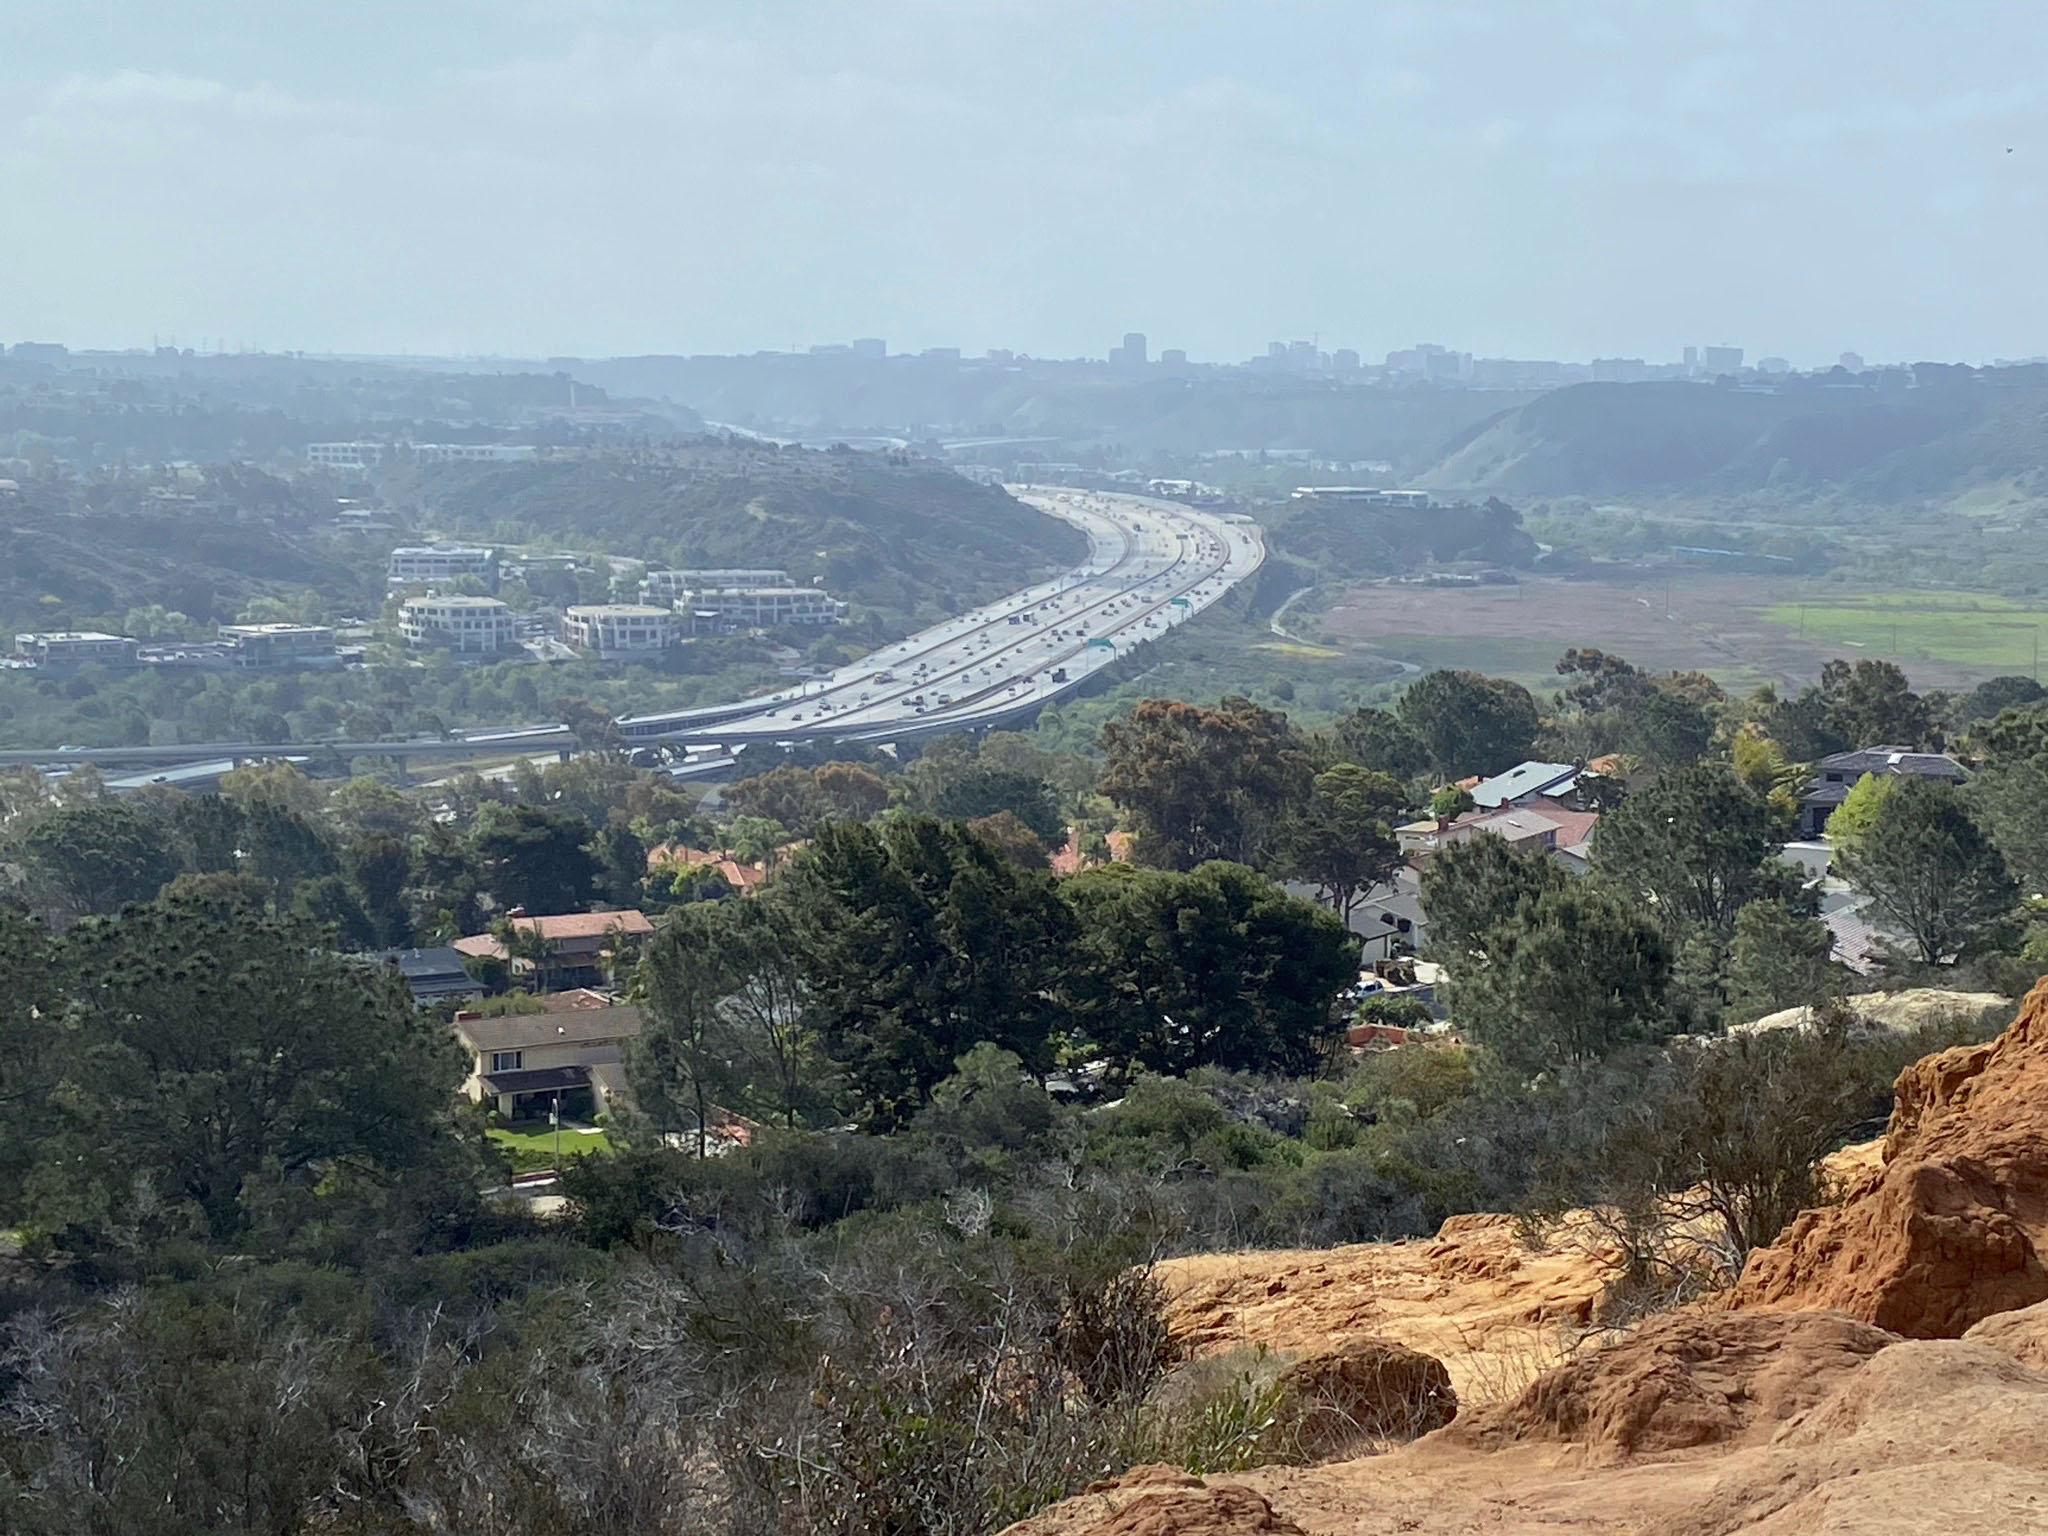
San Diego's Mesas And An Erosionally Dissected PlateauFigure 81 is a view looking east from a trail overlook in the Northern Extension part of the Torrey Pines Nature Reserve. The view shows the vast mesa region that extends eastward to the foothills of the Peninsular ranges in the distance. There are many communities in this region that include the word mesa in their name including Del Mar Mesa, Kearny Mesa, La Mesa, Linda Vista Mesa, Mira Mesa, North Clairemont Mesa, and Serra Mesa (to name a few). These mesas are part of a larger erosionally dissected plateau. The pale yellow-buff-colored area labeled "sedimentary rocks (Quaternary age)" on the geologic map (see Figure 6) basically shows the extent of the relatively flat upland region that has been cut by many of the principal streams draining for the mountains. |
 Fig. 81. View looking east at Linda Vista Mesa east of Torrey Pines. The erosionally dissected plateau (mesas) were carved into an ancient seafloor about a million years ago. |
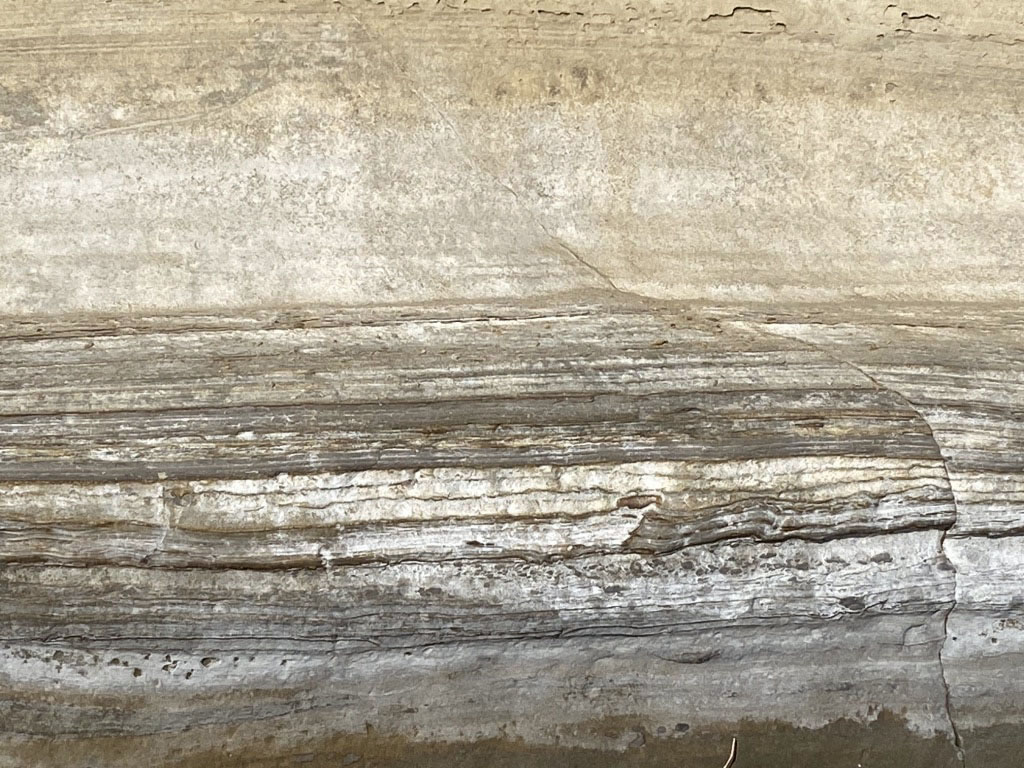
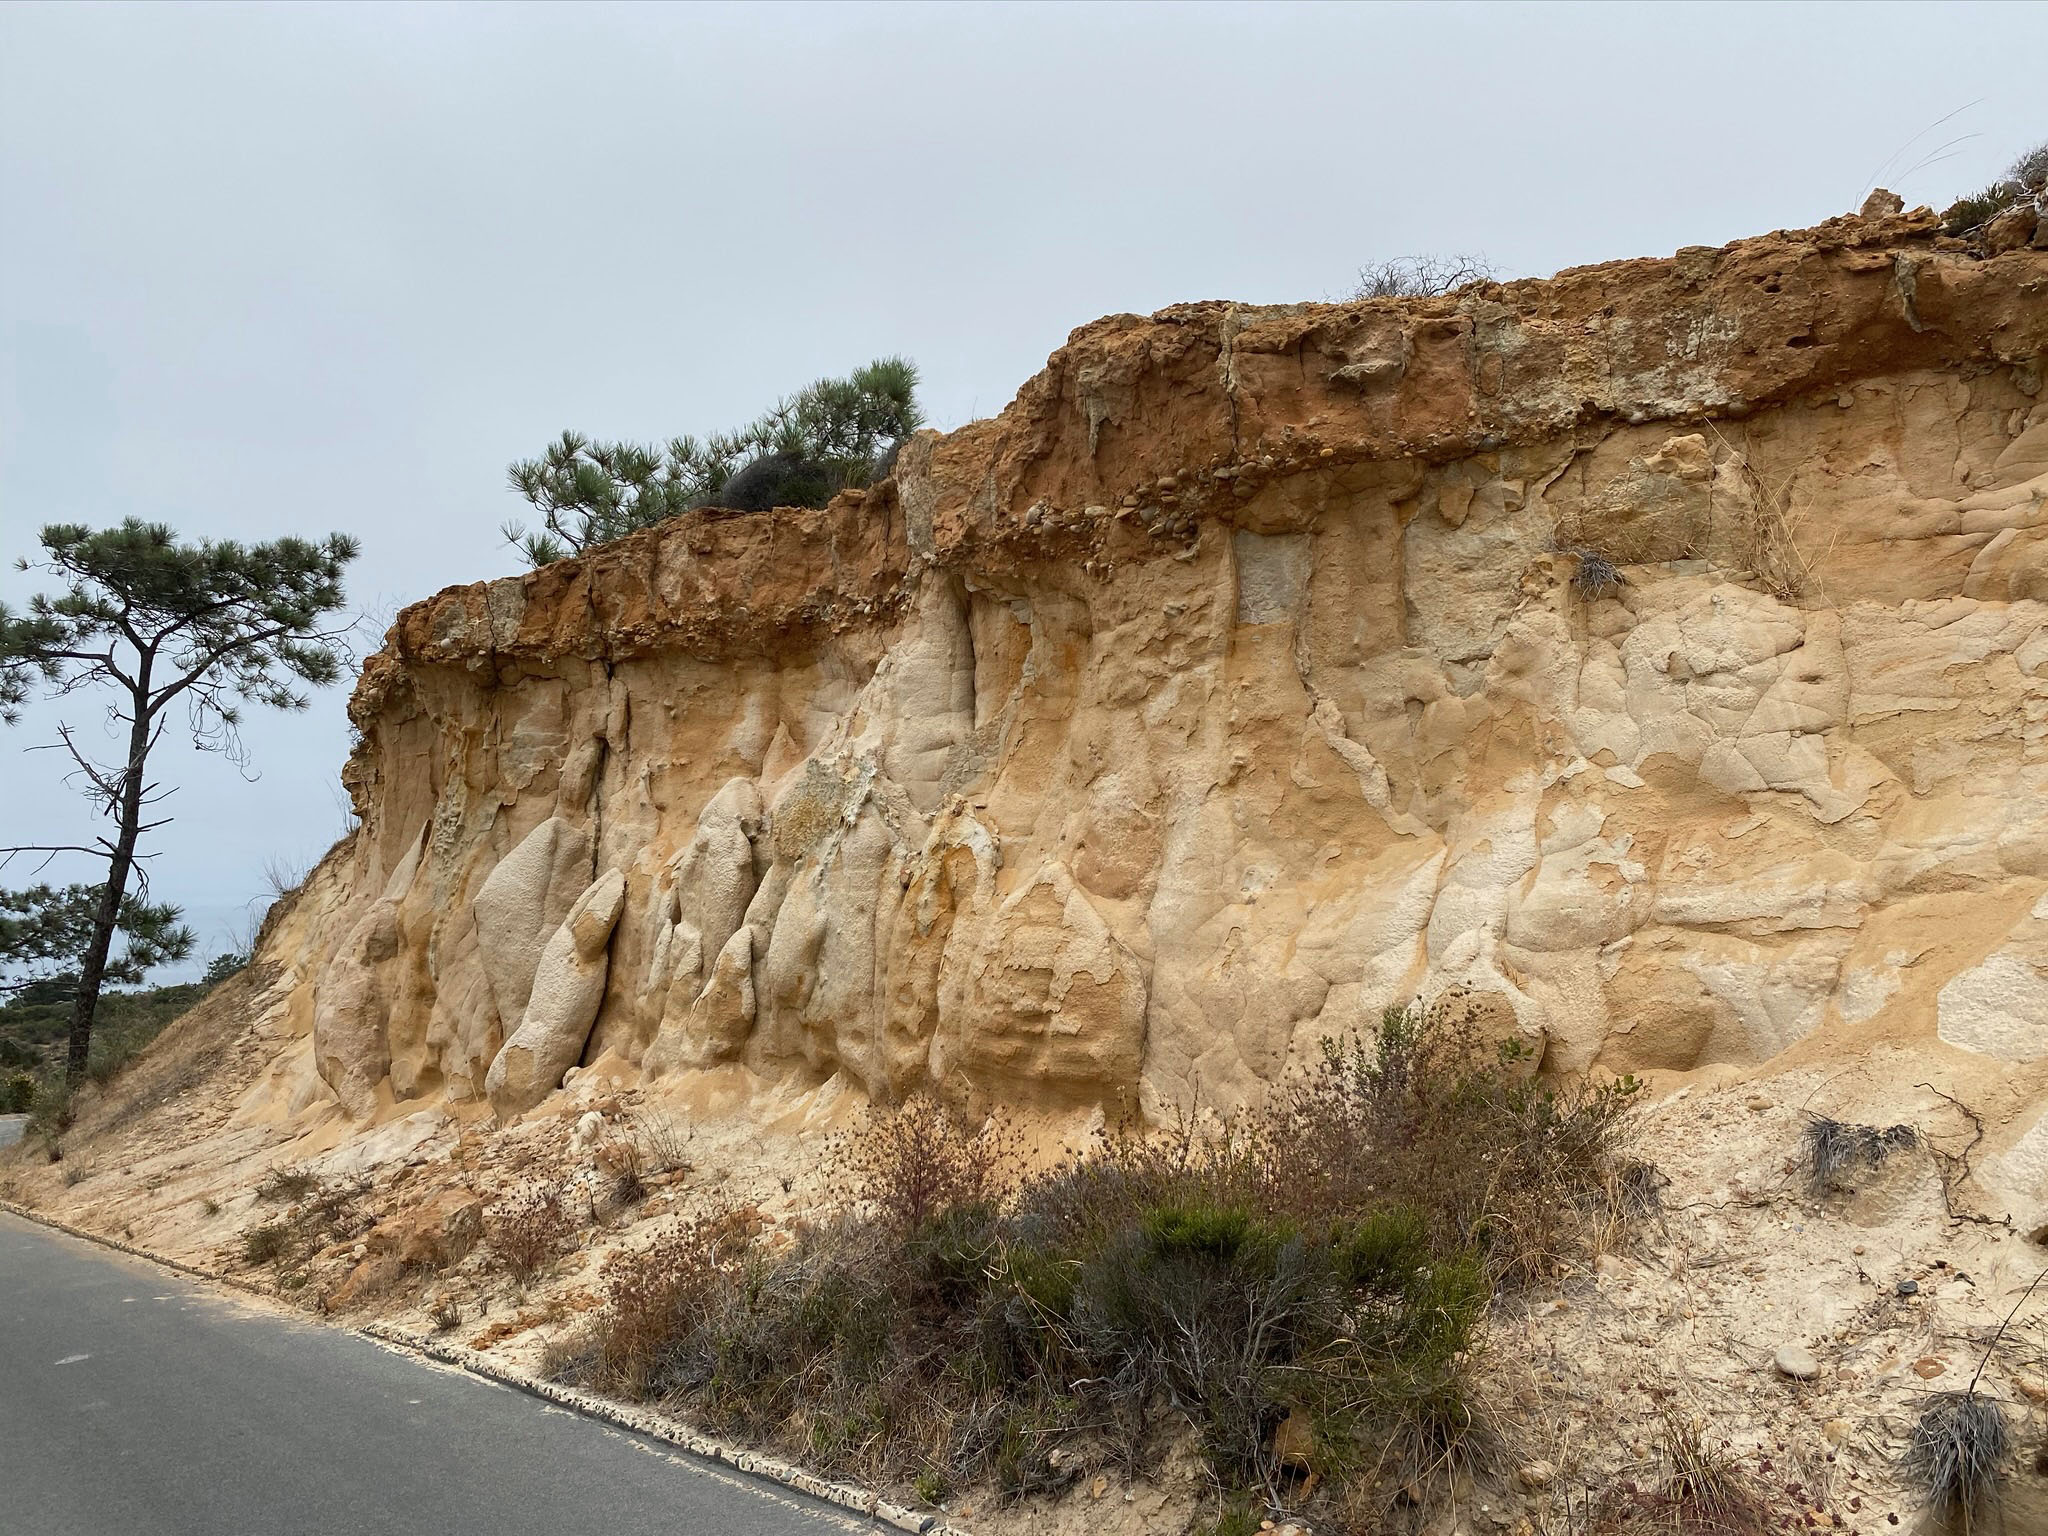
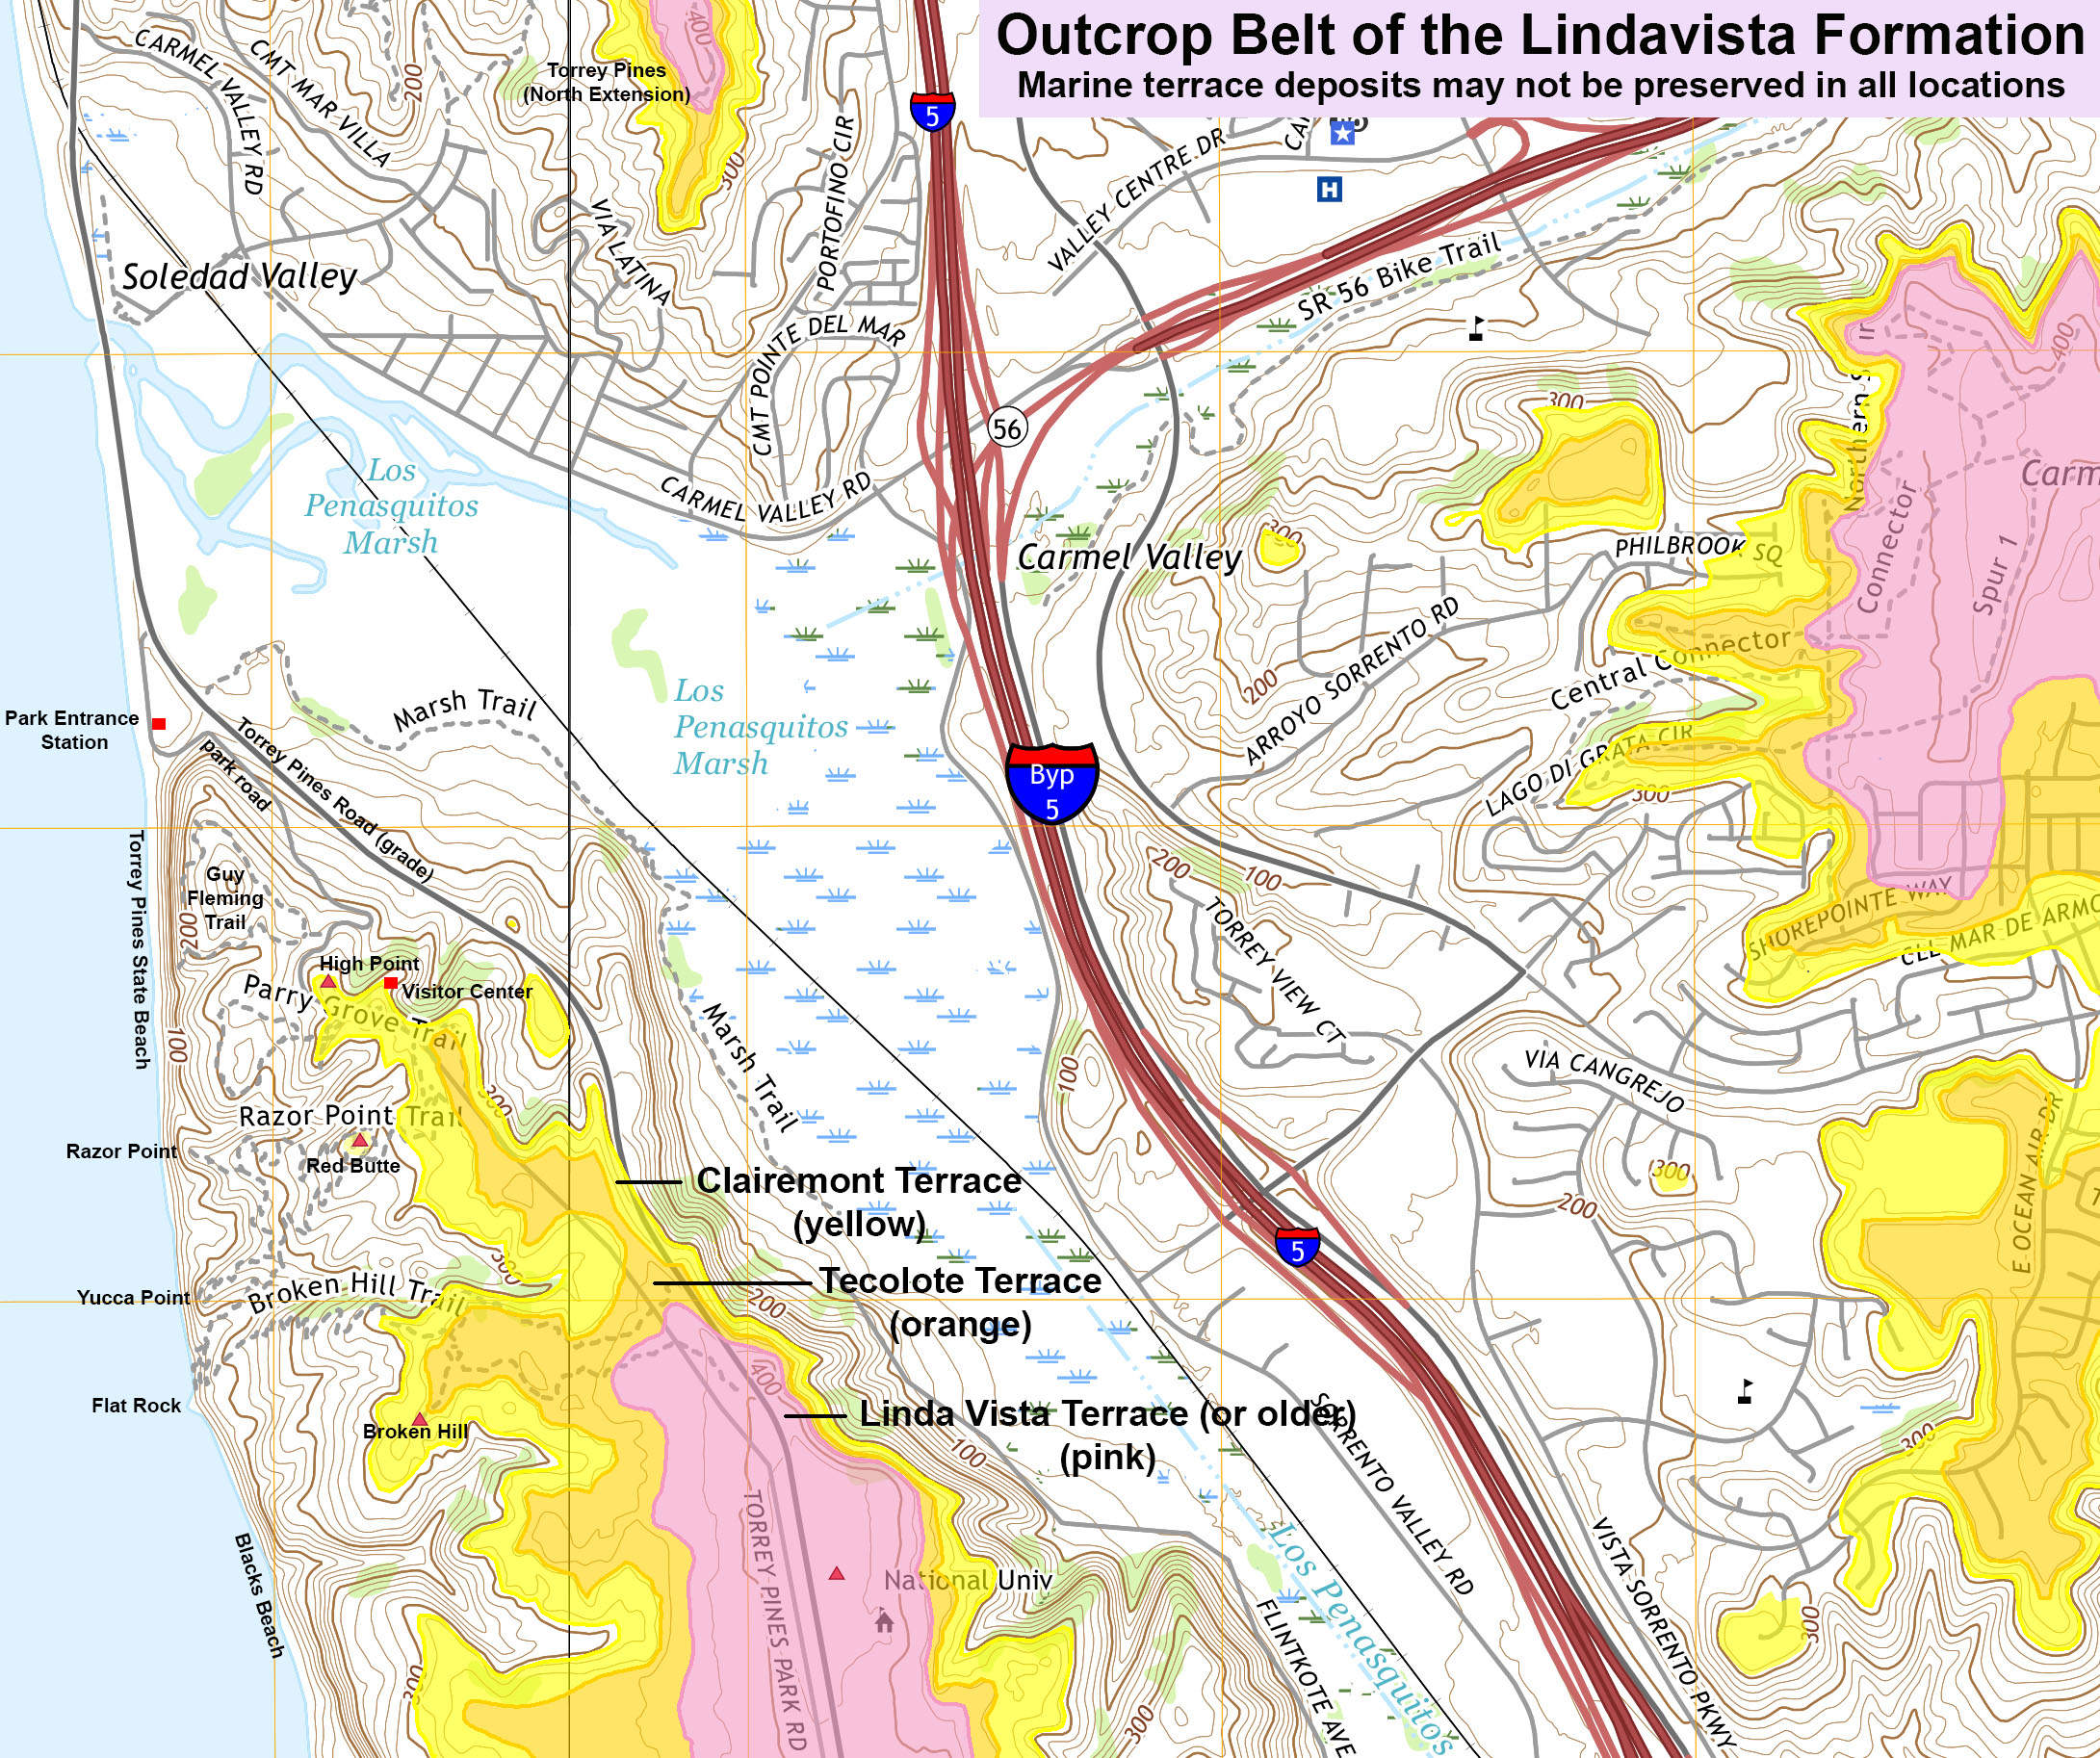
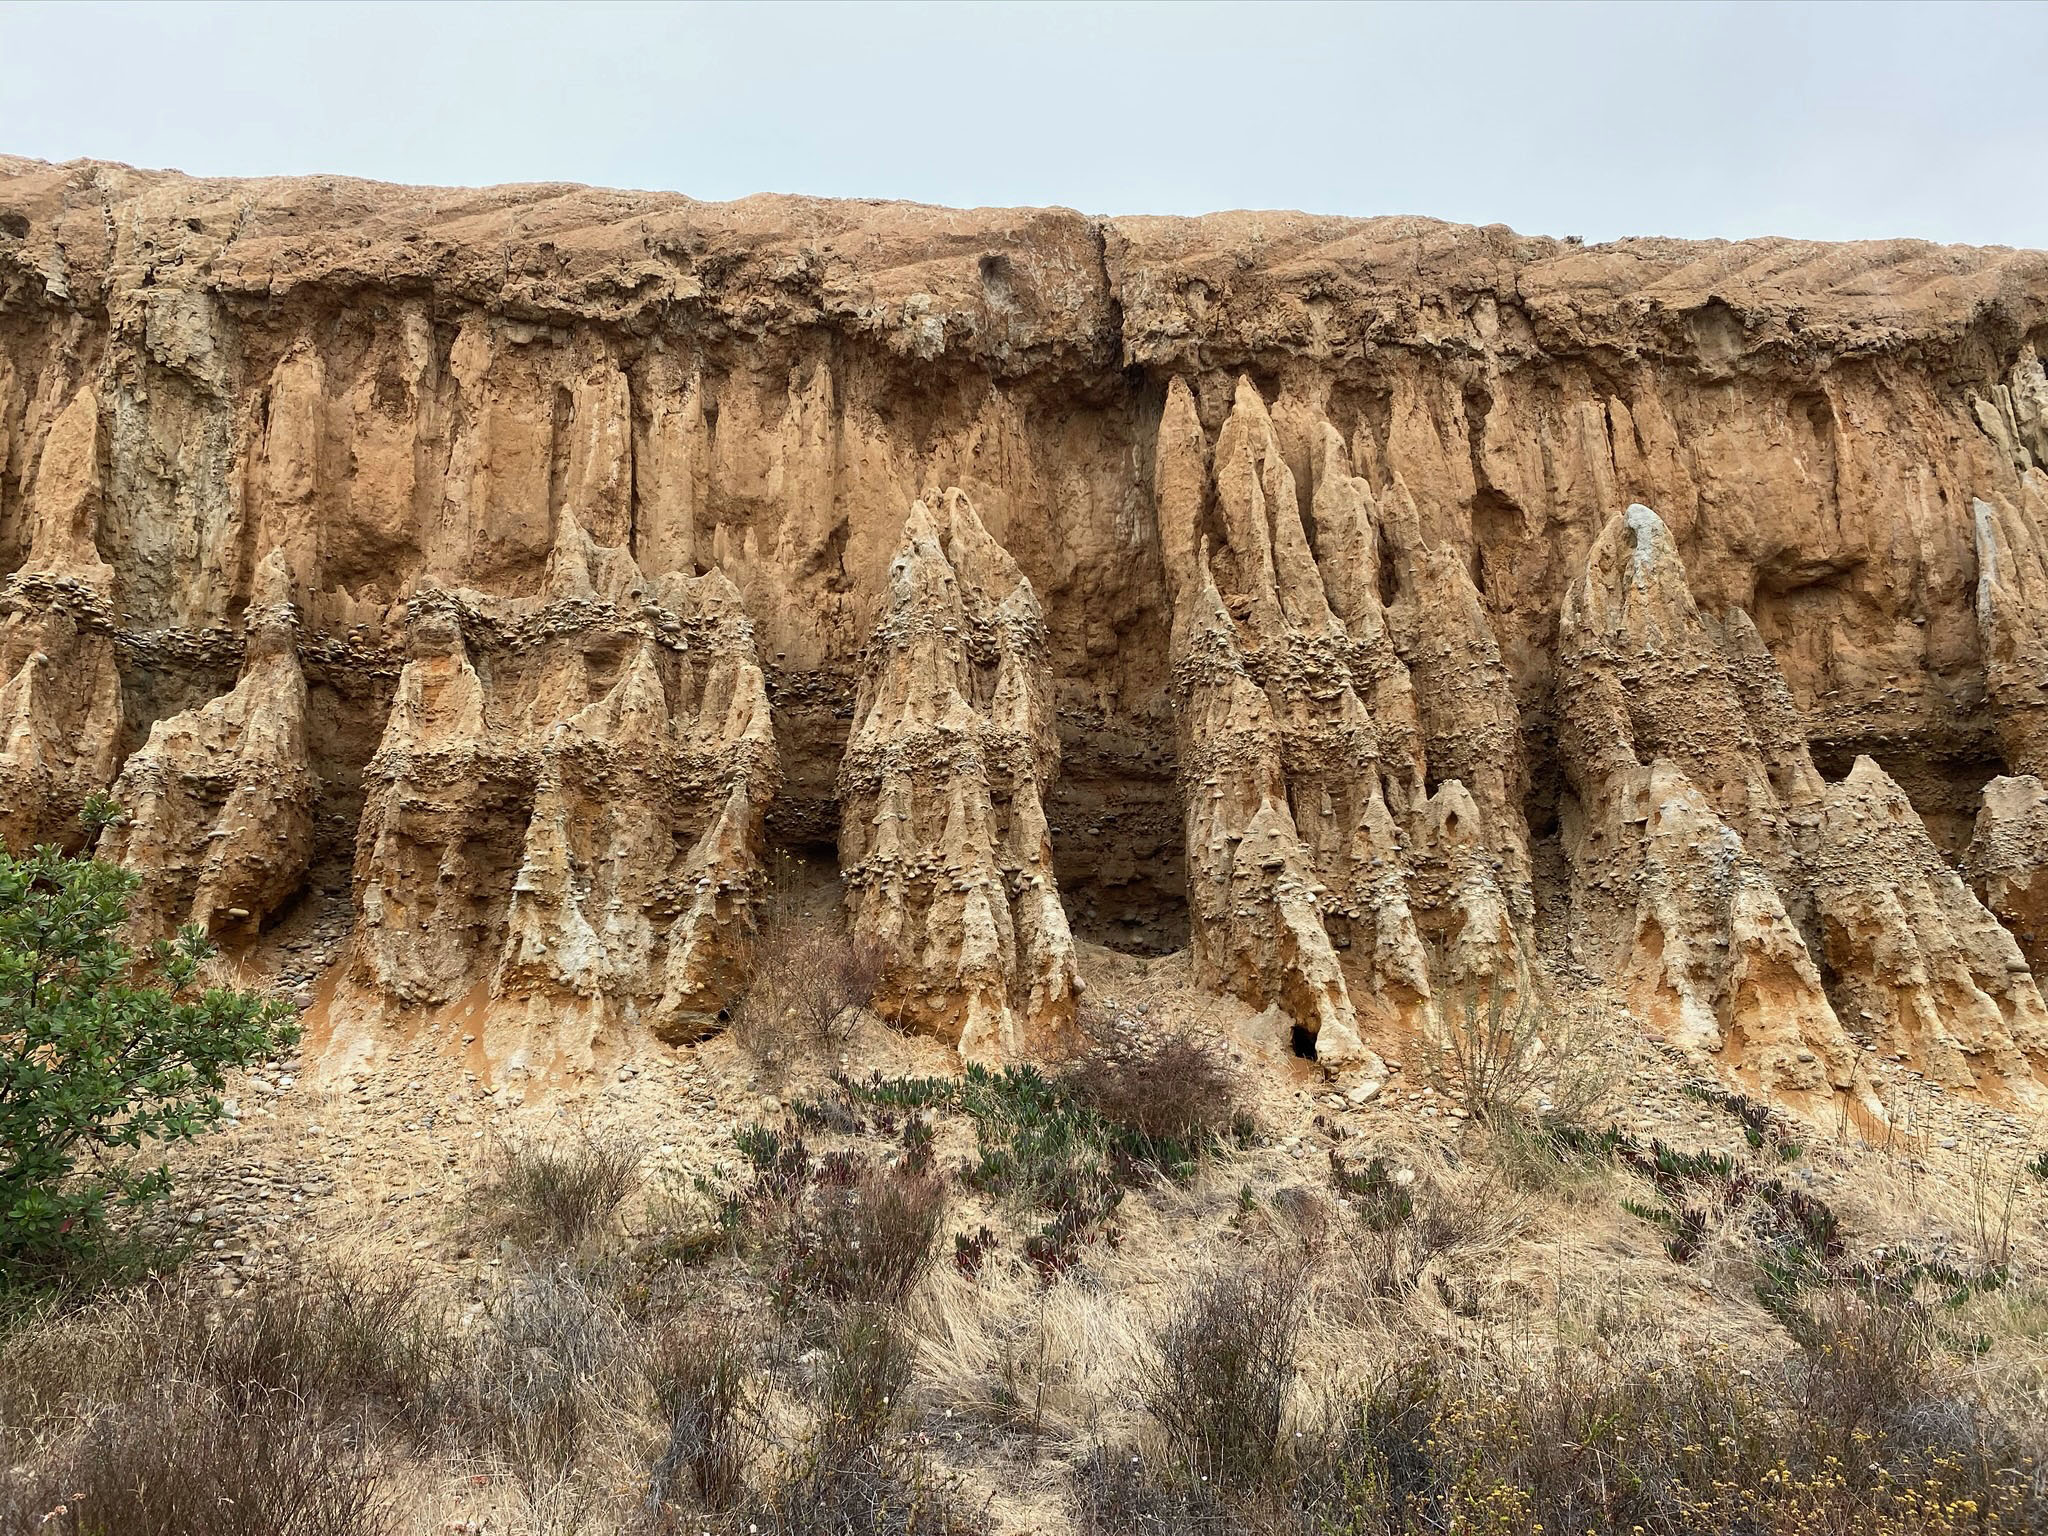
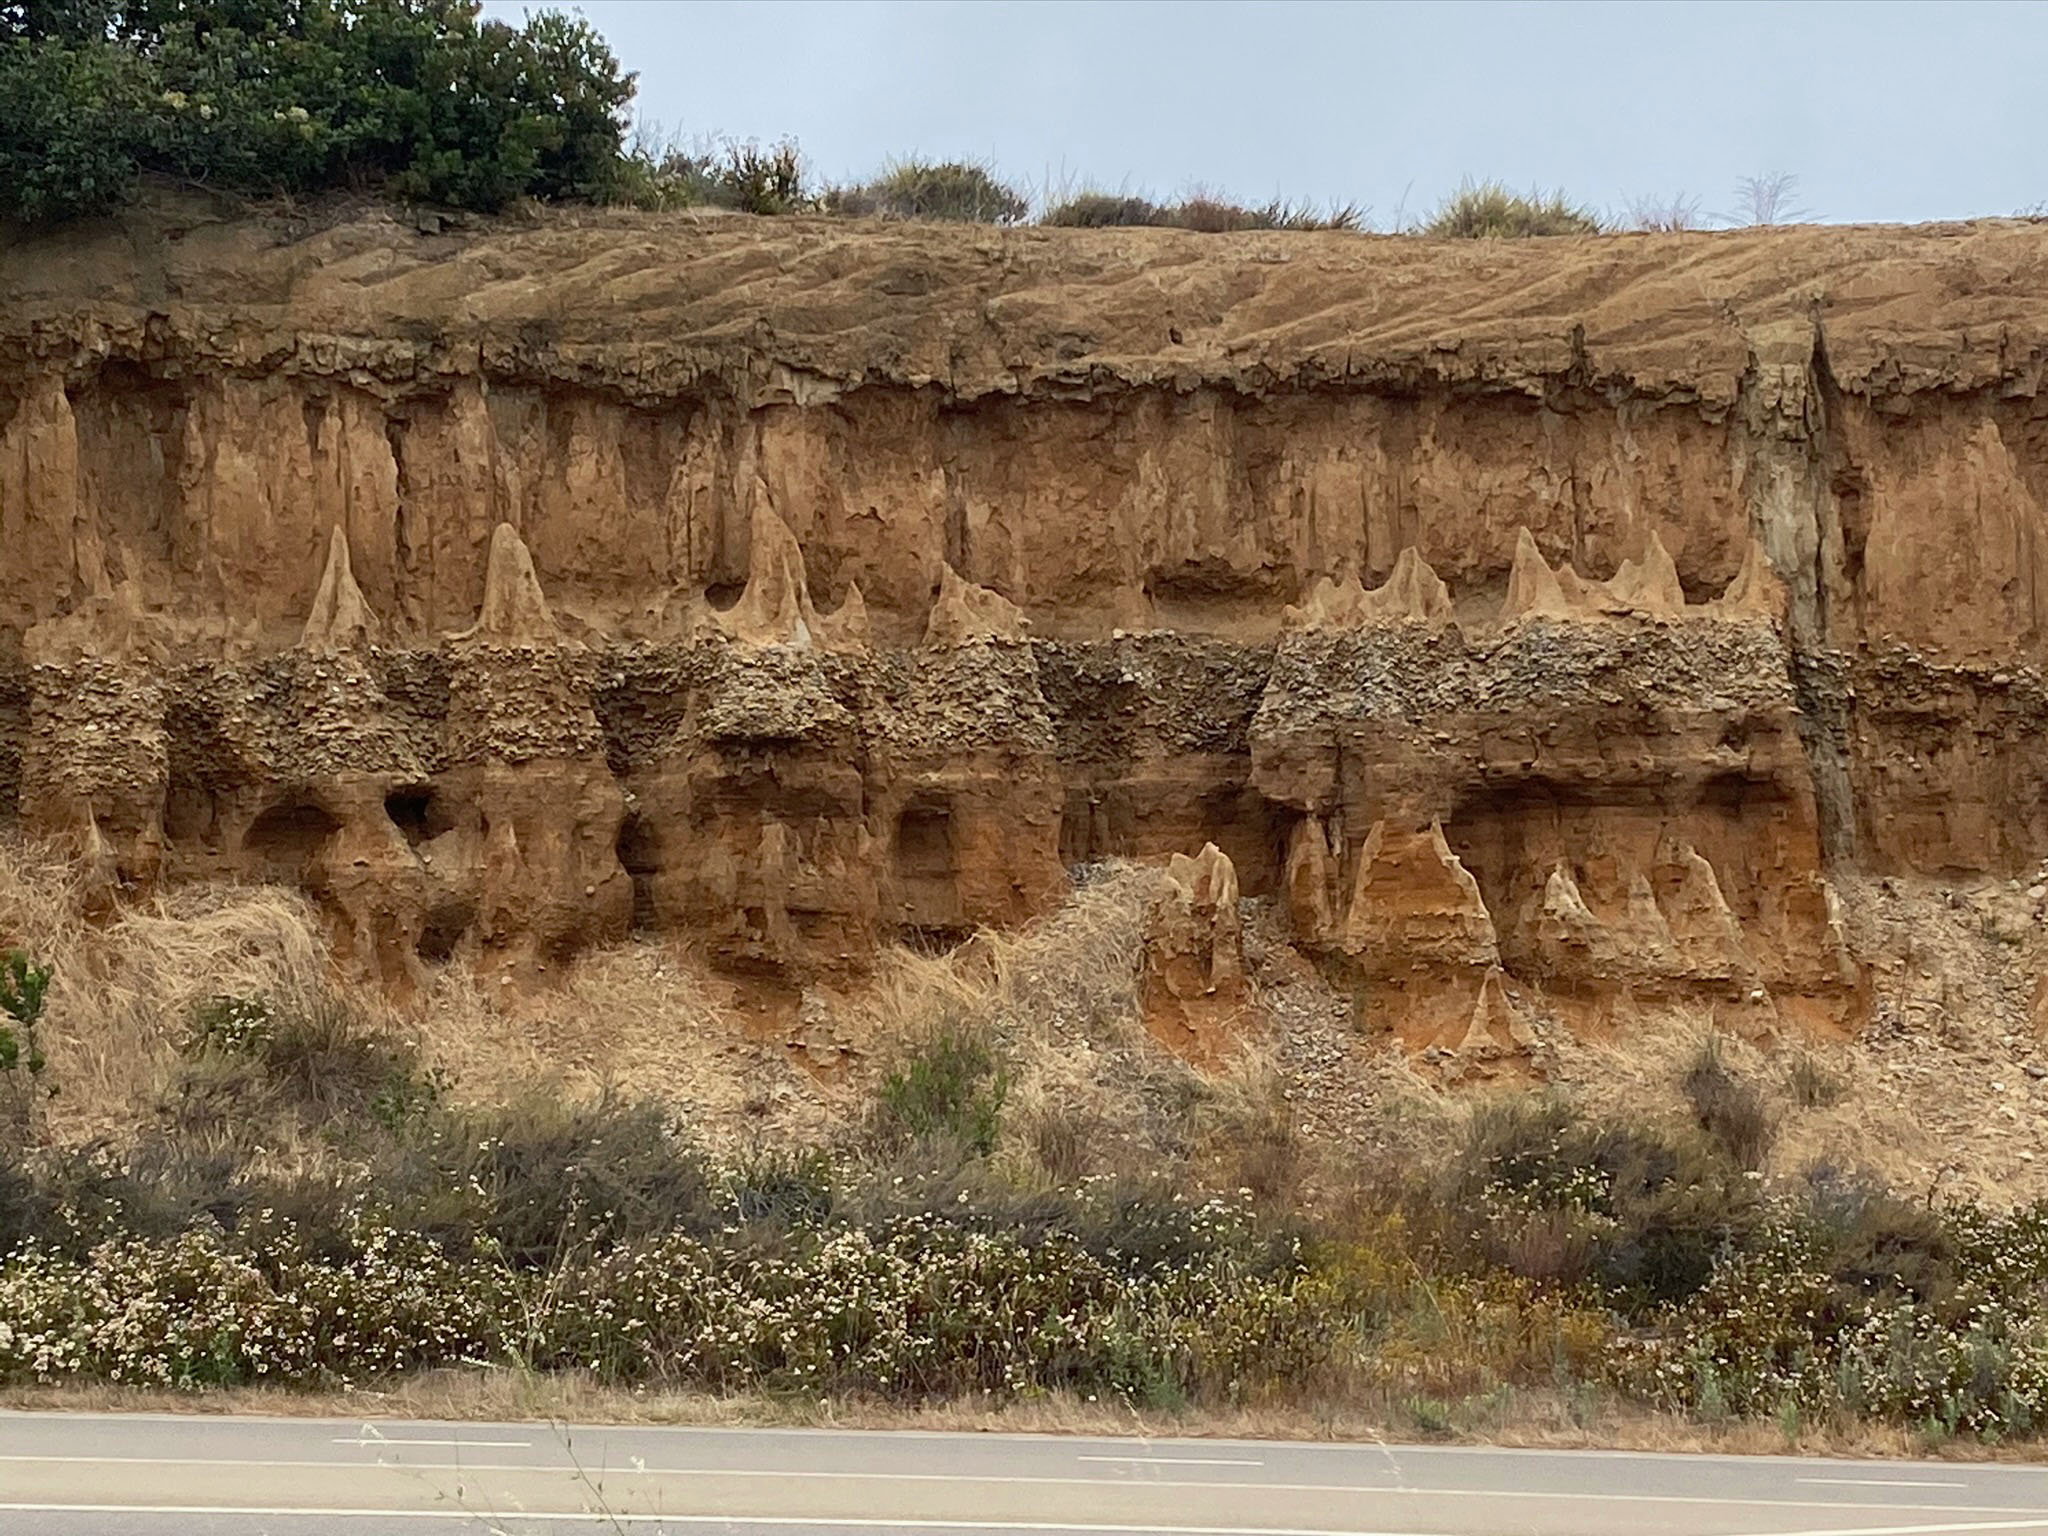
Lindavista FormationThe Lindavista Formation (original, official USGS name) or Linda Vista Formation (alternative name in literature) is the hard caprock on the plateau (mesas) region between the coast and the western base of the western foothills (shown in Figure 81). It is also the red cap rock on top of the flat upland areas in the Torrey Pines park area (Figures 82, 83, and 84). The Lindavista Formation and is associated cap-rock surfaces is one of the most significant physiographic feature in the San Diego Region, for many reasons. It is mostly the Lindavista Formation that underlies the region is shown in pale yellow on the geologic map. Note the elevations of towns (mesas) locations shown on the map. They are all in the range of about +/-400 feet. Much of the urban development in the greater San Diego area has taken place on these elevated surfaces. it is remarkable to think that about a million years ago during high-standing seas that this region was submerged as part of the continental shelf! The cycles of sea-level rise and fall and marine terrace formation was in full swing. In addition the San Diego coastline has risen about 400 feet in the last million years, or about 1/2 inch per century. Sea level is currently rising about 8-12 inches per century (depending on location). Marine Terrace Deposits of the Lindavista FormationFigure 85 uses the elevation data for named marine terraces in the Torrey Pines area to map the probable location of existing and potential outcrops of the various marine terrace levels. Note that this isn't a geologic map (per se) but rather a potential outcrop map because marine terrace deposits may not exist or be preserved in all these locations shown as colors on the map. The marine terrace deposits presents somewhat of a paradox that contradicts one of the Basic Geology Principles (first reported by Charles Lyell and James Hutton in the early 19th Century), the law of superposition states that in any undisturbed sequence of rocks deposited in layers, the youngest layer is on top and the oldest on bottom. The problem with marine terraces is that oldest ones are found higher than the younger ones because of ongoing uplift. However, the marine terraces are exempt because another basic geologic principle, the law of cross-cutting relationships basically states that any fault, fold, igneous body, or other feature that cuts across another geologic feature must be younger than any rock across which it cuts. In the case of marine terraces, the uplift along the coastline is ongoing, as well as the erosion and down-cutting of features degrading the older terrace deposits over time. The highest (oldest) marine terraces show the highest degree of weathering and erosion, in some cases becoming hardly recognizable or vanishing completely. The sedimentary layers in the marine terrace deposits display a variety of sedimentary structures (similar to those in the Eocene formations) including cross-bedding, contorted bedding, and sorting by grain size. The sedimentary layers display evidence of wetting and drying, forming large desiccation fractures and clastic dikes (Figure 93). Clastic dikes may form initially from deep desiccation fissure or tectonic fractures but then may be locally filled in with younger sand or mud that may have flowed in from above or had been injected upward from below by water pressure. The clastic dikes are usually a different color than the older, redder host sediments. |
|
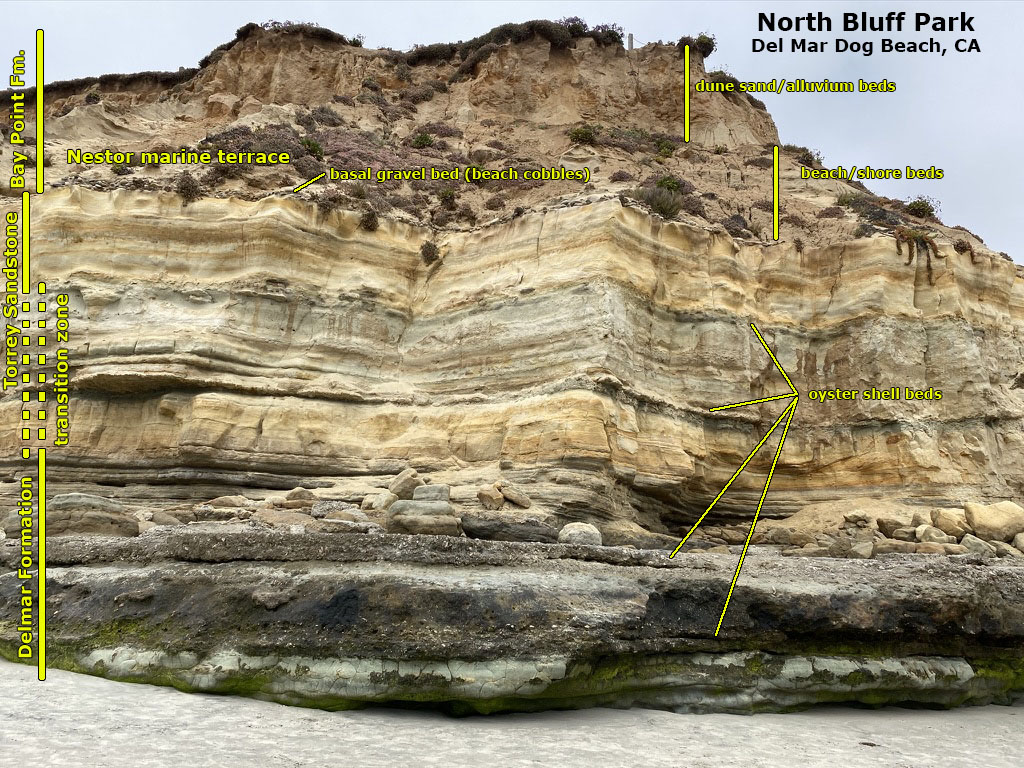
Bay Point FormationThe Bay Point Formation is basically a younger version of the Lindavista Formation. It formed from deposits on a series marine terraces that formed in the late Pleistocene Epoch. However, the Bay Point Formation has not endured the higher degree of weathering alteration and erosion as the older Lindavista Formation. Marine Terraces of the Bay Point FormationFigure 94 is a map of showing the elevation belts where Bay Point Formation may occur based on elevation data (it may not be present or preserved in these locations). The name marine terraces associated with the Bay Point Formation that are recognized in the Torrey Pines park area include the Parry Grove, Guy Fleming, and Nestor marine terraces (see Figure 79). Of these tree, the Nestor terrace is easiest to see where it is exposed also the sea cliffs (Figures 95) and lower canyons (Figures 96 and 97). Figure 98 shows a close-up view of the basal layer of the Nestor marine terrace deposit showing a mix of cobbles, gravel, sand, and shell fragments. In the older terrace deposits (as in the Lindavista Formation) most of the shell material has dissolved away long ago. The study of marine terraces is used to evaluate variations in regional uplift along the coastline, and to determine the relative rate of displacement along some faults that cut through the terrace, such as the Rose Canyon Fault in La Jolla. |
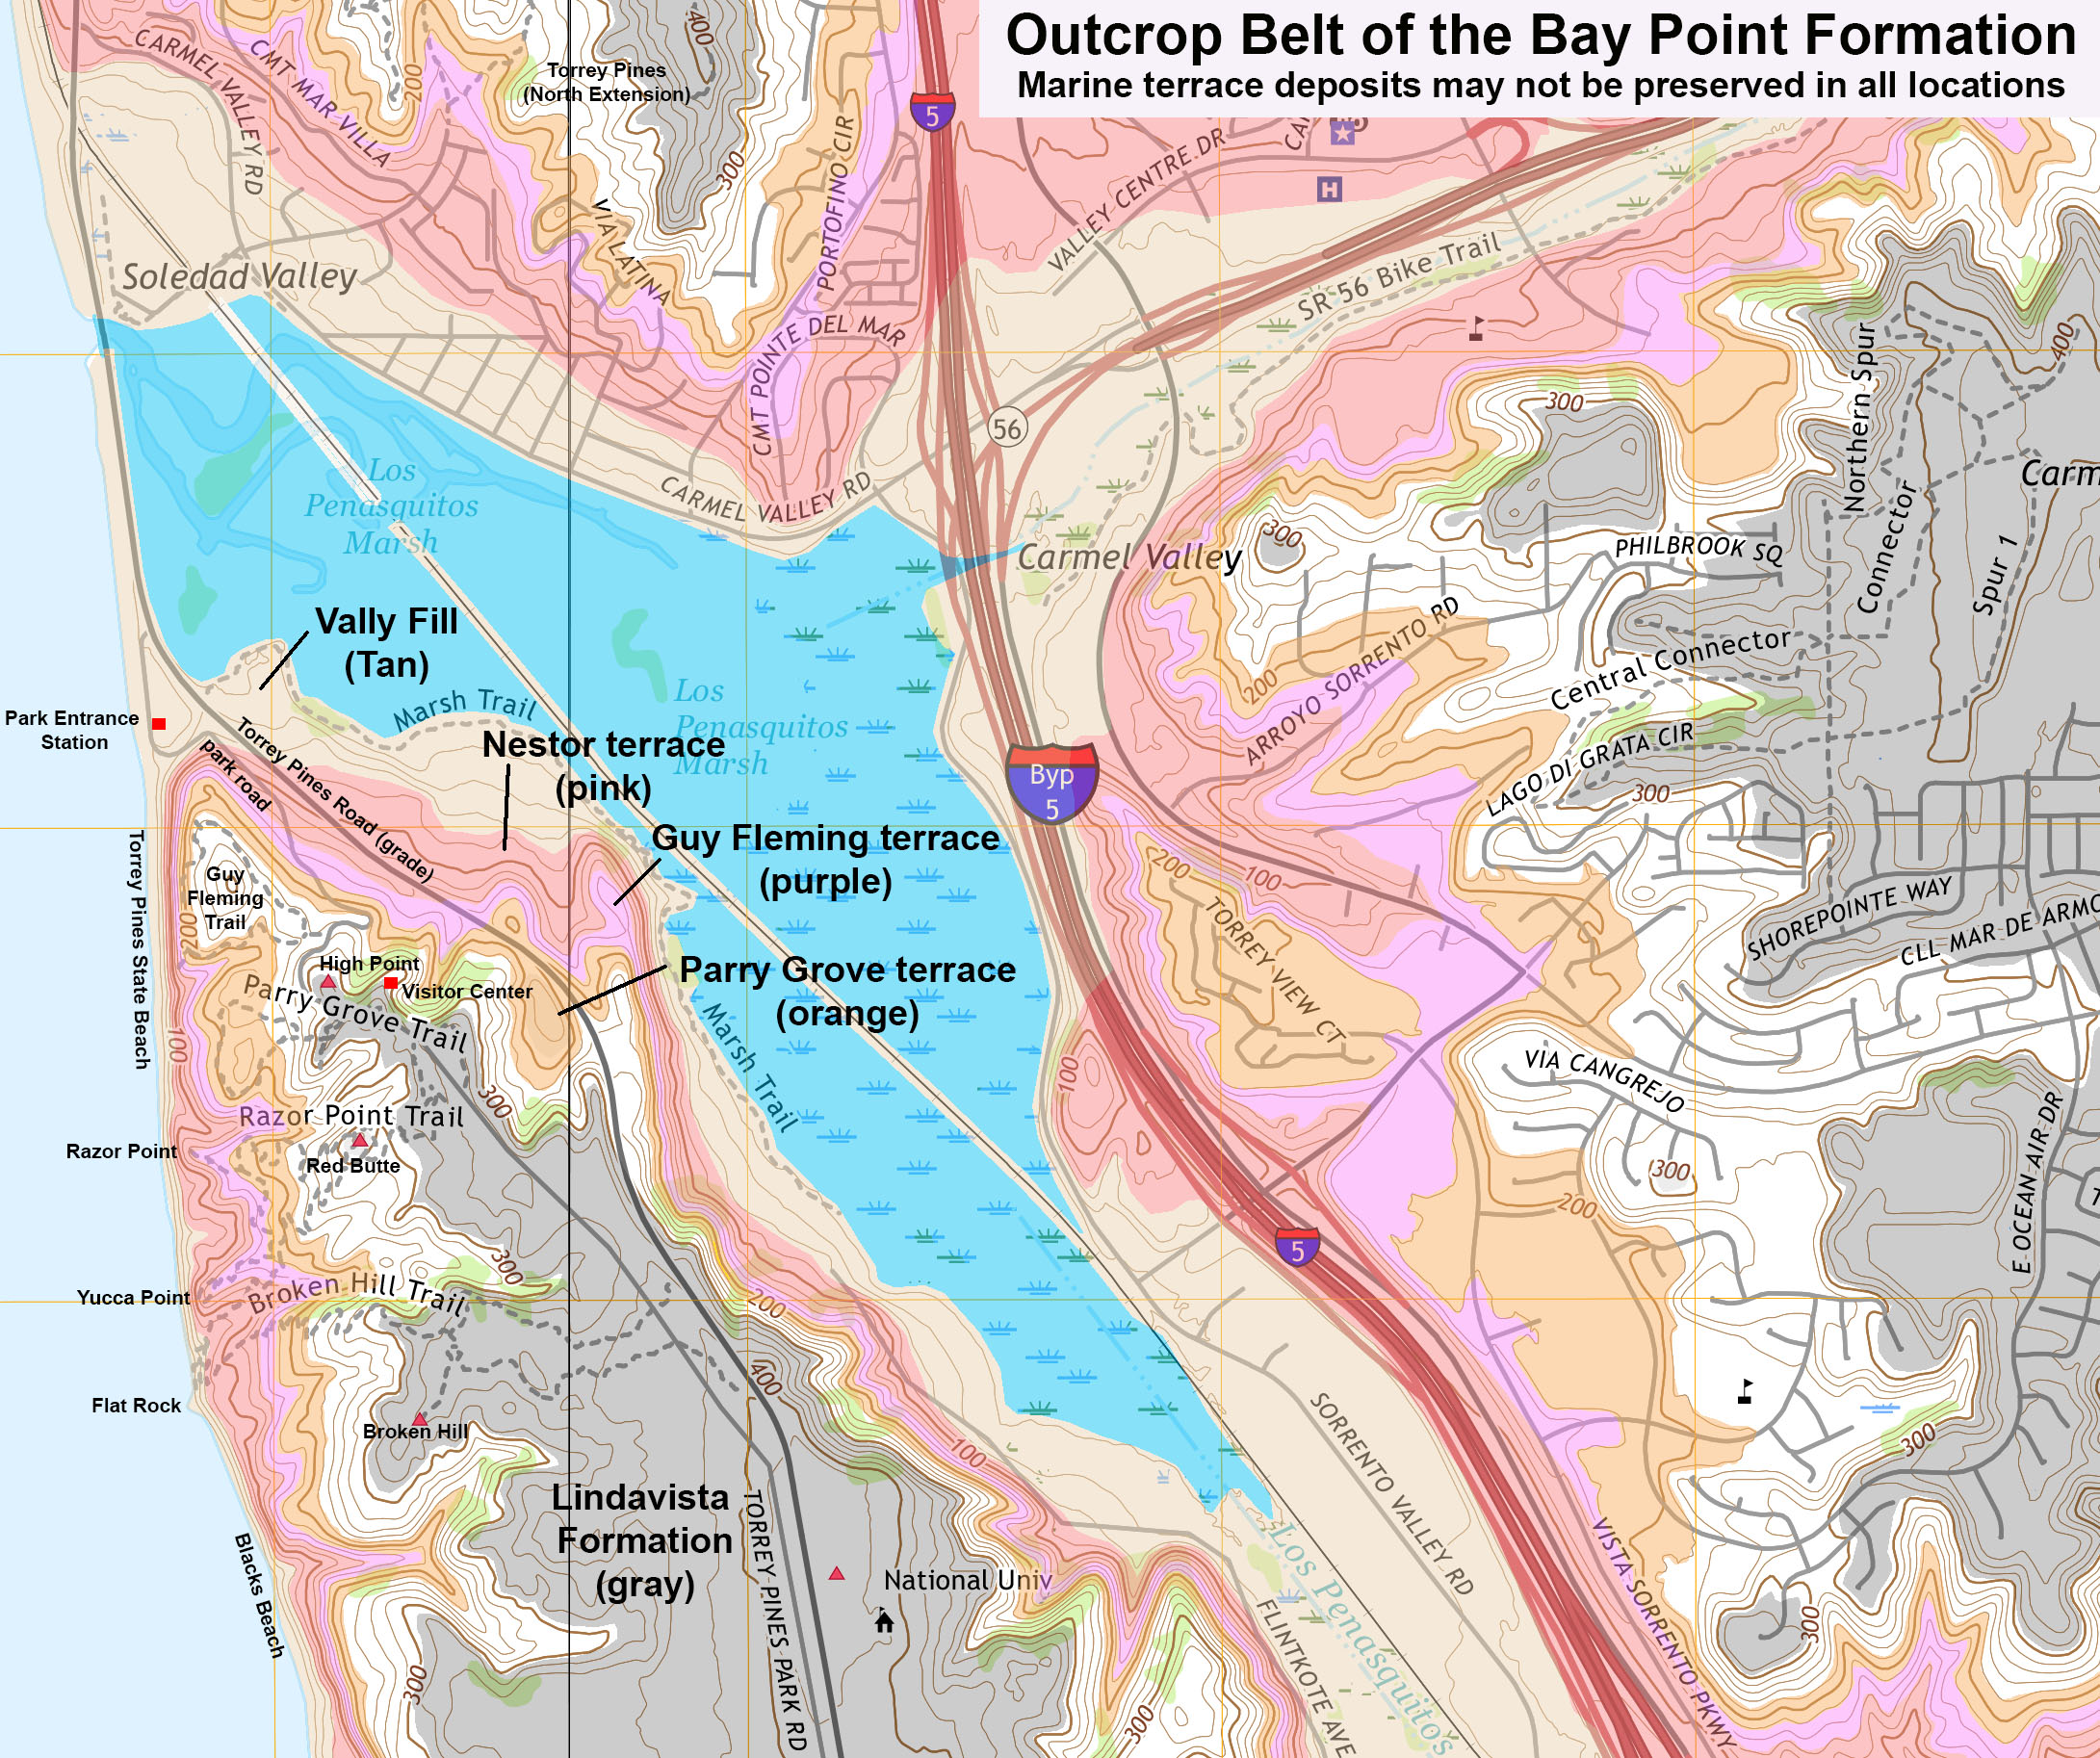 Fig. 94. Map of Bay Point Formation's marine terrace belts in the Torrey Pines park area based on elevation data. The colors show the contour intervals for the terraces where they may found if they haven't eroded away or not exposed. |
|

Faults and Tectonism in the Torrey Pines Park AreaRegional tectonic processes are slowly shaping the landscape in the Torrey Pines region. Tectonism is responsible for the slow rise of the coastal region that has resulted in the formation of the marine terraces. That rise is both partly gradual, but may have also occurred suddenly during significant earthquakes of the past (none historically significant). Mueller [2002] calculated that some strata along parts of the San Diego coastline have undergone about 95 meters (<300 feet) of uplift since they were deposited in the middle to late Pliocene. Features that tectonism created on a local scale that can be observed on the surface include folds and faults (Figure 101). Figures 102 and 103 are geologic maps (regional and local scales) that shows the general location of faults in the Torrey Pines park area. (Figures 1 and 6 also show mapped fault locations in the park area). Other large faults may exist in the area, but they are not exposed at the surface. Faults have long histories and may go through periods of inactivity, or can change with the interactions of other active faults. Long, straight valleys, especially those that cut across flat-lying sedimentary formations are often an indication of a fault. Because rocks along fault zones are typically highly fractured they are selectively likely to weather and erode faster, forming canyons and valleys. The nearby valleys (canyons) of the Los Peñasquitos Creek, Carmel Creek, and Sorrento Creek in the area have linear trends and likely follow fault zones. The location of Peñasquitos Lagoon is part of the linear trends that can be seen on satellite imagery geologic maps (see Figures 1 and 102). |
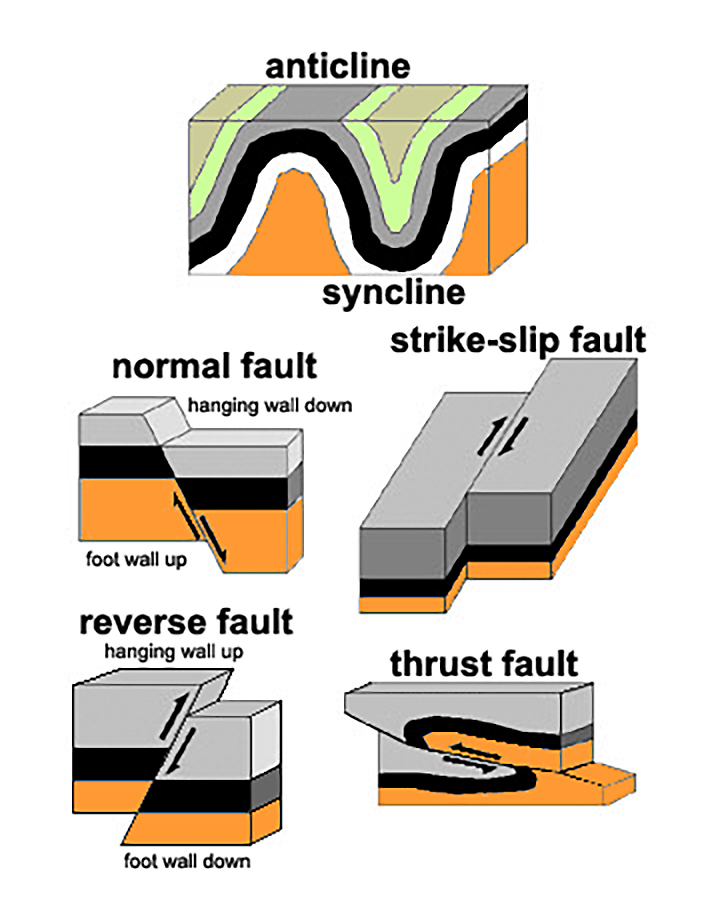 Fig. 101. Different kinds of folds and faults. 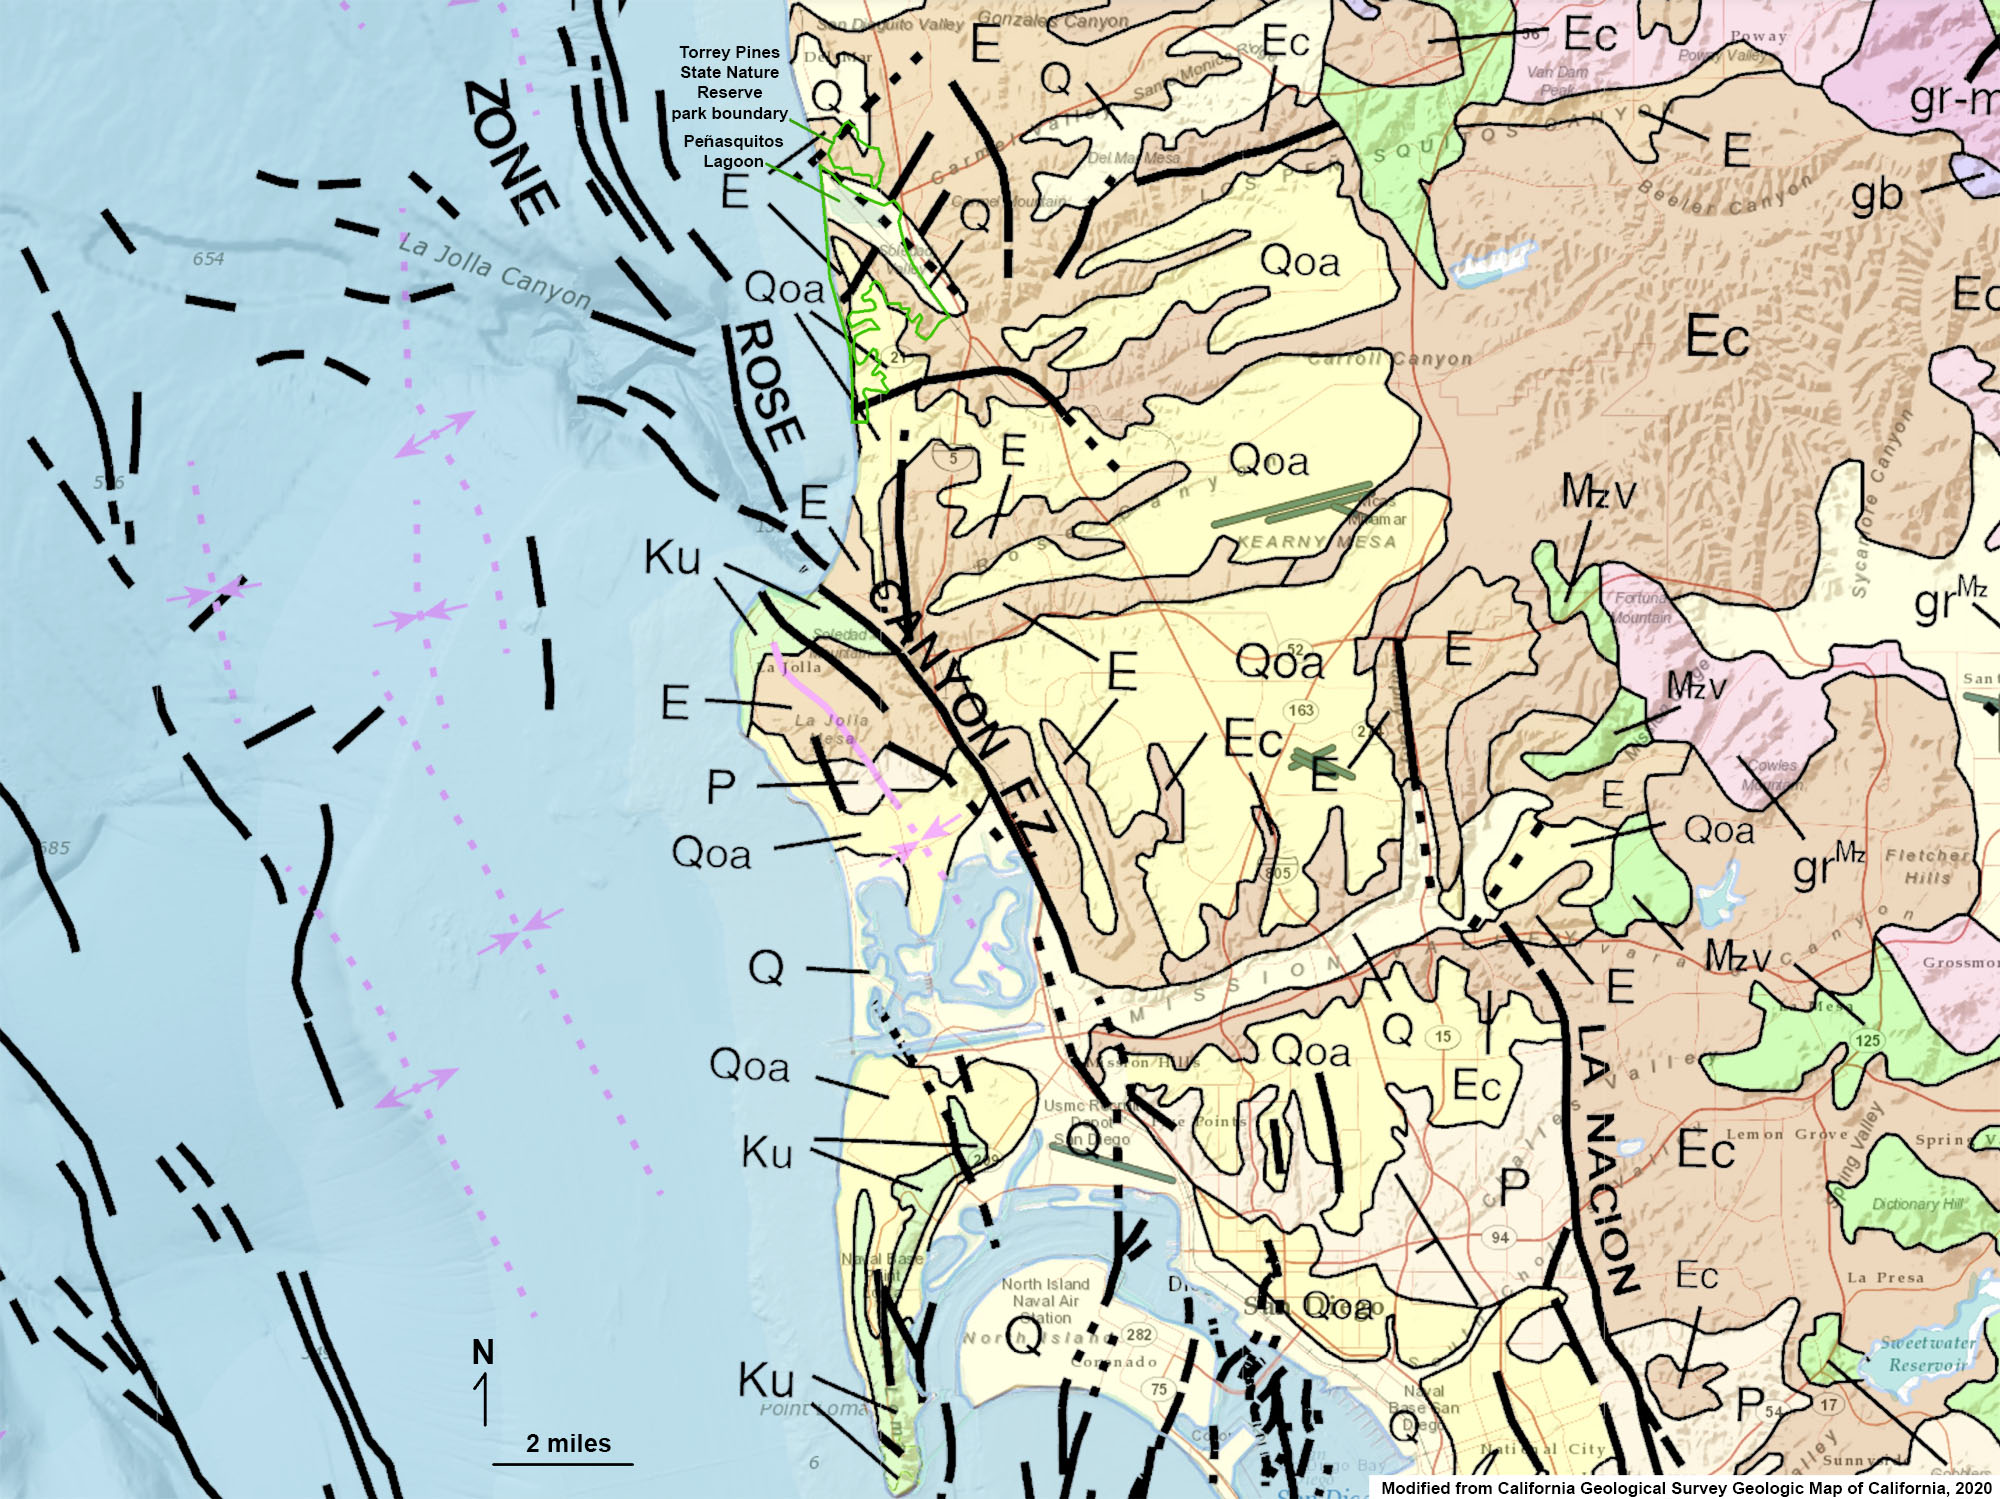 Fig. 102. Portion of the Geologic Map of California with Torrey Pines park area. The map shows rock formation ages, faults, and offshore bathymetry. |
|


Peak of the Last Ice Age |
The coastline is a very dynamic environment. Day-to-day wave action and tides are constantly moving sediments. When a strong winter storm occurs with high tides, large volumes of sediments can move in a short period, stripping away vast amounts of beach sand and undercutting seacliffs to cause cliff failures. Perhaps what would be most remarkable about that time is that extensive forest communities extended across vast parts of California that is now treeless desert. The Torrey Pines coastal chaparral plant community (in Torrey Pines) was possibly connected with its relative populations that currently exist on Santa Rosa Island off the coast of Santa Barbara, California. A long list of large mammal species including mammoths, mastodons, saber-tooth tigers, dire wolves, and many others existed in the region, but have all gone extinct at the end of the last of the ice age. |
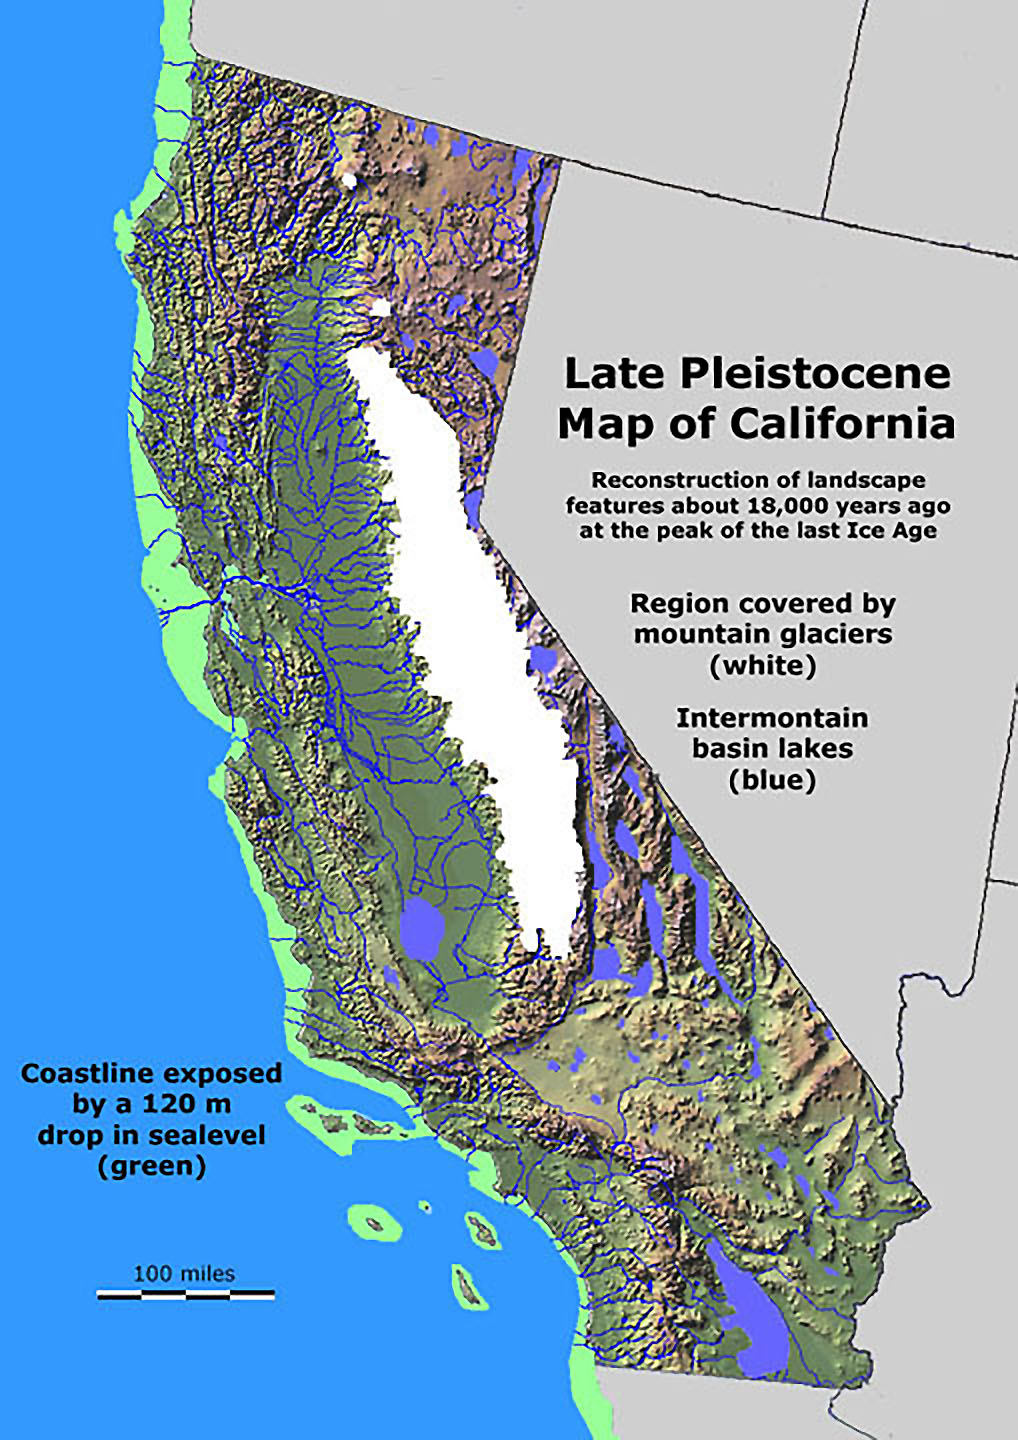 Fig. 115. Map of California at the peak of the last Ice Age. Glaciers covered the Sierra Nevada Range, large lakes filled internally-drained basins, a broad coastal plain extended seaward because sea level was lower, and forests covered many regions that are now barren desert. |
Modern Deposition and Erosion Processes In the Torrey Pine Park Area |
| Erosion and depositional process are actively shaping the landscape in the Torrey Pines park area producing surficial deposits and shoreline deposits. Surficial Deposits included alluvium, colluvium, and soil. These terrestrial sediments eventually migrate to the lagoons, beaches, and offshore. Alluvial deposits include detrital materials deposited by stream flow and slopewash (from heavy precipitation). Alluvium is found underlying stream channels and floodplains, and consists mostly of sand and mud (a mix of sand, silt and clay). Beds of gravel are associated with channel deposits where strong currents winnow away finer sediments. Colluvium is unconsolidated materials derived from bedrock including blocks of material derived by creep or landsliding (small to large scale. (Landsliding is discussed below.) Colluvium is typically mixed with talus and slopewash sediments washed downslope by sheet flow from heavy precipitation. Soil forms on surfaces where plant communities become established and roots and organic detritus hinder surface erosion. Plants and bioturbation by burrowing organisms contribute decaying organic matter to the upper soil profile. Shoreline deposits include sediments deposited in a variety of depositional settings (see Figure 9). Sand dominates beach and dune deposits and near-shore marine (littoral) bar and seafloor deposits. Wave action and currents sort sediments—coarser fractions (gravel and sand) can accumulate in higher energy settings (beaches and stream channels), whereas finer materials (silt, mud, clay) are carried away to quieter water settings (offshore or bays/lagoons). Beach Dynamics: Beach sediments are transported by wave action, carried by longshore drift (forming beaches and bars), and moved by wind action (forming coastal dunes). The sources of sand and gravel comes from sea-cliff erosion and the occasional alluvial discharge from streams, and slopewash erosion and landsliding of surficial deposits. Beach deposits are composed primarily unconsolidated sand, and locally underlain by layers of gravel and cobbles. The thickness of beach deposits varies seasonally, typically less than 25 feet thick. Sand moves onto the beach from offshore sand bars in seasonably quiet weather of the summer but moves offshore again during the winter season when wave action increases. |
Features Along Torrey Pines Beaches and Bluffs |
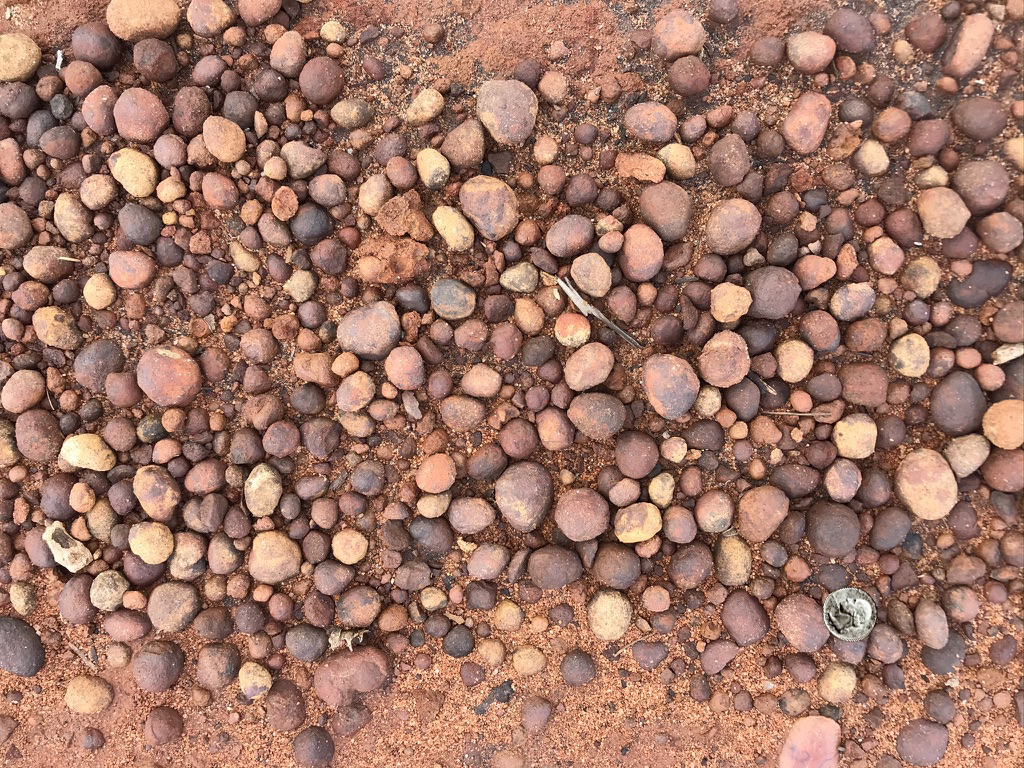
|
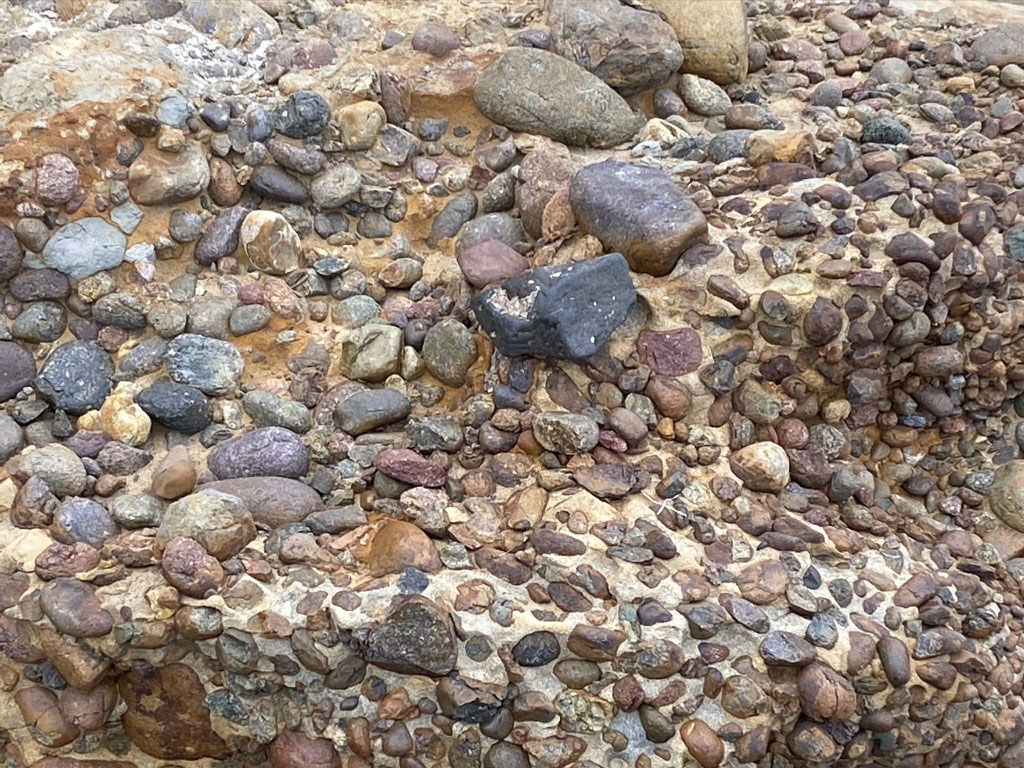
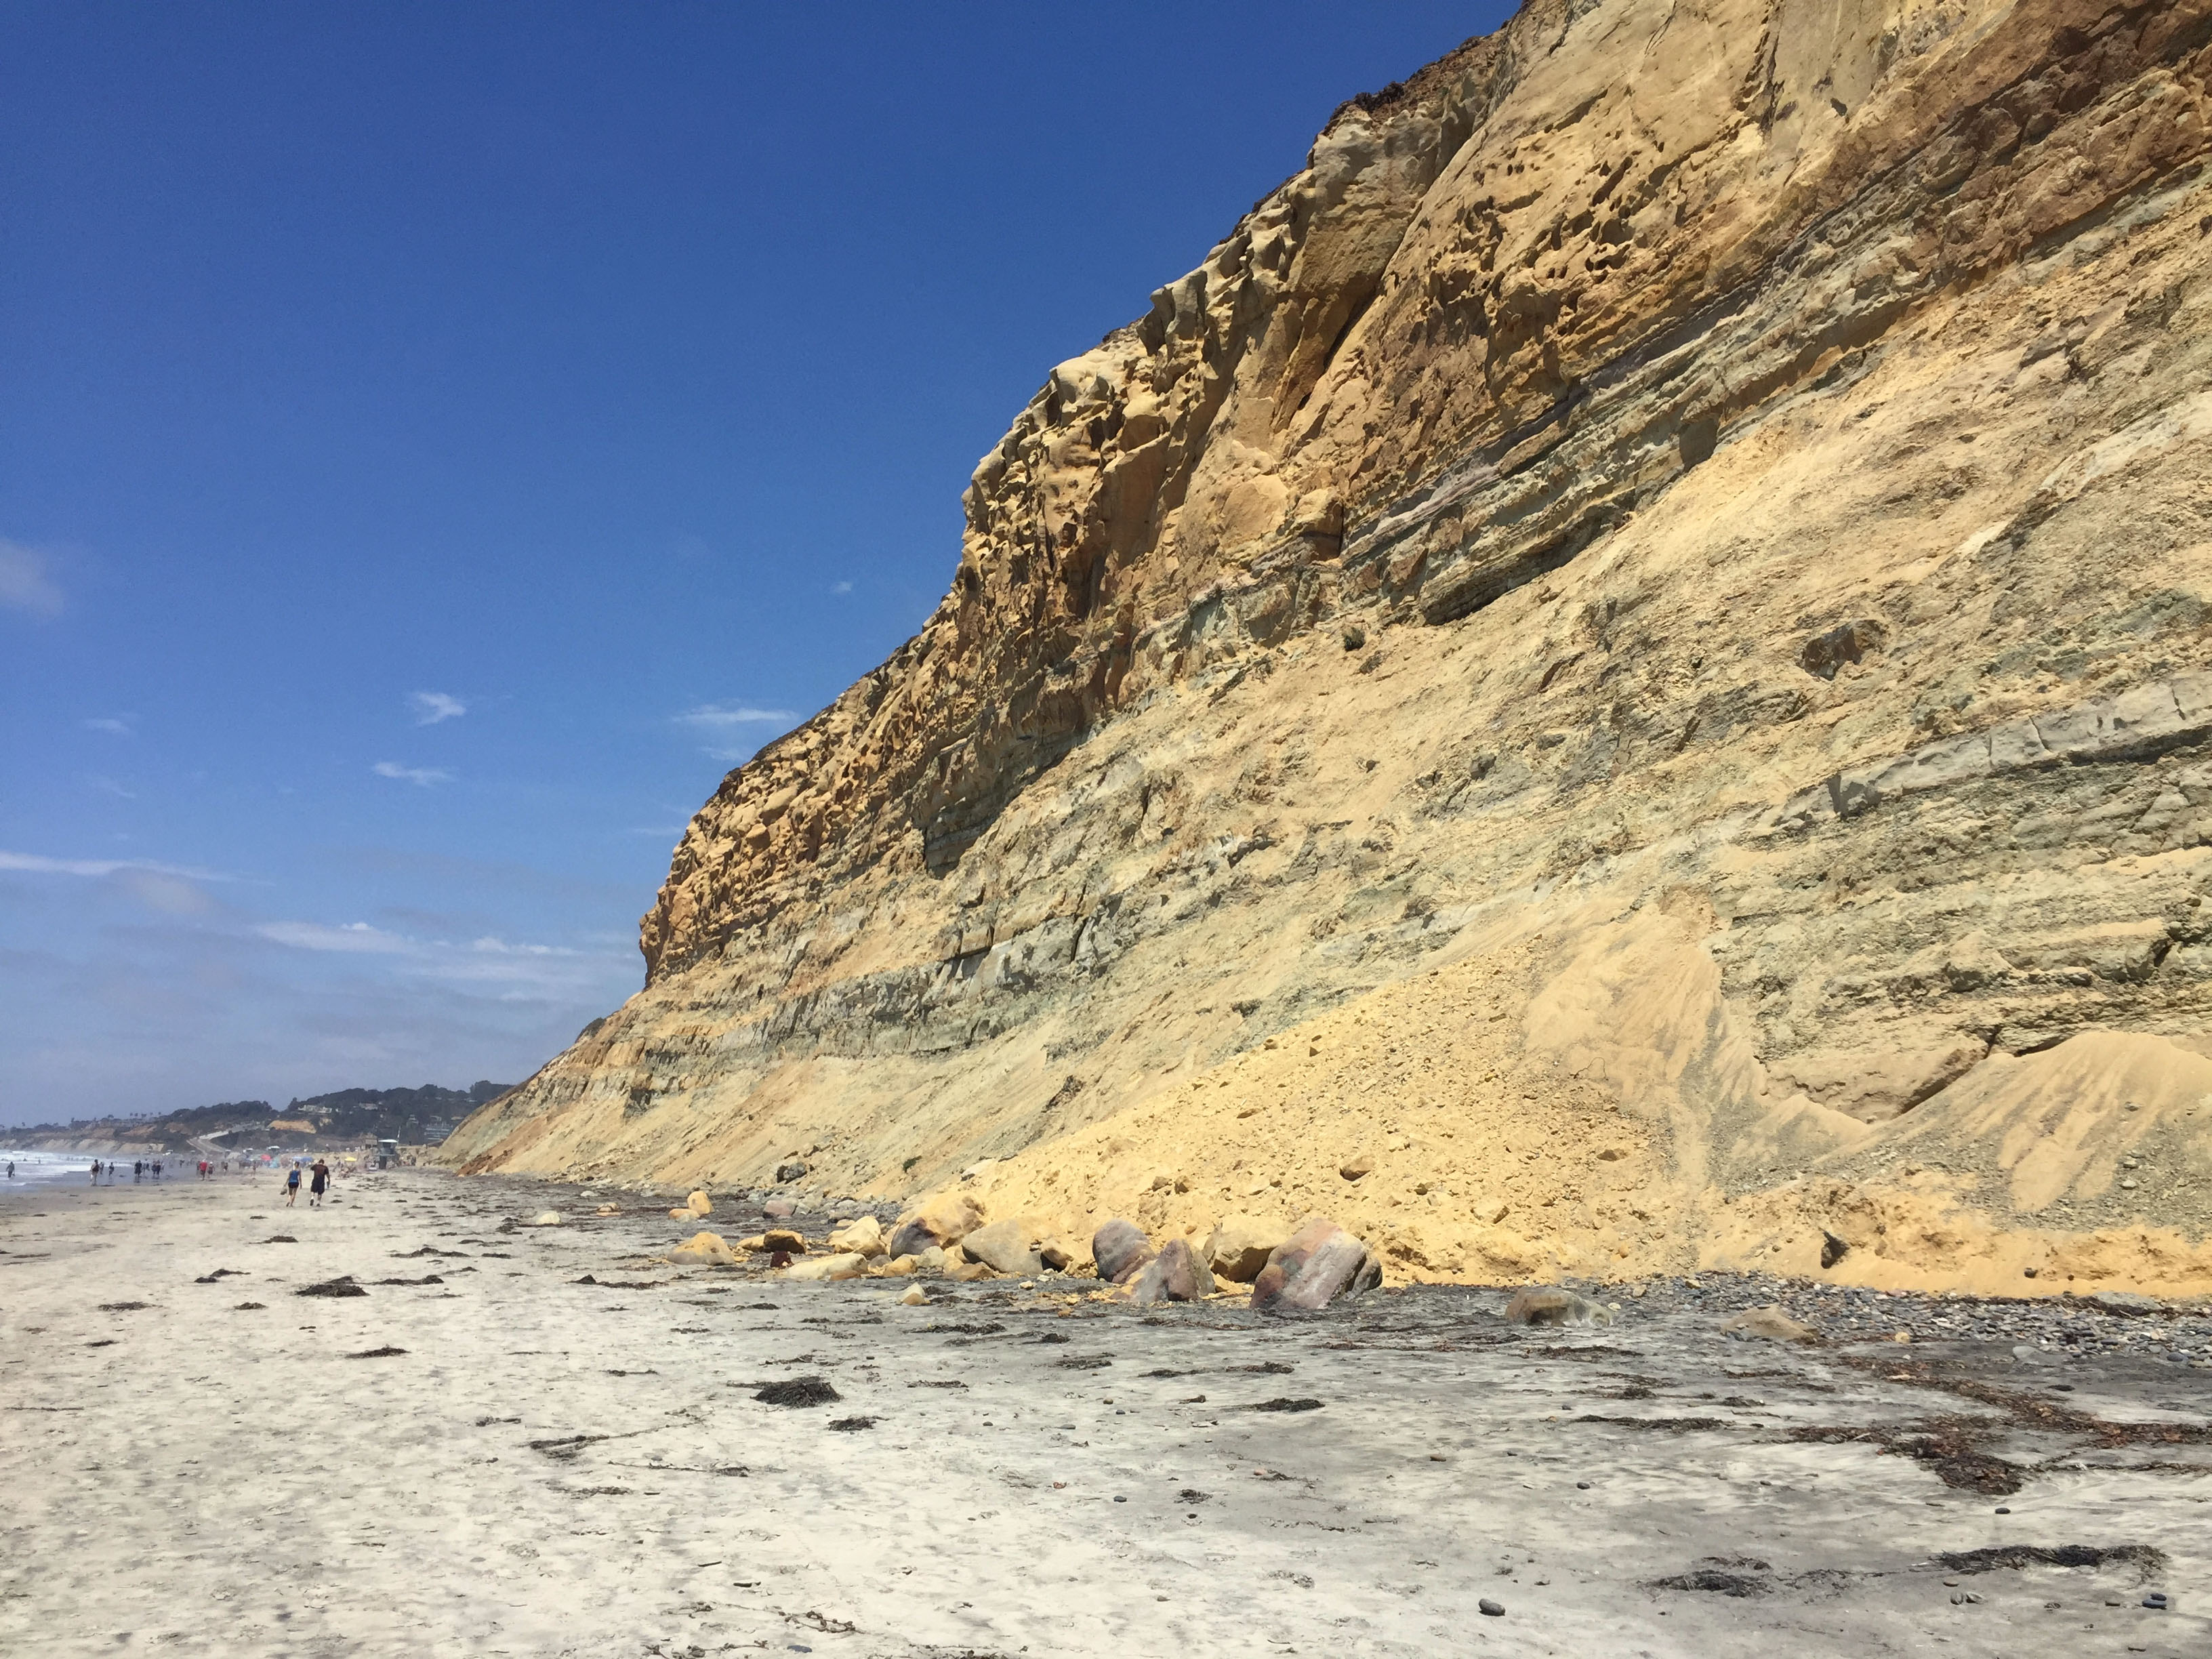
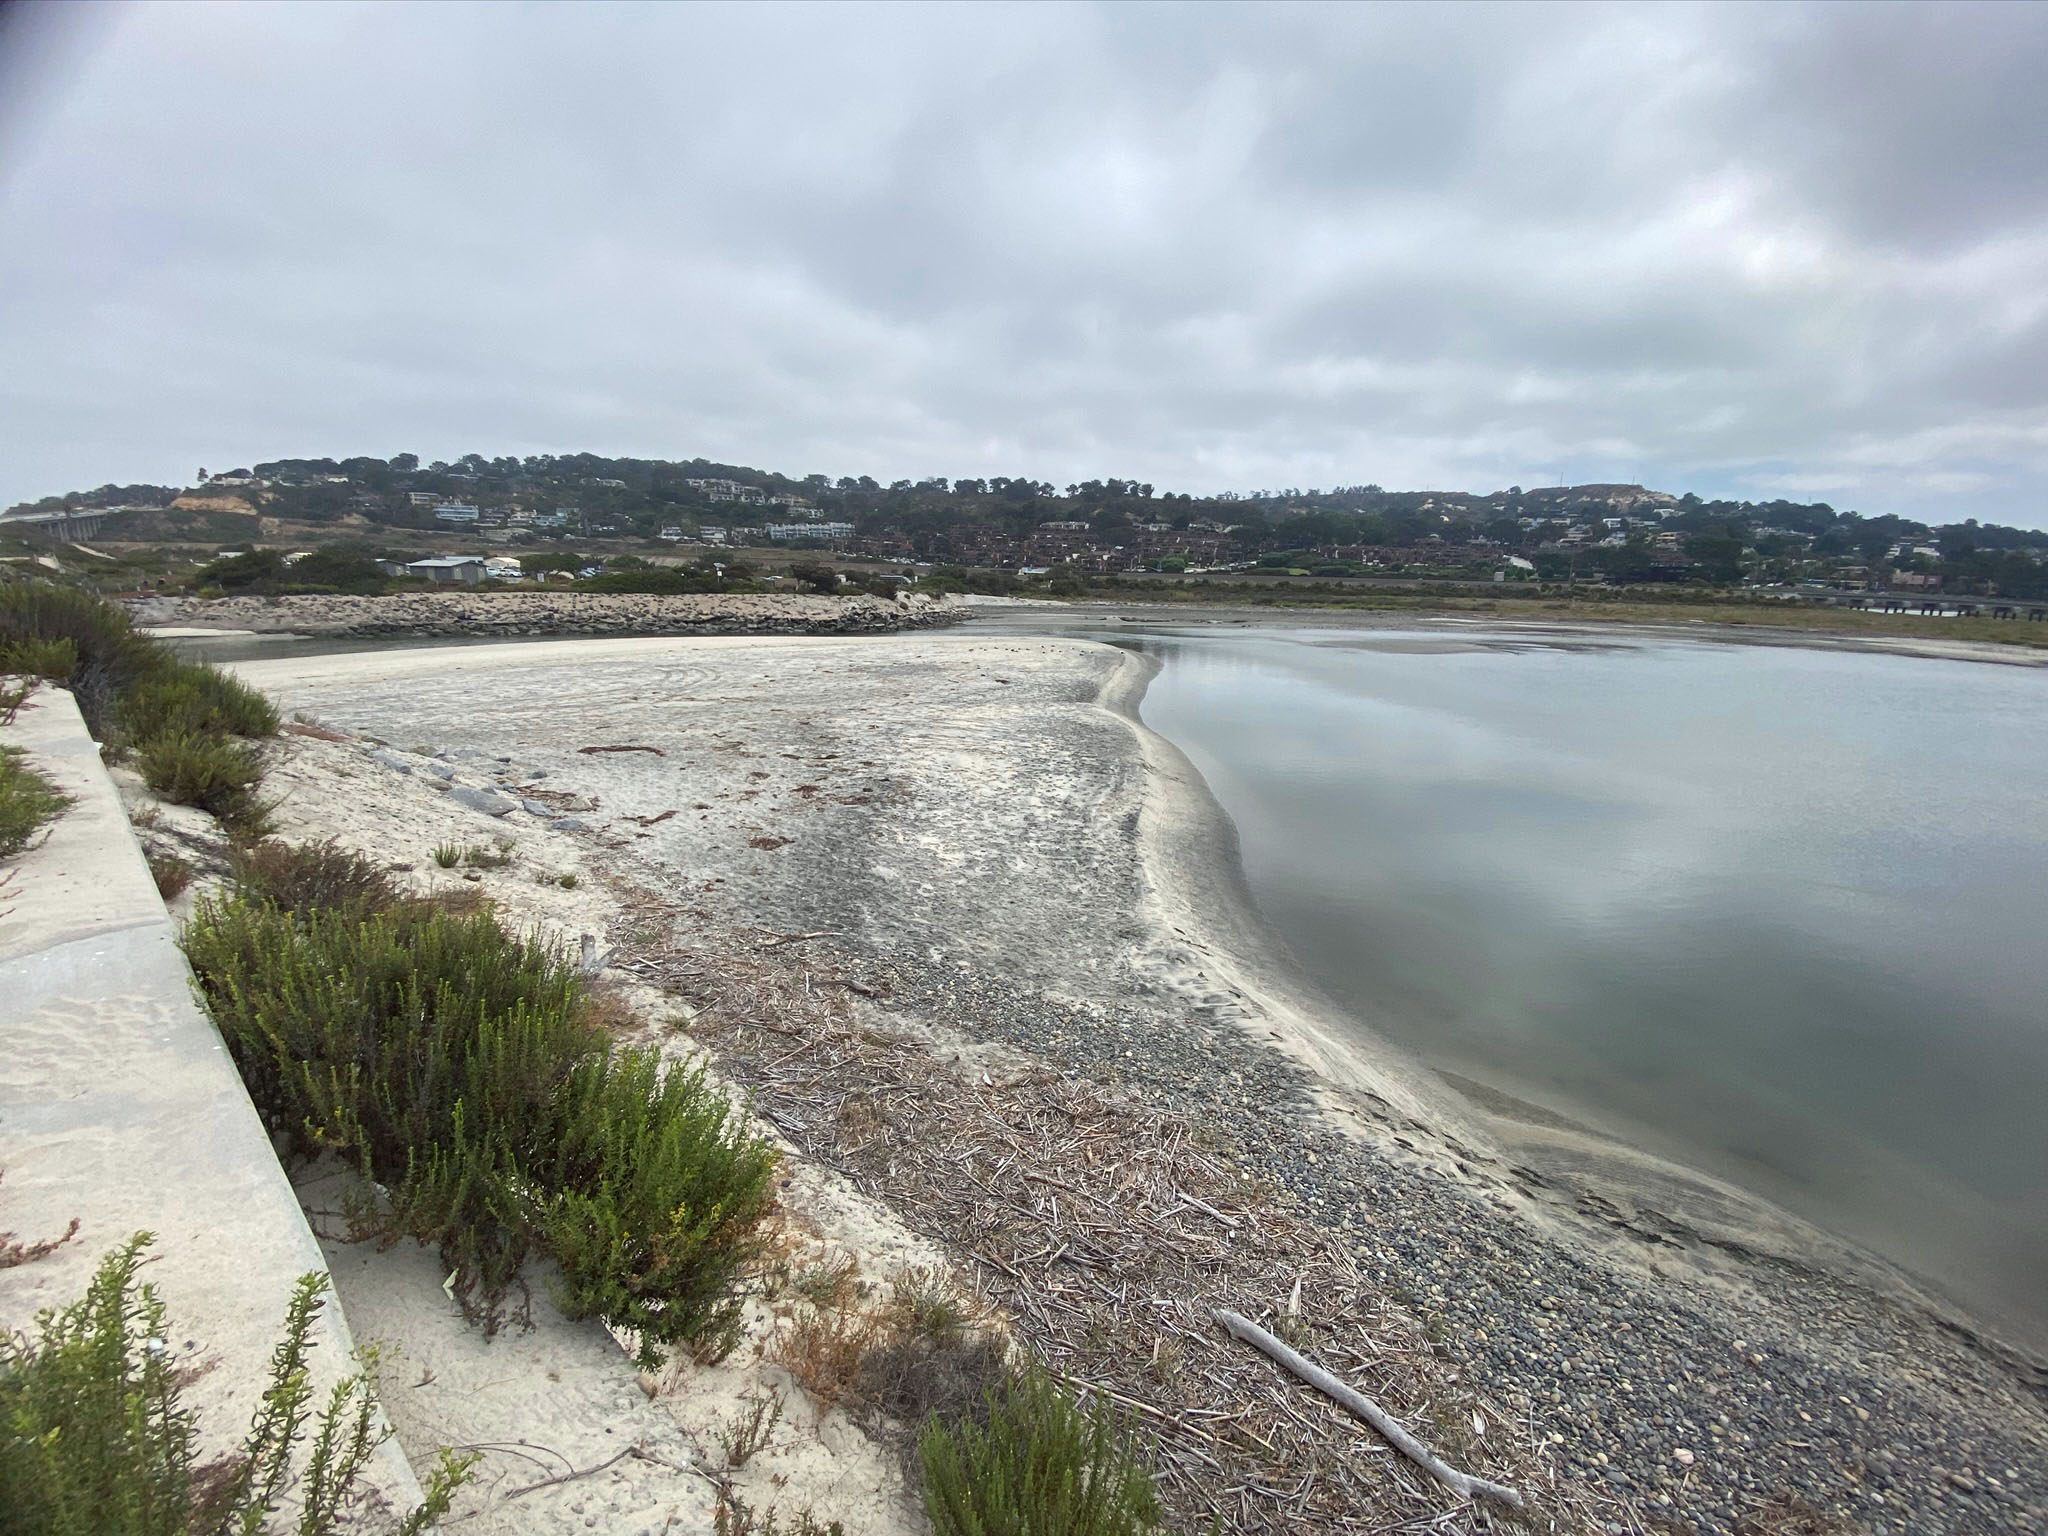
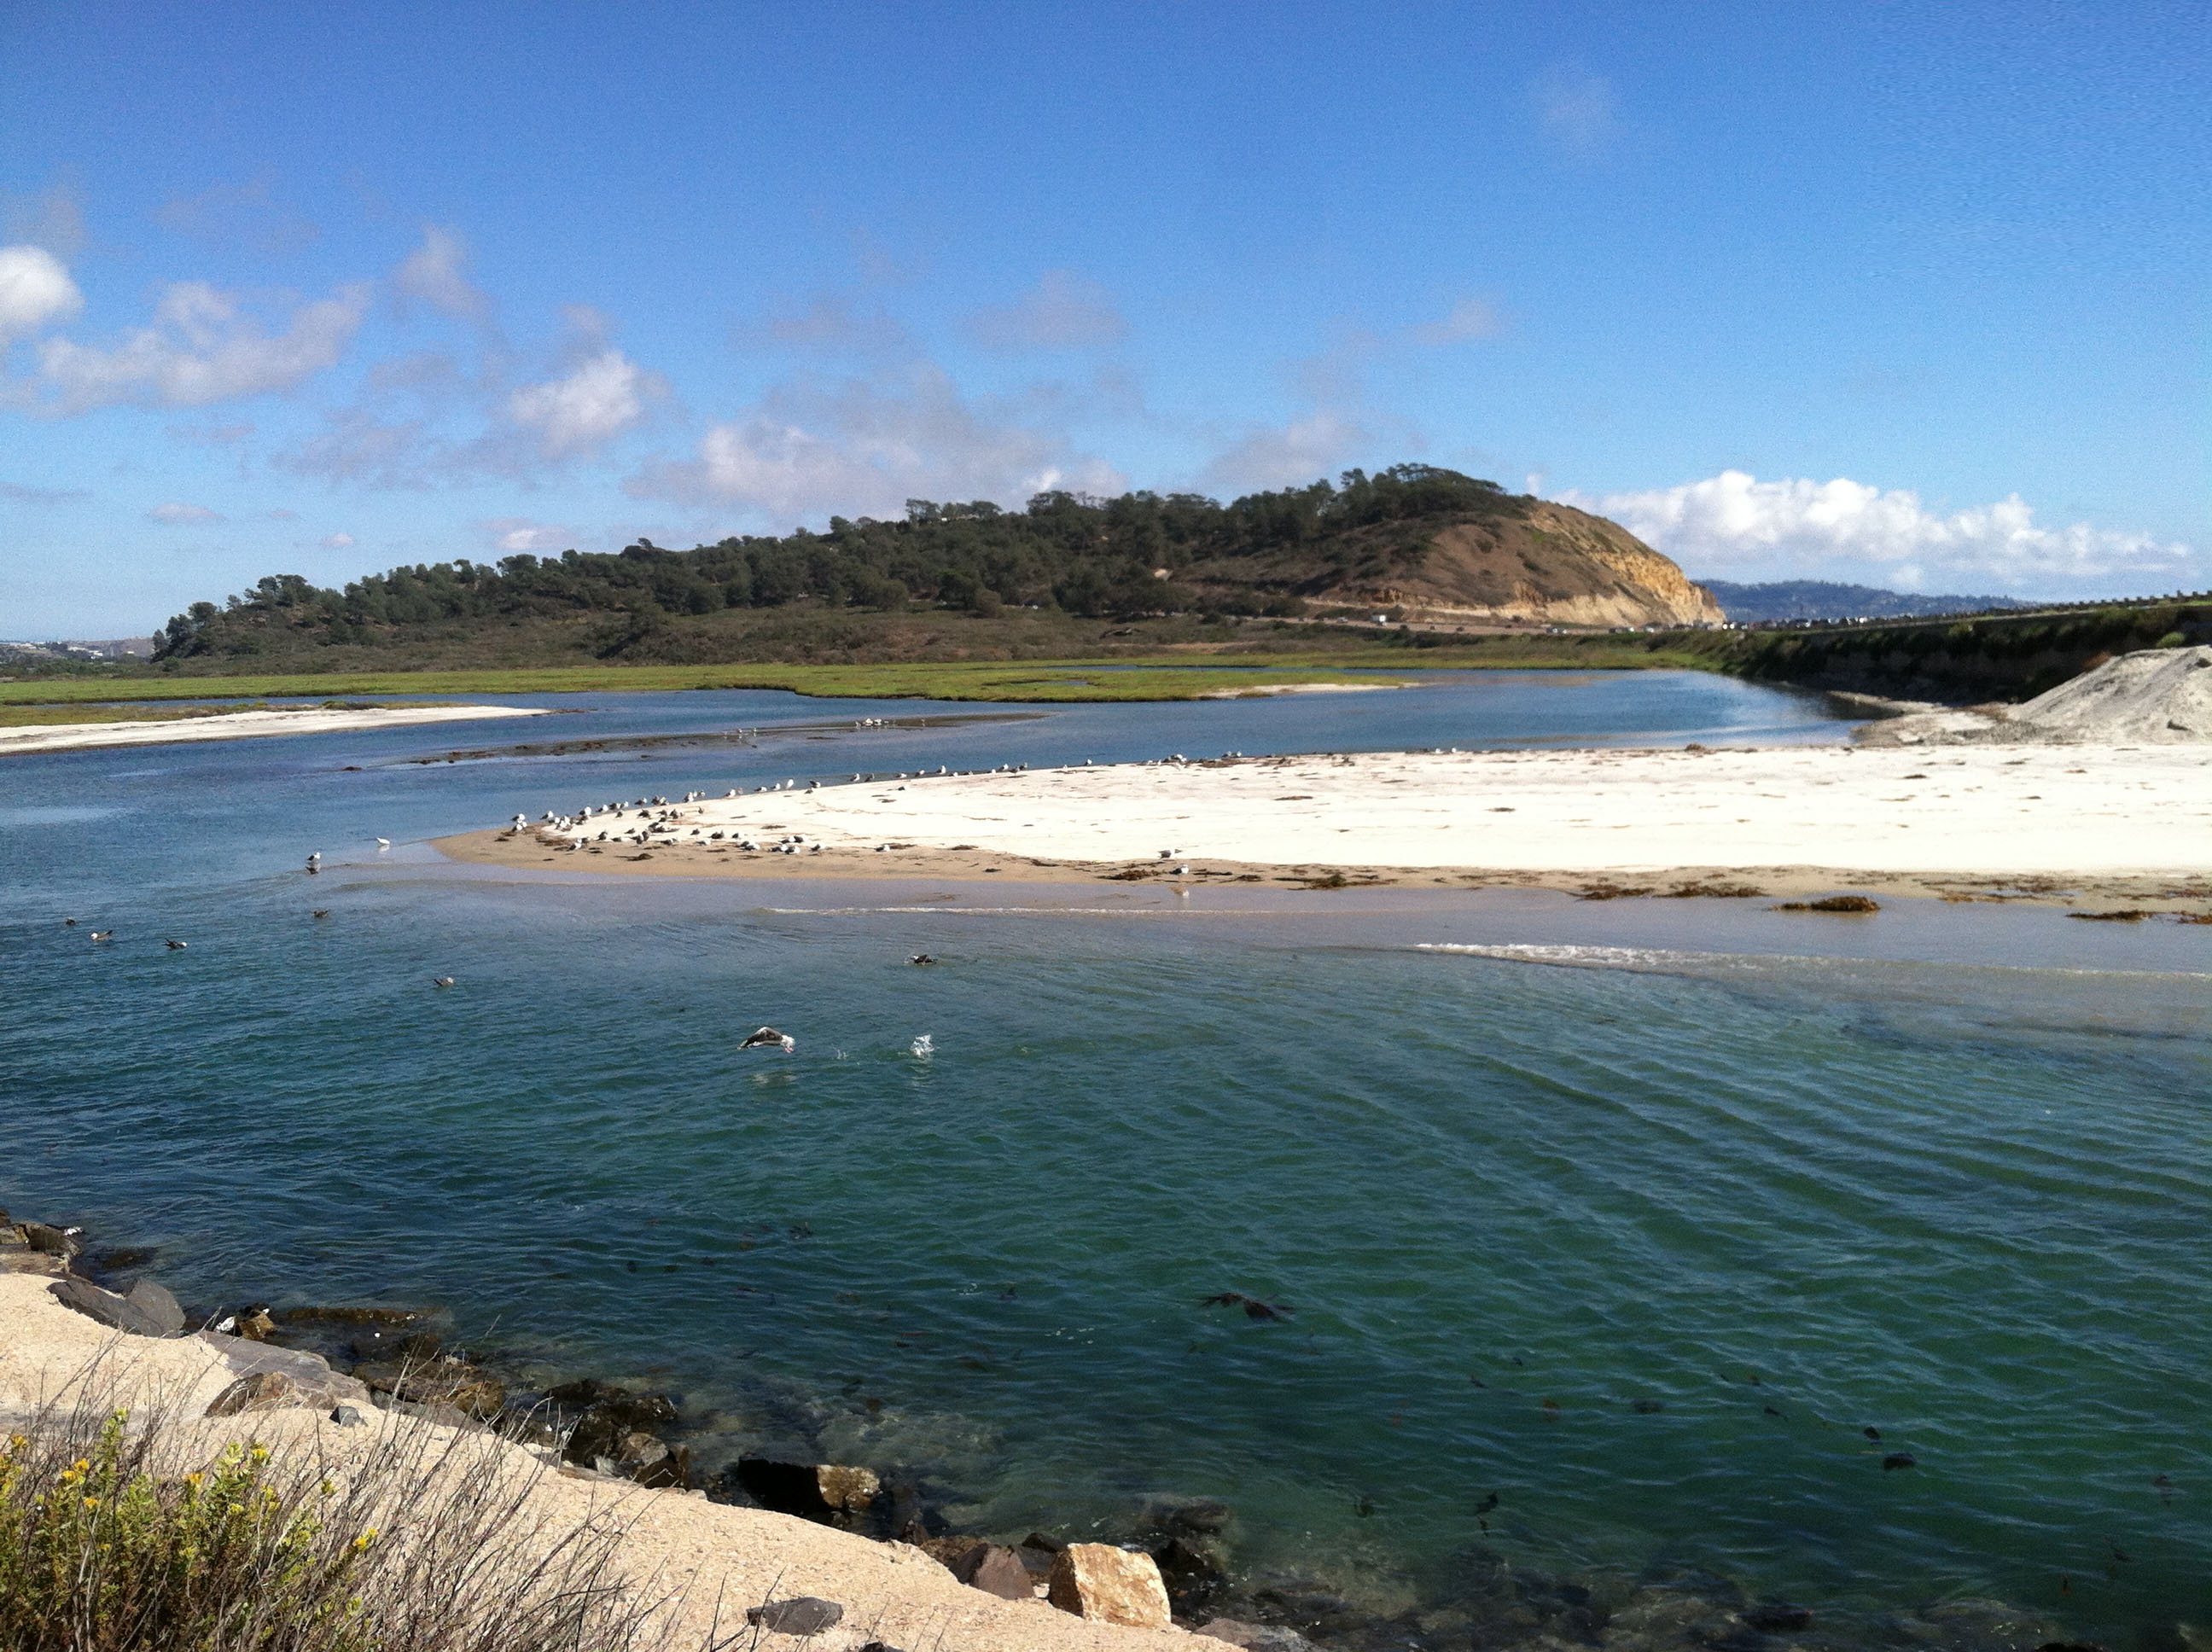
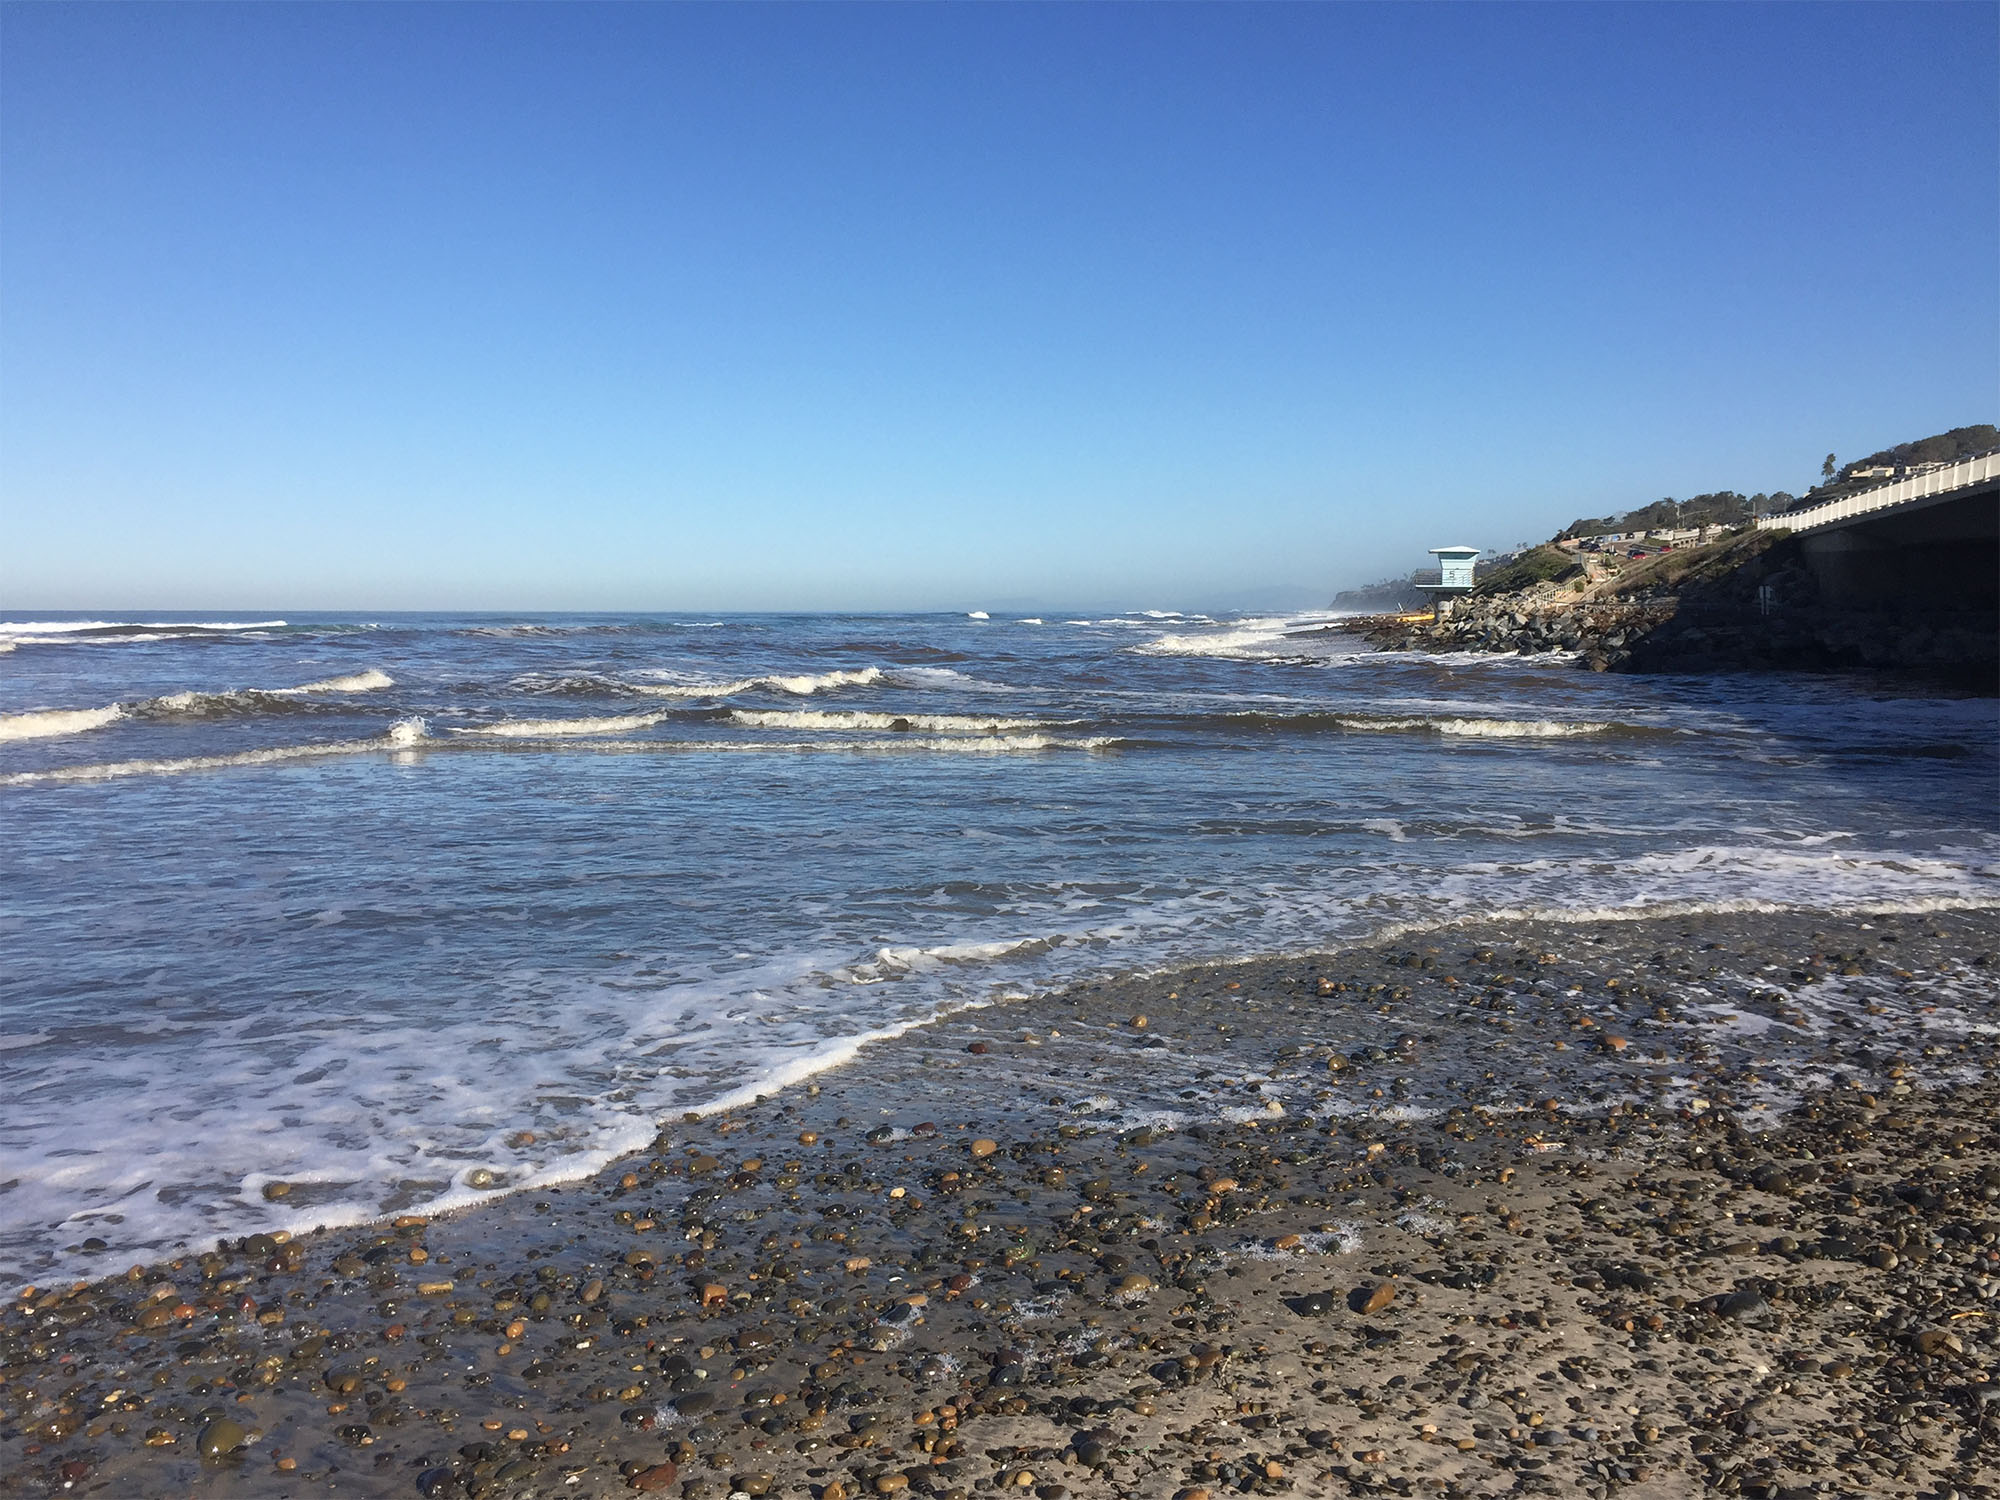
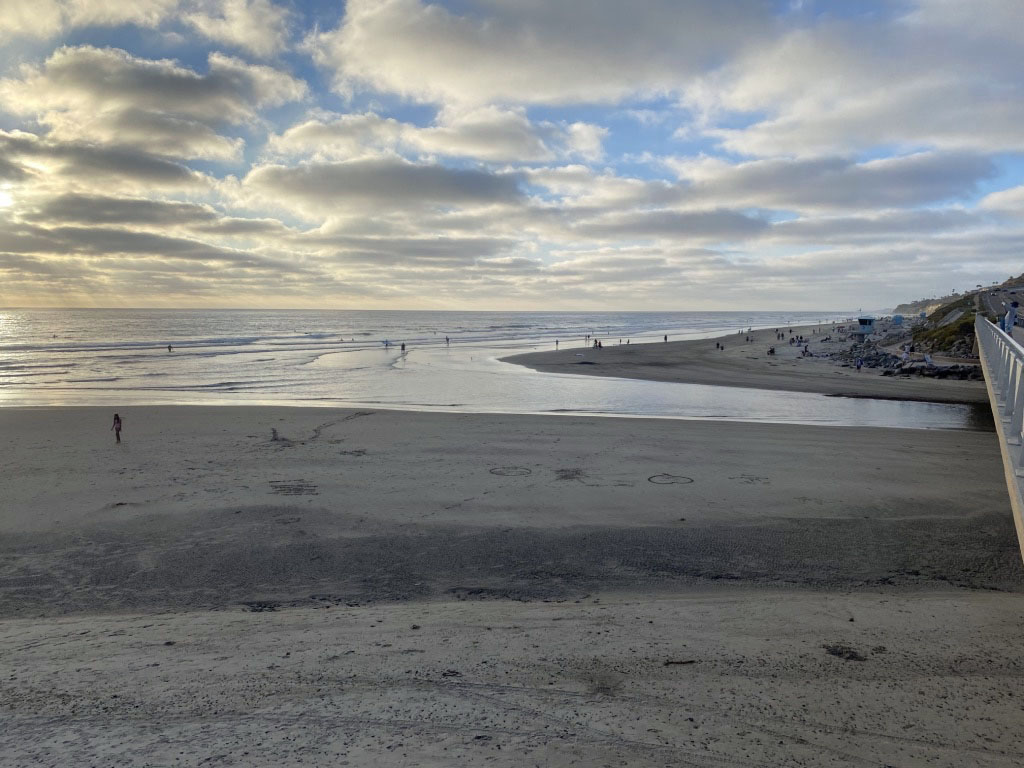
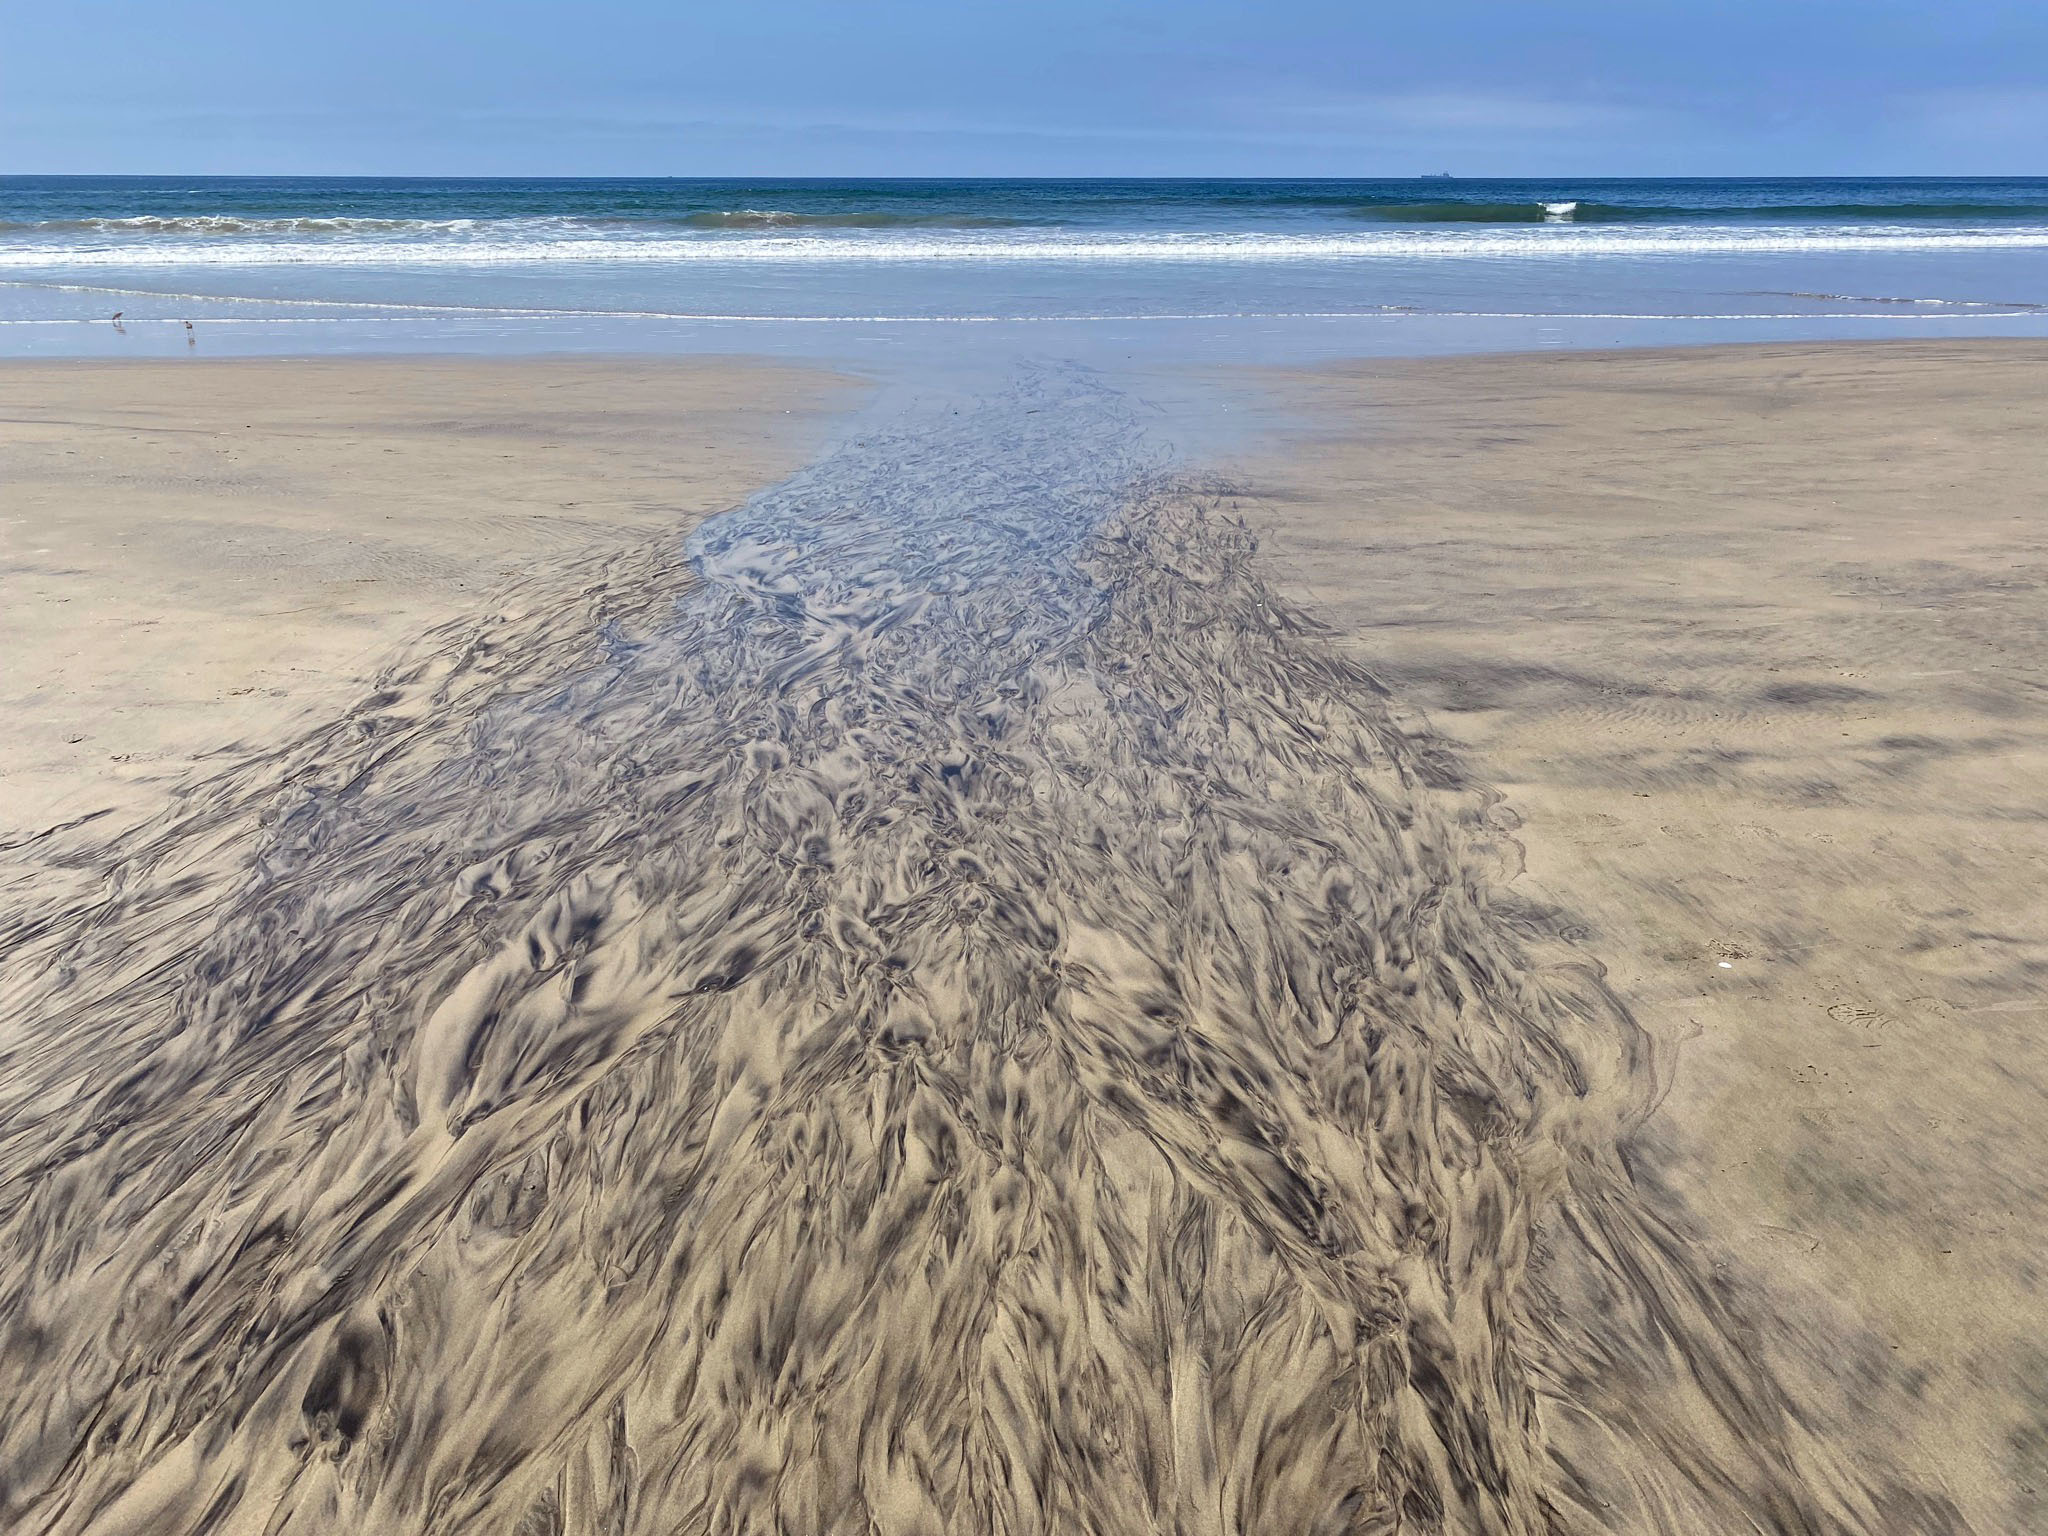
Figure 116 is a view looking south along Torrey Pines Beach. Torrey Pine Road causeway has replaced the natural bay-mouth bar that previously existed in the area. The mouth of
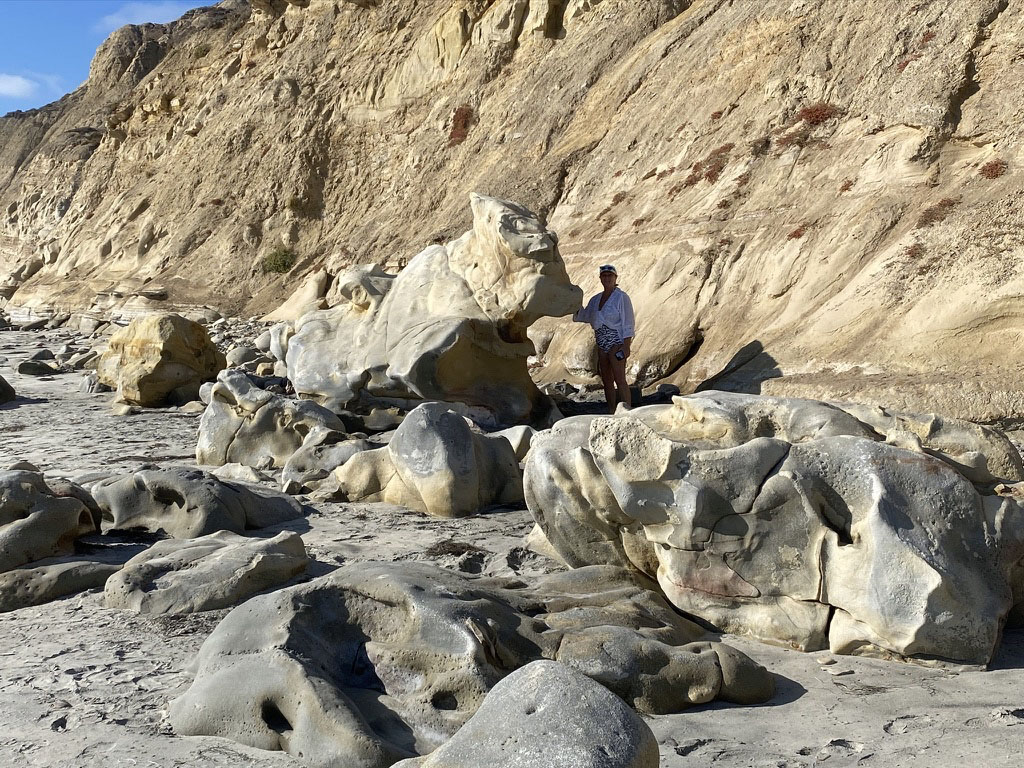
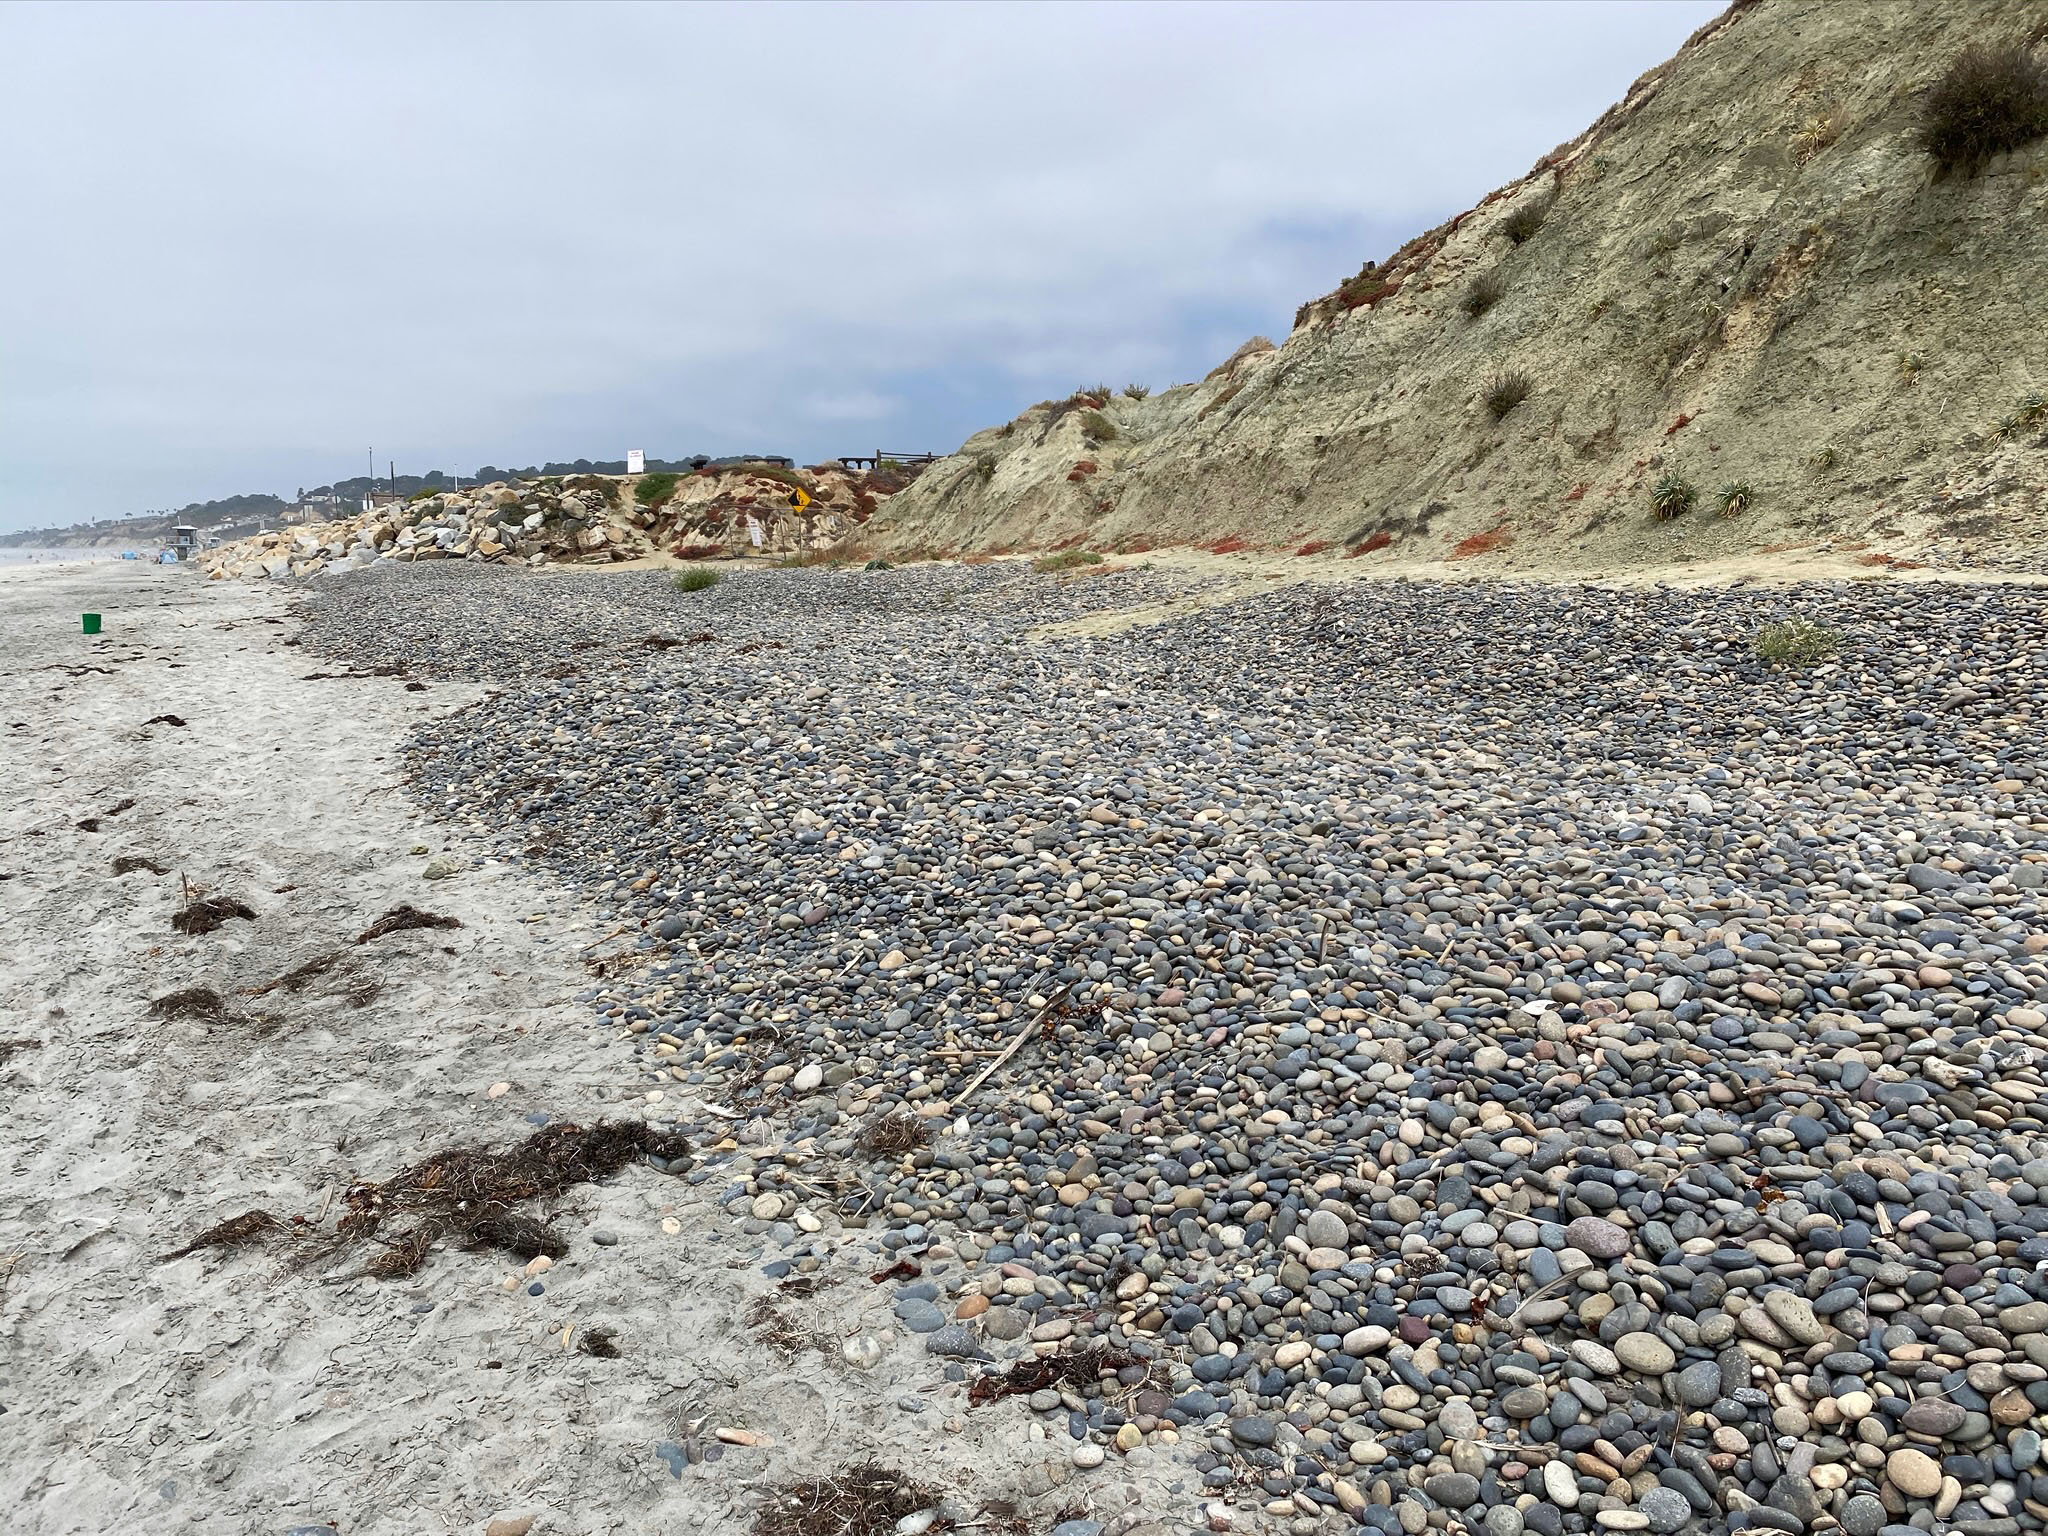
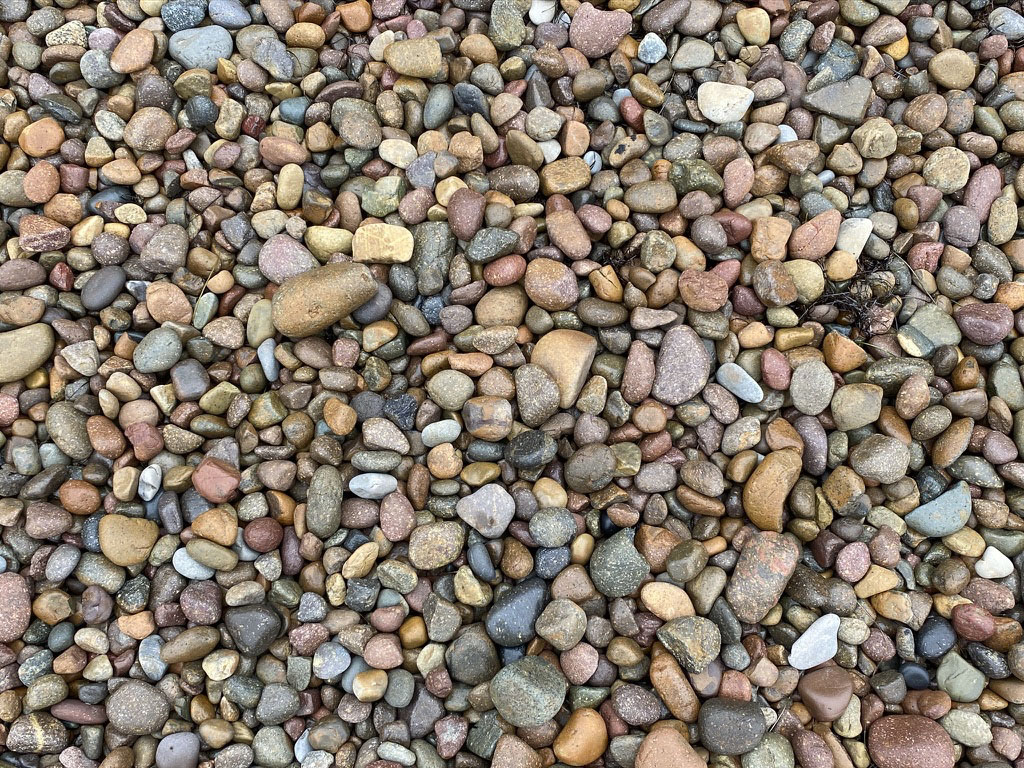
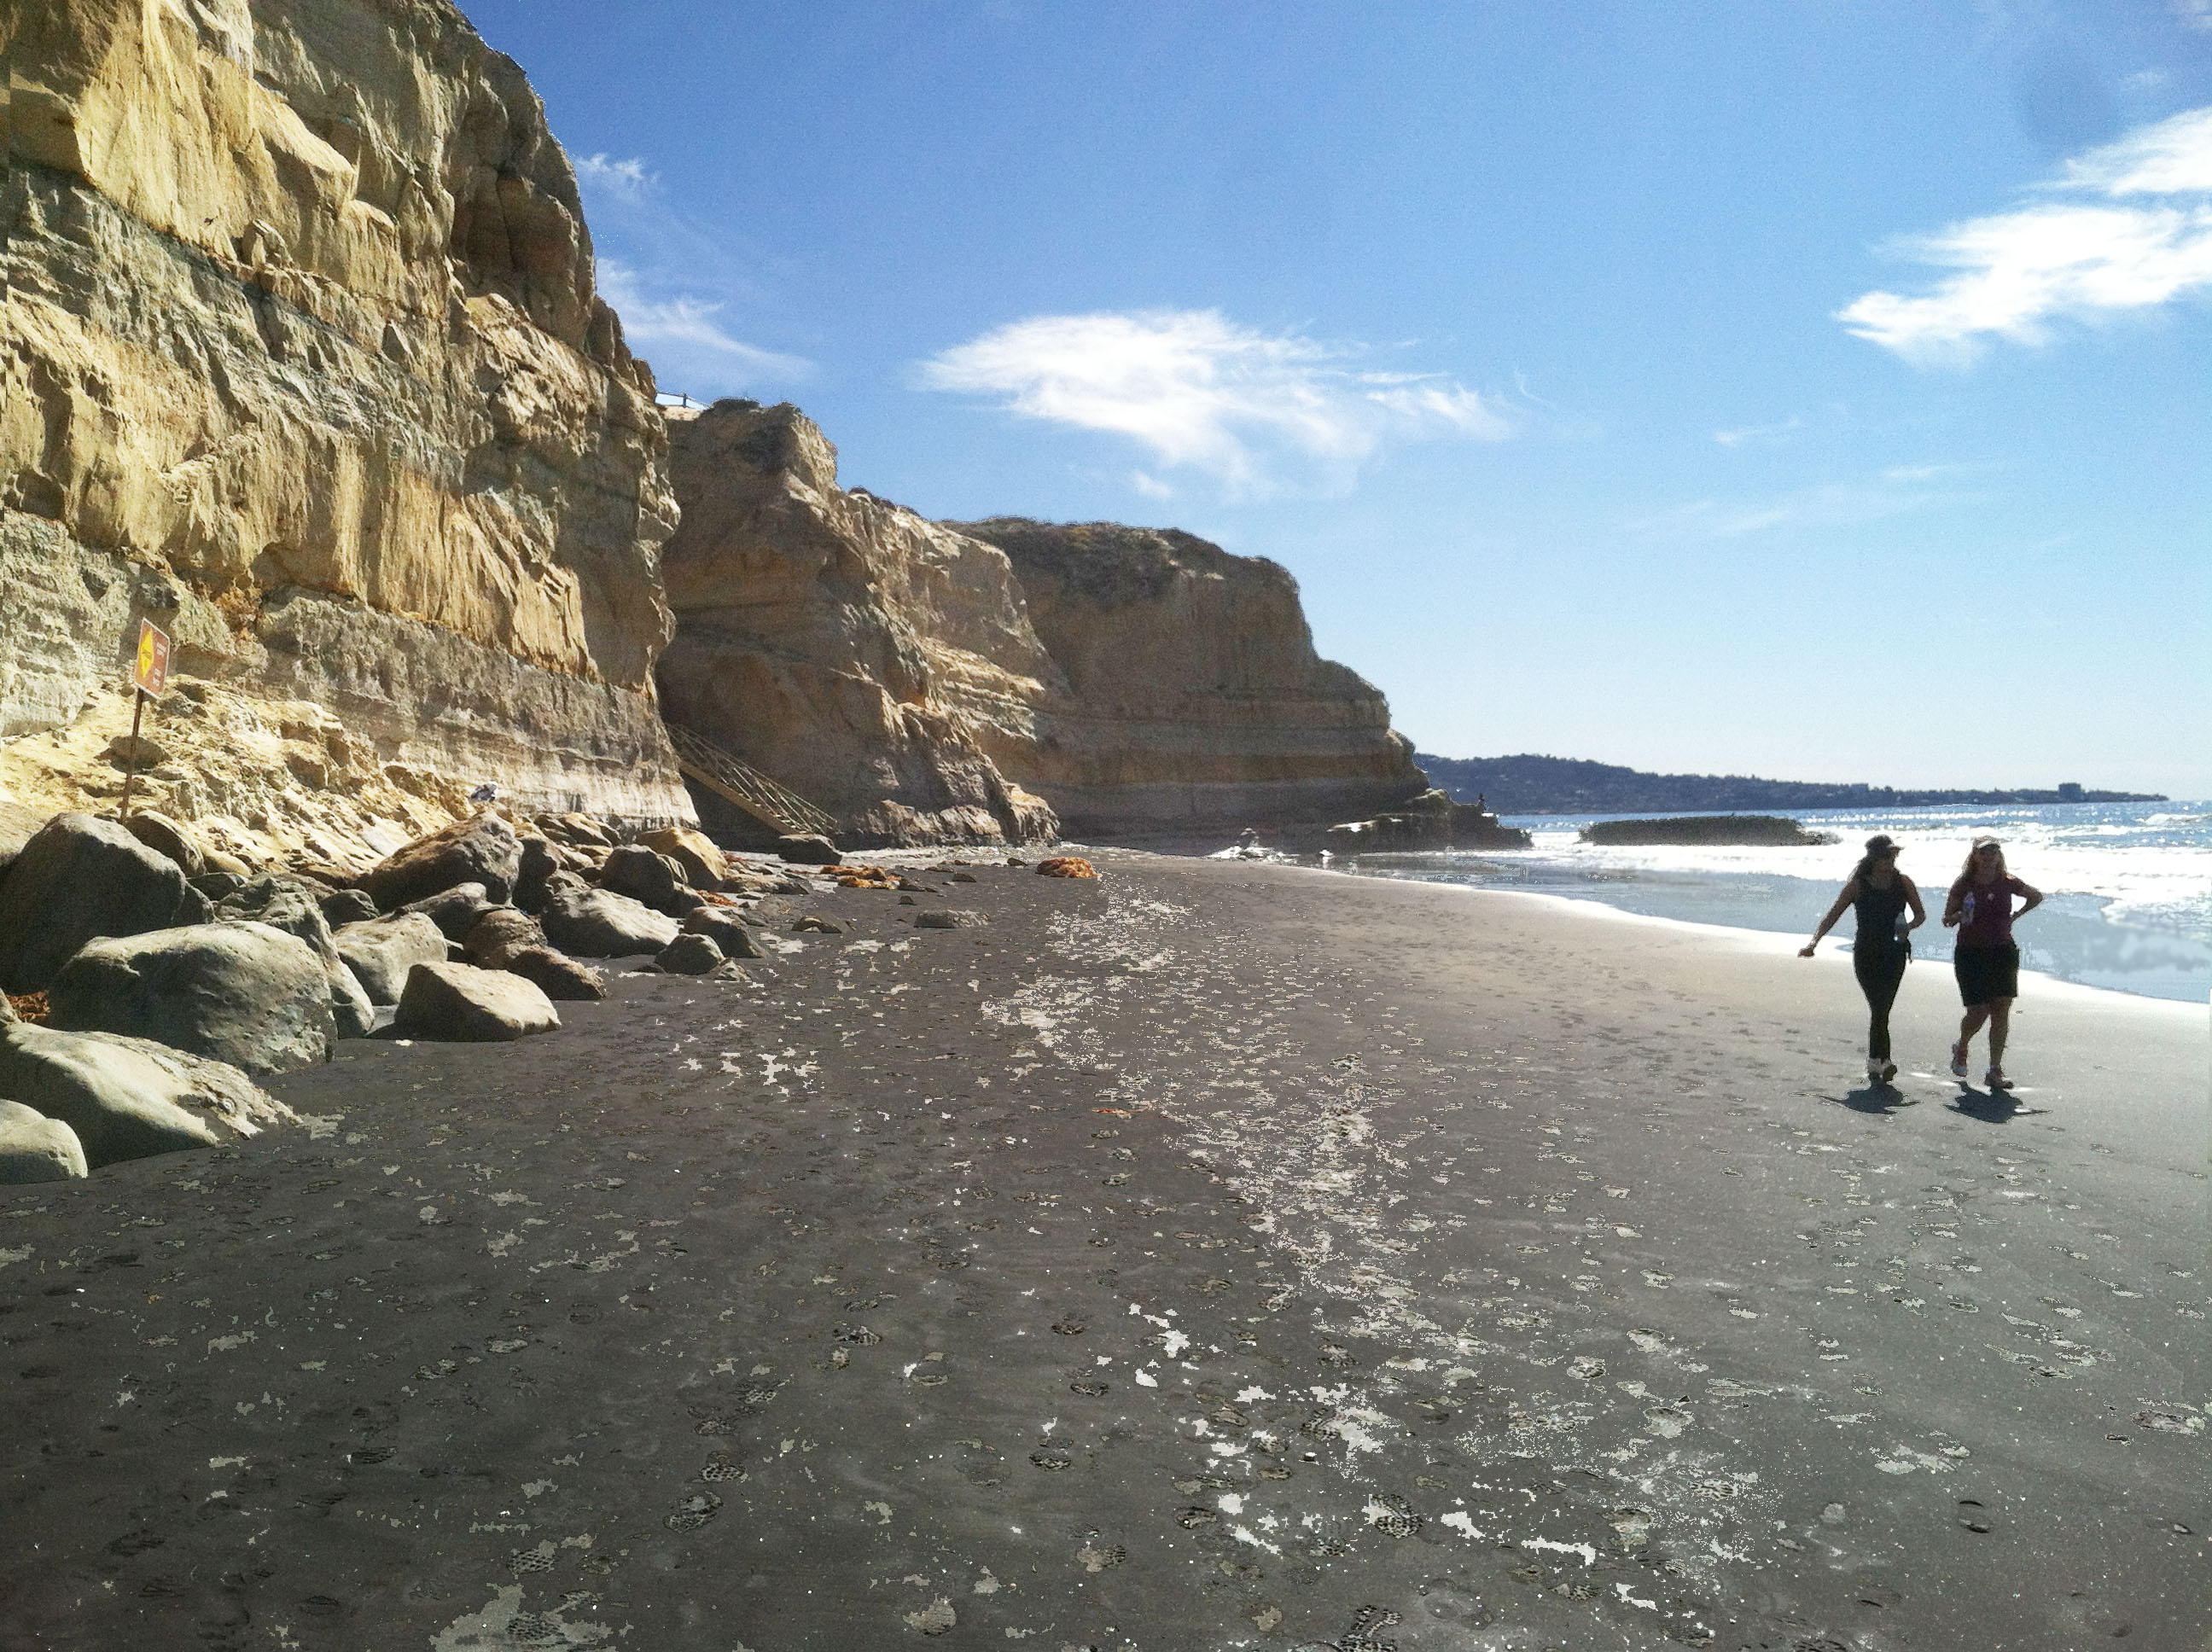
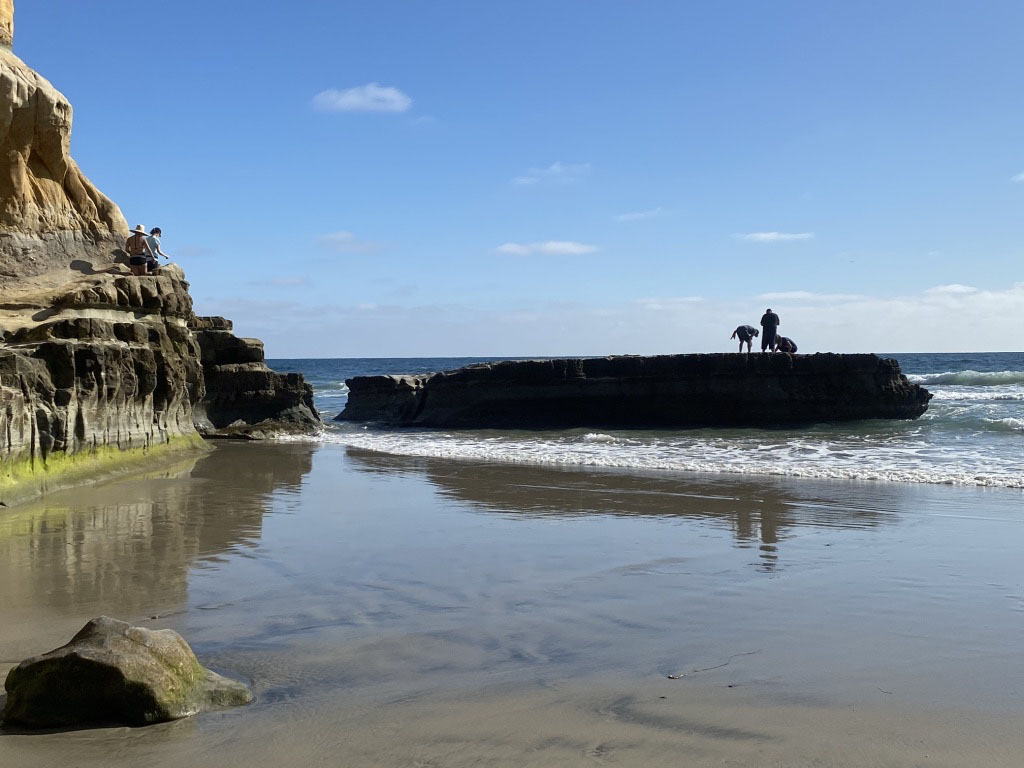
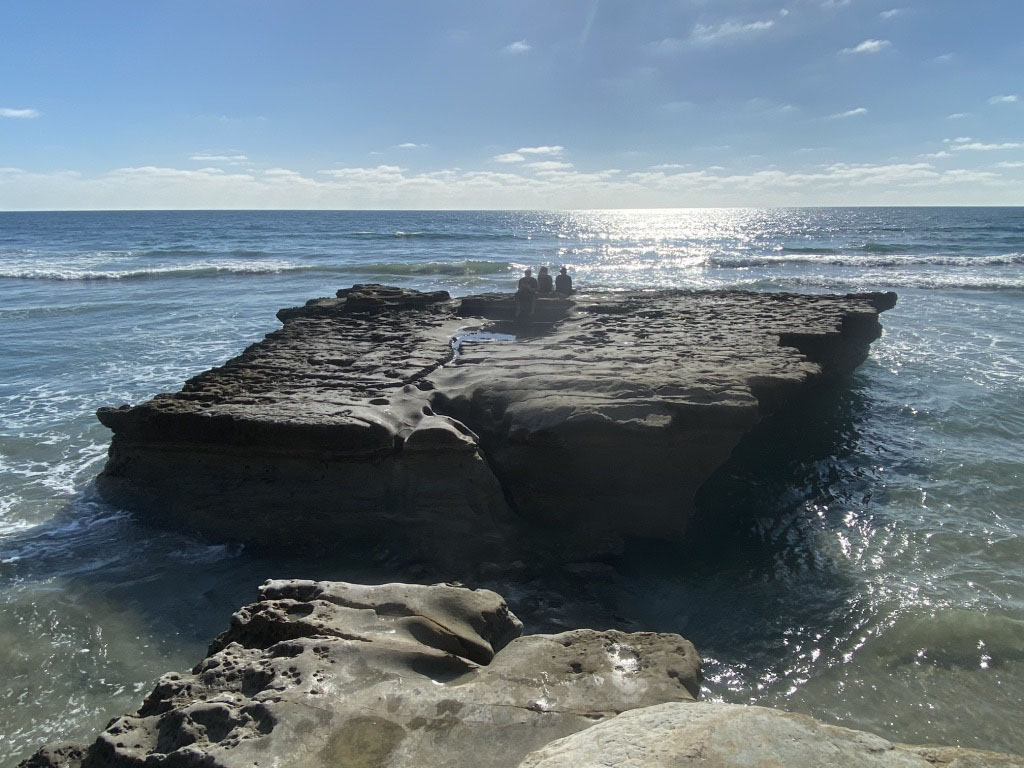
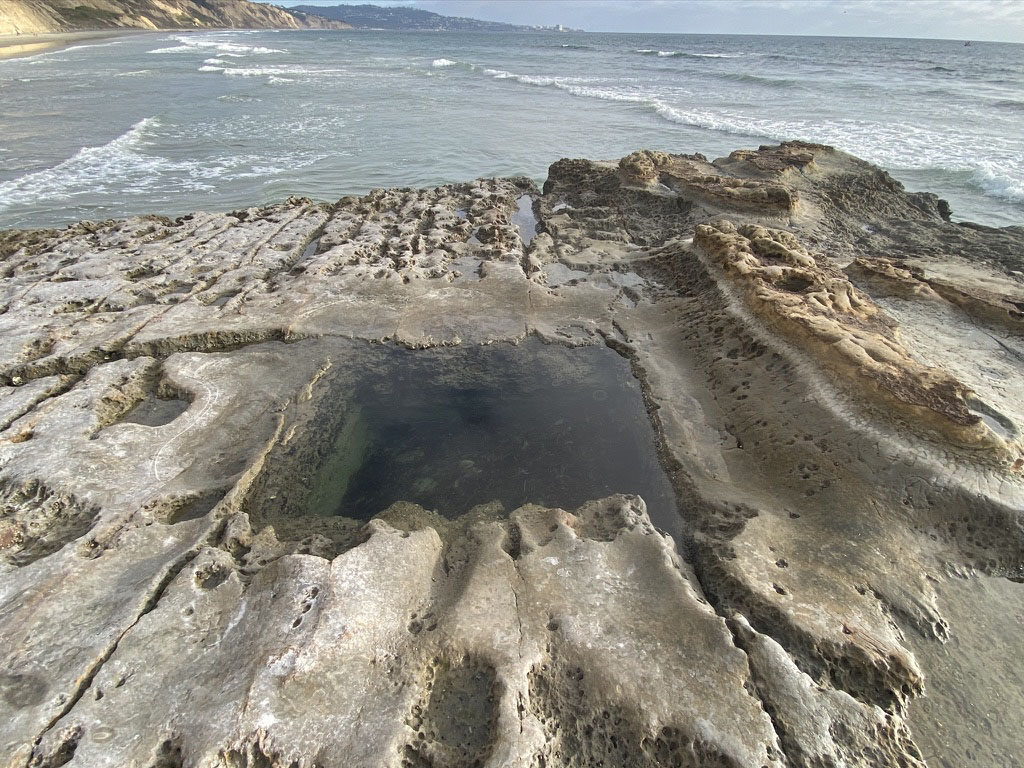
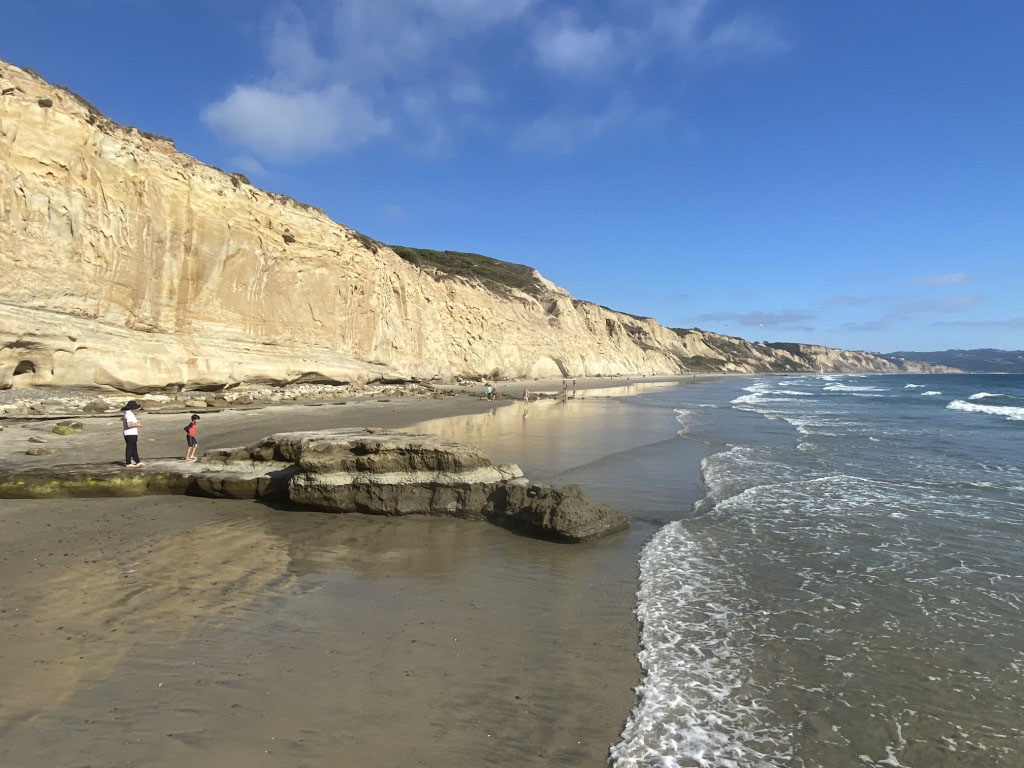
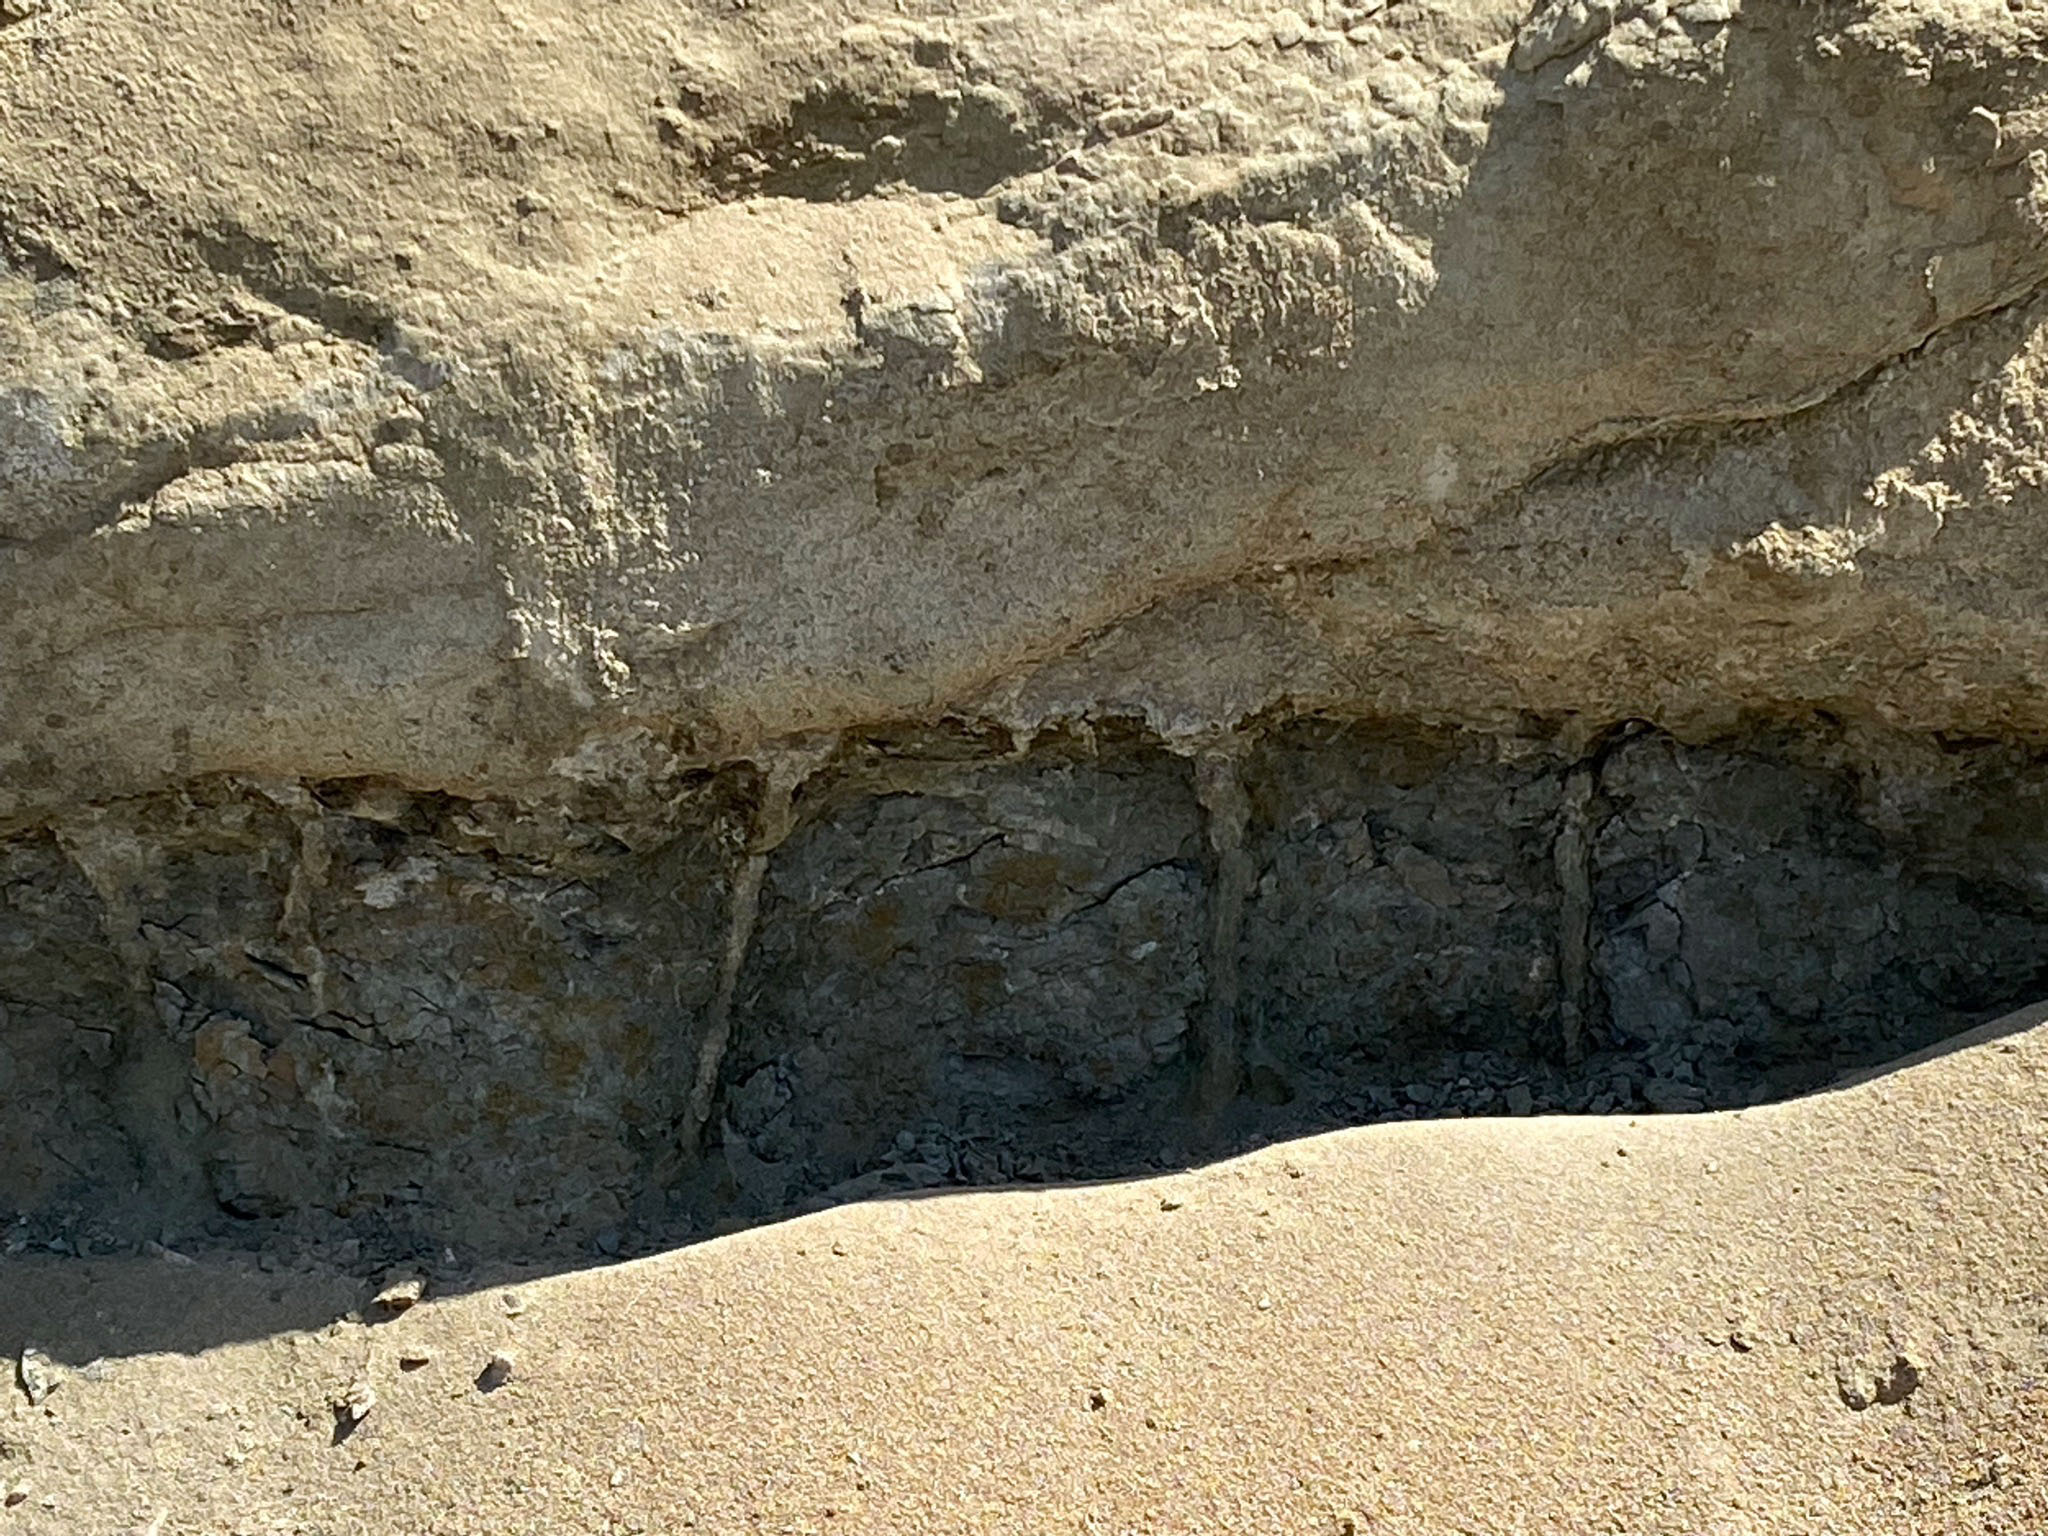
Peñasquitos Lagoon is now restricted by the causeway and bridge. Before the road and causeway the mouth the lagoon would have episodically shifted to other location. Figure 117 shows the ebb-tidal delta at the where outflow form the lagoon deposits sand. A sand bar (with runnel) near the mouth of the lagoon is exposed at low tide (Figure 118). South of the lagoon the beach is constrained by the seacliffs (Figure 119). When high tides combine with strong wave action from storms the beach is completely submerged and waves crash against the base of the seacliffs. Strong wave action actually scours though the beach deposits carving away at the wave-cut platform on the surface of the bedrock. Figure 120 shows where a stream drainage intersects the sea cliff creating a dry waterfall. It shows that wave erosion is the dominant erosion force. Figure 121 shows a beach berm established on a shingled (cobbled) part of the beach. The berm and the gravel are leftover features from the winter stormy season. A beach that is covered with sorted pebbles and gravel is called a shingle beach. Shingle beach features typical are well developed on the upper beach and form in the winter season. In the summer season they may be partly or fully buried beneath sand. Figure 122 show the well-sorted character of the beach gravel with most clasts in the 2-3 inch diameter range. Figure 123 shows a collection of gravel clasts sorted in somewhat of a color wheel fashion. The rounded clasts on the beach are durable cobbles reworked from the older rock formations along the coast, most likely reworked from the ancient Ballena River alluvial deposits that were carried here from volcanic source areas in the Sonora region of Mexico. Some of the clasts also are probably from the local mountain sources; some clasts bear resemblance to clasts found in river terrace deposits along the southern Colorado River drainage. Figure 124 shows a portion of the beach near Flat Rock that was entirely covered with black sand in the winter season. The black sand is mostly magnetite, a common durable, dense iron-oxide mineral derived from granitic source rocks—the dominant rock type in Peninsular Ranges of San Diego County. The dense magnetite sand is concentrated by wave action that sorts and removes the lighter quartz sand. Figures 125, 126, and 127 show Flat Rock, a prominent feature at the point of the headlands between Torrey Pine Beach and Blacks Beach (to the south). Flat Rock is a wave-cut bench which is an elevated remnant of the wave-cut platform. Wave-cut benches can be indicators of past sudden uplift from major earthquakes along a coastline. Flat Rock is an eroded remnant of a hard flat-lying sandstone layer of the Delmar Formation. It can also be considered a sea stack because it is a mass of rock detached by wave action from a cliff-lined shore and surrounded by water. Figure 105 shows a water-filled, square-shaped pit that was cut into the surface Flat Rock. Local lore is that this was an exploratory shaft that was dug in a failed attempt to find a coal bed in the Delmar Formation below the sea bed to possibly supply coal for a proposed railroad. The railroad was eventually constructed without a supply of local coal. Figures 128 shows another wave-cut bench near Flat Rock and how wave action is undercutting the sea cliffs in Torrey Sandstone on Blacks Beach. Figure 129 shows large boulders sculpted by wave action beneath the overhang in the cliff. Strong wave action during storm hurls hard cobbles and loads of sand against the base of the seacliffs. This abrasive action undercut the sea cliff leading to cliff failures. Along fractures and zones of weakness allow for the formation of sea caves (Figure 130). Figure 131 shows how differential erosion affects the shoreline with this view looking north at Blacks Beach from the Torrey Pines Gliderport. The headlands near Flat Rock at the north end of Blacks Beach is underlain by the more erosion-resistant sandstone and marl beds of the Delmar Formation, whereas the wider part of the beach is under and adjacent to the softer Ardath Shale. As a result wave action over time is carving the wave-cut platform and seacliff faster on Blacks Beach compared to the headlands area. |
|


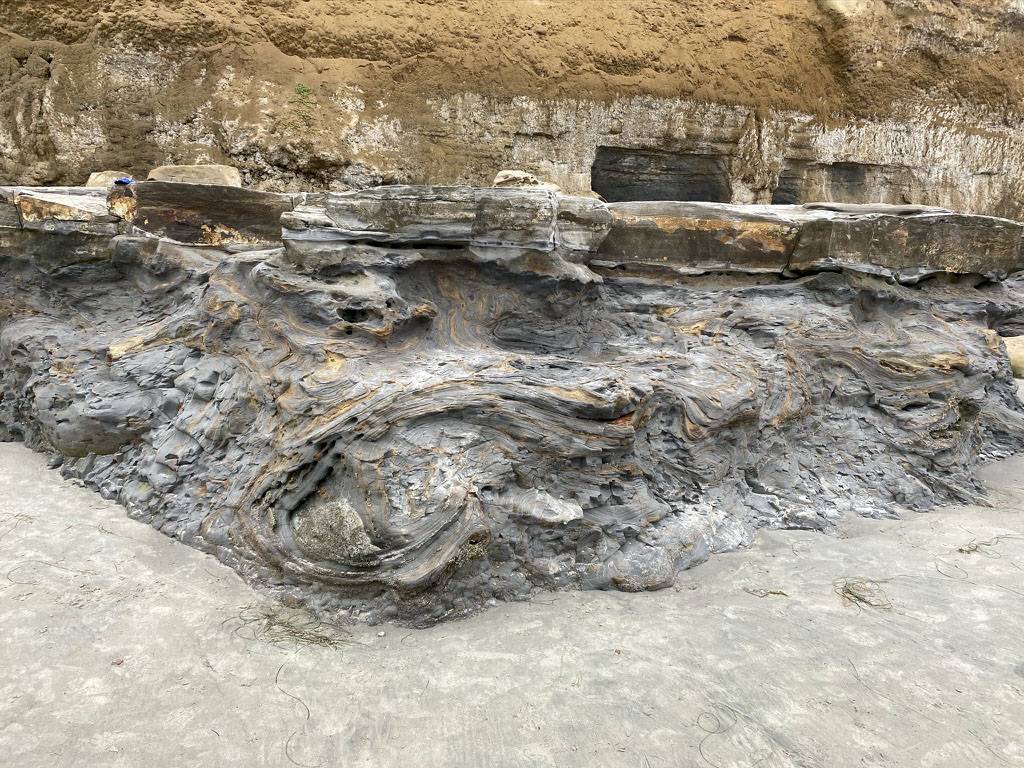
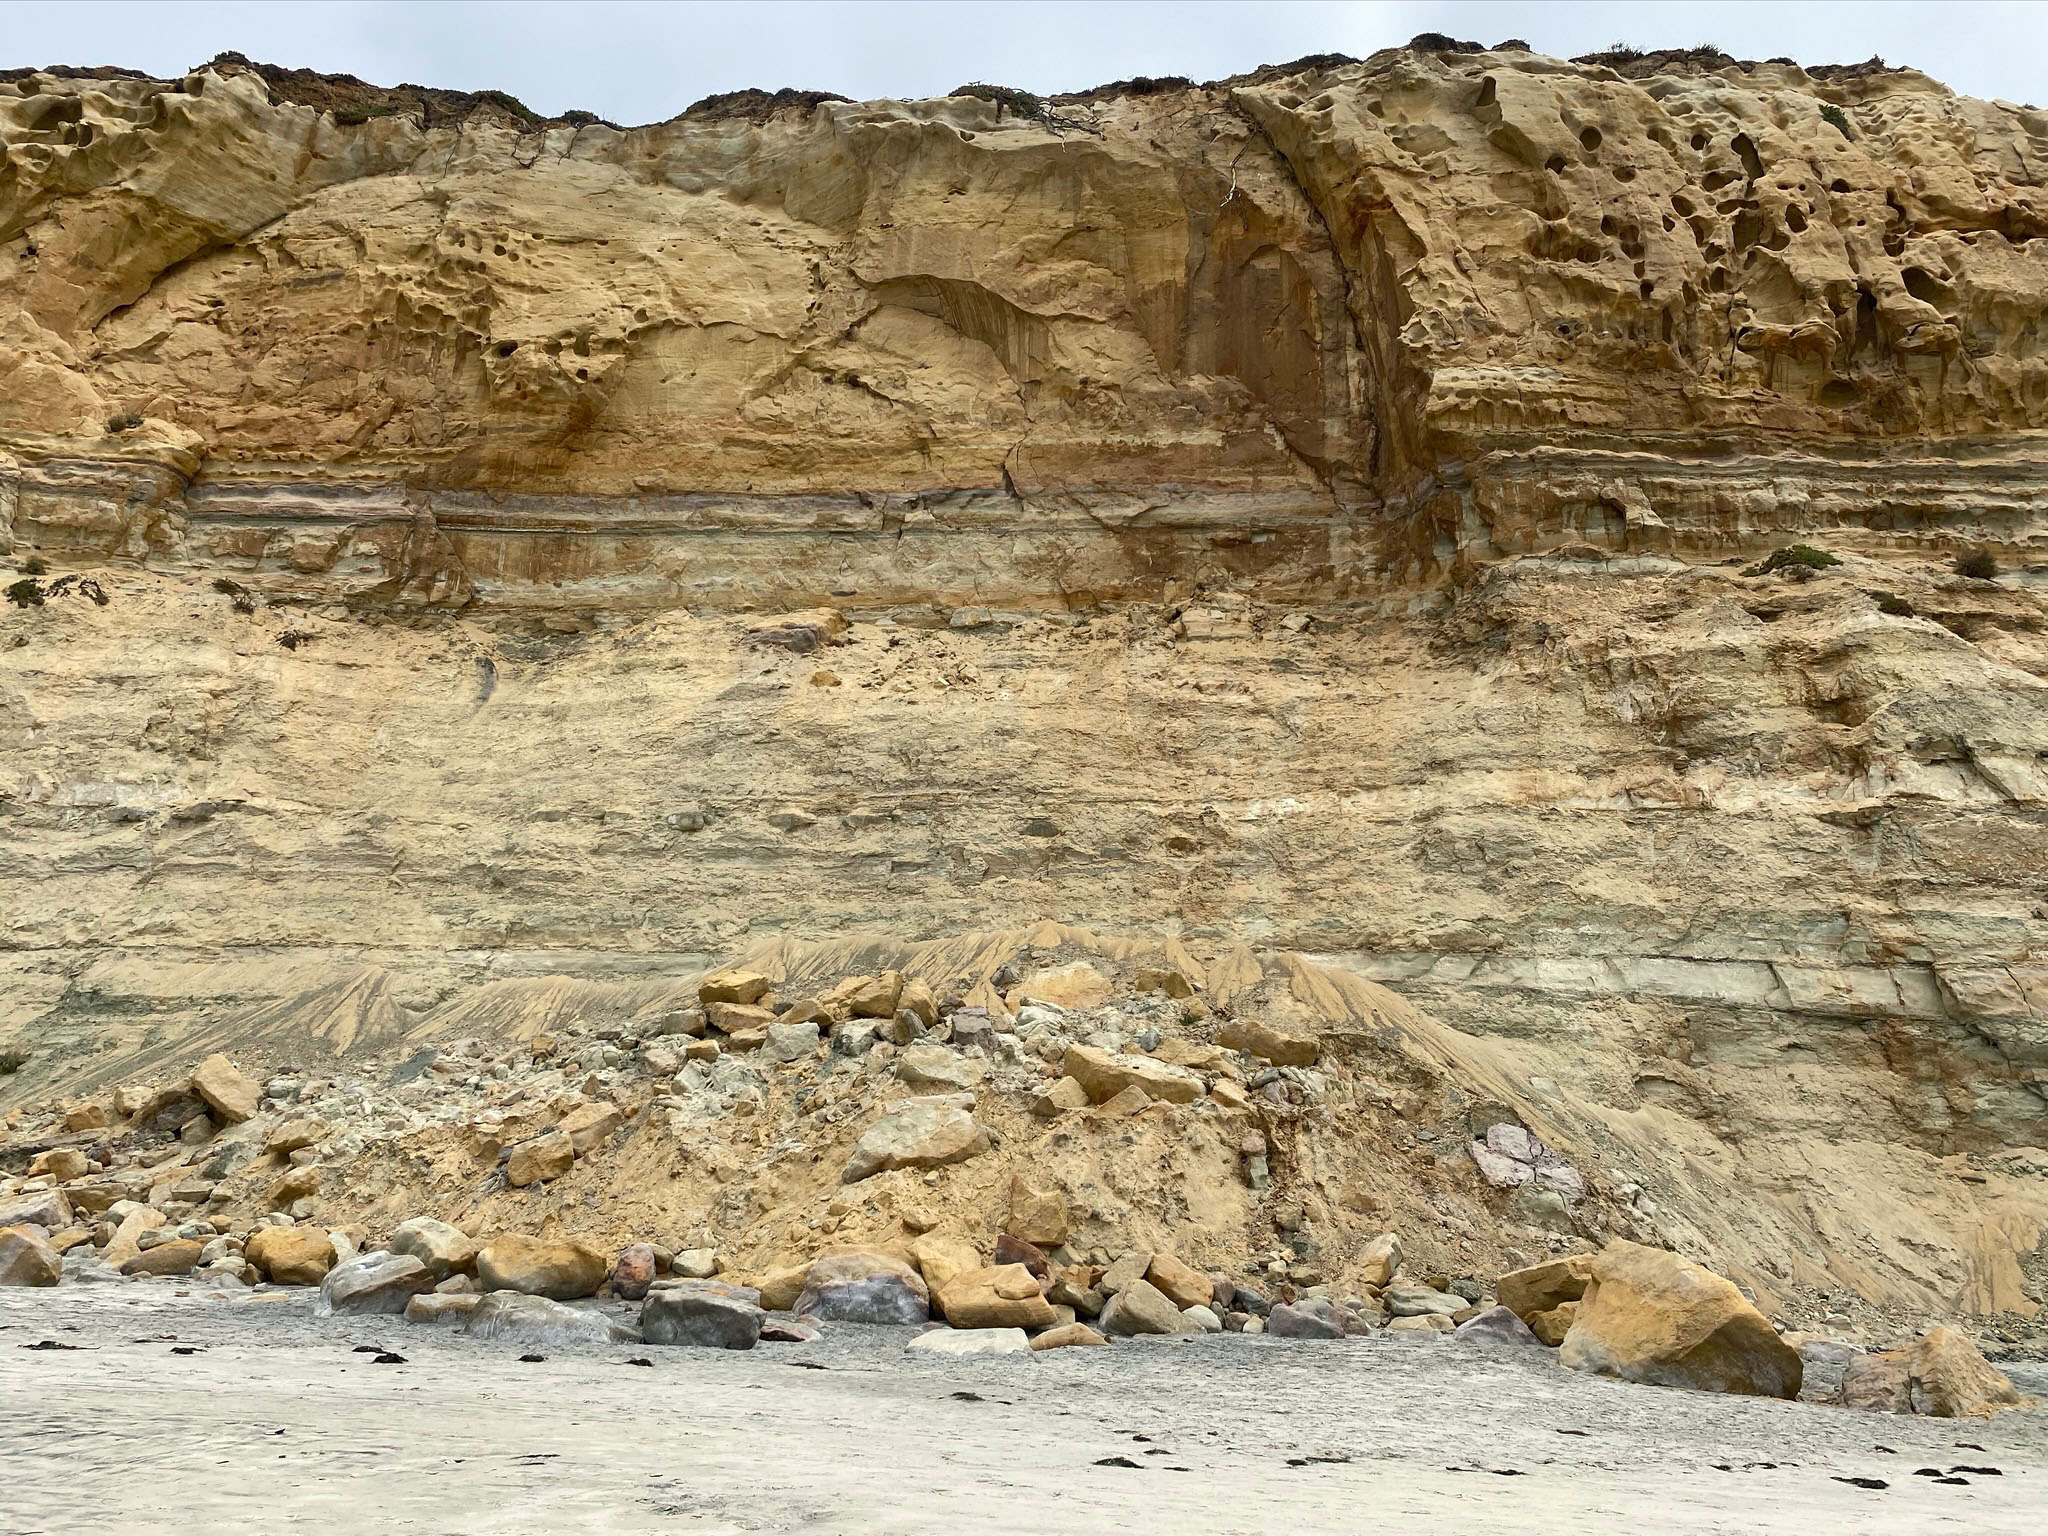
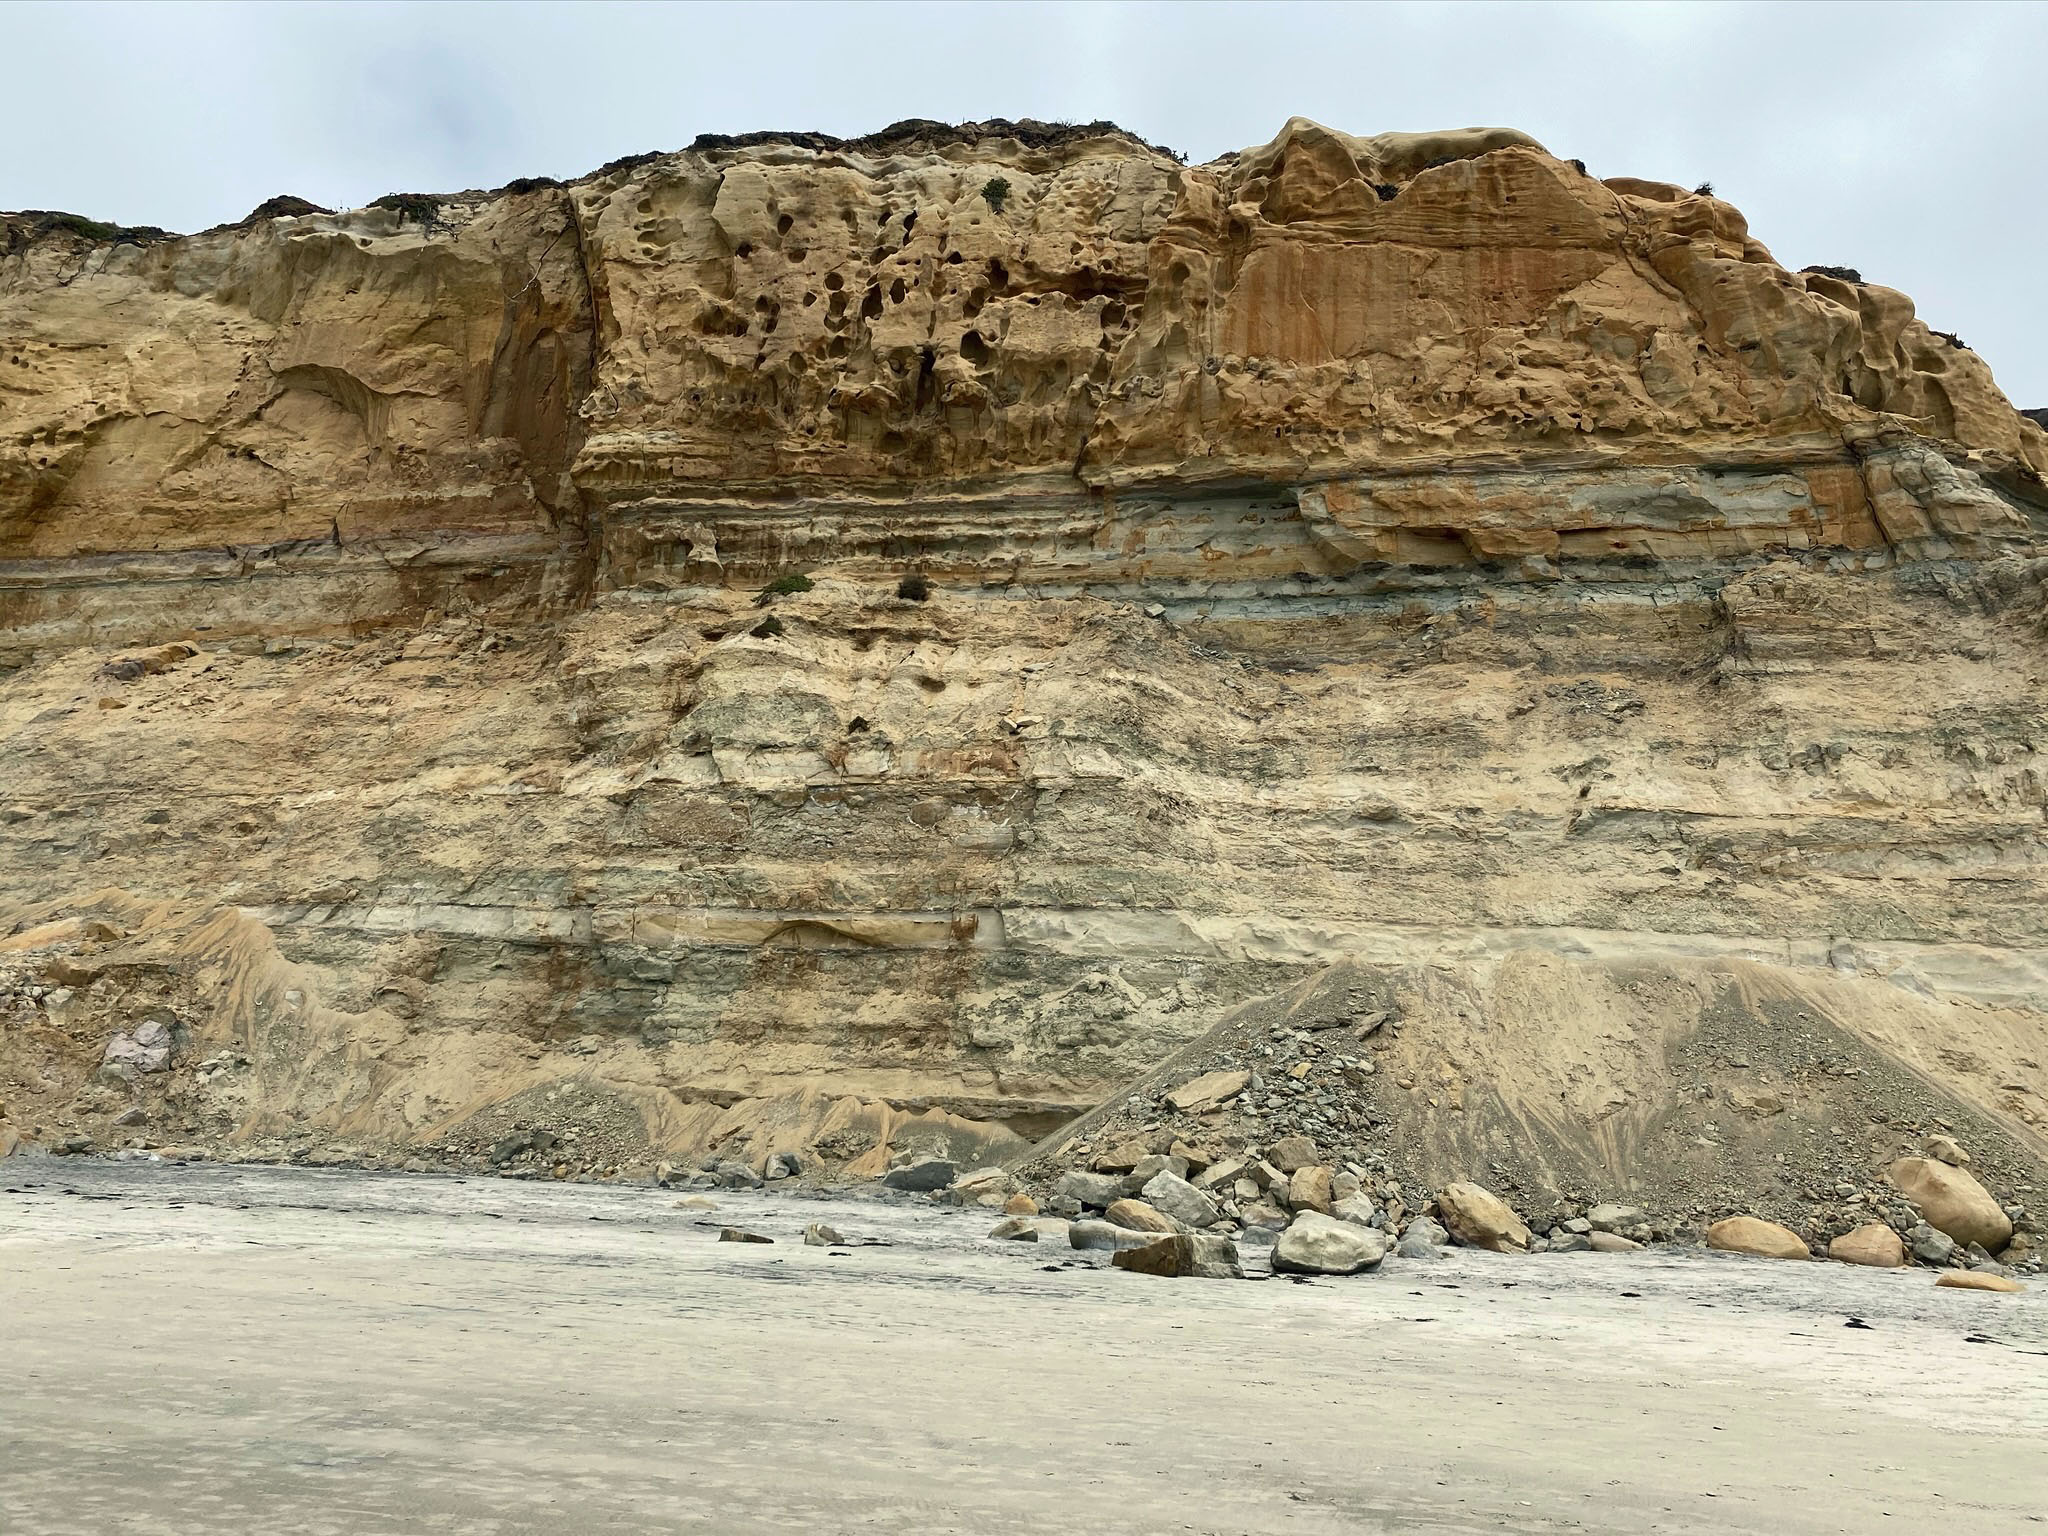
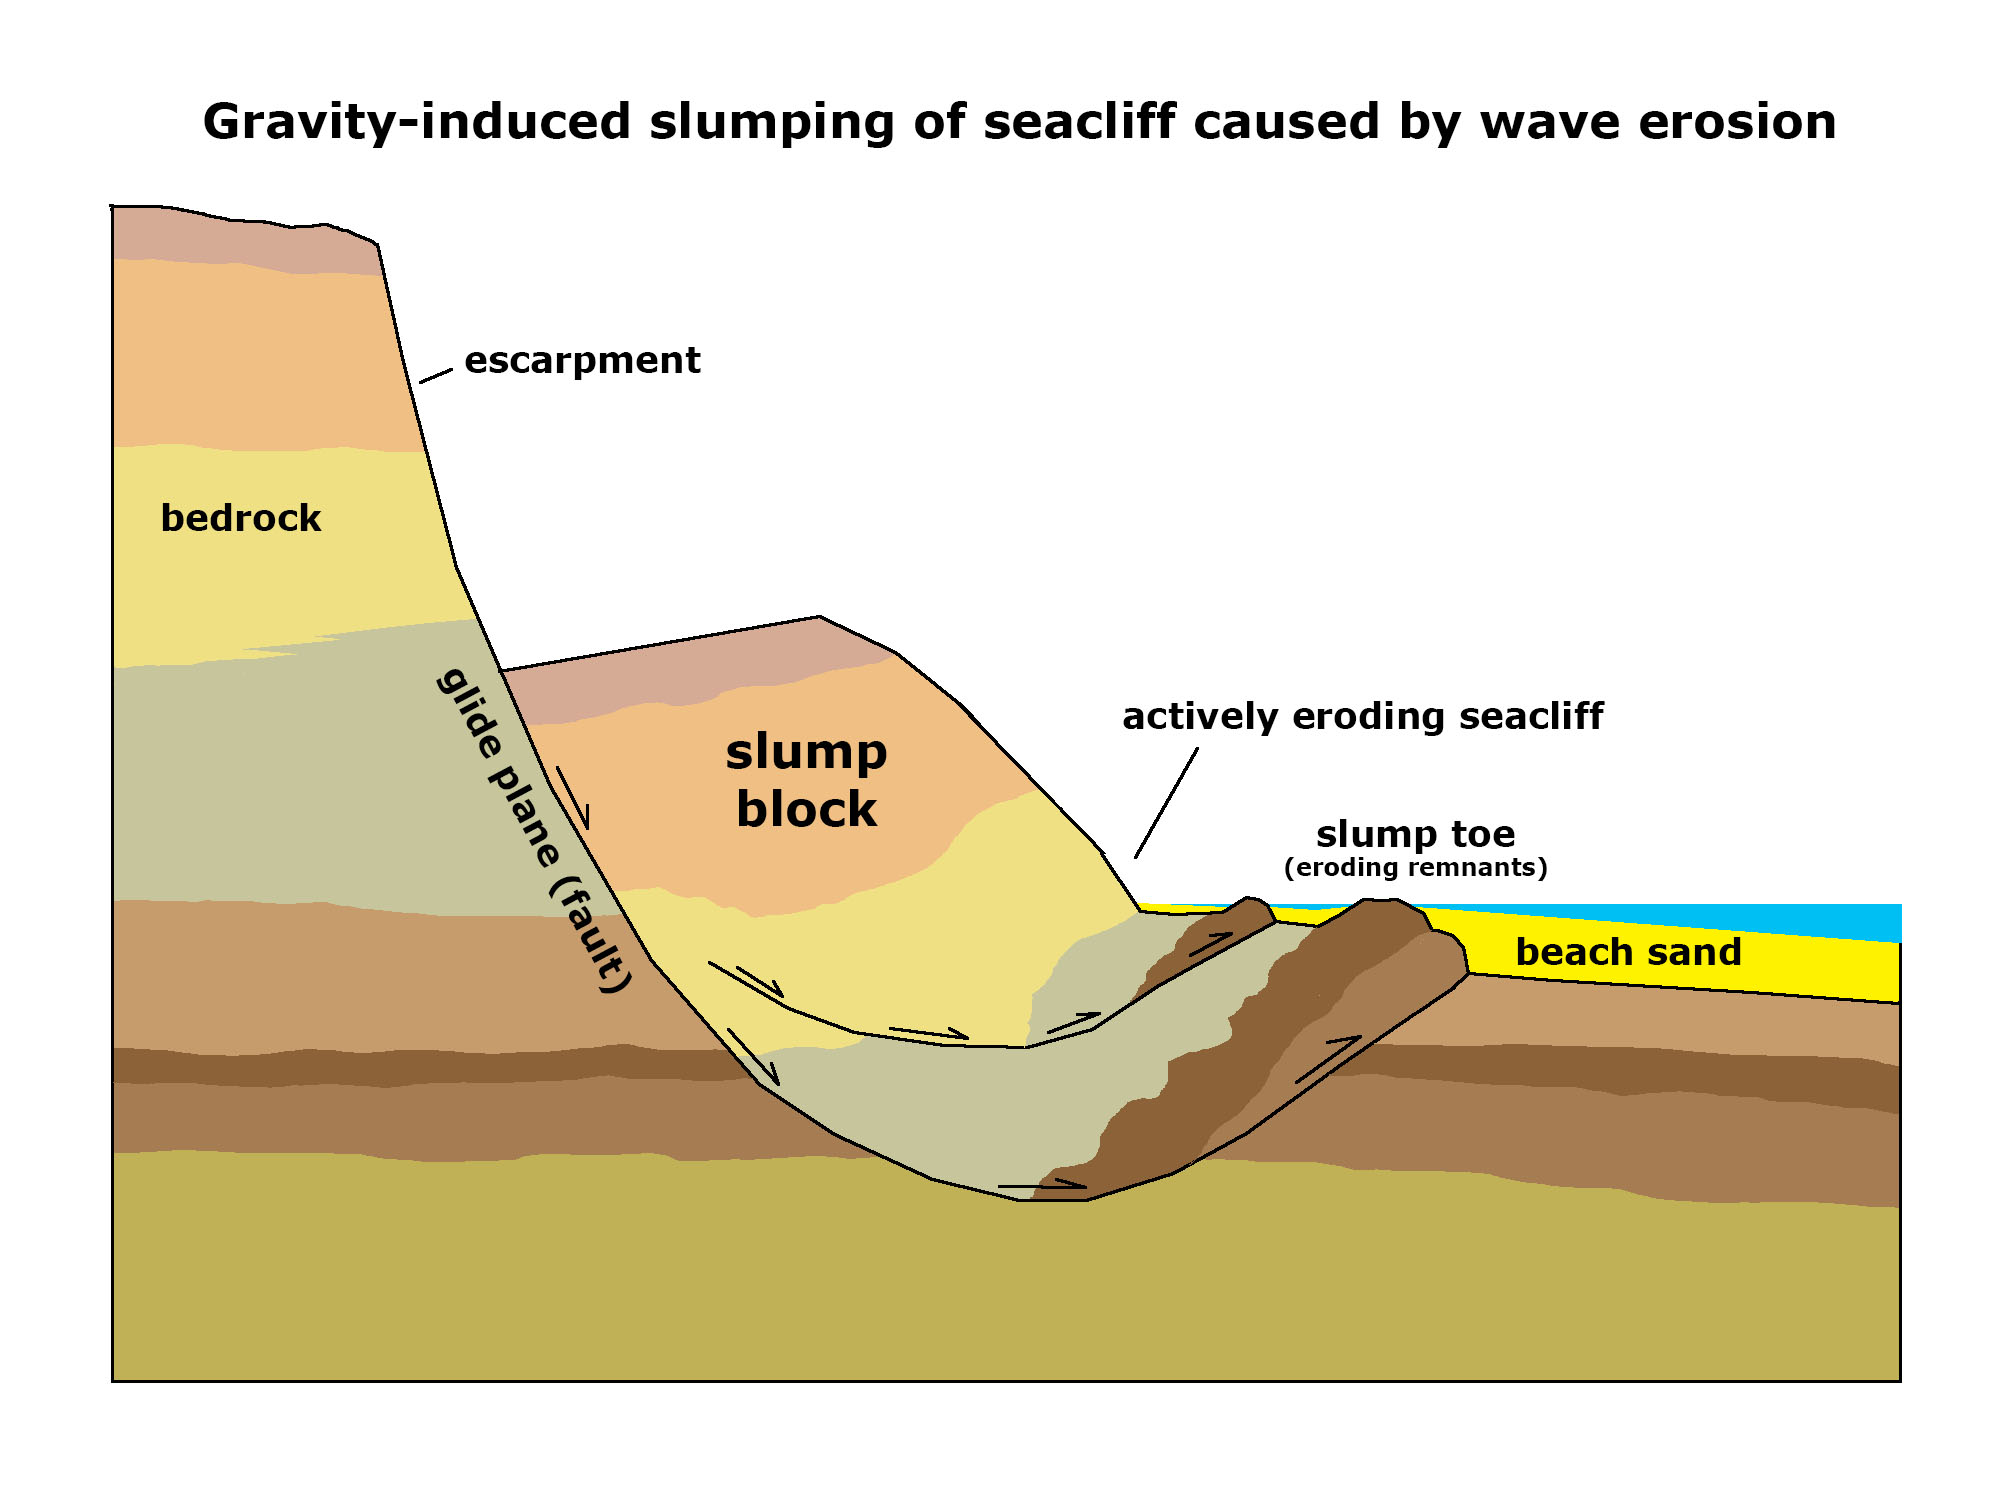
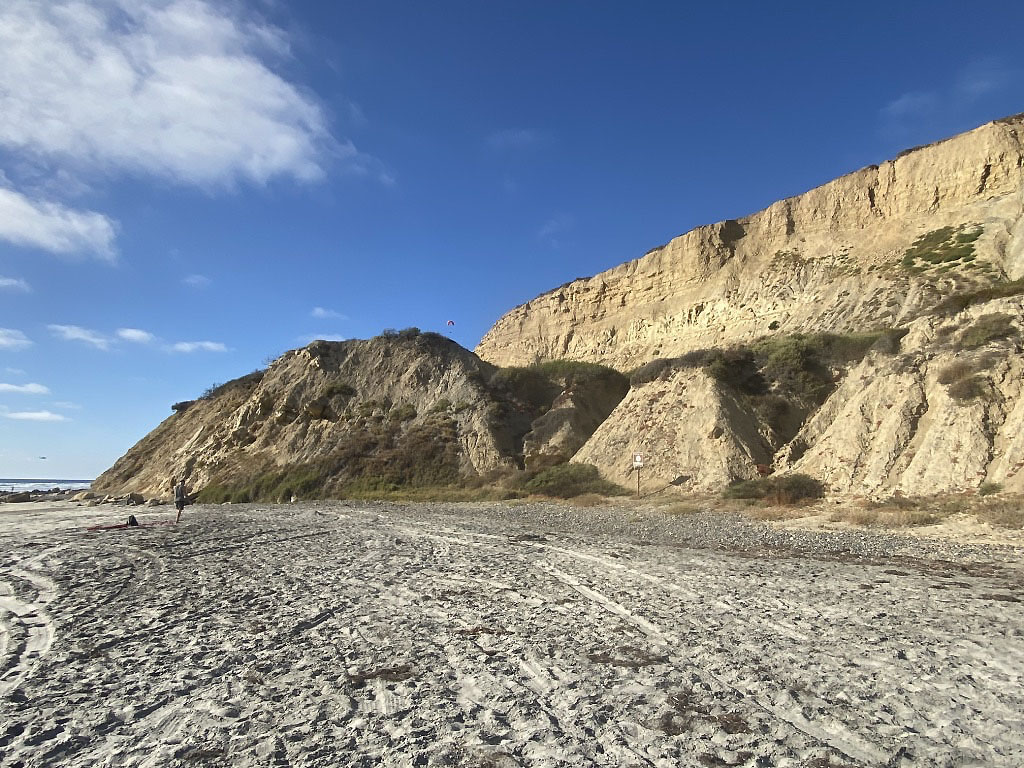
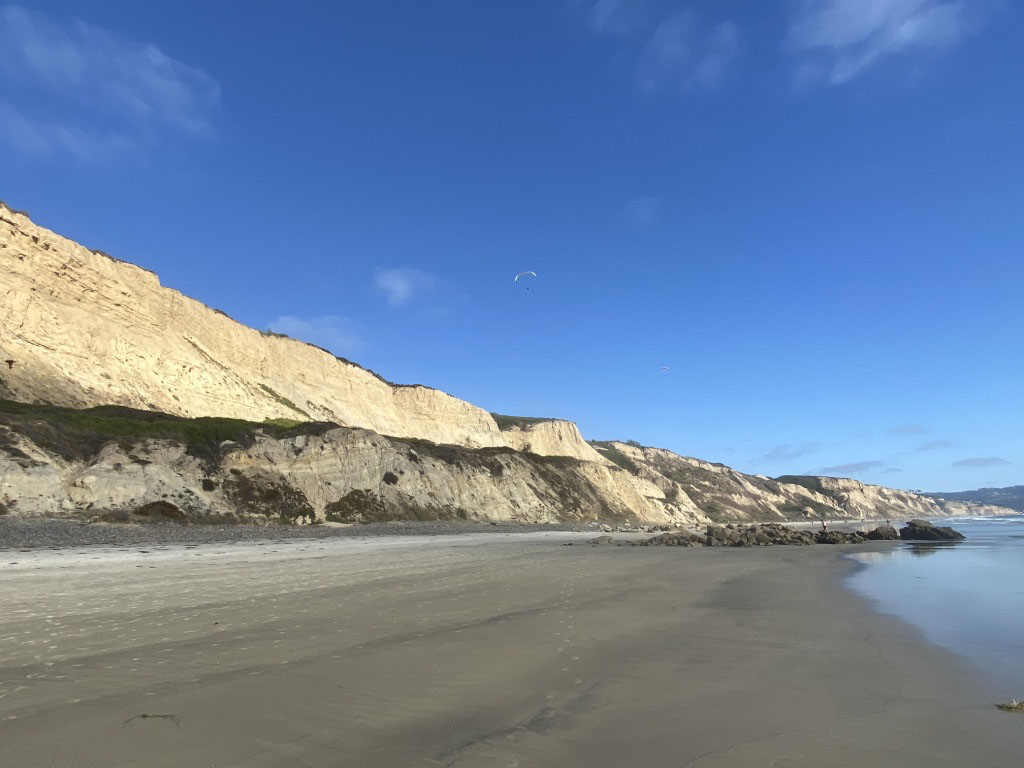
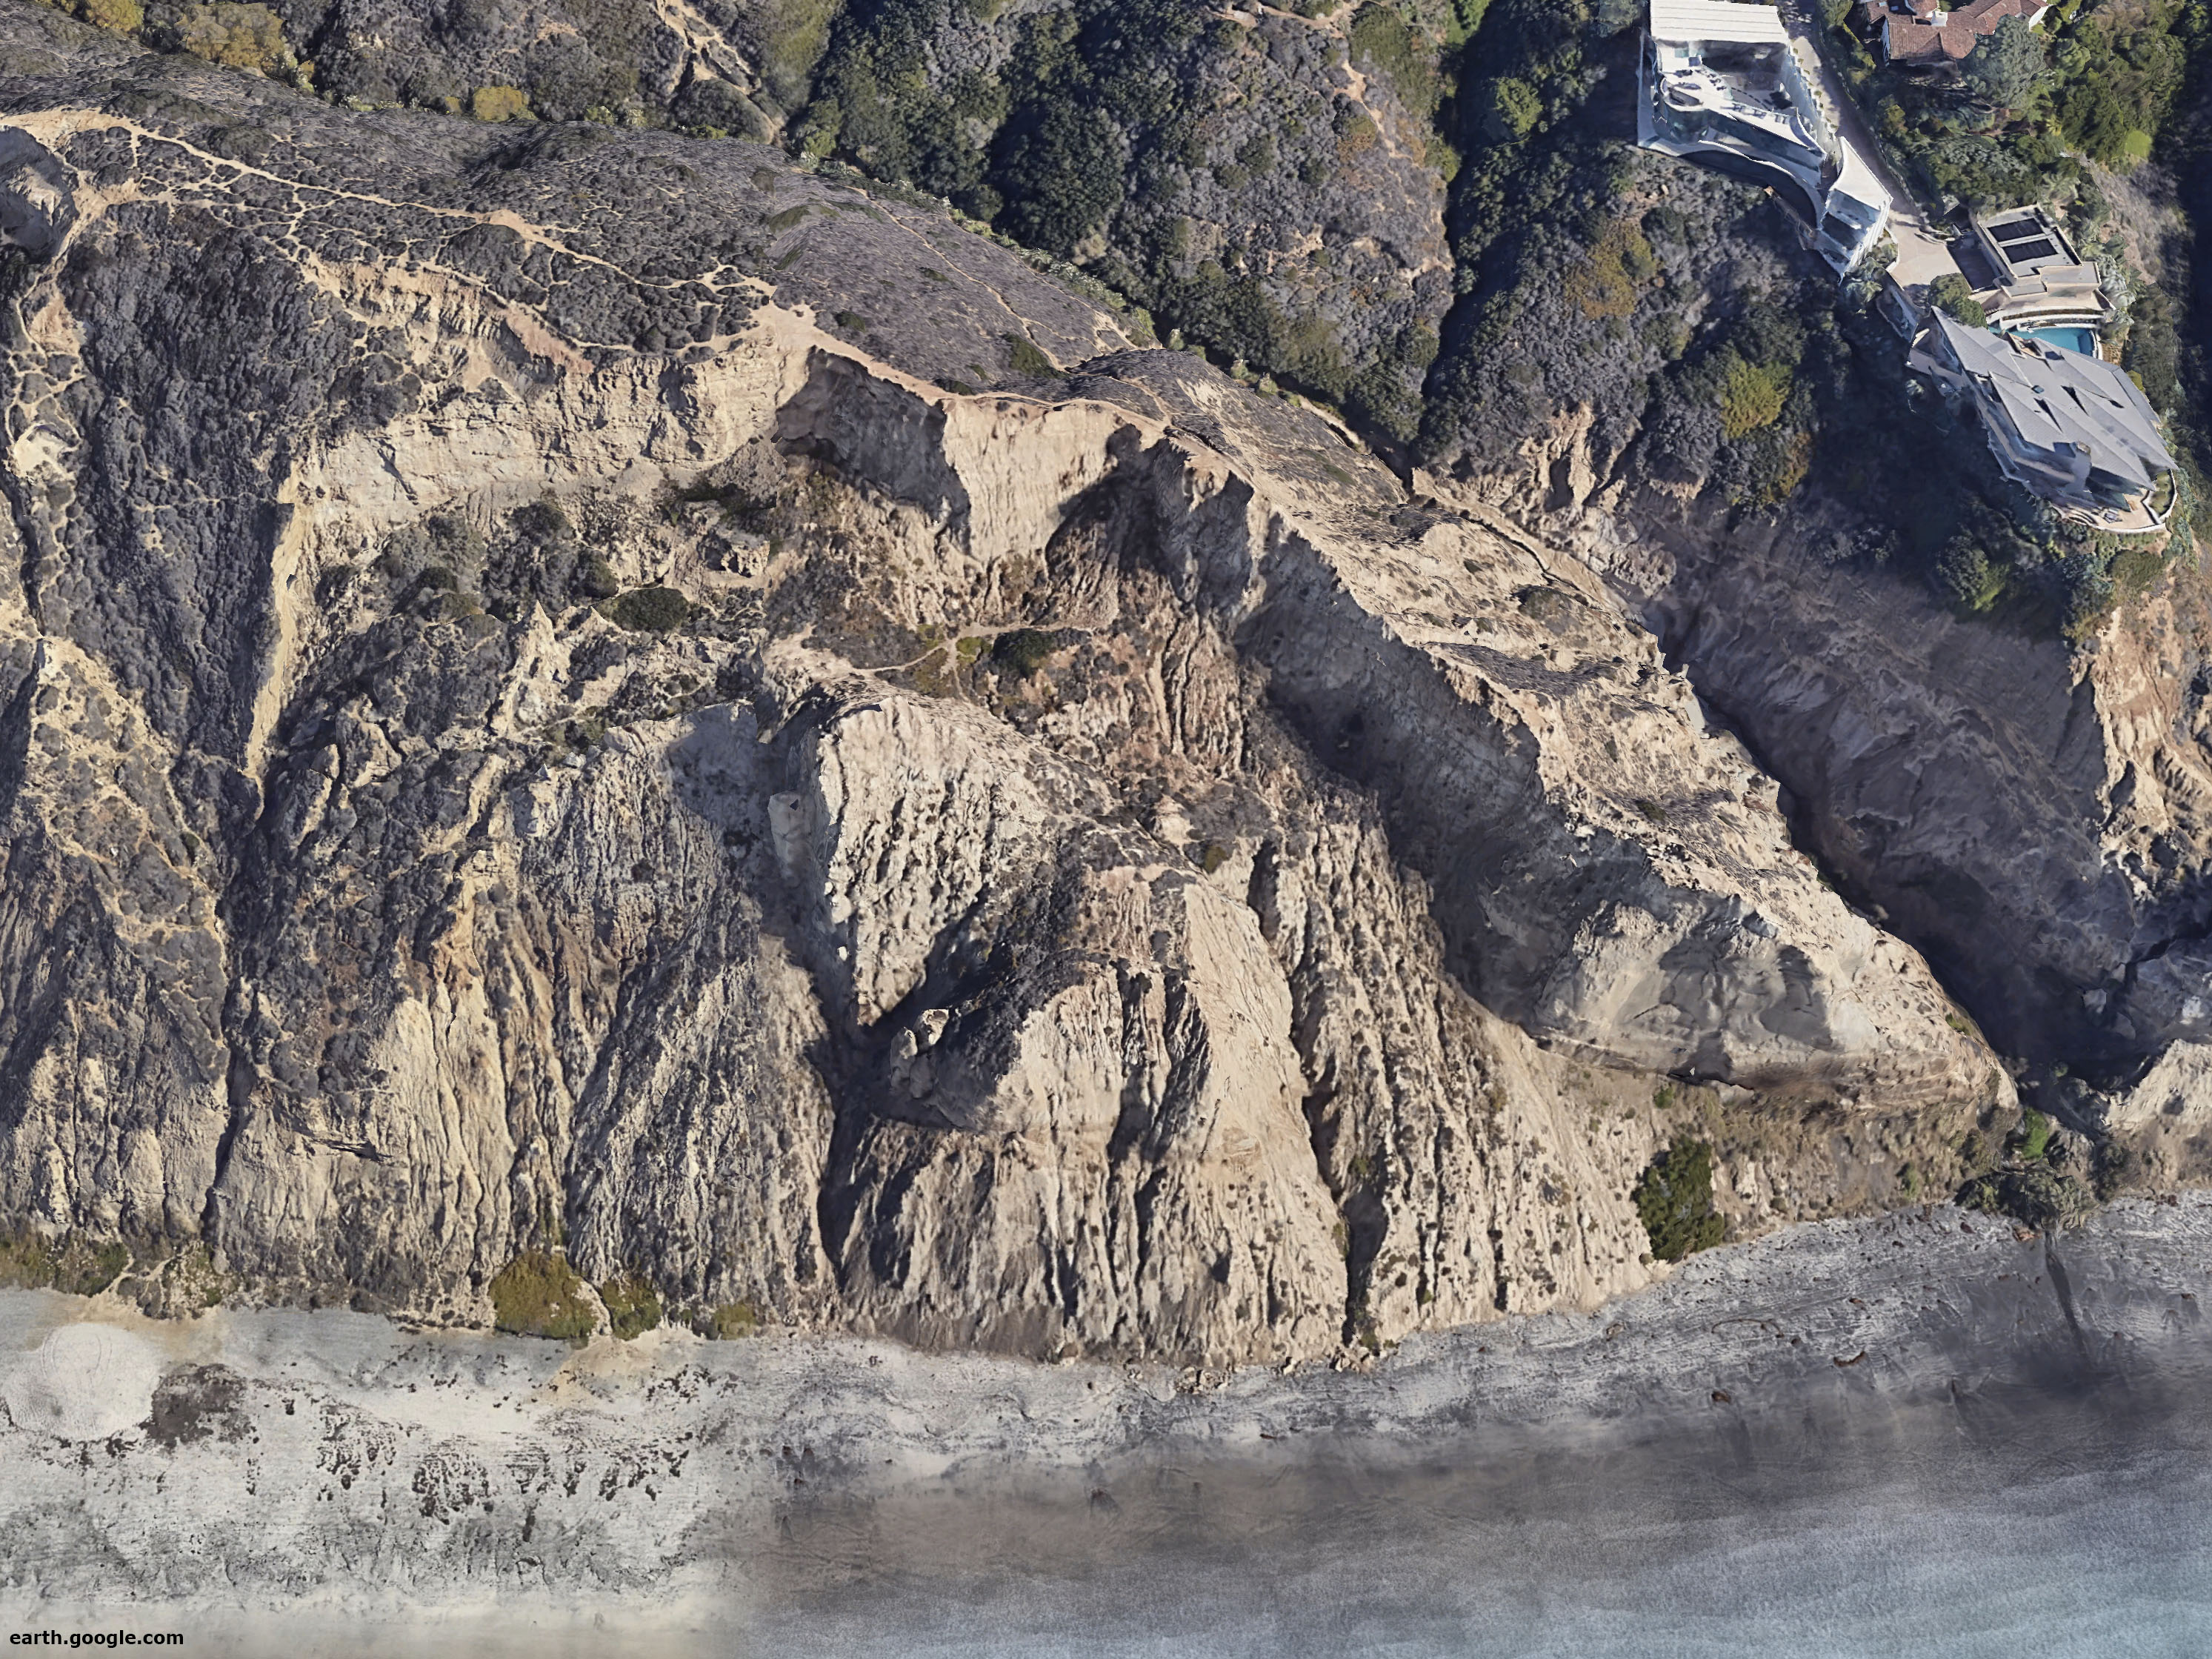
Sea Cliff Landsliding Features and Hazards In the Torrey Pines Park AreaSea cliff failures kill and injure people every year in California, and the beach/sea cliffs in the Torrey Pines area has had its share over the years. Sea cliff rock-fall warning signs are posted along the beach (Figure 132). Coastal erosion and sea cliff collapse is a HUGE problem in San Diego and coastal erosion specialist mention the heavily developed San Diego coastline north of Torrey Pines frequently in their discussions and research. The rate of coastal erosion varies from place to place and from year to year. Beach sand erosion is easiest to see from year to year. "California’s coastal erosion rates generally range from 0-42cm/year; however, specific sites can retreat at much higher rates." (Beachapedia, 2018). Sea cliff failures involve a variety of landsliding: including topples, rock falls, debris flows, creep, and slumps (Figure 133). The US Geological Survey defines a landslide as "the movement of a mass of rock, debris, or earth down a slope. Landslides are a type of 'mass wasting,' which denotes any down-slope movement of soil and rock under the direct influence of gravity." Cliff failures can be massive! Figure 137 illustrates a cross-section showing features of a massive coastal slump. Blacks Beach is host to an example of one, shown in Figures 138 and 139. Massive slumps like this one are typically slow moving. Wave erosion carves away at the toe of the slump, revealing highly contorted bedding exposed in tide pool outcrops along the beach. |
|

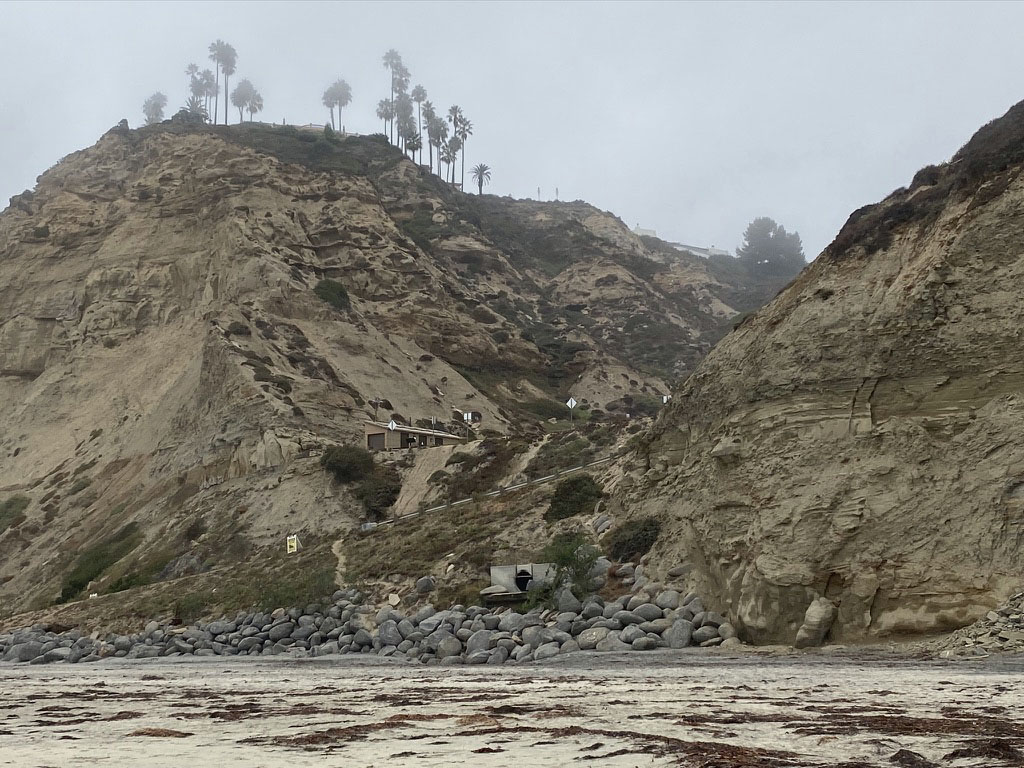
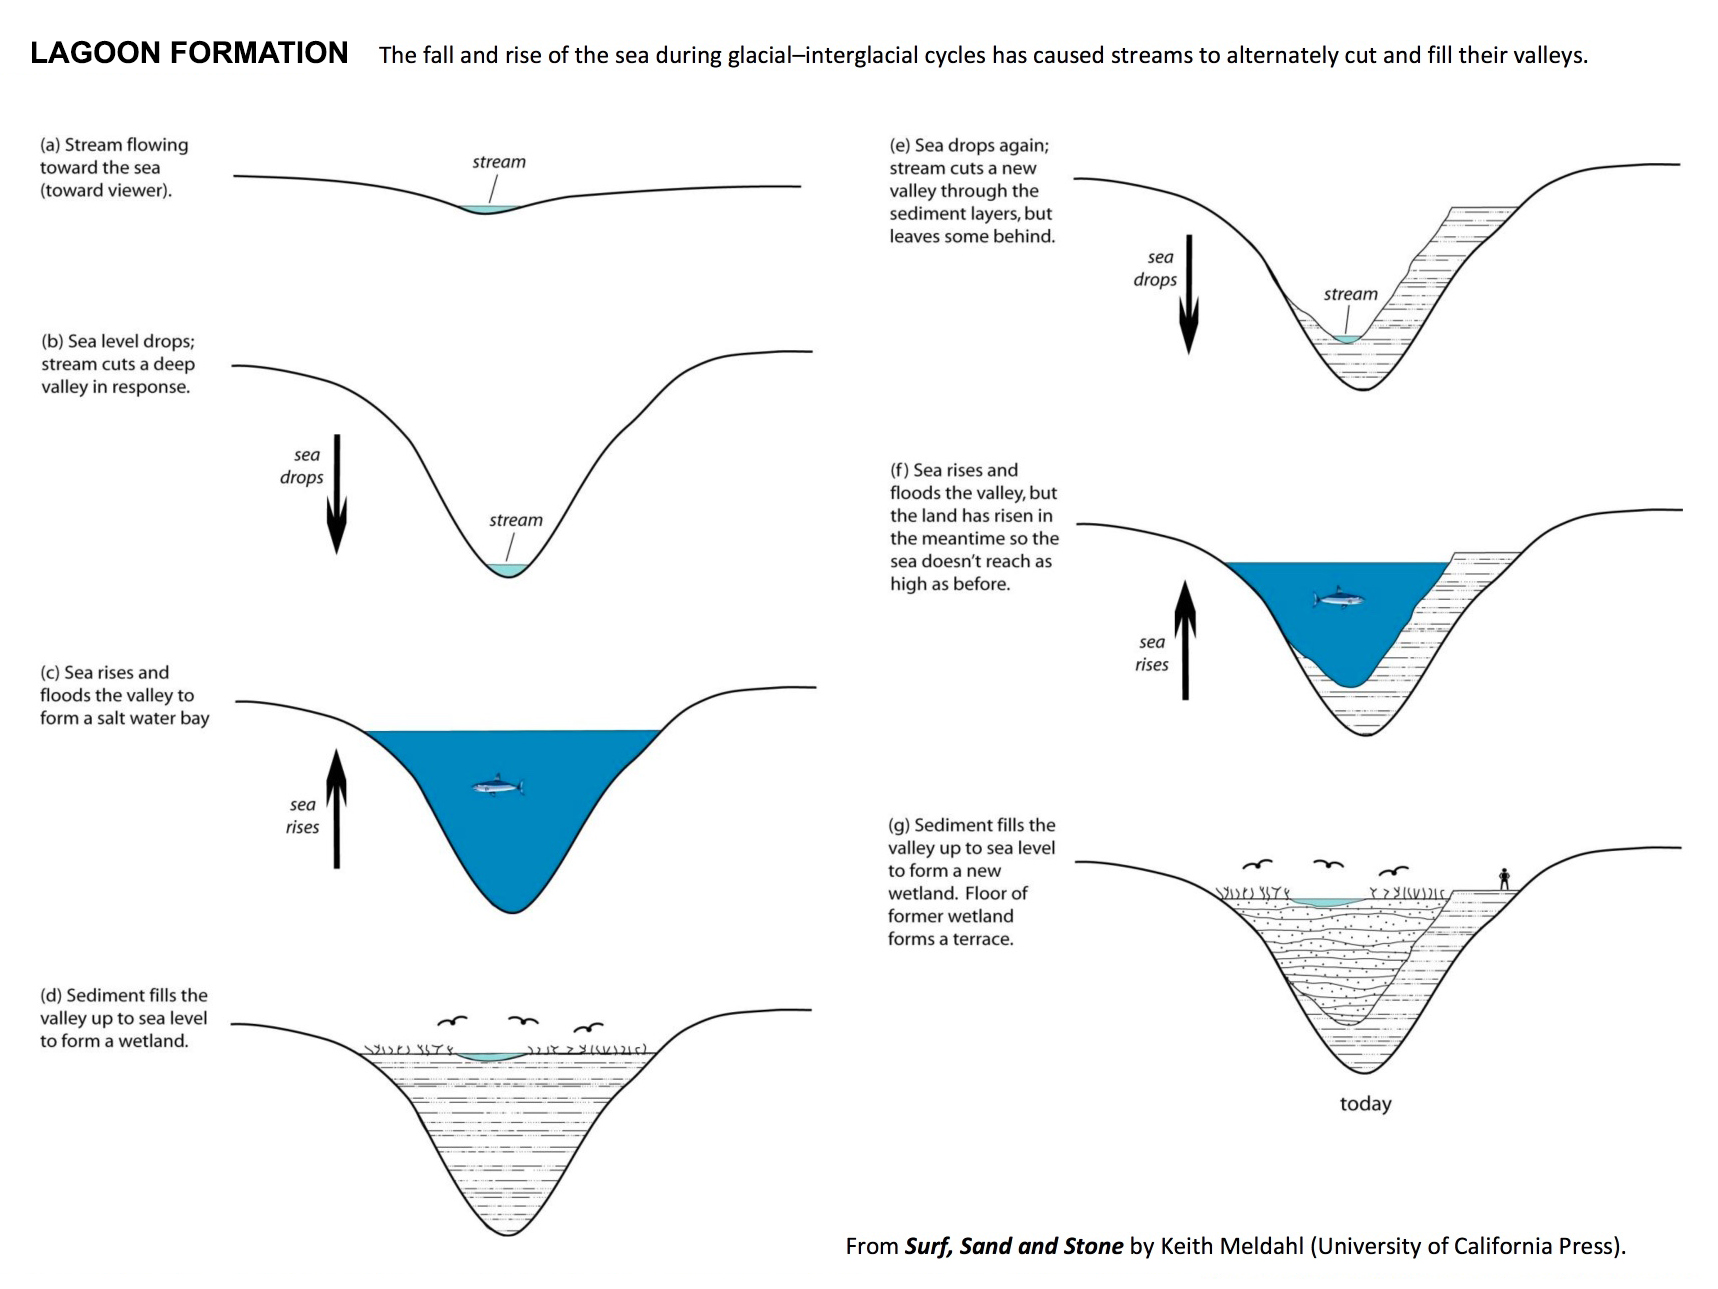
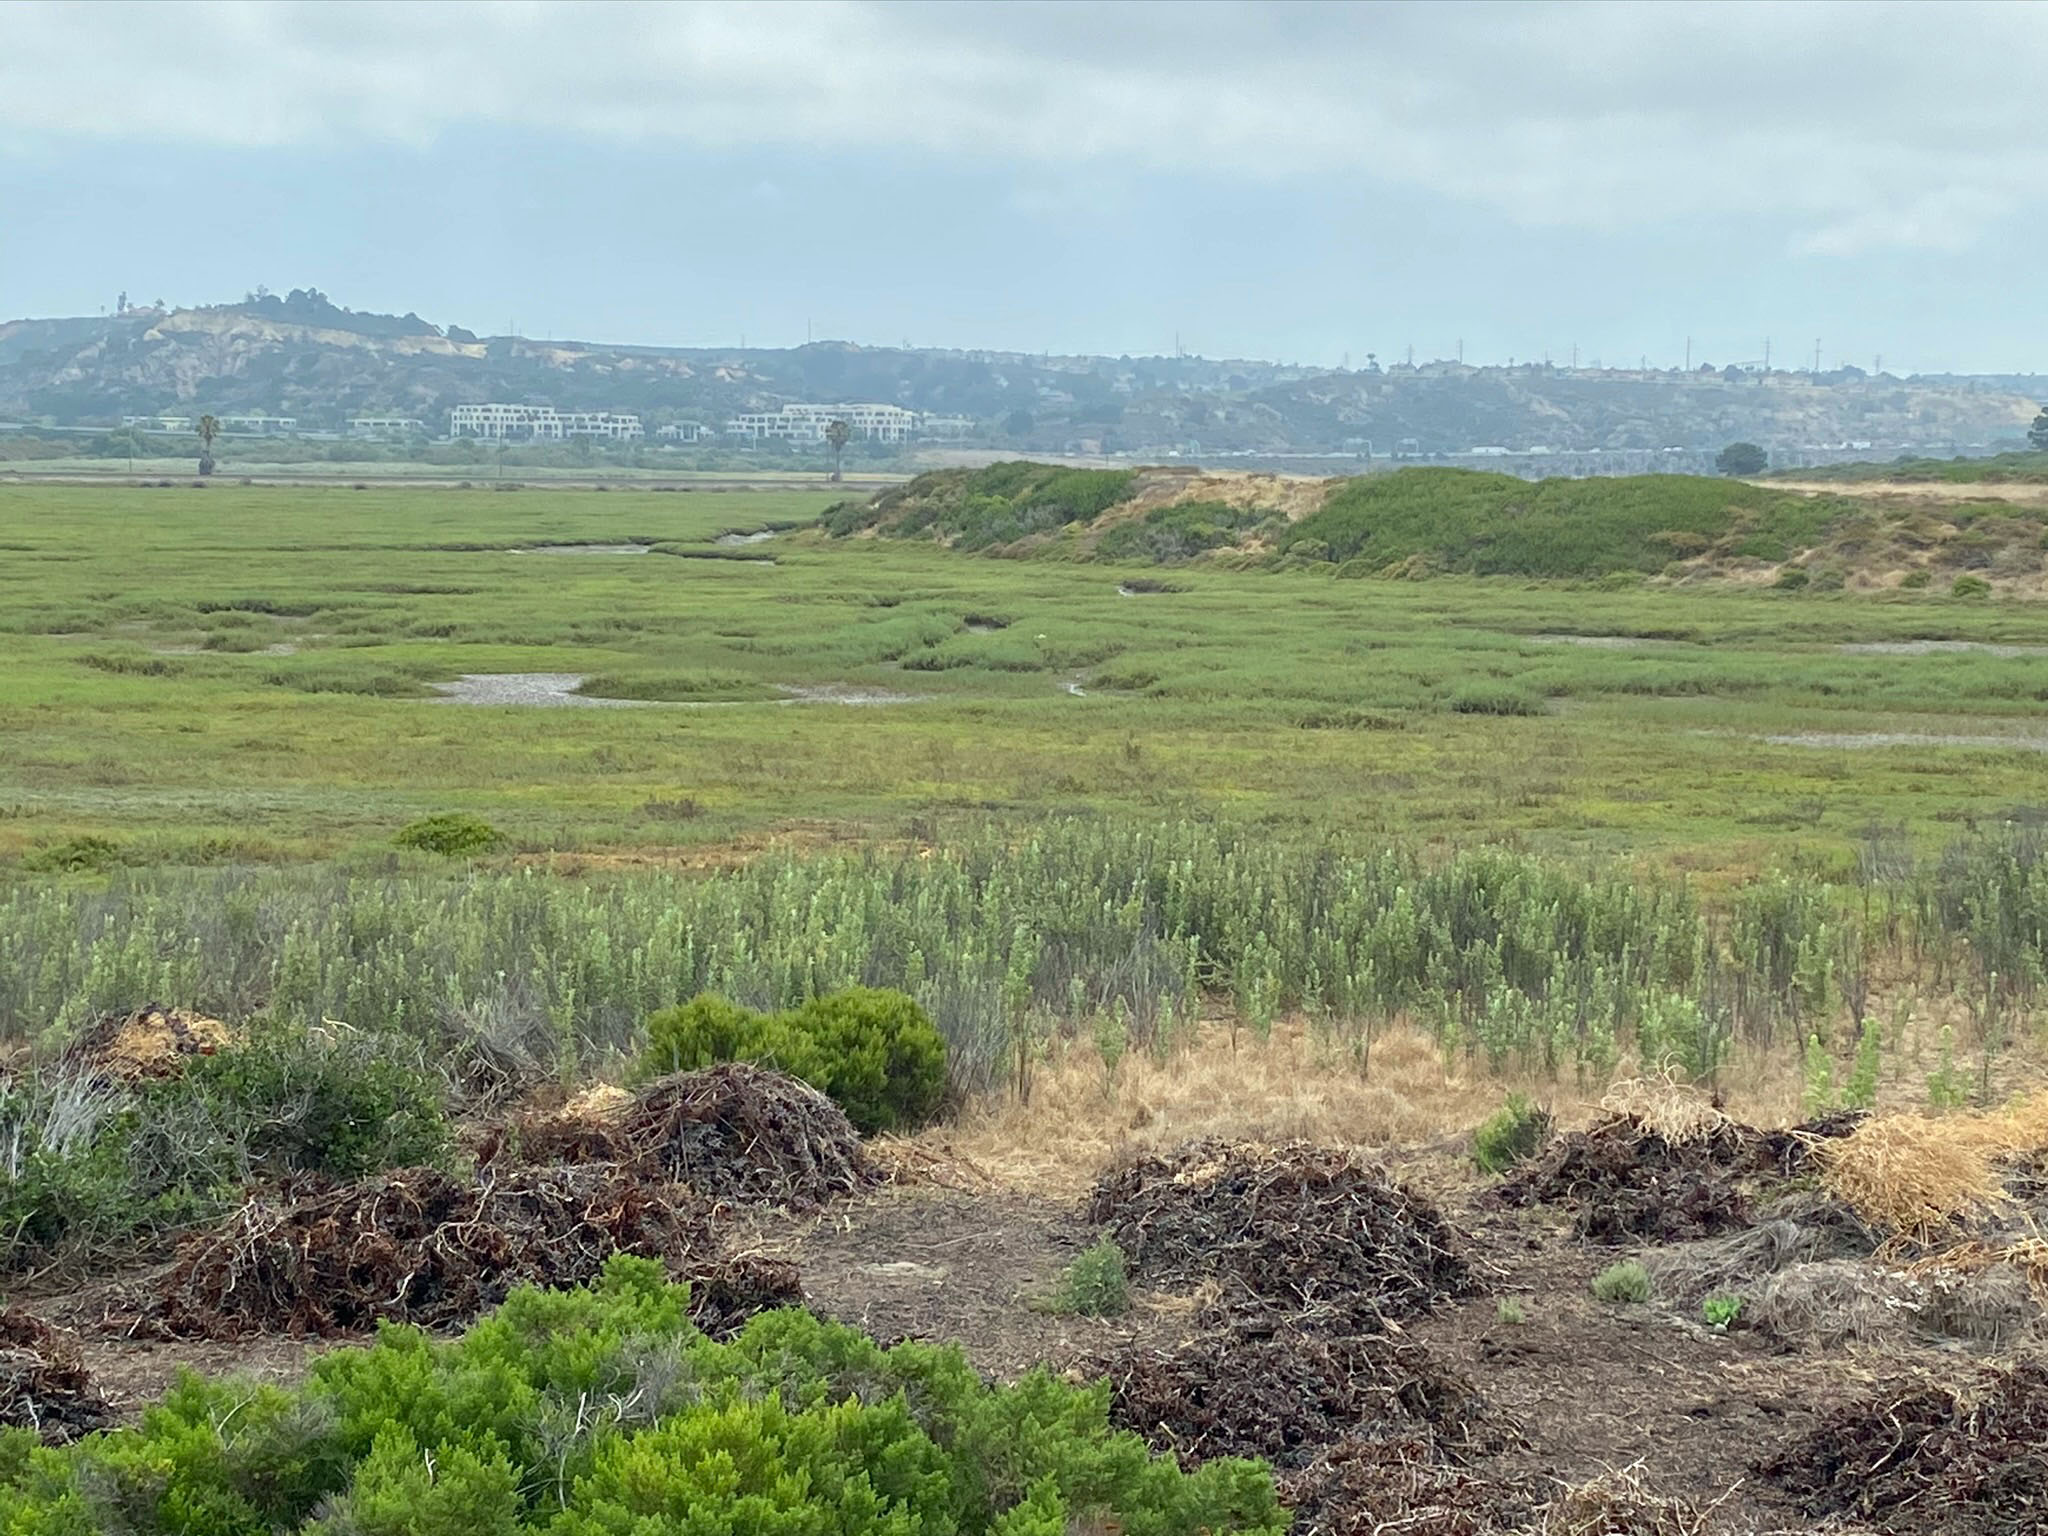
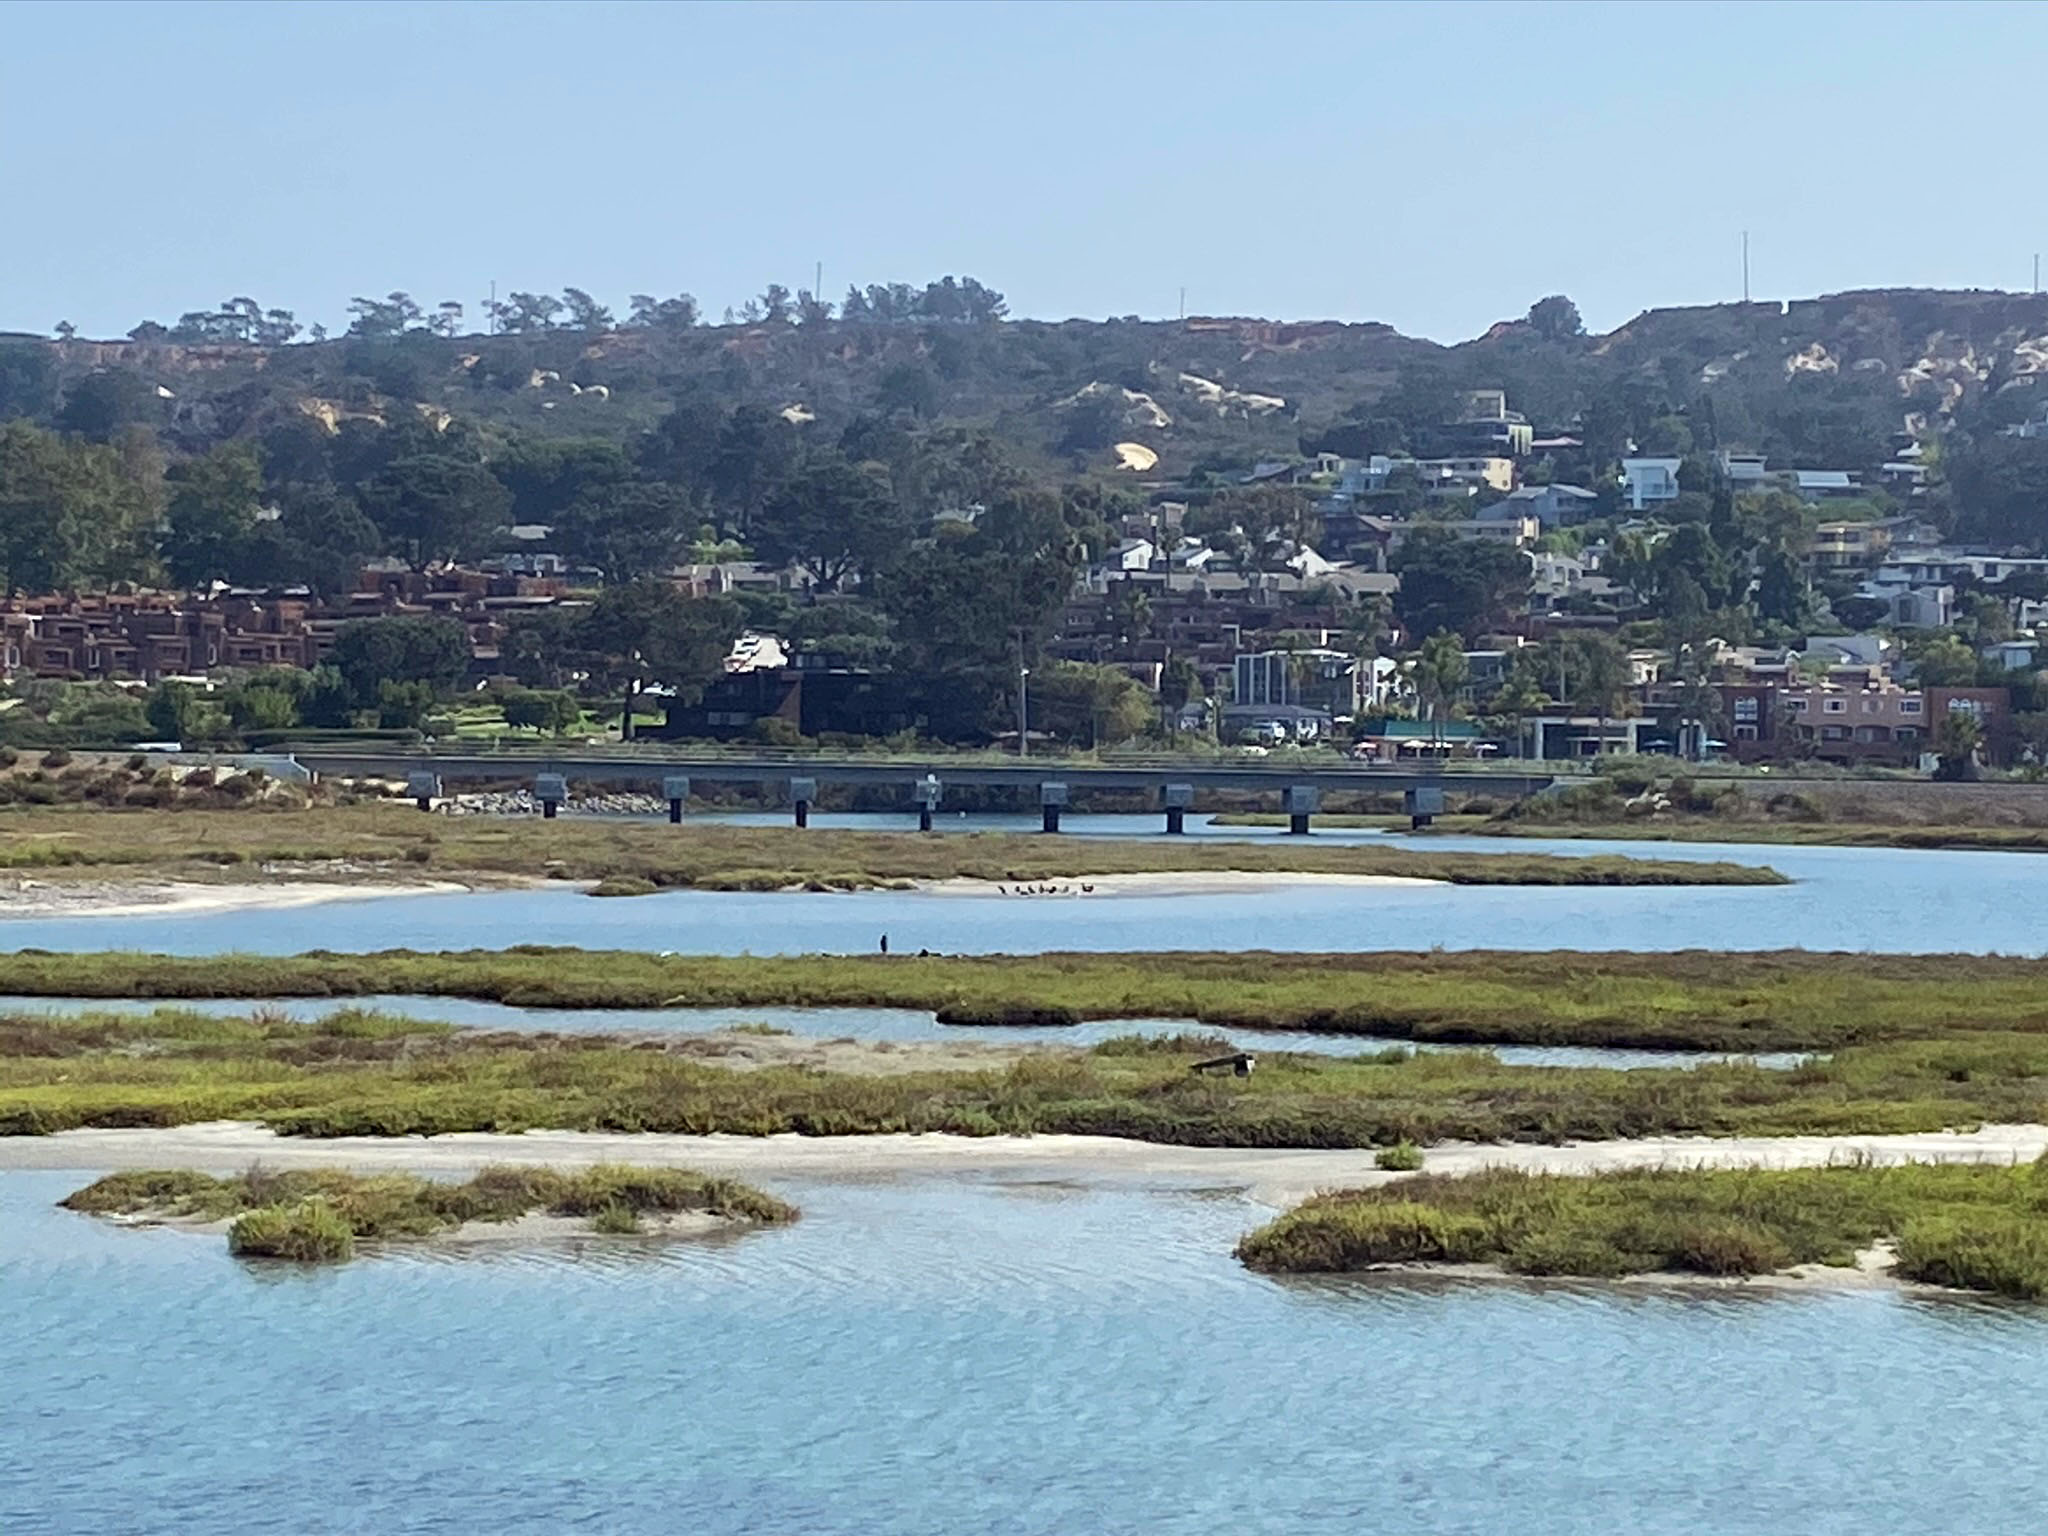
Peñasquitos LagoonFigure 144 shows a satellite view of Peñasquitos Lagoon. The lagoon consists of a mix of salt marsh, tidal mudflats, and tidal channels protected within the Los Peñasquitos Marsh Natural Preserve. The lagoon is host to a Coastal Strand plant community. Plants in the marsh are capable of enduring exposure to salt-laden water. Sunlight and daily tidal flushing provides nutrients to support algae, plankton, and plant growth that feeds and shelters crabs, fishes, clams, mussels, oysters, shrimps, snails, and worms that dwell in the salt marsh and tidal channels. These, in turn, feed shorebirds, waterfowl, rays, and other larger fishes (and until recent times, Indians and early settlers that harvested food from the lagoon). Figures 145, 146, and 147 show views of Peñasquitos Lagoon and surrounding upland mesas. The modern lagoon is mostly filled in with sediments but experiences daily flood tides and occasional storm surge flooding. As sea level continues to rise, the lagoon filling will keep pace. Figure 148 illustrates how lagoons gradually form and vanish as a result of sea level changes associated with the ice ages. In some locations, the surface of older lagoon deposits are preserved in step-like fashion along the margins of the modern lagoon (in similar character to the step-like nature of the marine terraces of the Bay Point Formation). Figure 149 illustrates a step-like feature that looks like a previous-cycle bay filling deposit (possibly modified with additional fill from the Torrey Pines Road grade construction). Step-like stream terraces also occur along upland stream and river valleys. The rise and fall of sea level changes the stream gradient so the streams go through cycles where they are either filling in and broadening their valleys, or down-carving—incising into their flood plains when their stream gradient increases. |
|


Human ImpactsThanks to the historic efforts of the founders of the Torrey Pines State Nature Preserve, the land within the park area is protected from further development. Unfortunately, human activity had significantly modified the landscape. San Diego came under Mexican rule for about 25 years starting in 1821. Mexican occupation ended with the conclusion of the war between Mexico and the United States in 1848 just prior to the California Gold Rush of 1849. The first census of "non-Indian" population of San Diego was 650 people in 1850. |
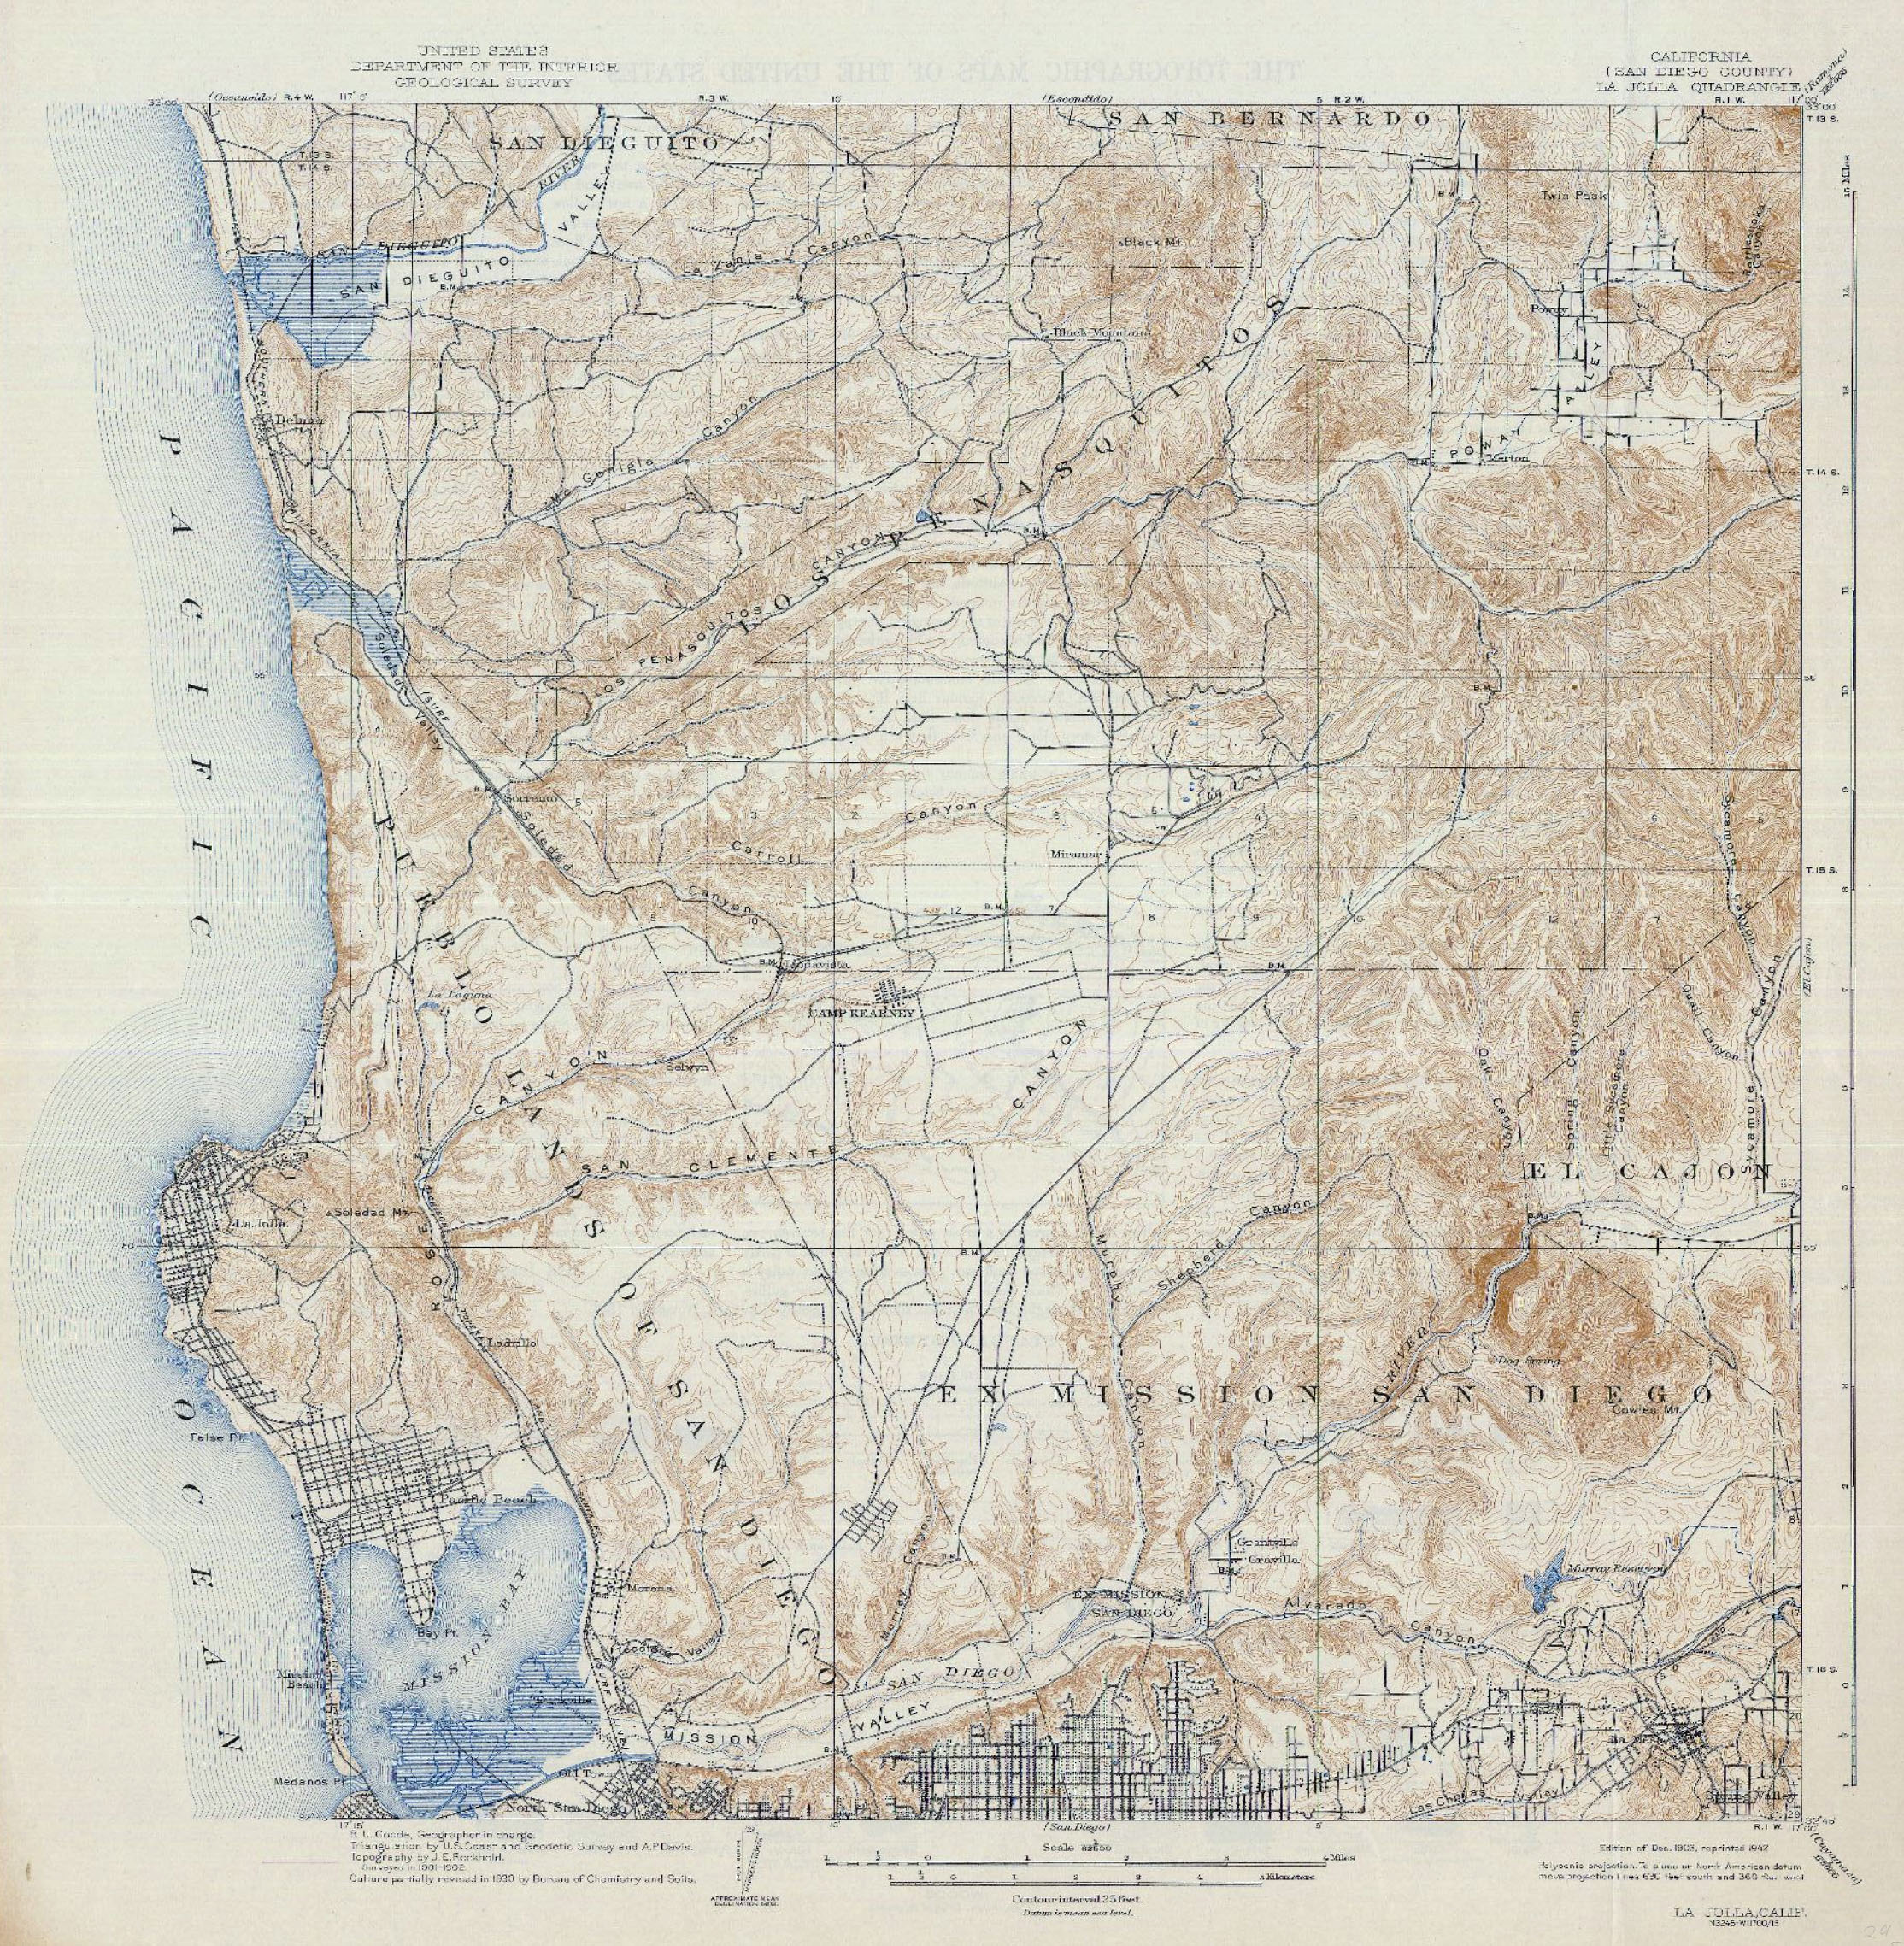 Fig. 156. The U.S. Geological Survey La Jolla 15 minute topographic map completed in 1903. Even in 1903, the Torrey Pine park area remained largely undeveloped.
 |
| Figure 156 shows the U.S. Geological Survey La Jolla 15 minute quadrangle topographic map completed in 1903. The map show that the Torrey Pines park area was still largely undeveloped. The map shows precursor of the Torrey Pines Park Road crossing the mesa area and then winding back along the south shore of the lagoon to merge with the El Camino Real along the east end of Peñasquitos Lagoon. Carmel Valley Road ran along the north shore of the lagoon connecting the El Camino Real with the small train depot town of Del Mar. The map also shows the original railroad causeway cutting across the east end of the lagoon. The 1903 map shows that there were two inlets cutting across the Torrey Pines Beach bay-mouth bar along the coast and that those channels had already been modified by dredging. After World War 1, the population of the San Diego region began to increase significantly. The first major construction project to harm the natural setting of of the park area was the construction of the Santa Fe Railroad causeway and bridge. It was first construction in 1925 (with new a bridge and causeway modifications since then, Figure 157). This lead to the next large construction project-the construction of the Pacific Coast Highway. The Torrey Pines Park Road was the original route of the Pacific Coast Highway ((the Park Road now begins at the park entrance, Figure 158). Construction of the new route of the Pacific Coast Highway began in the early 1930s. This lead to the excavation of the what is now Torrey Pines Road causeway and bridge (Figures 159 and 160) and the road cuts for the Torrey Pines Road grade. A new causeway for the railroad line cutting across Peñasquitos Lagoon The designation of the Coast Highway in the Torrey Pines area ended with the largest construction project, the construction of Interstate 5. Construction of I-5 began in 1947 and was first completed in 1967, but construction never really ended. If you look at the current satellite view of the complex highway system between the intersections of I-5, I-805, and the Ted William Freeway (CA 56) you can count as many as 30 lanes for traffic! It's hard to envision what the future will hold. The San Diego population will probably eventually stabilize, the carbon-based fuel economy will diminish. However, sea level will continue to rise, sea cliffs and beaches will erode, and the climate will continue to change. The need for conservation efforts will only increase. |
|

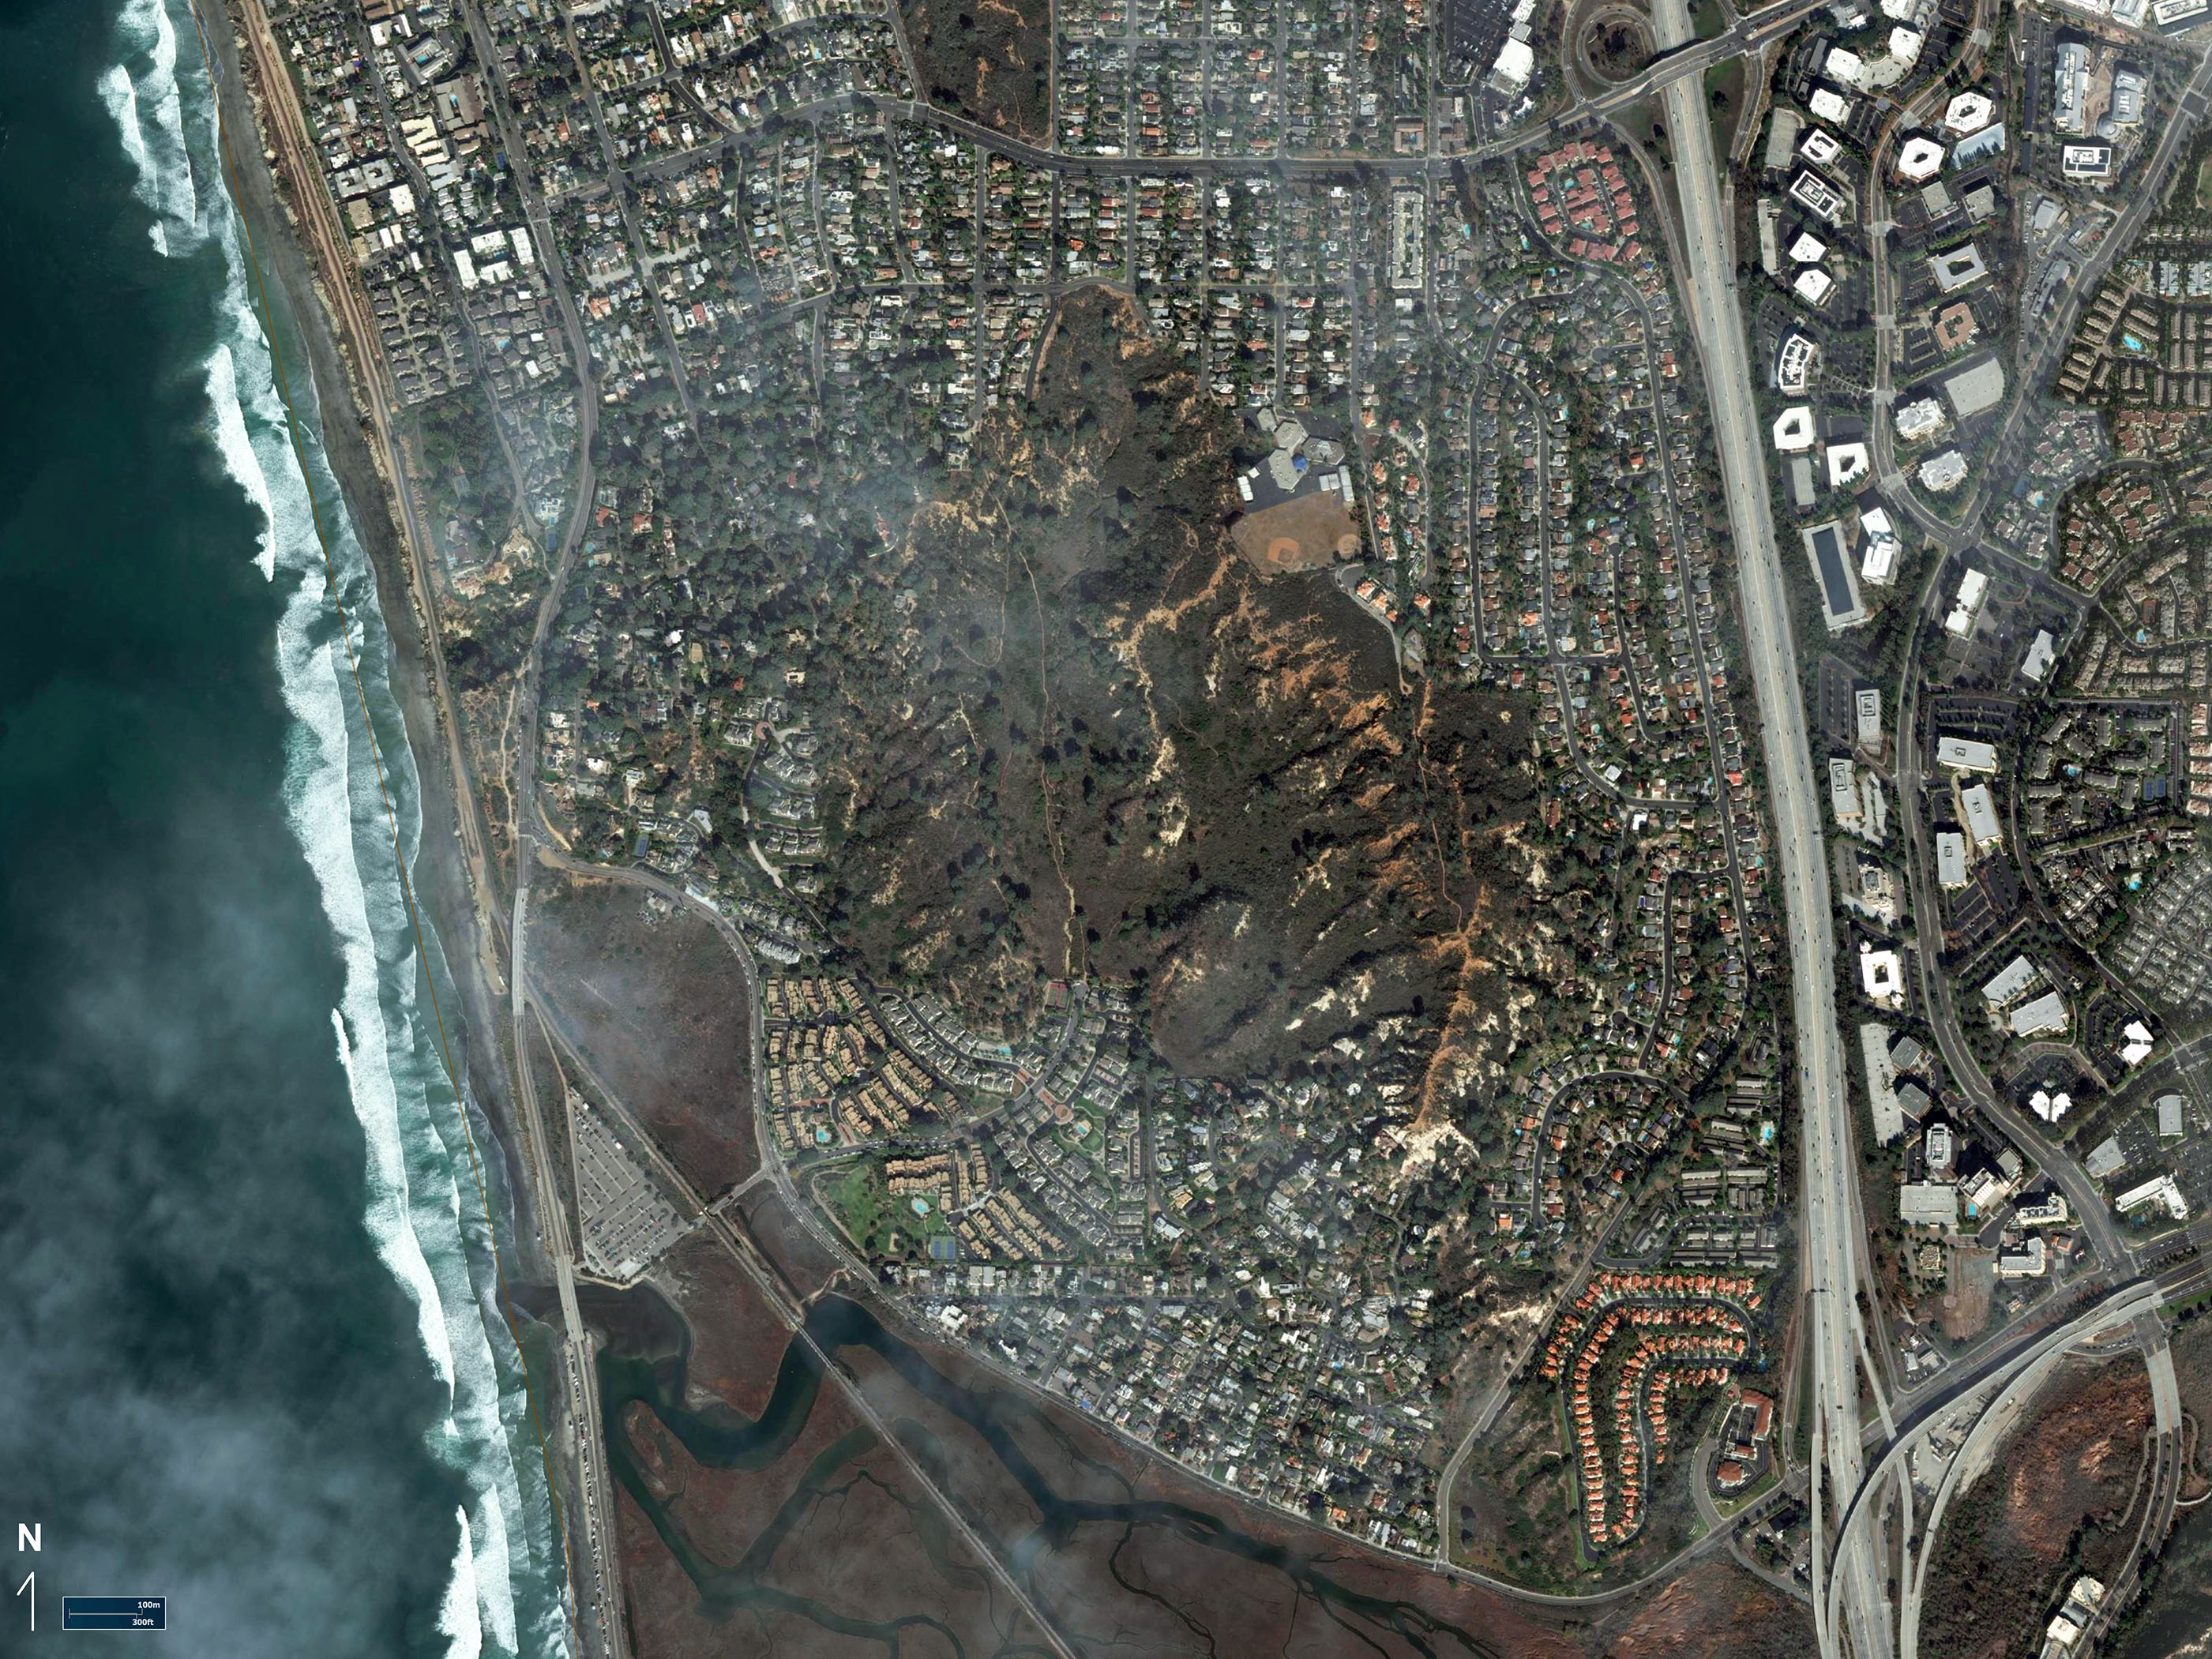
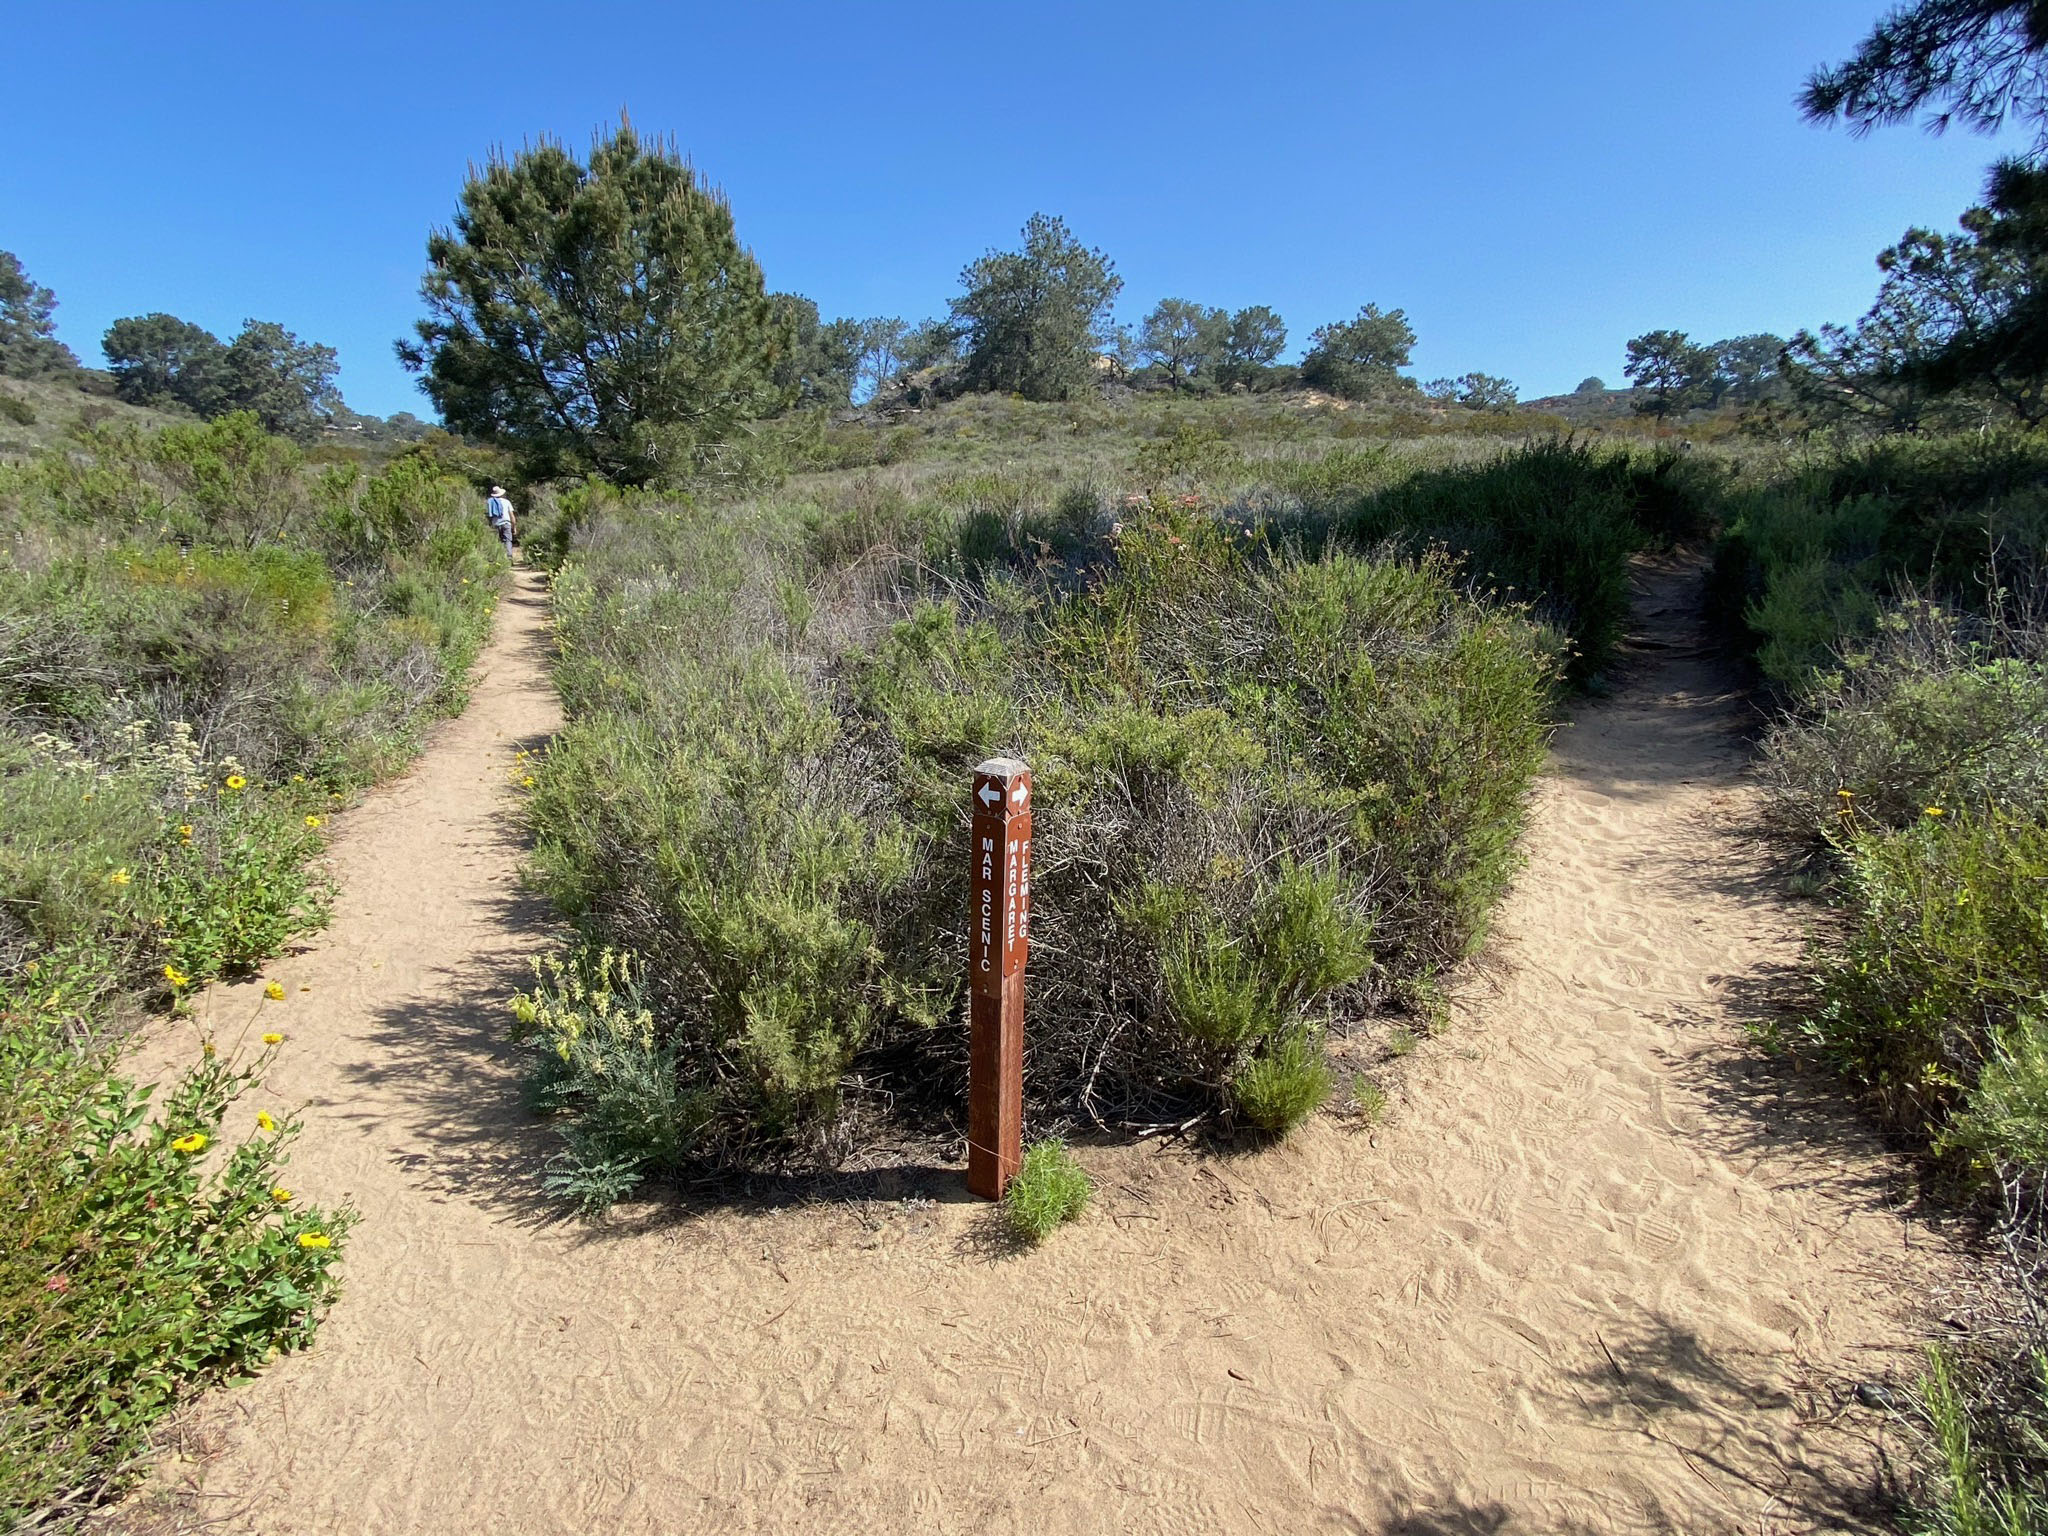
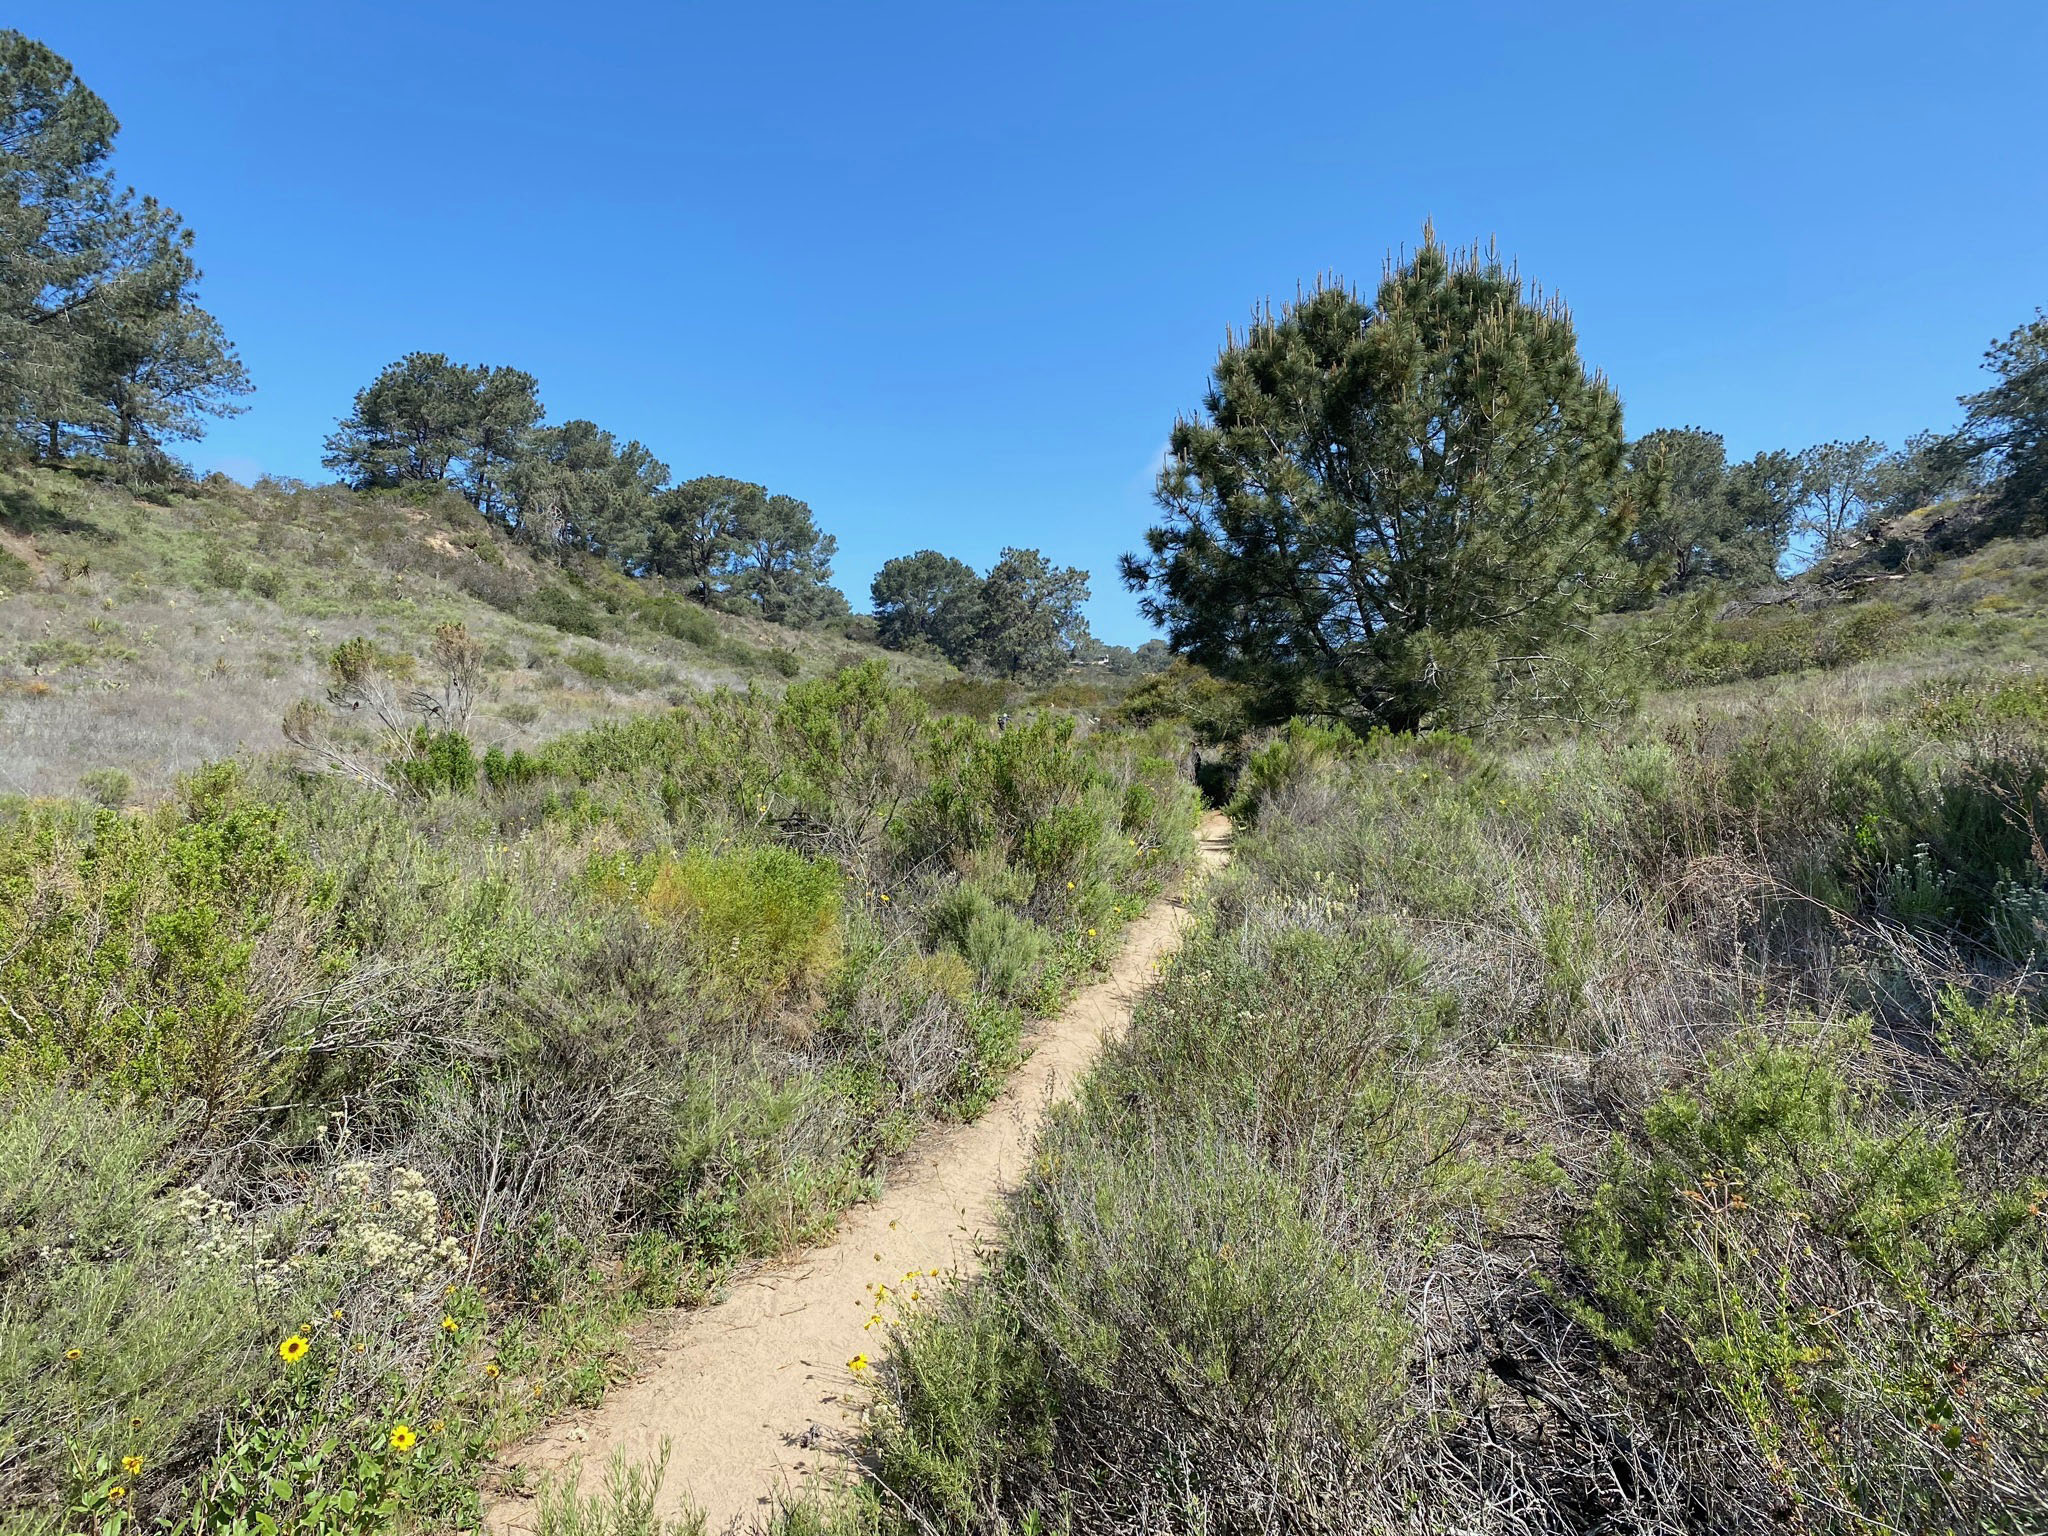
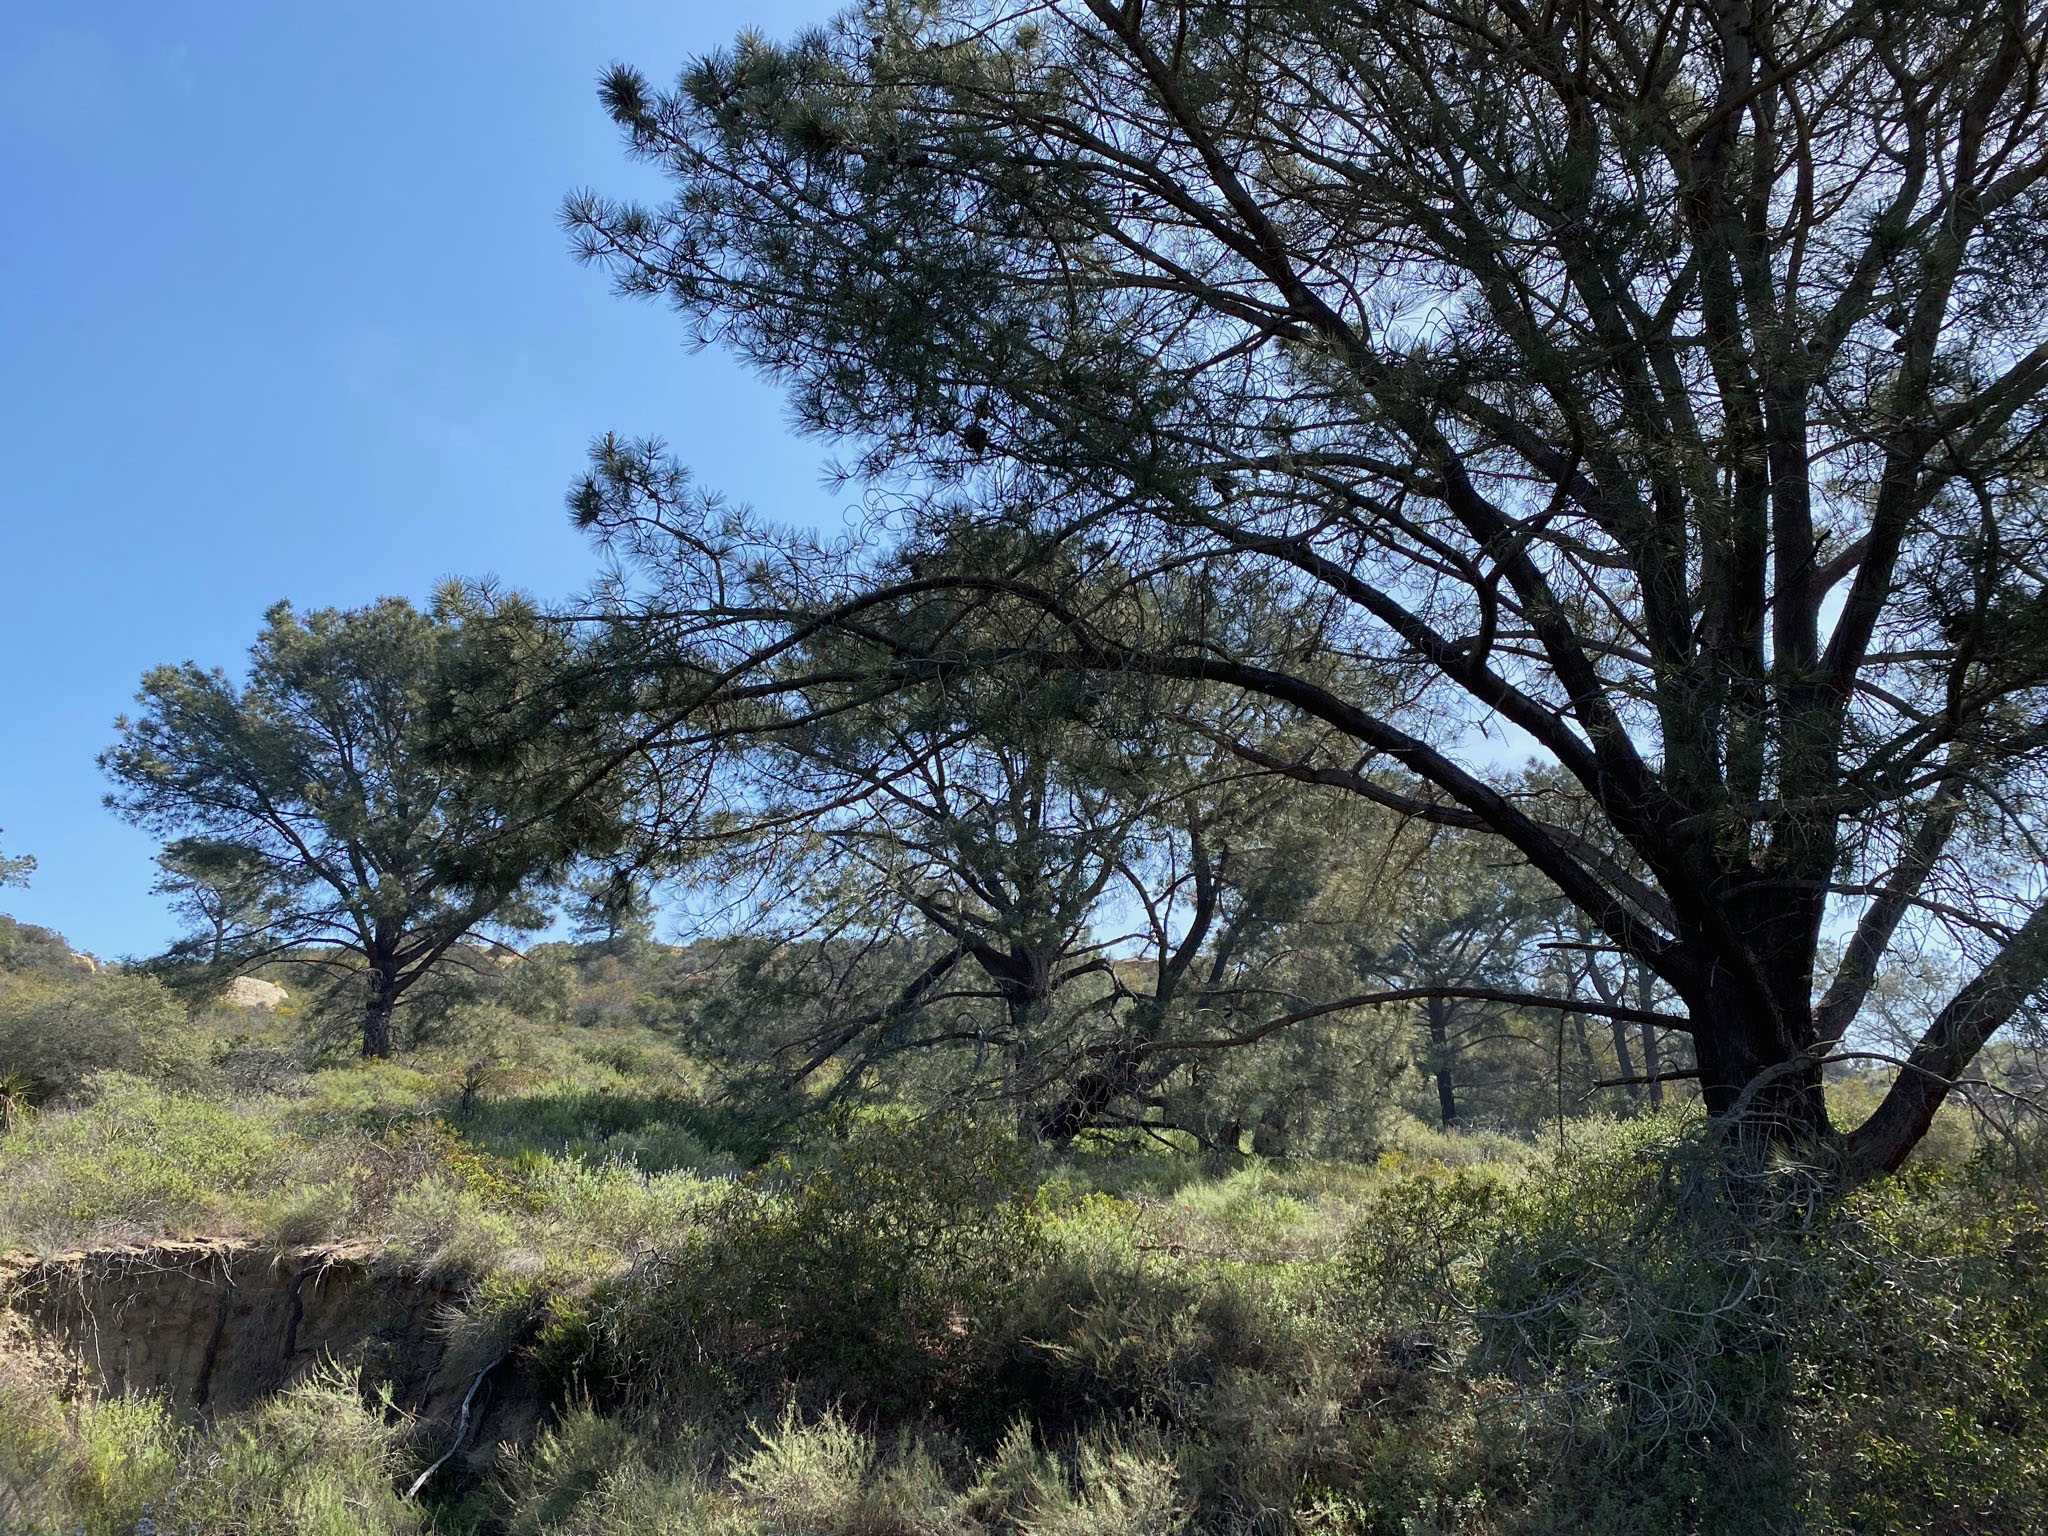
Torrey Pines ExtensionThe Torrey Pines Extension is an isolated northern part of the Torrey Pines State Nature Reserve. Figure 161 is a map of the Extension. Figure 162 is a satellite image of the same area in Figure 161. The Extension is located along the southern part of the mesa of the Del Mar Heights Community. Several hiking trails provide access to this scenic less-traveled part of the Torrey Pines State Nature Reserve.The Torrey Pine Extension hiking trails are accessible from trailheads in several locations around the reserve. An easy place to park is the vicinity of Del Mar Heights Elementary School on Mira Montana Drive. Both the Red Ridge Trail and Margaret Fleming Nature Trail start at the end of Mira Montana Drive. Another trailhead is at the north end of Del Mar Scenic Parkway that connects to the Margaret Fleming Nature Trail and the Mar Scenic Trail. The landscape consists of rolling hills along an south- and west-facing escarpment with ridges that extend southward into a landscape dominated by a mixed coastal sagebrush and coastal oak plant community that is also host to small groves and isolated Torrey Pines (the endangered pine found in the area)(Figures 163 to 168). |
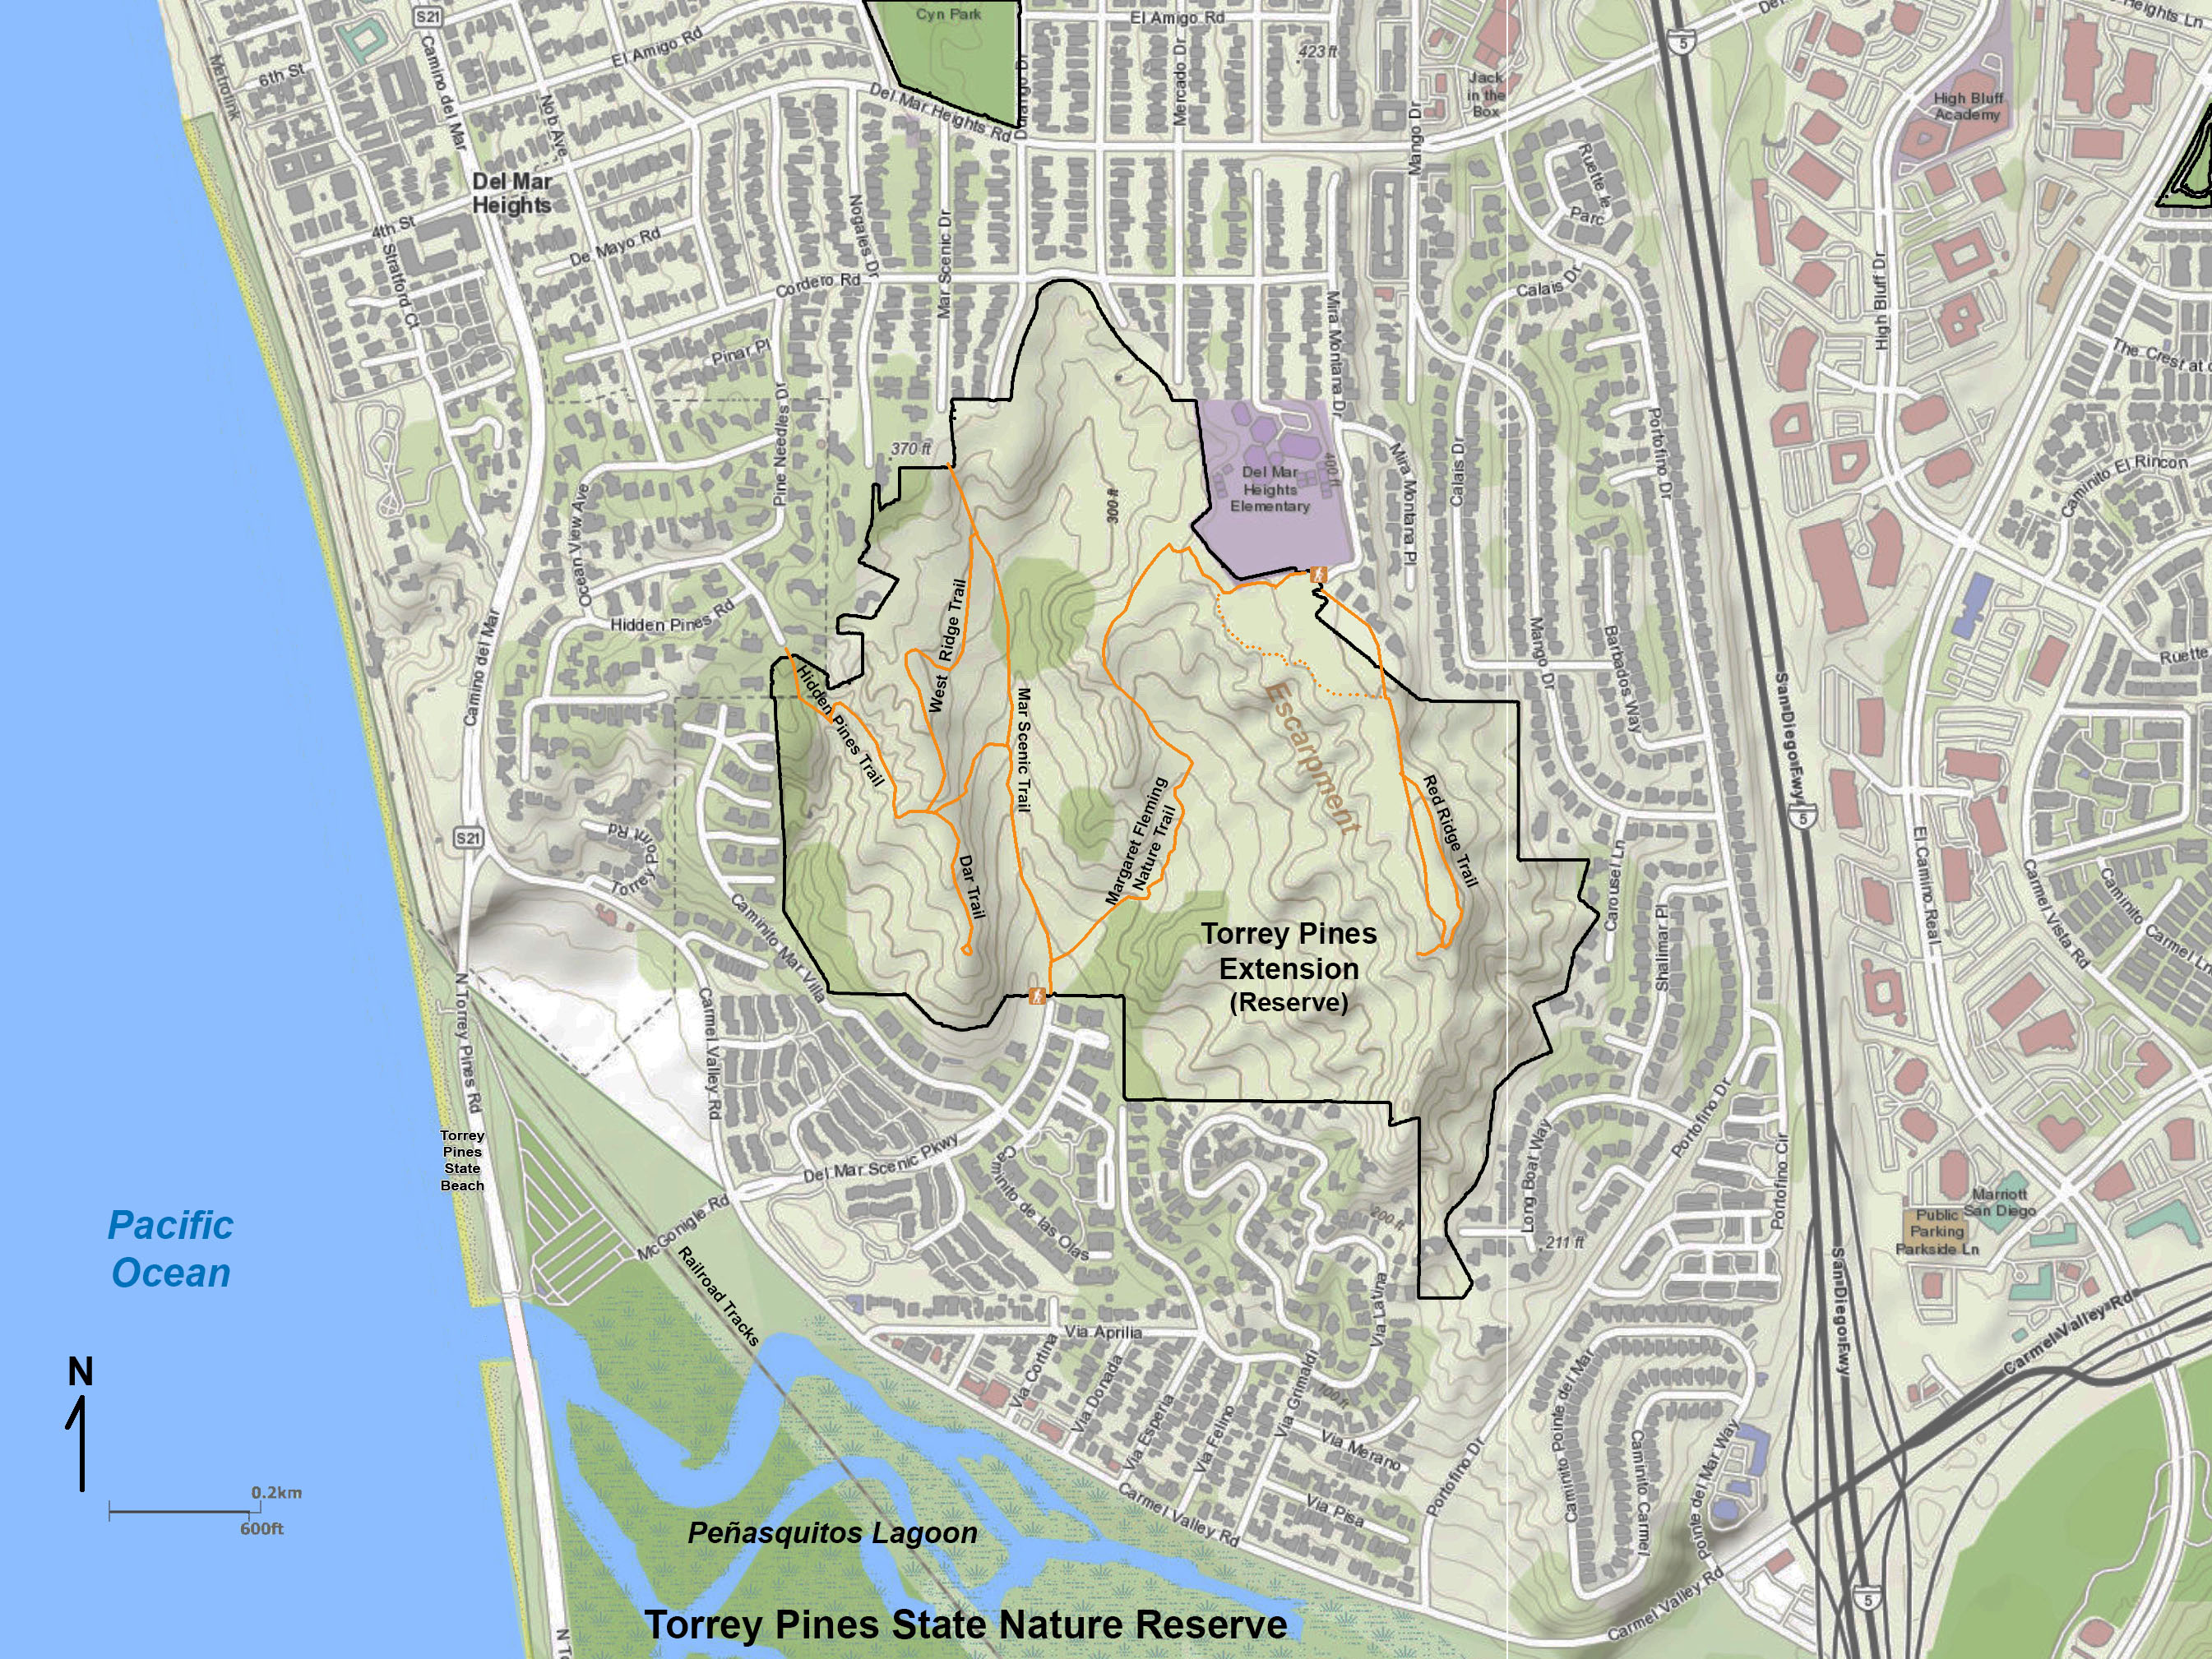 Fig. 161. Map of the Torrey Pines Extension, the northern part of the Torrey Pines State Nature Reserve. |
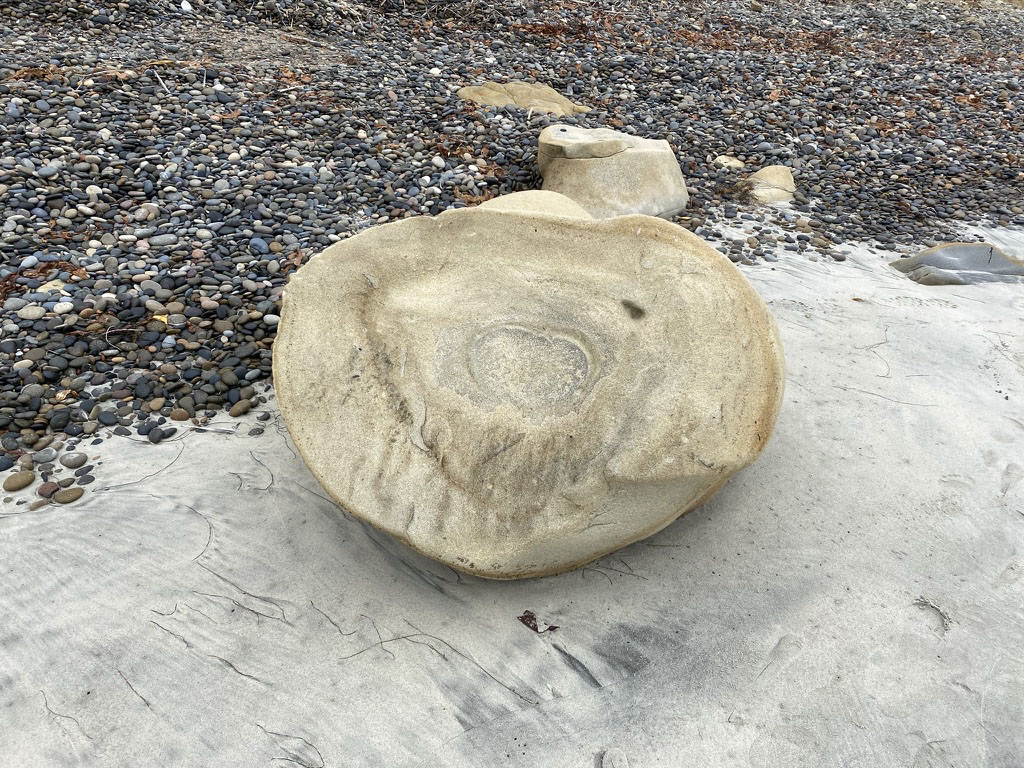
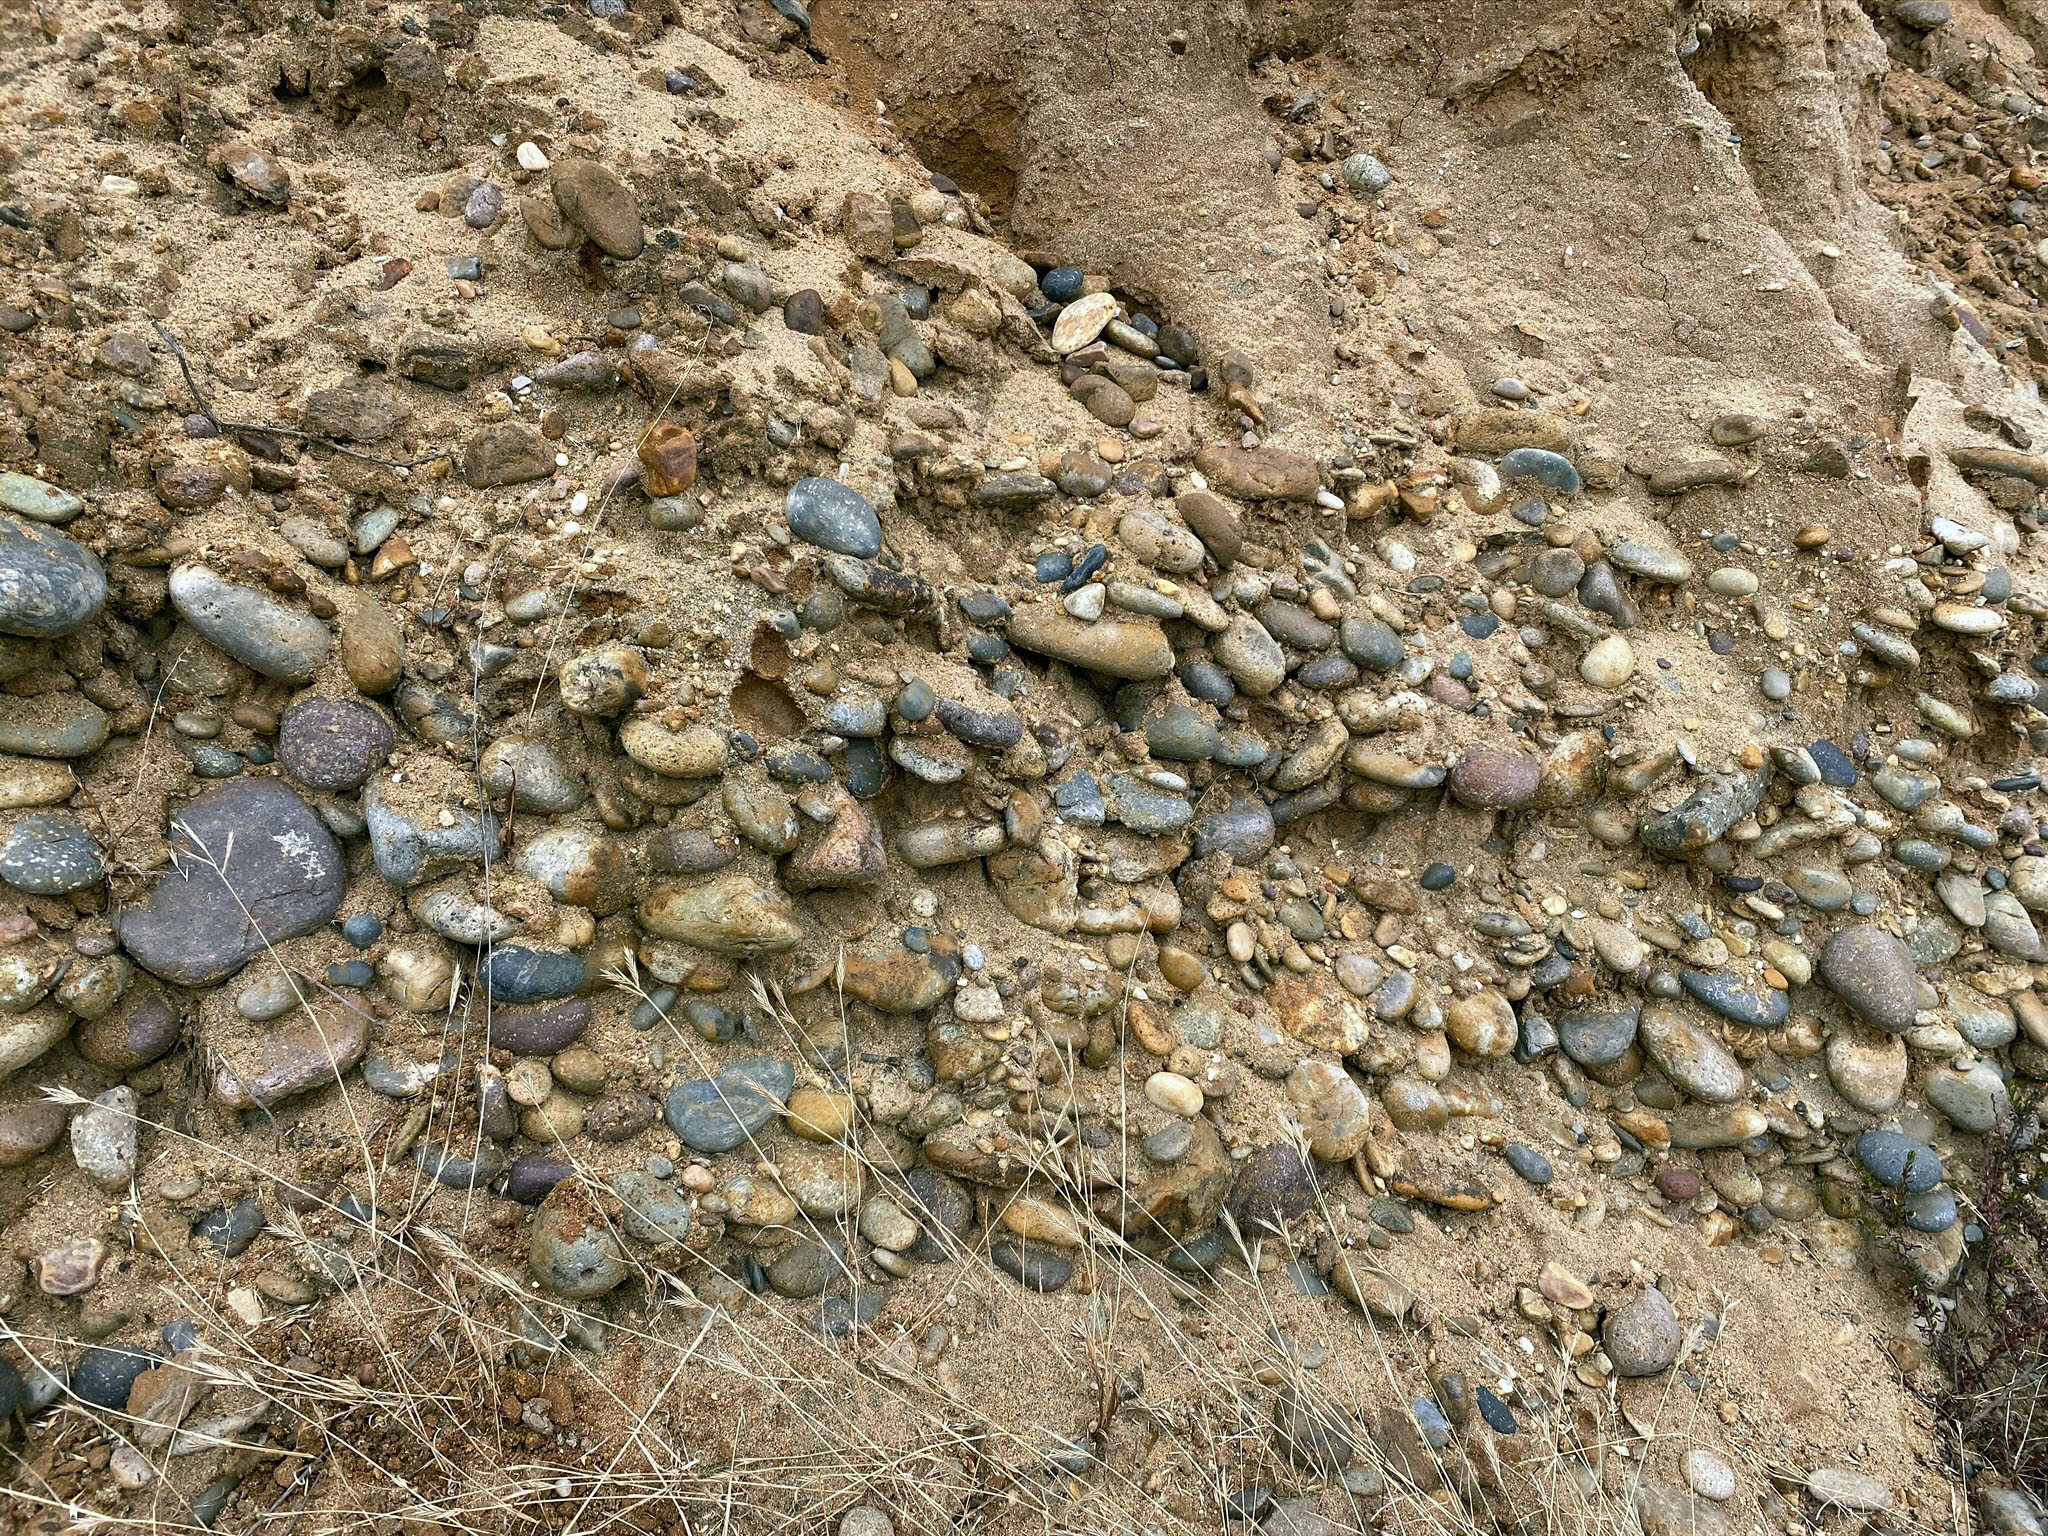
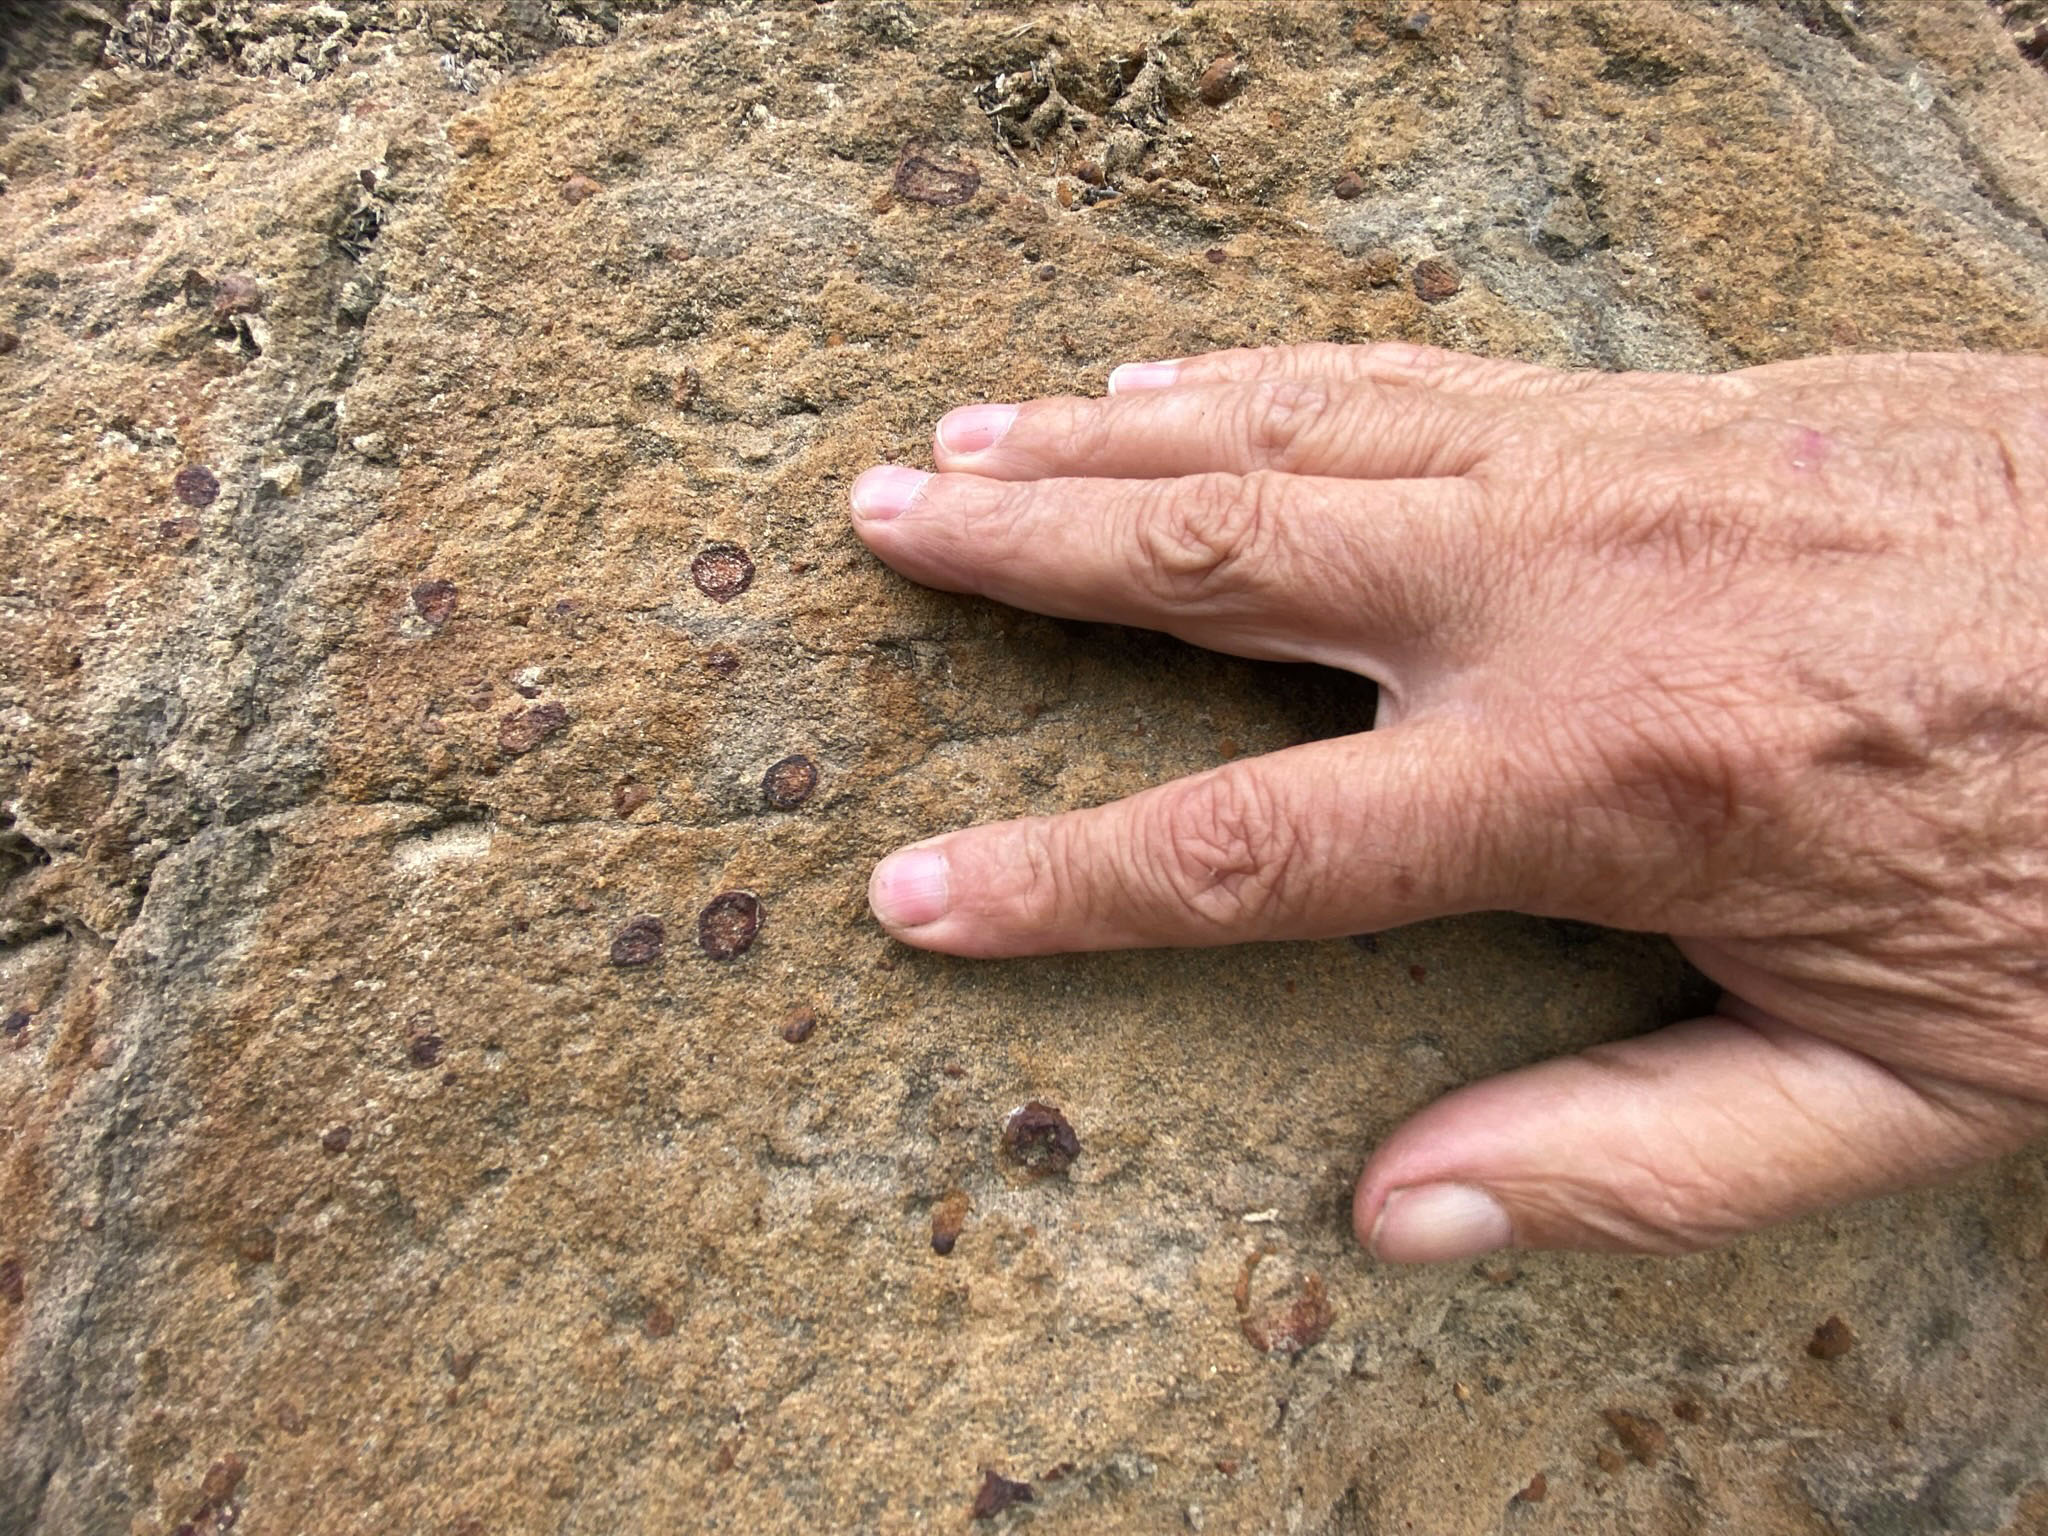
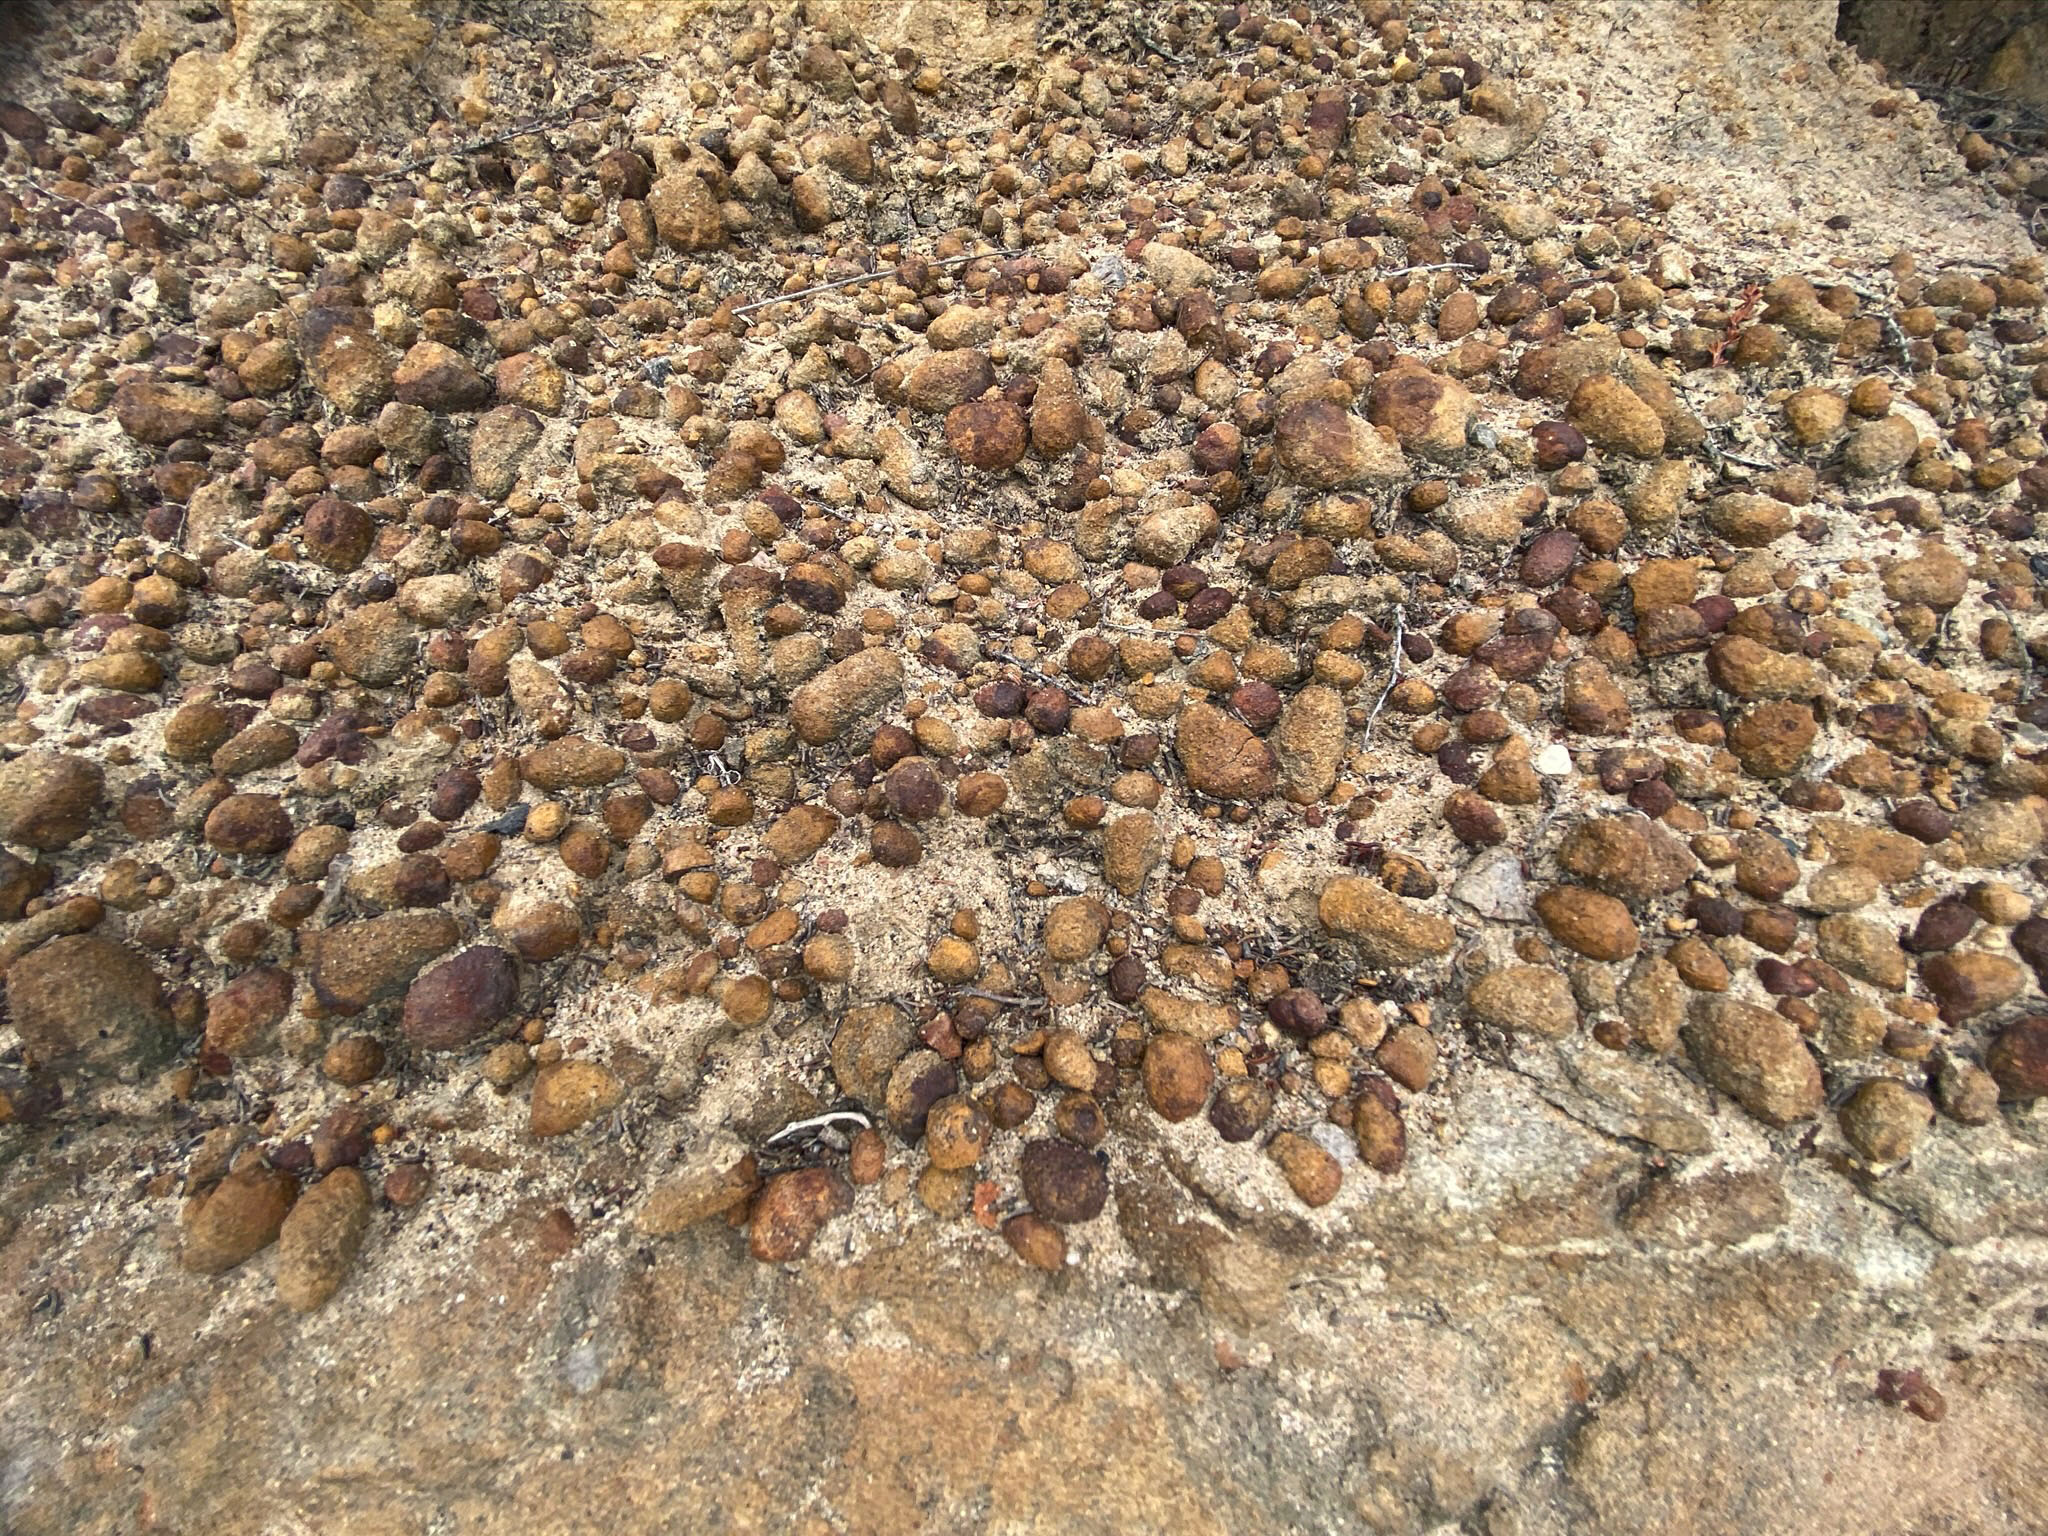
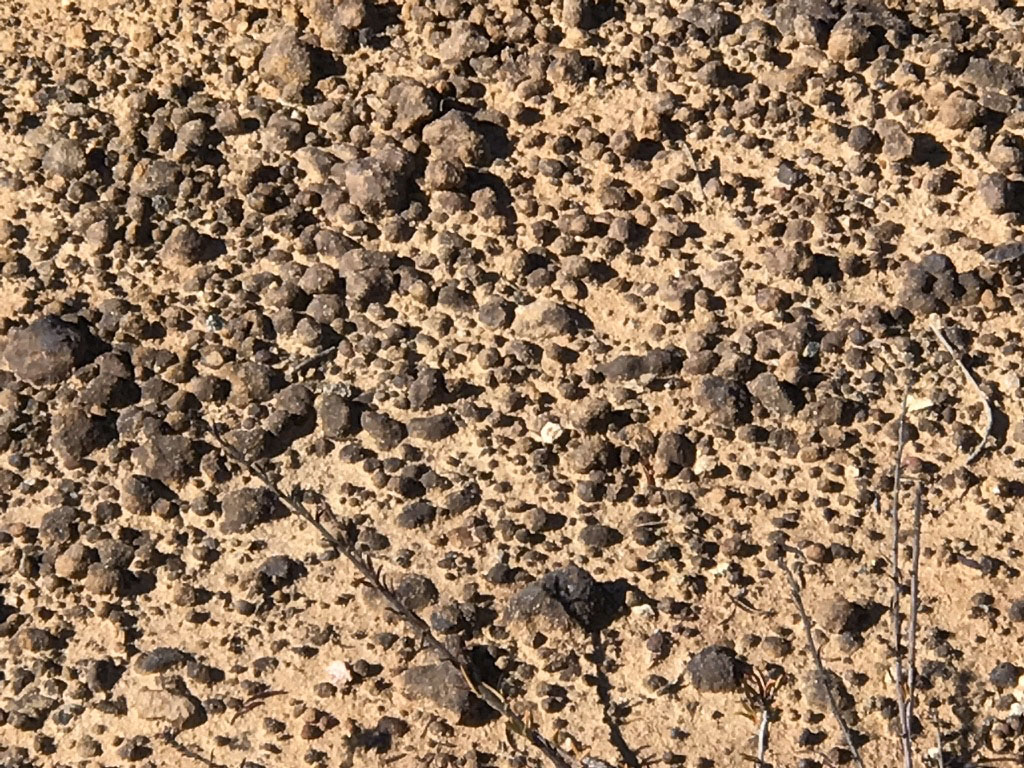
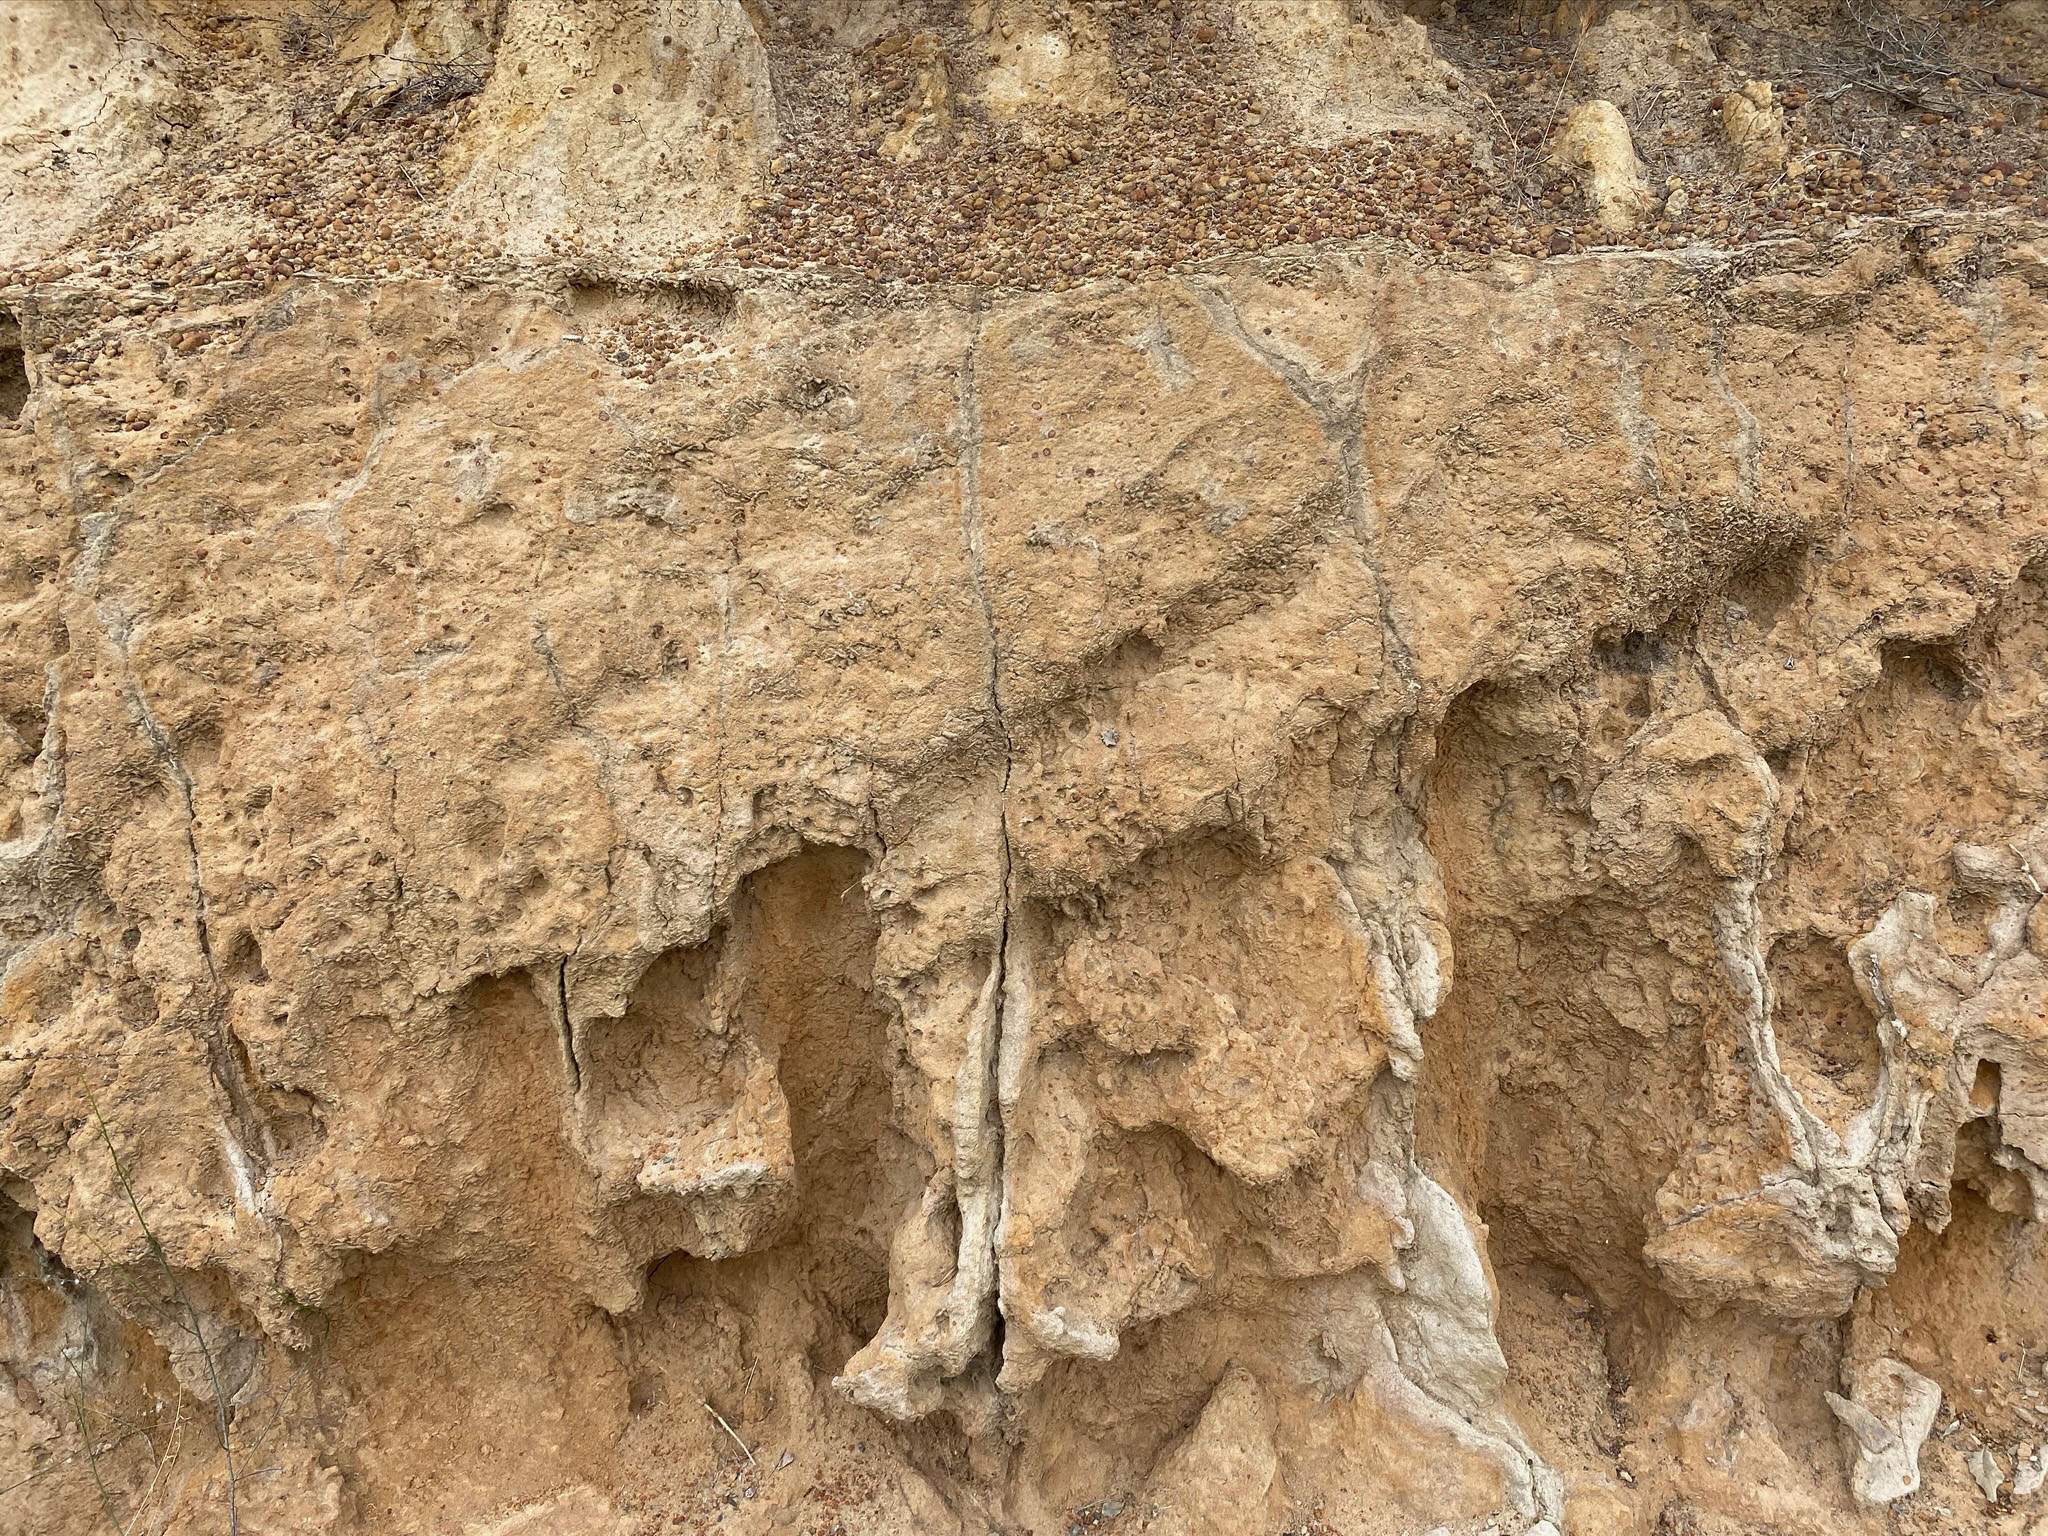
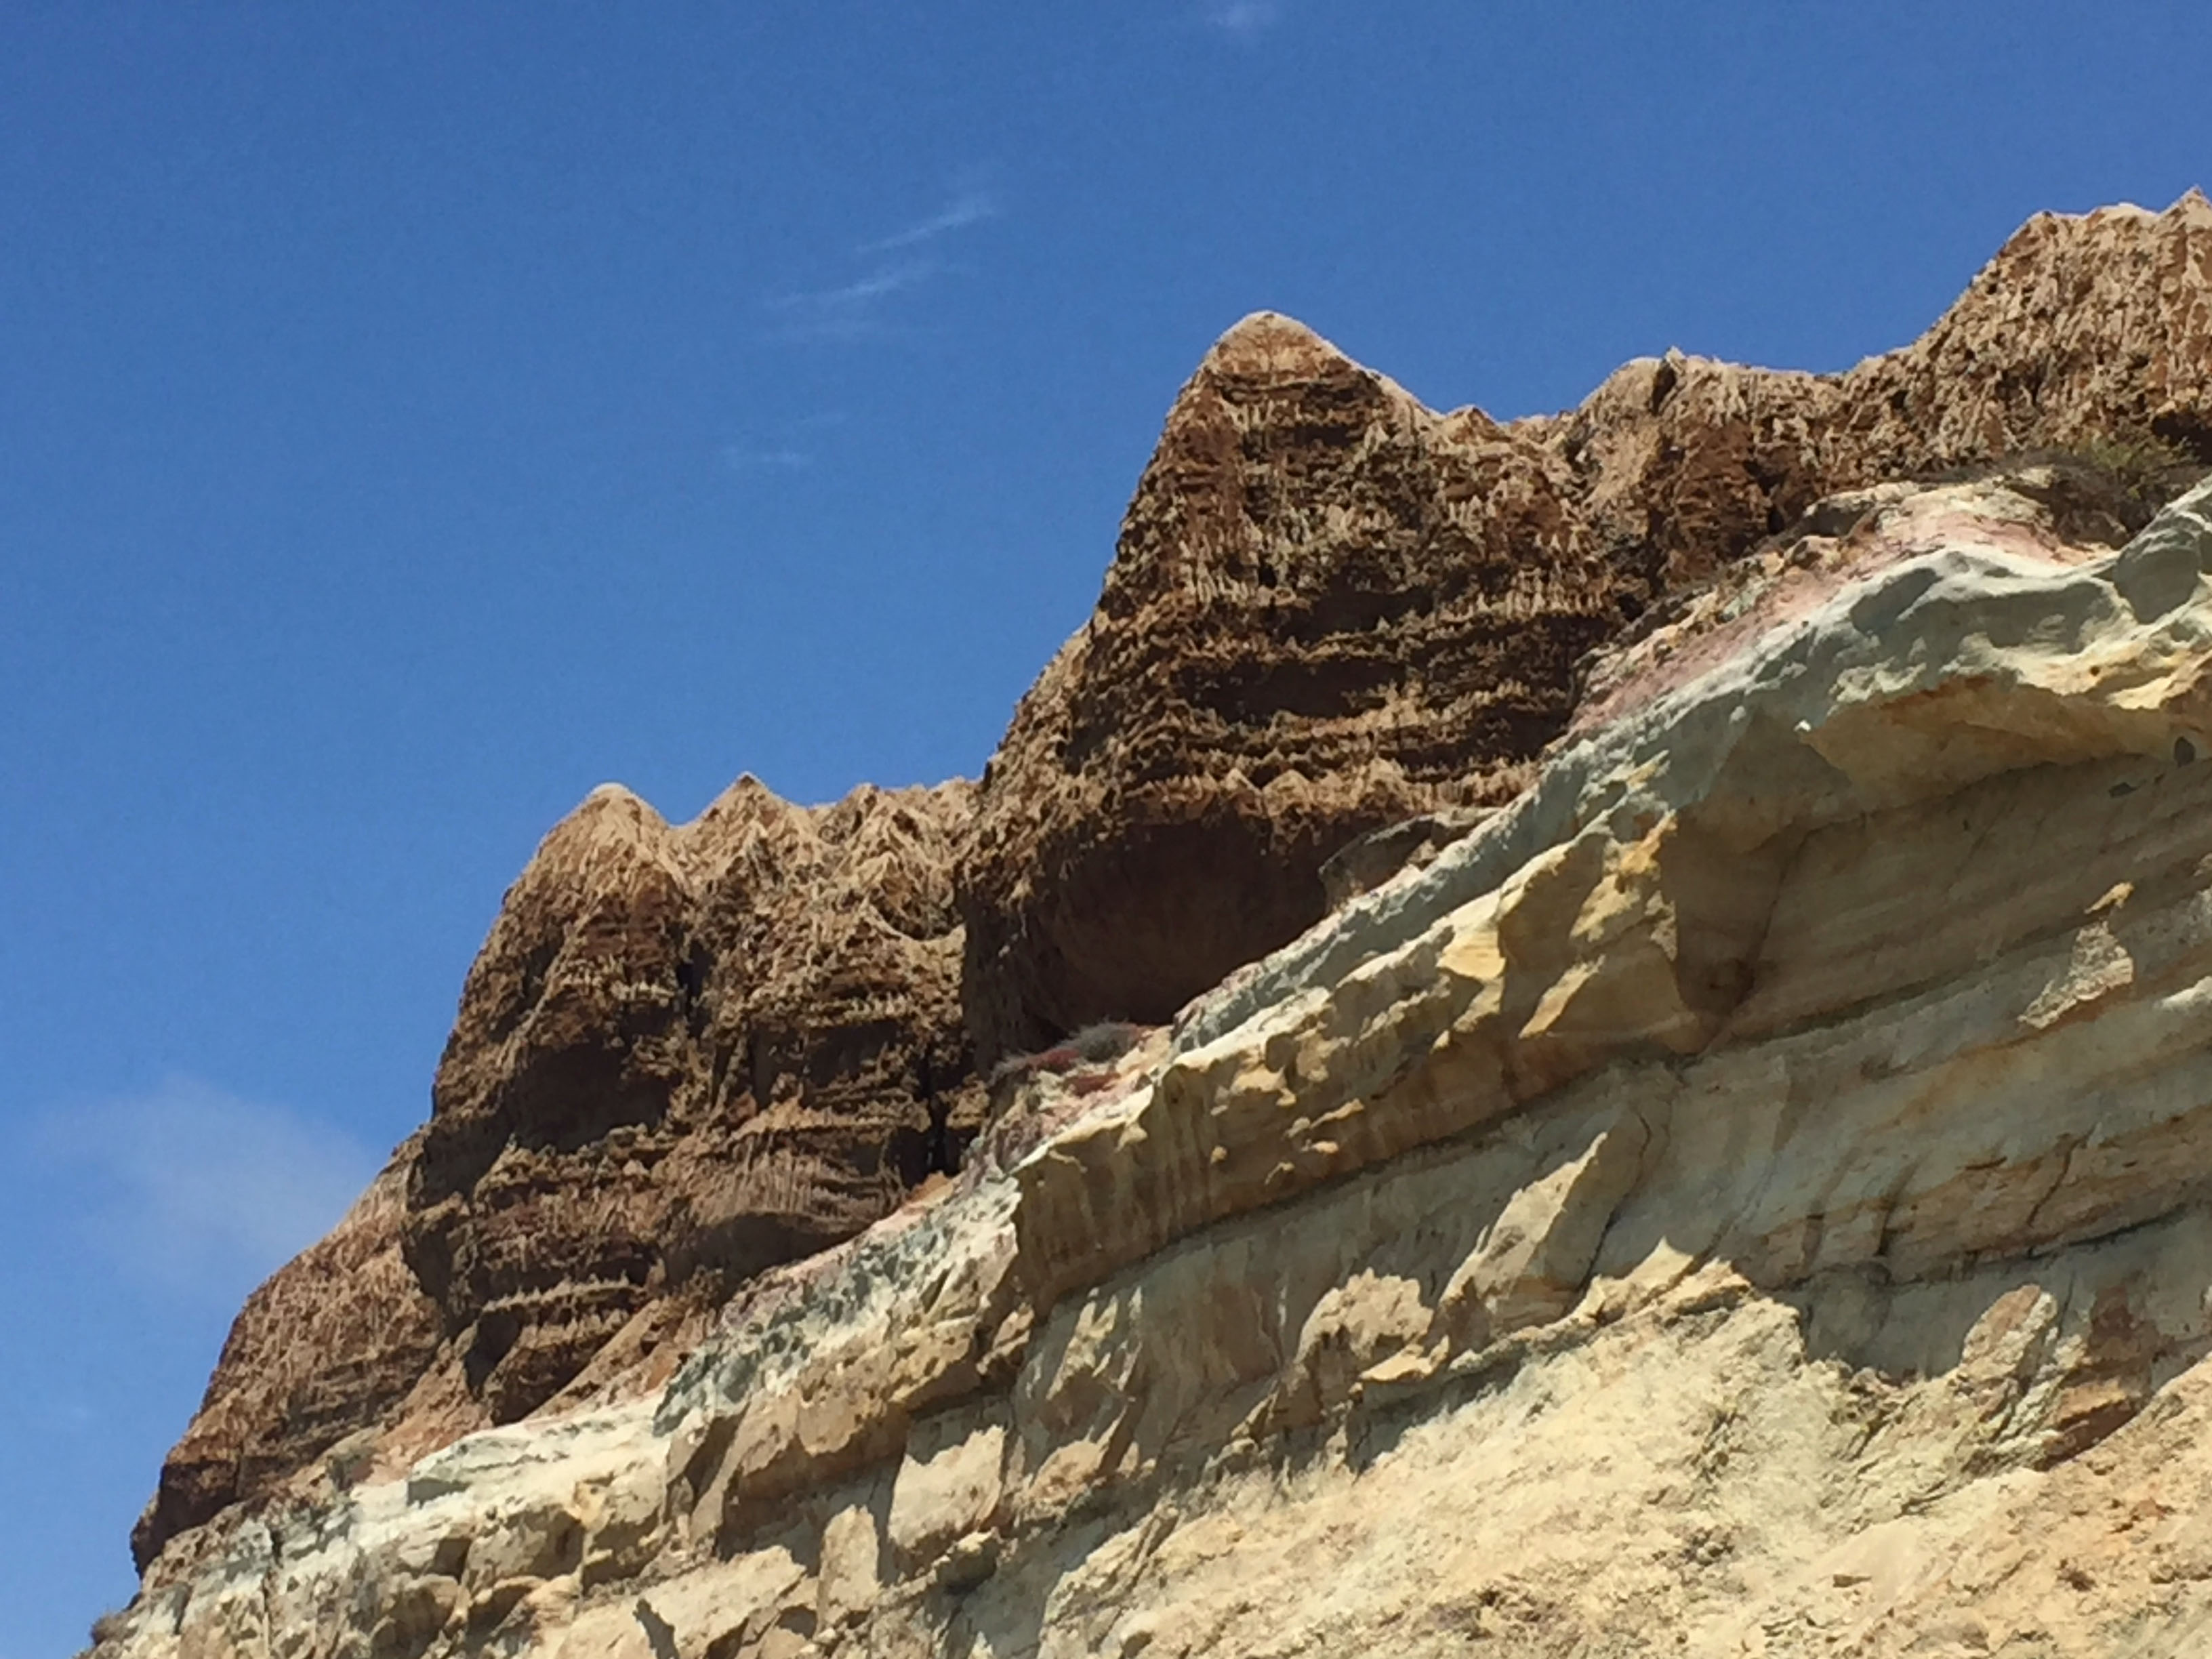
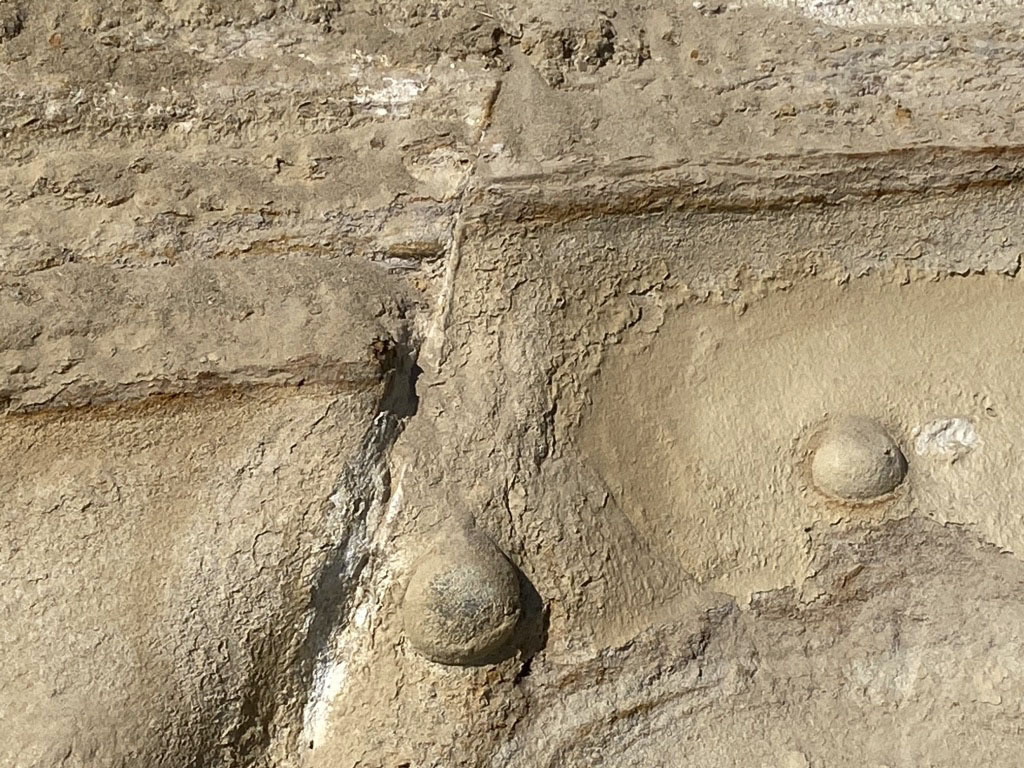
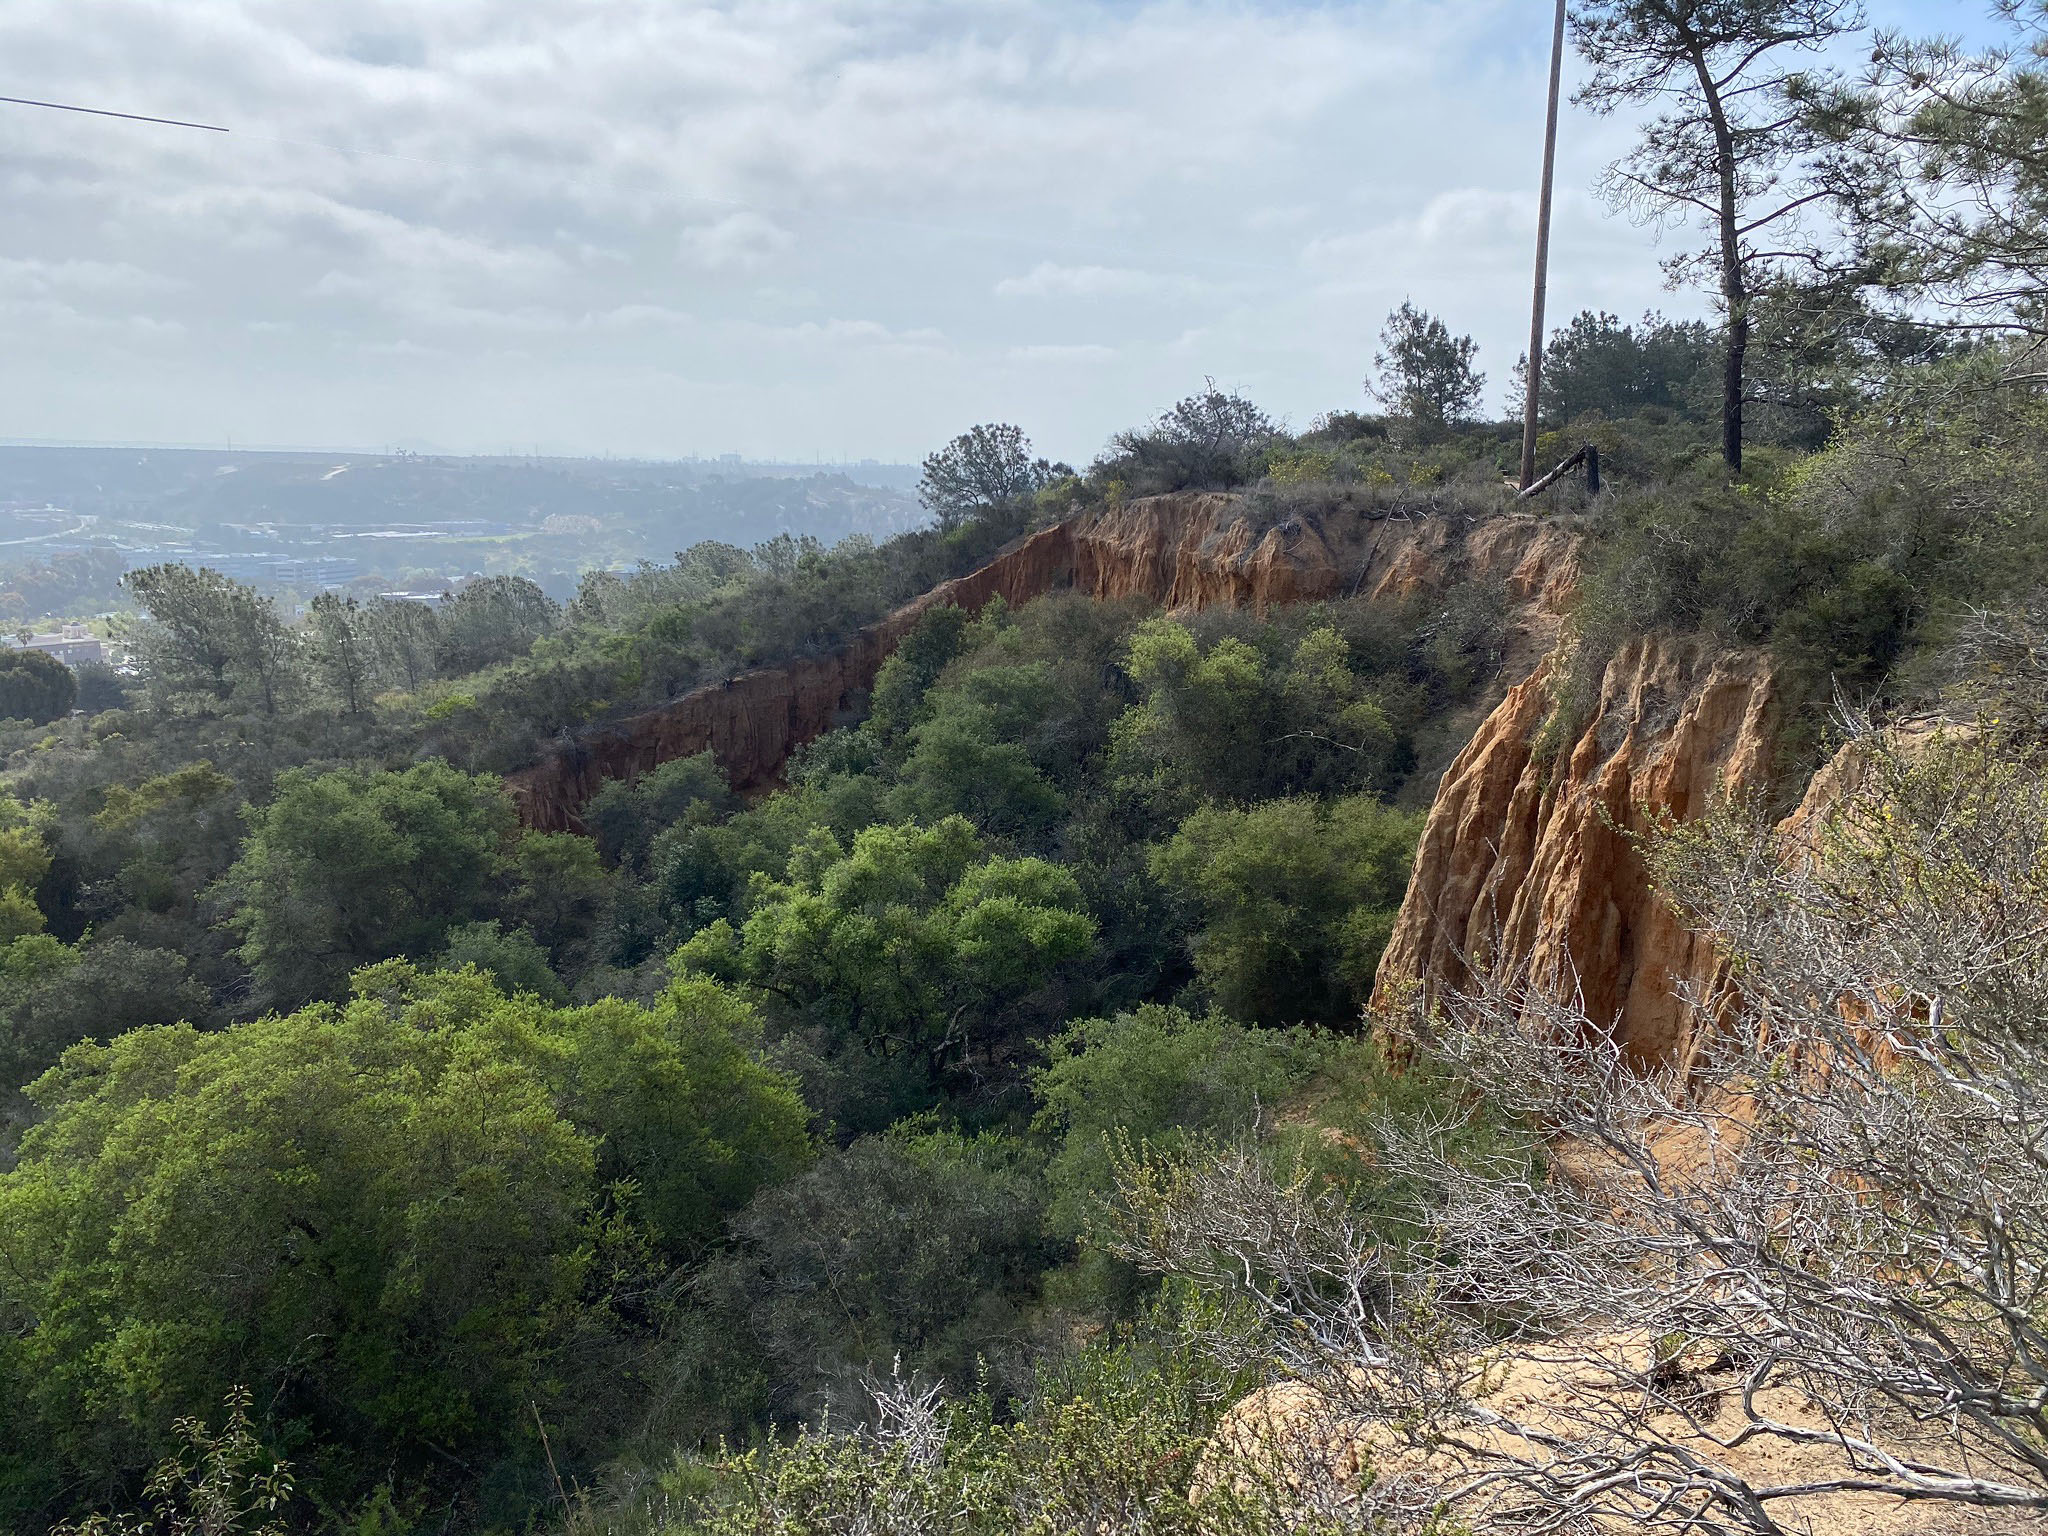
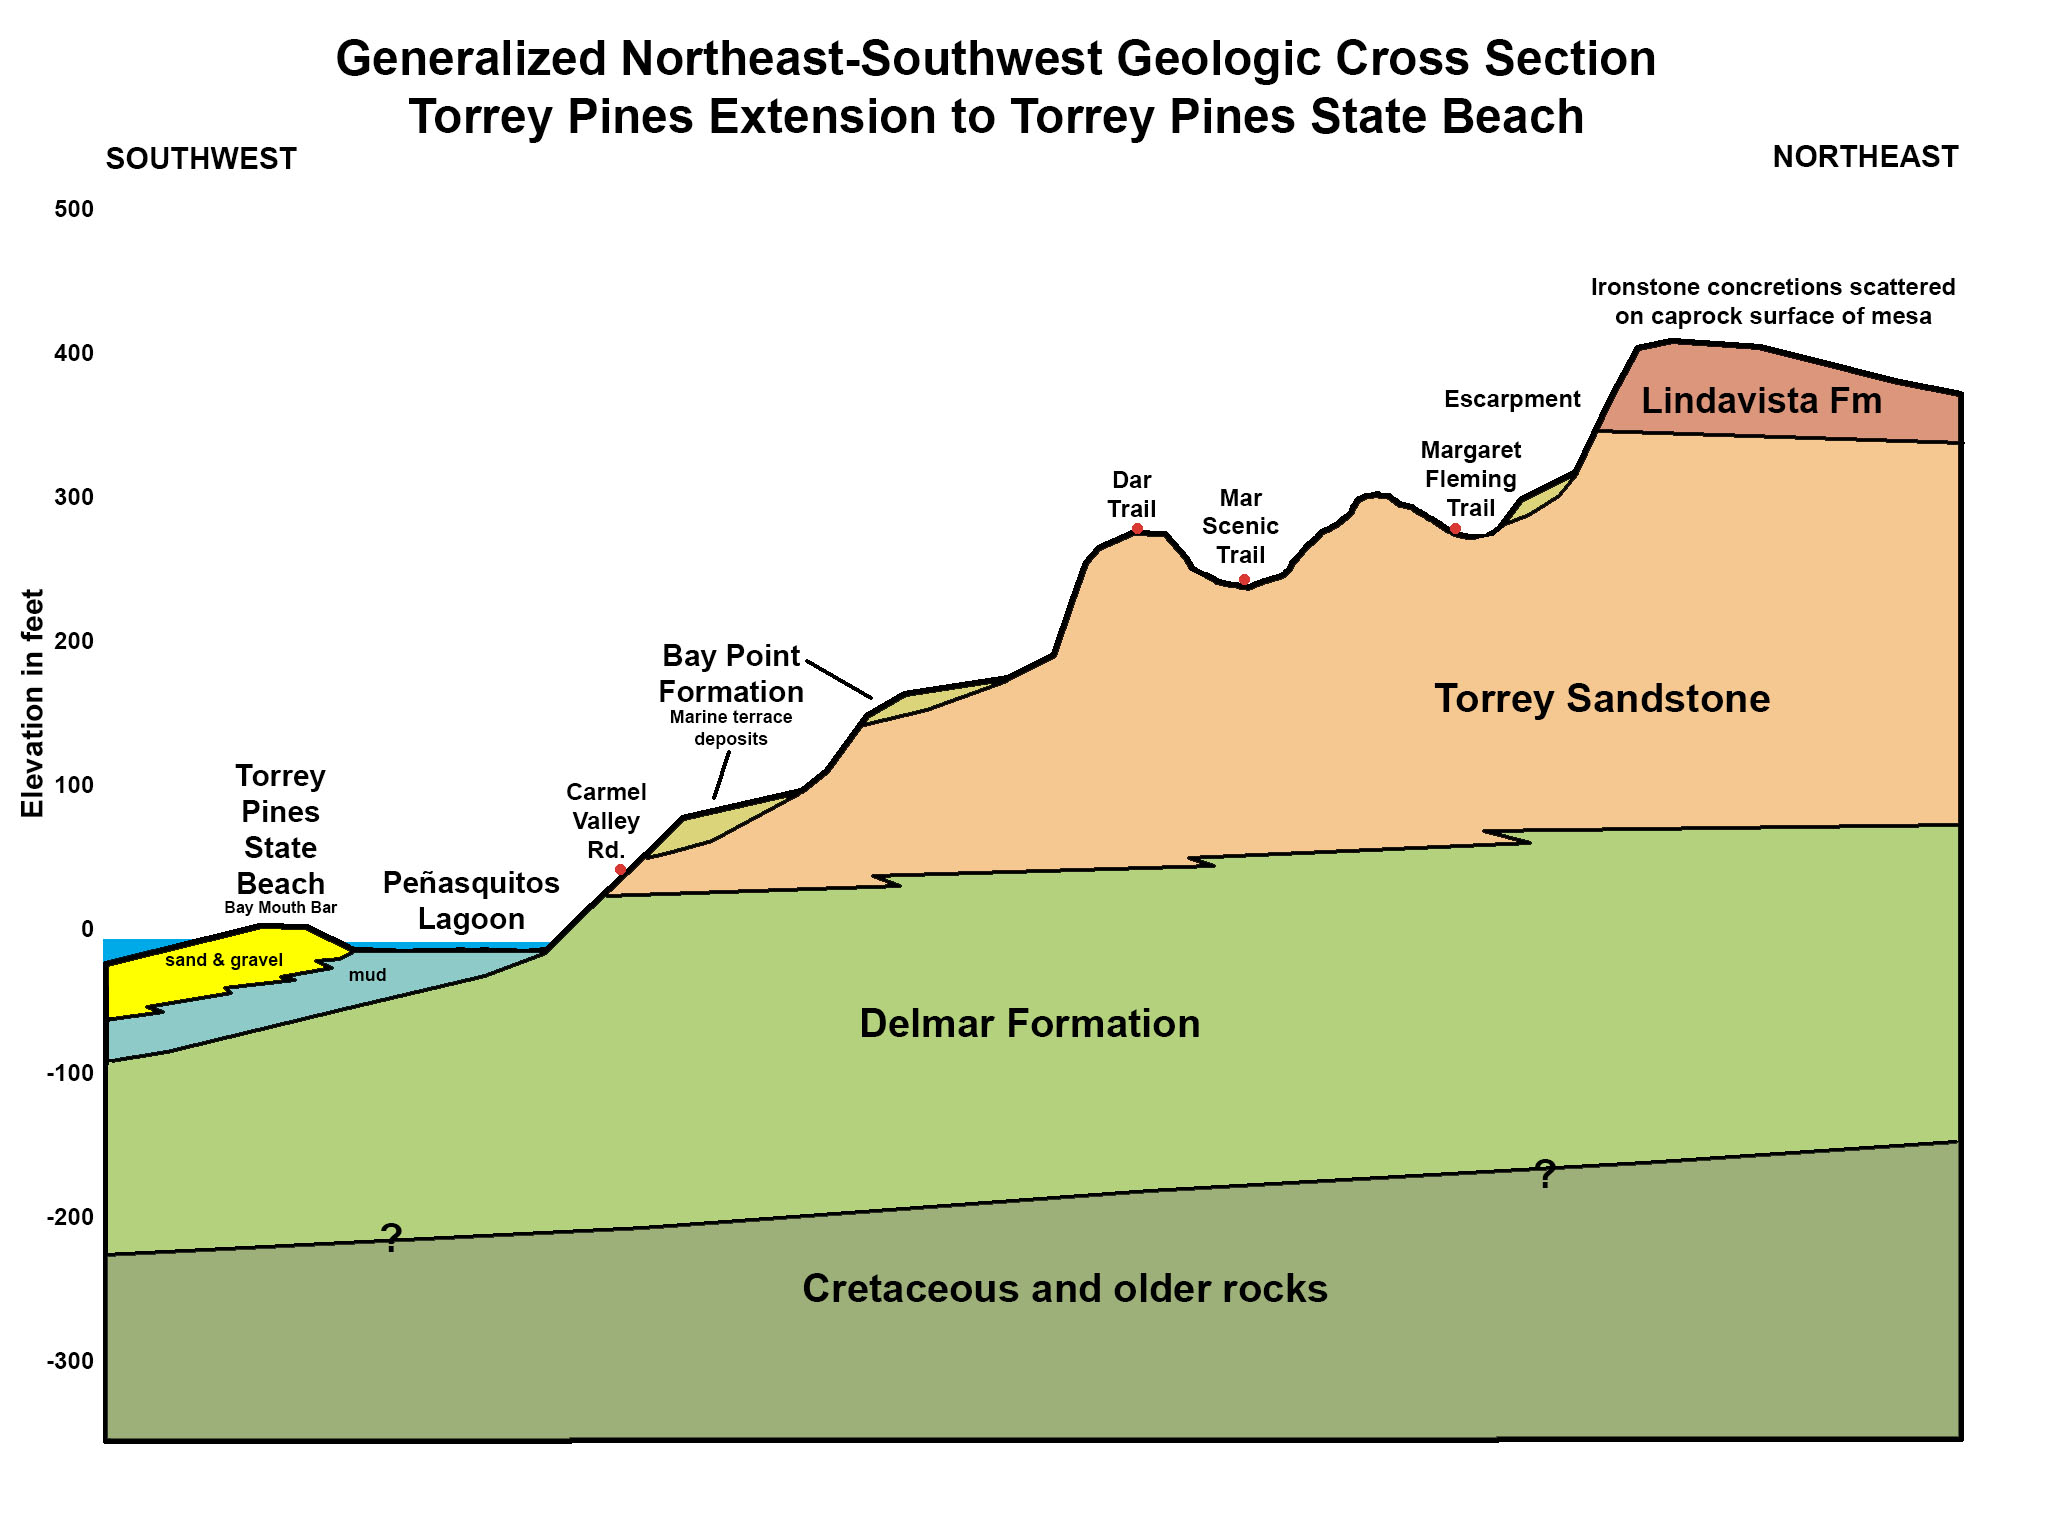
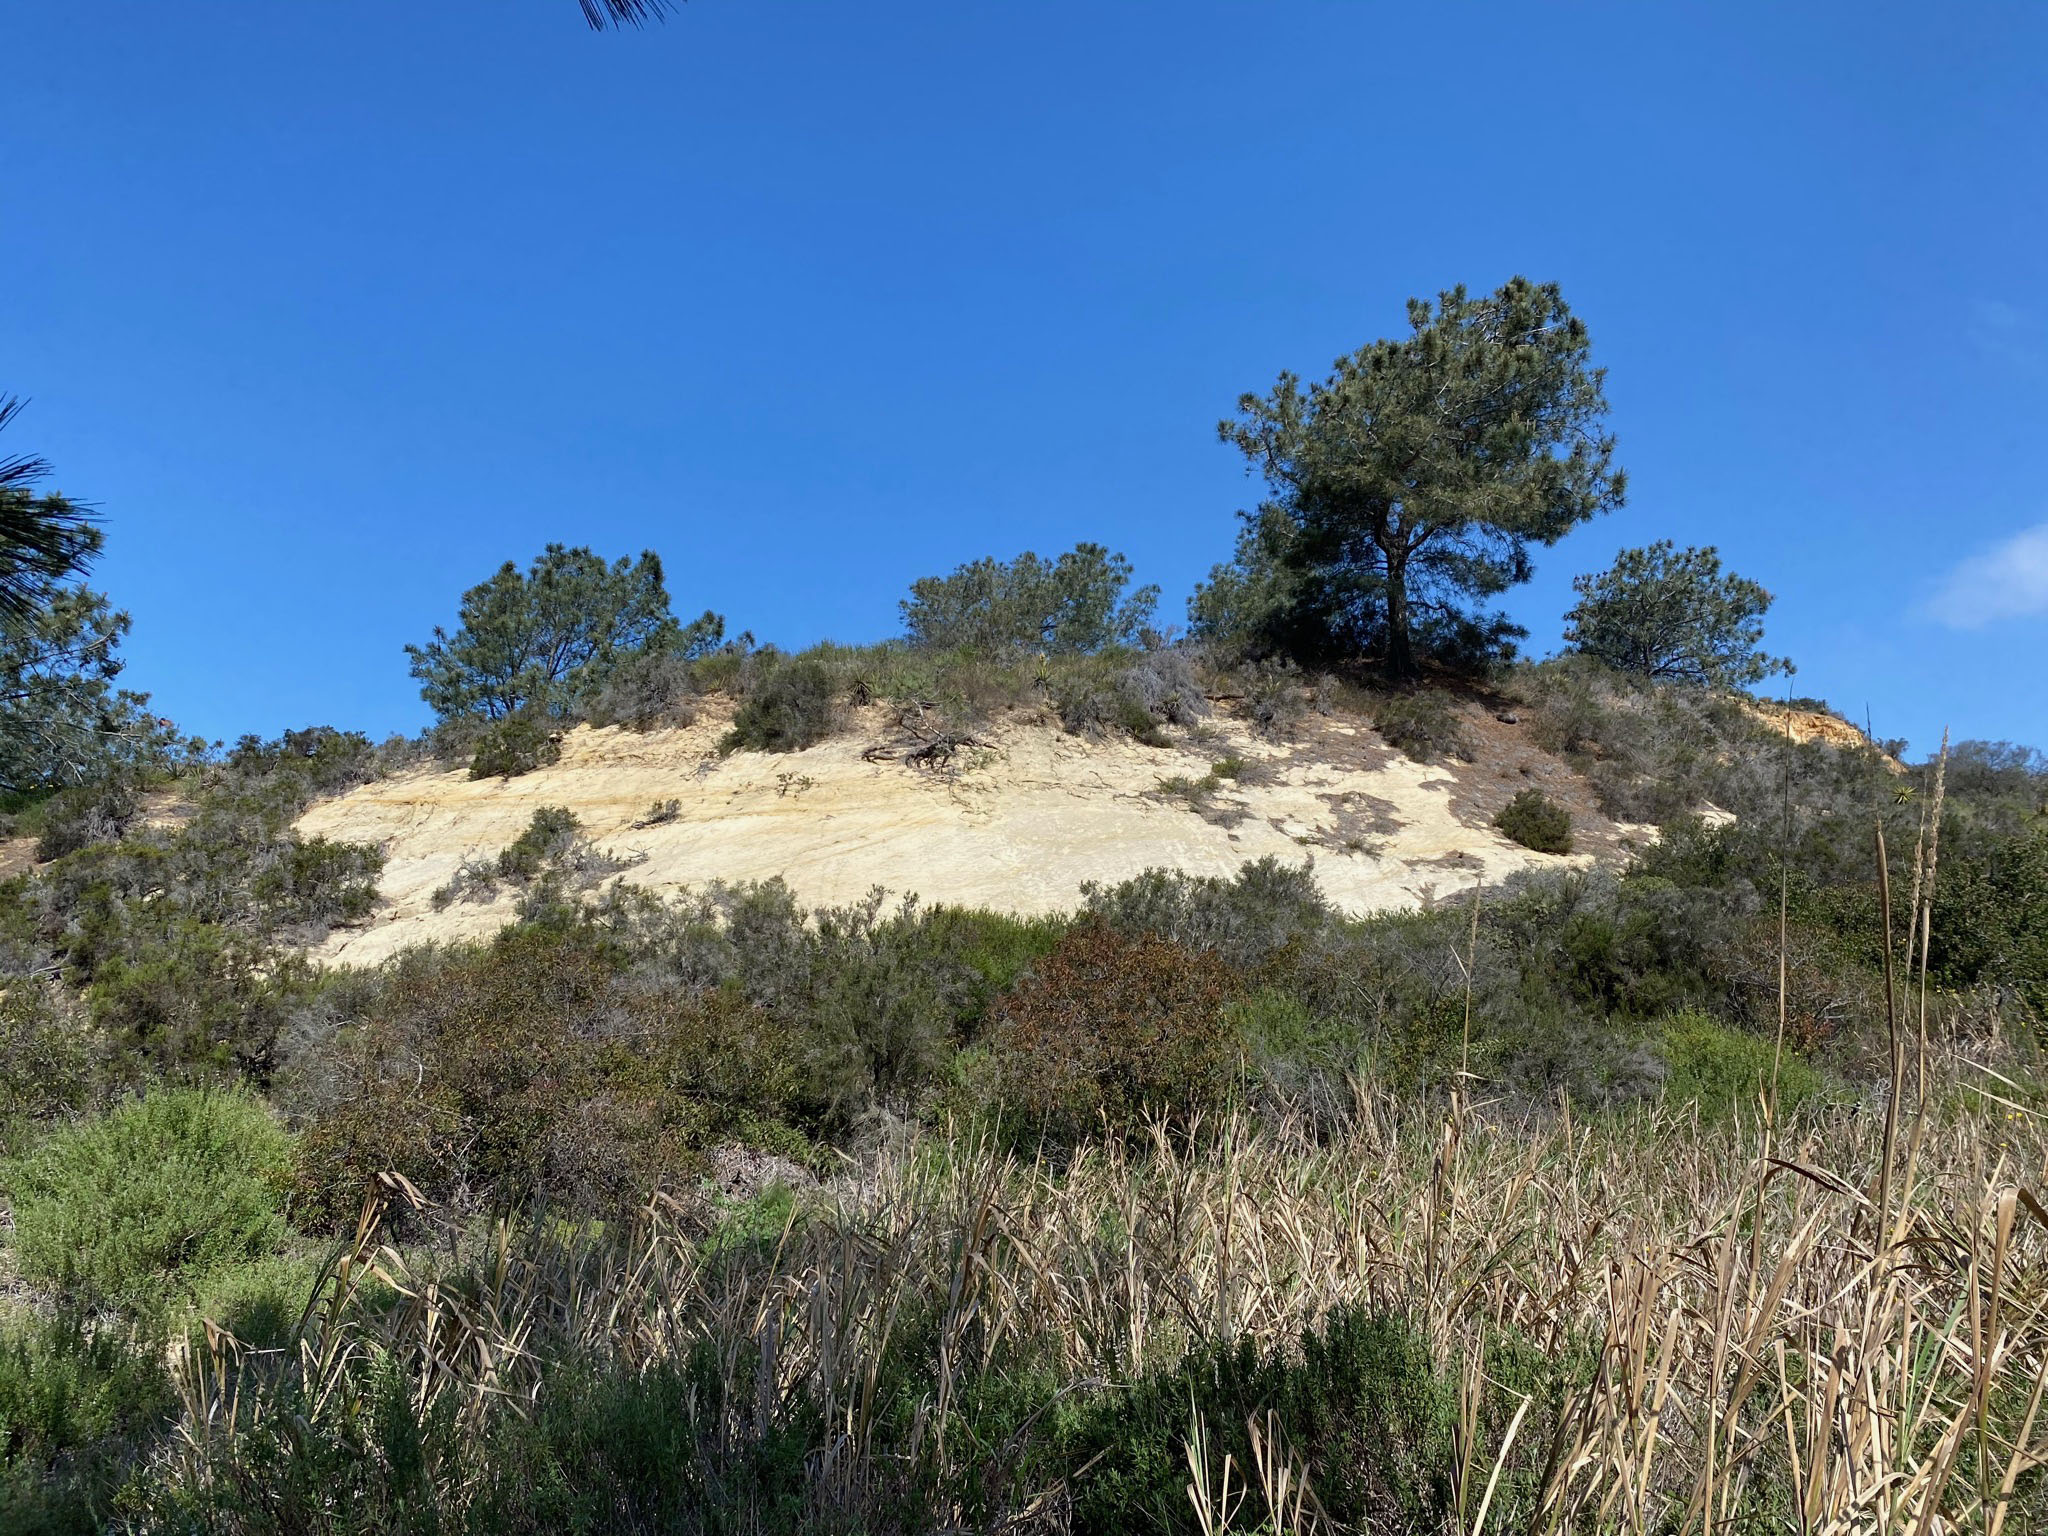
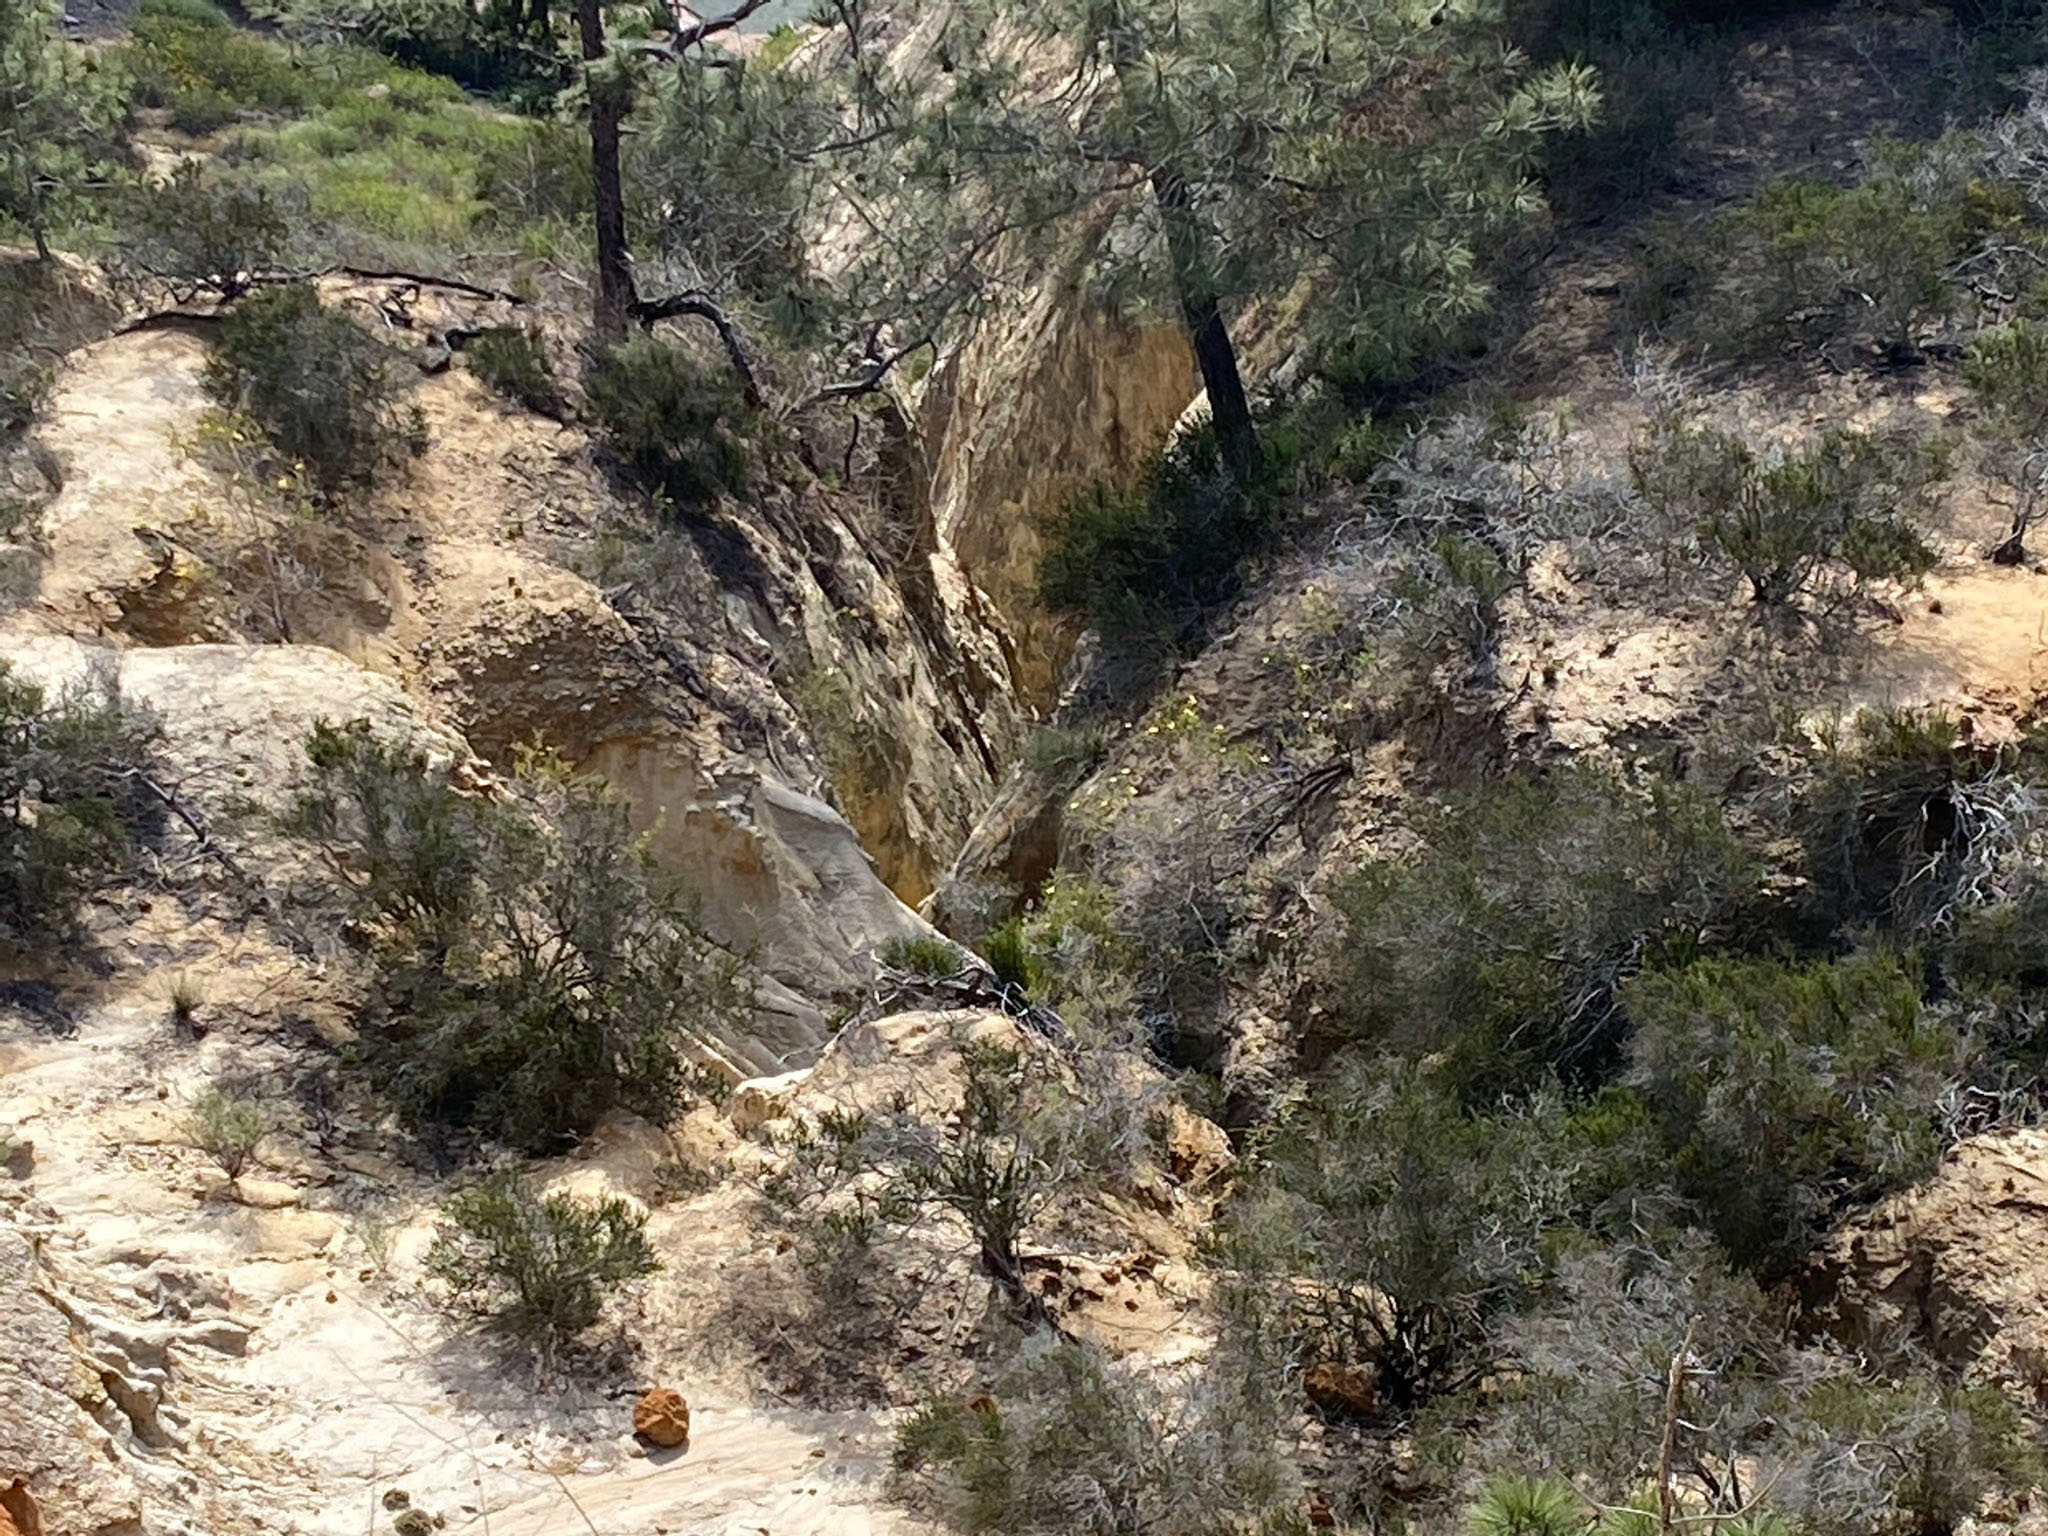
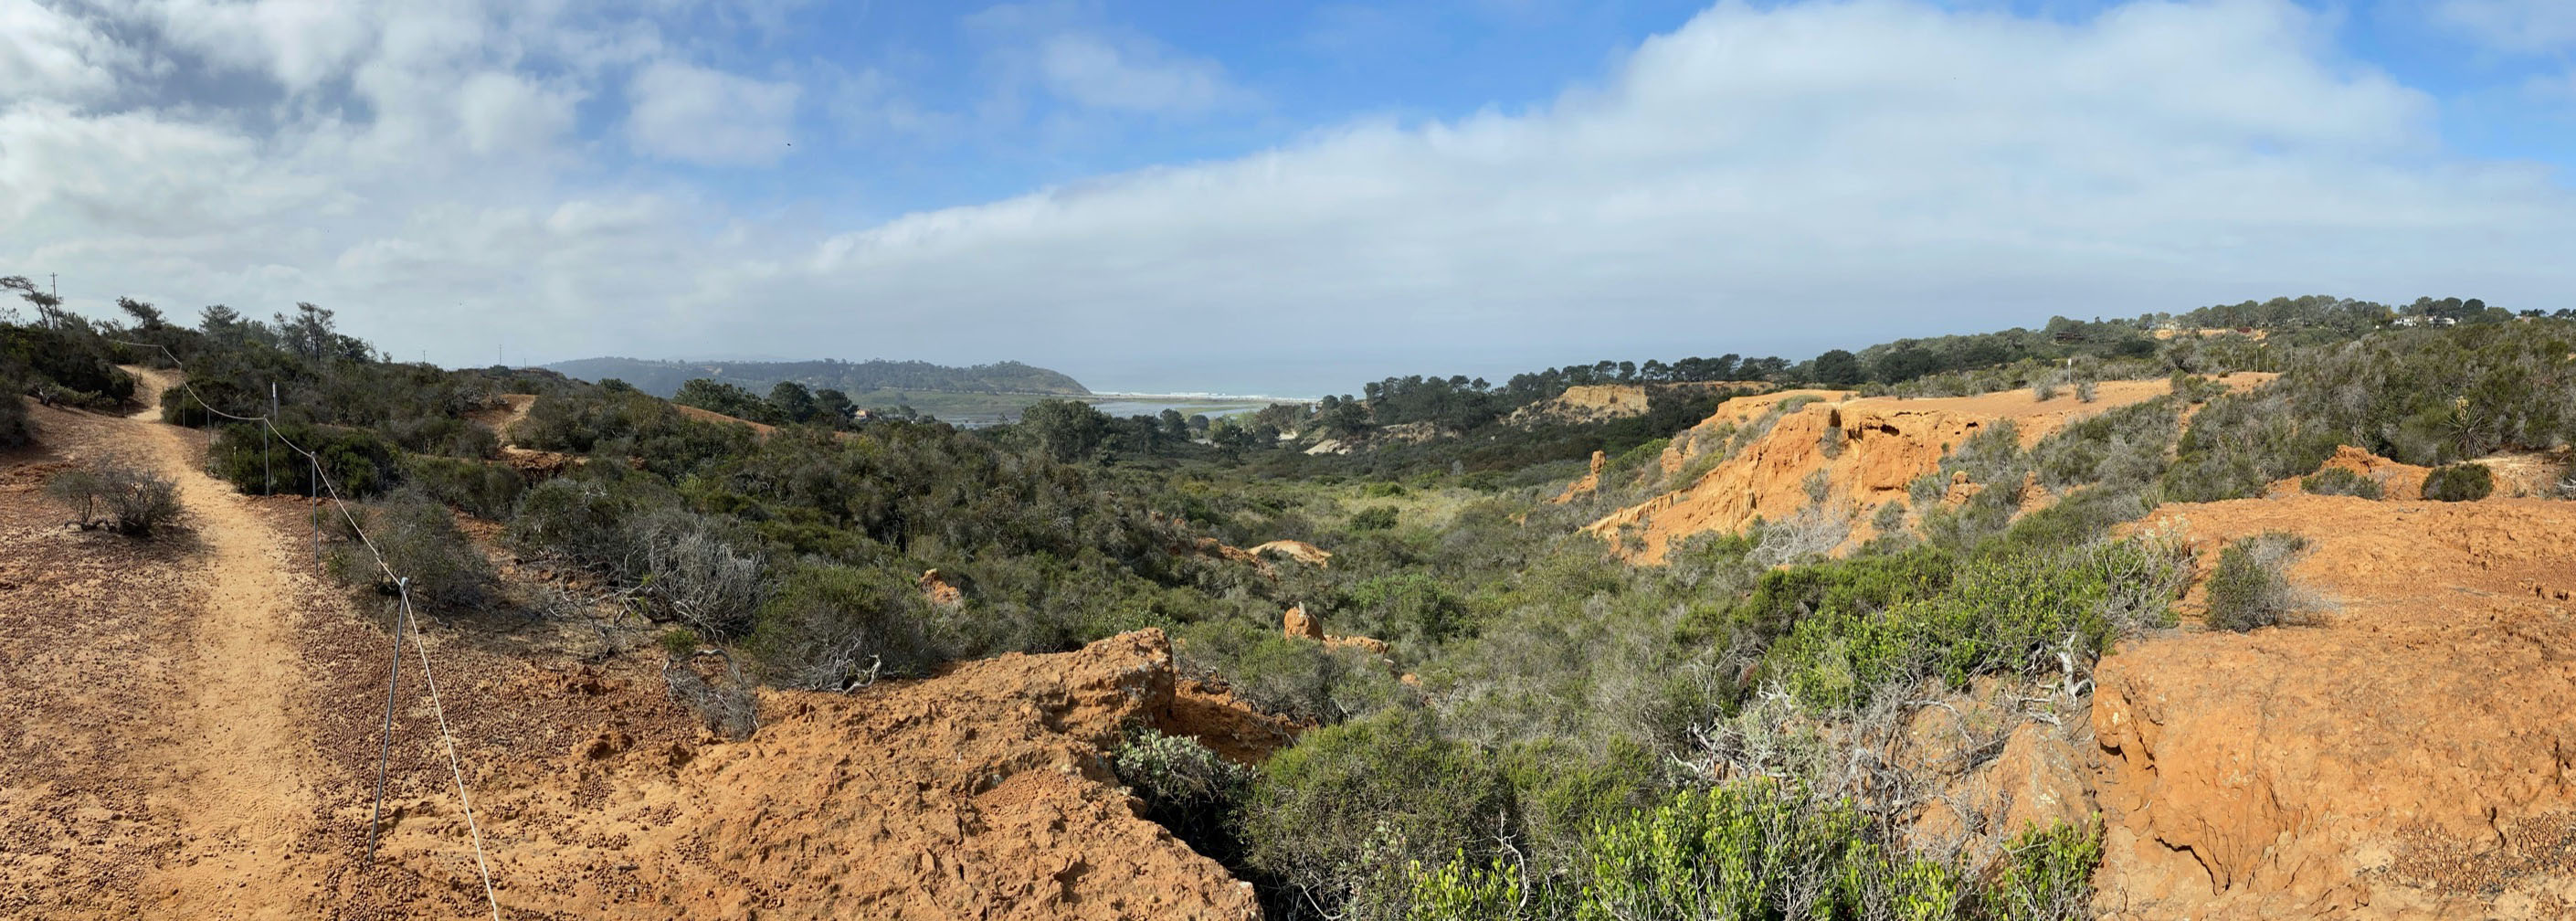
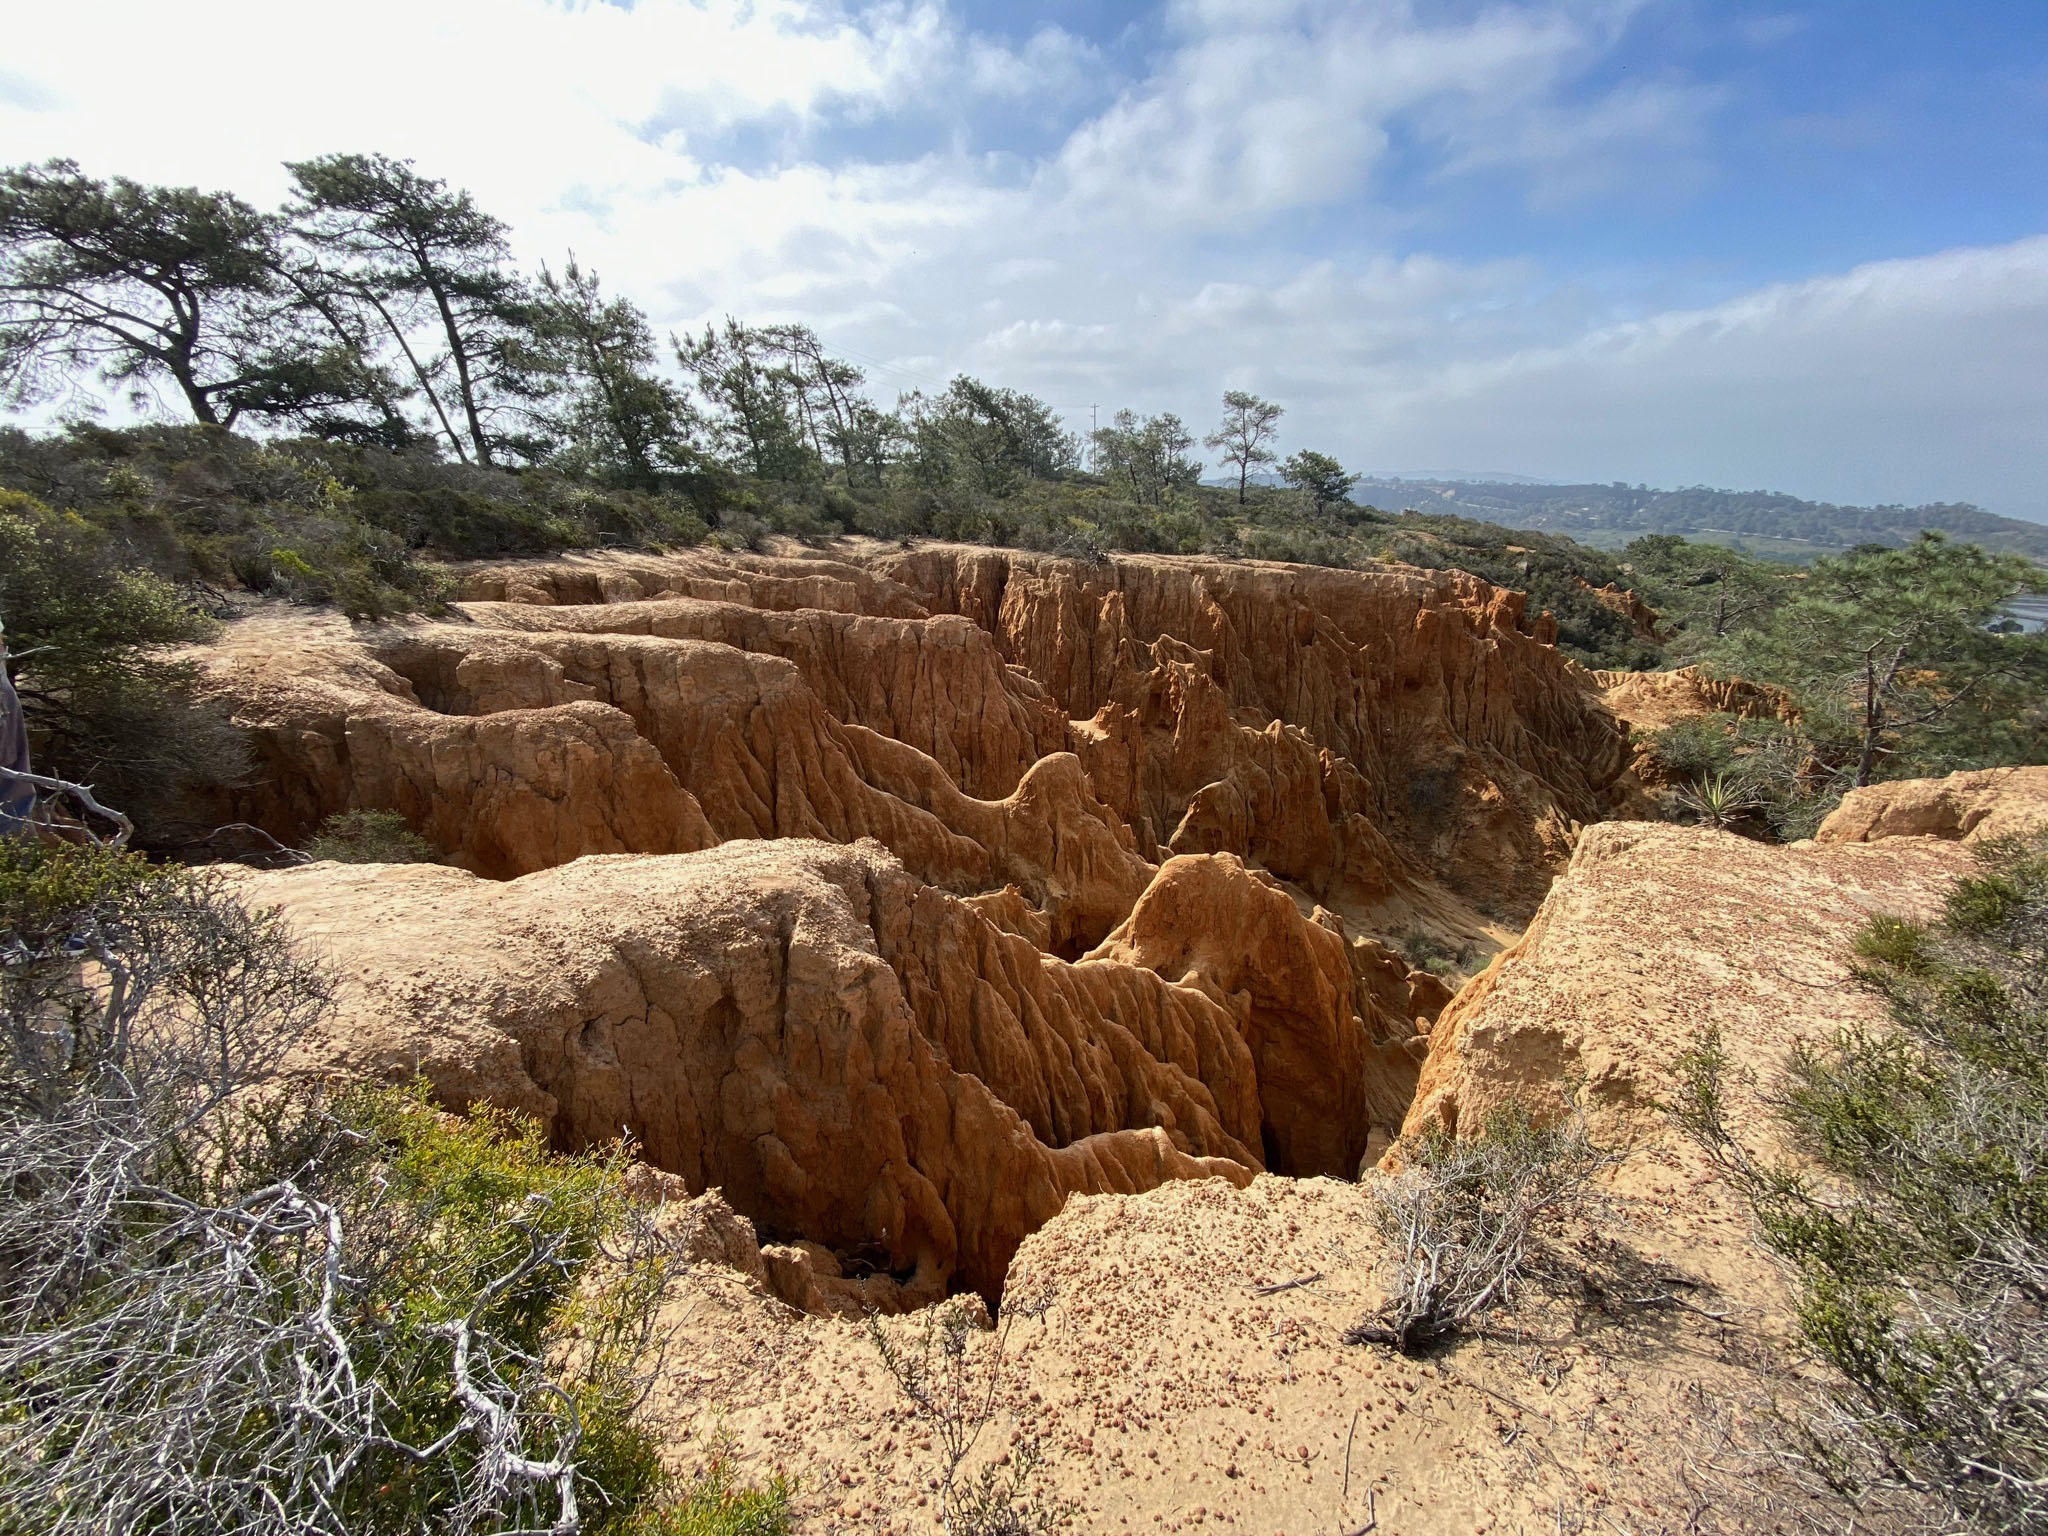
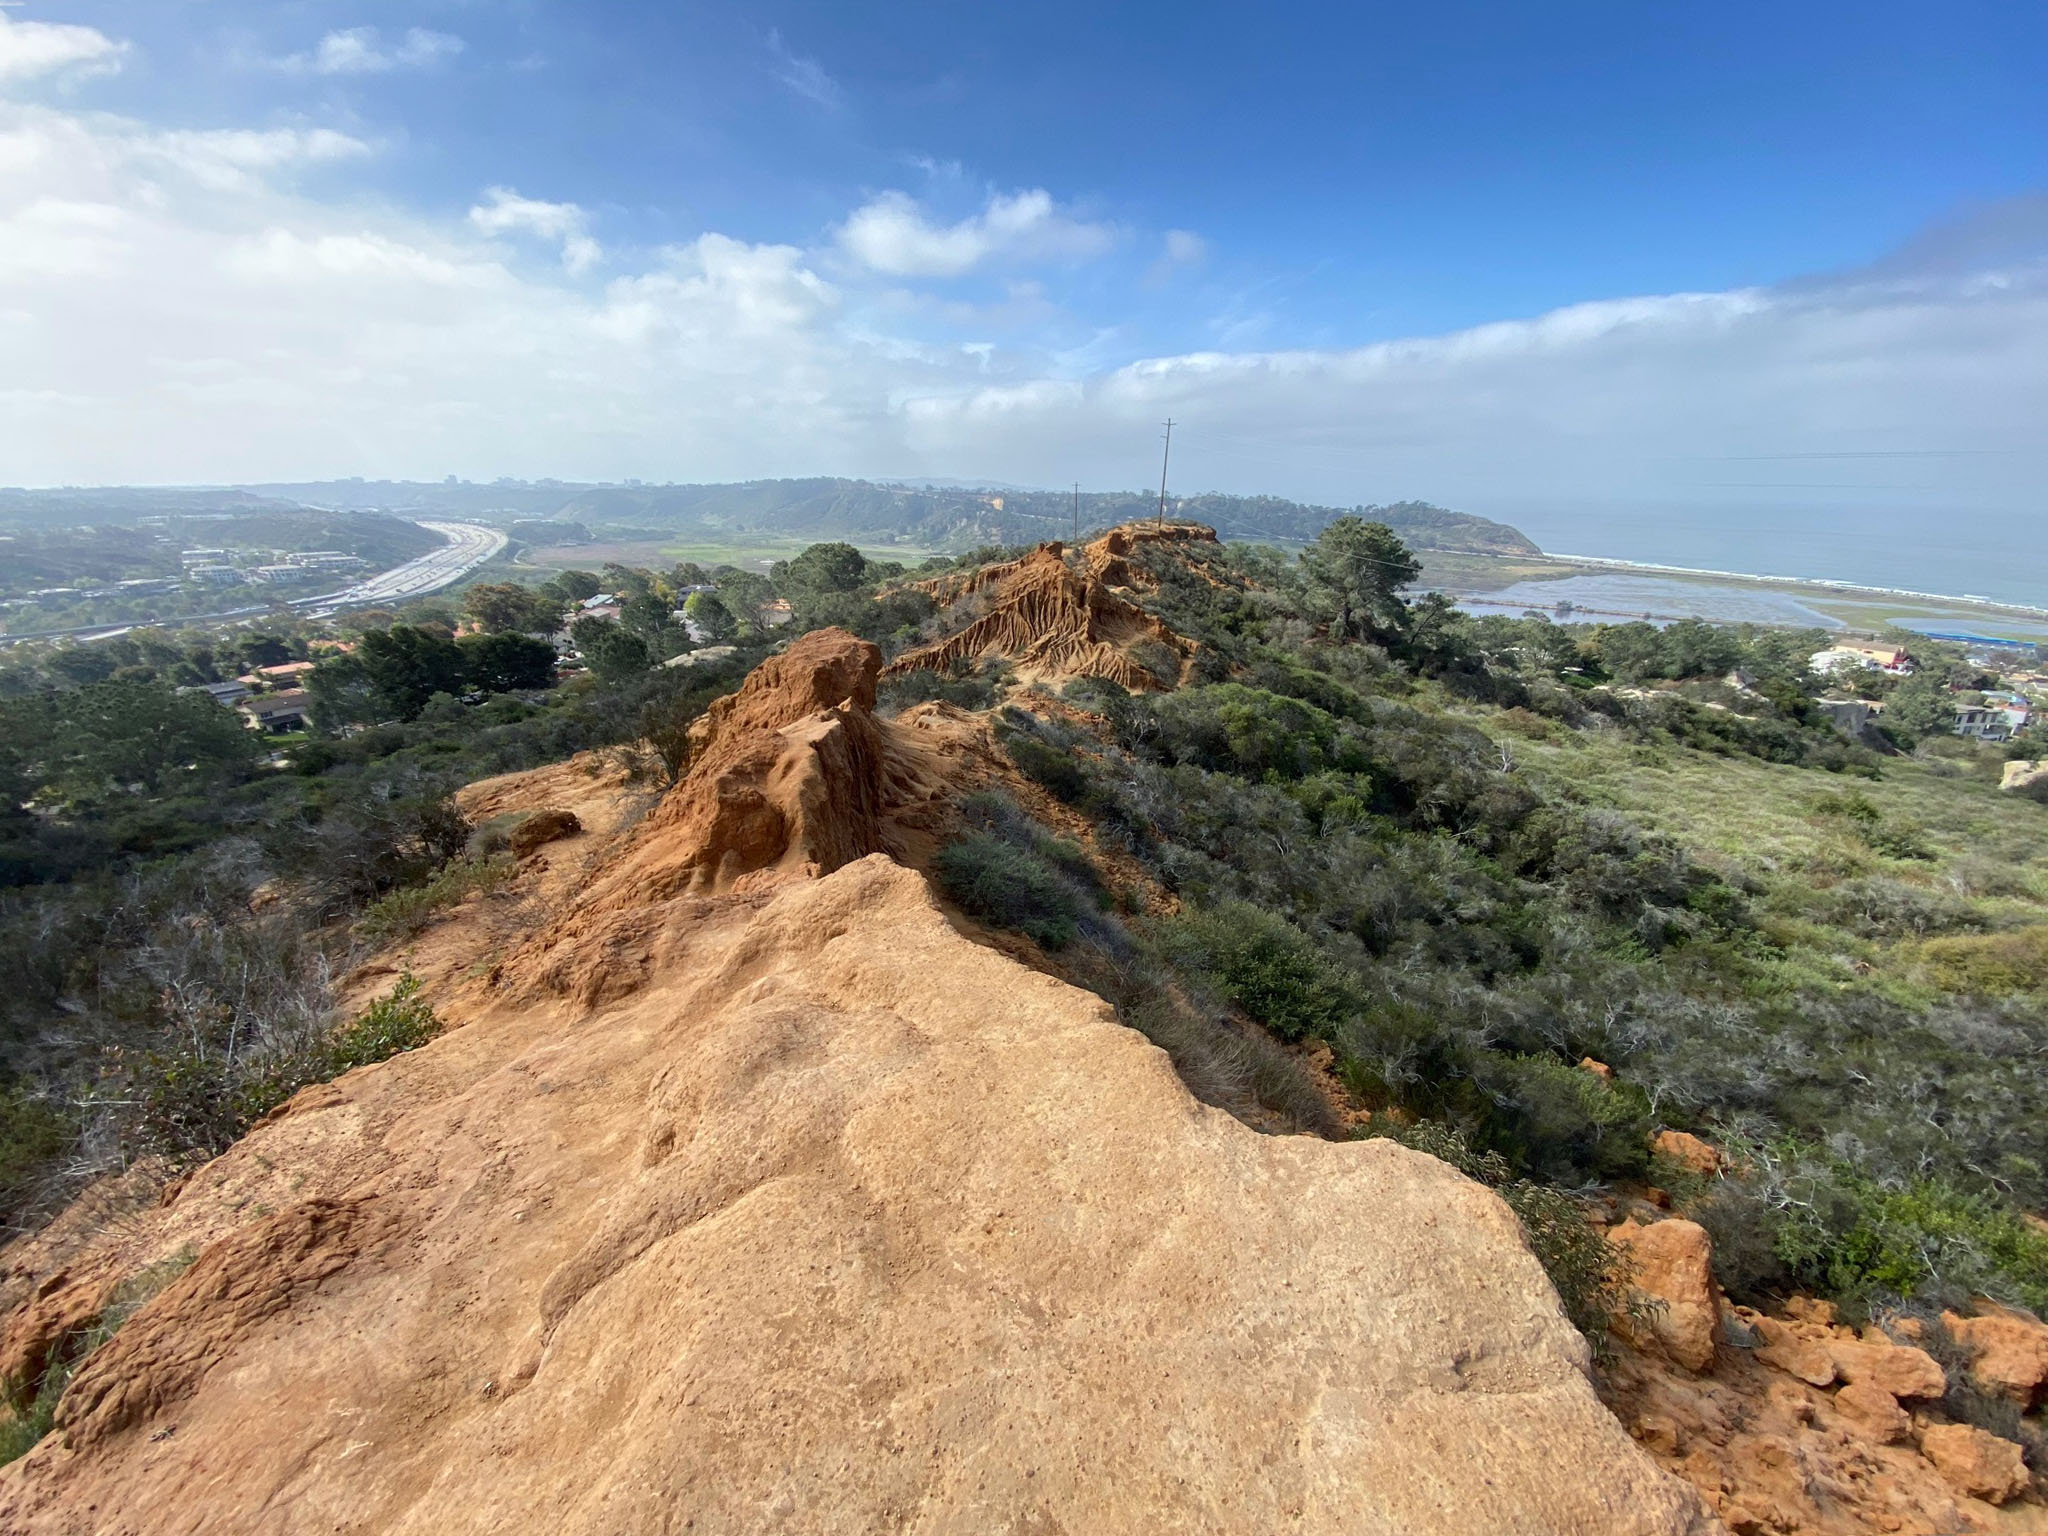
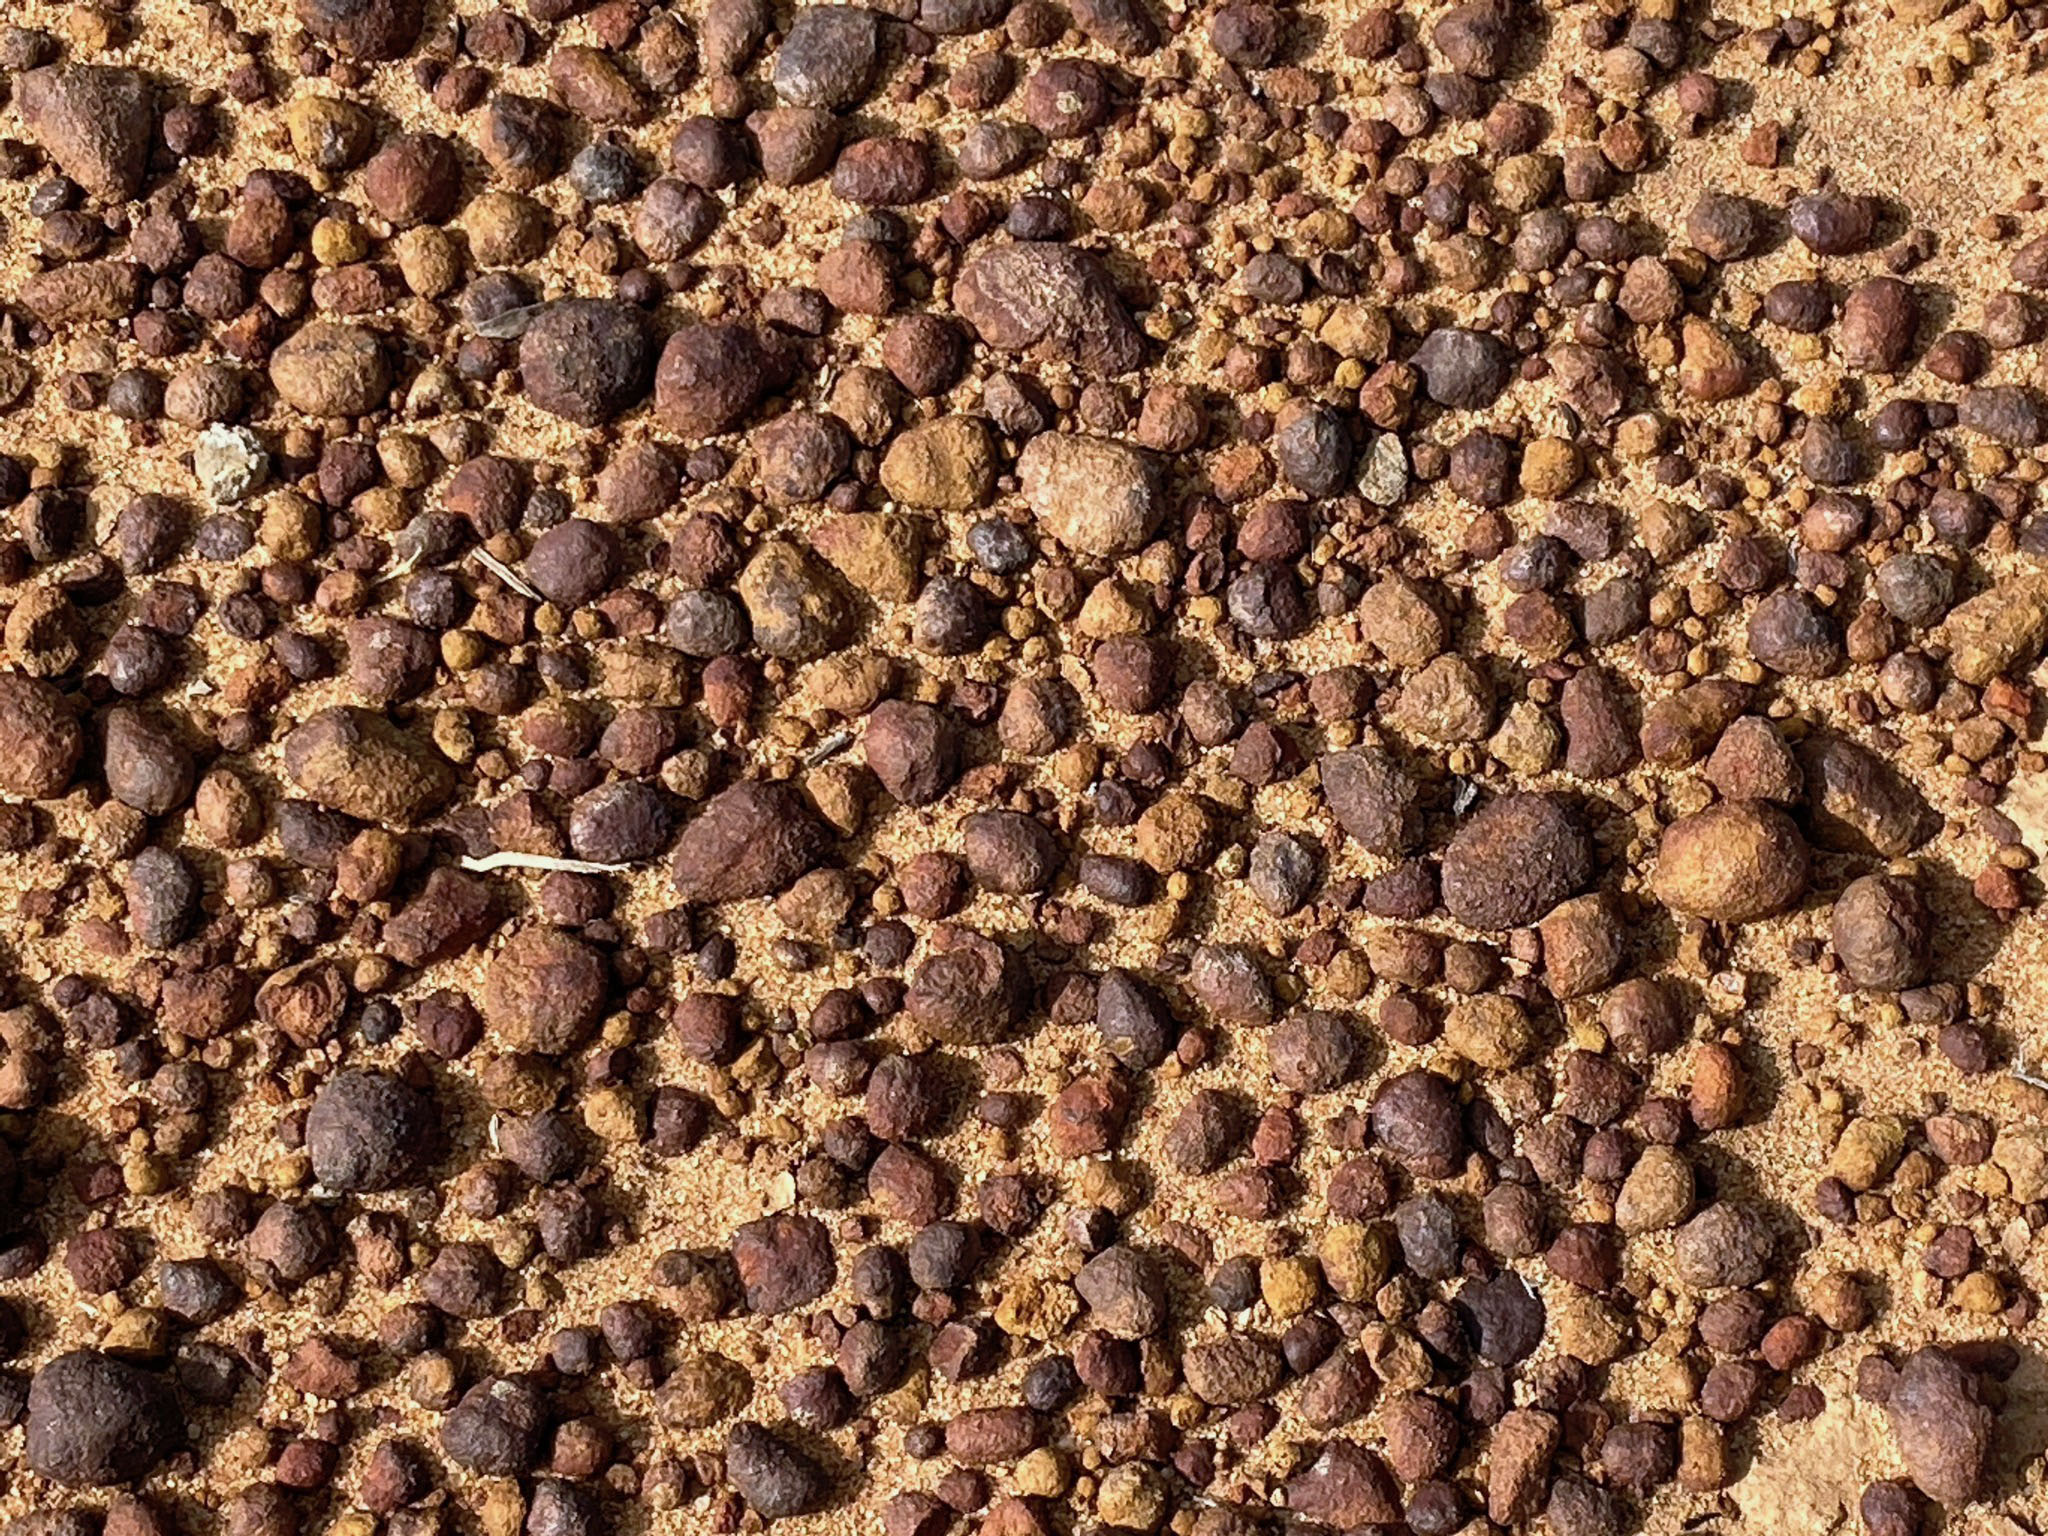
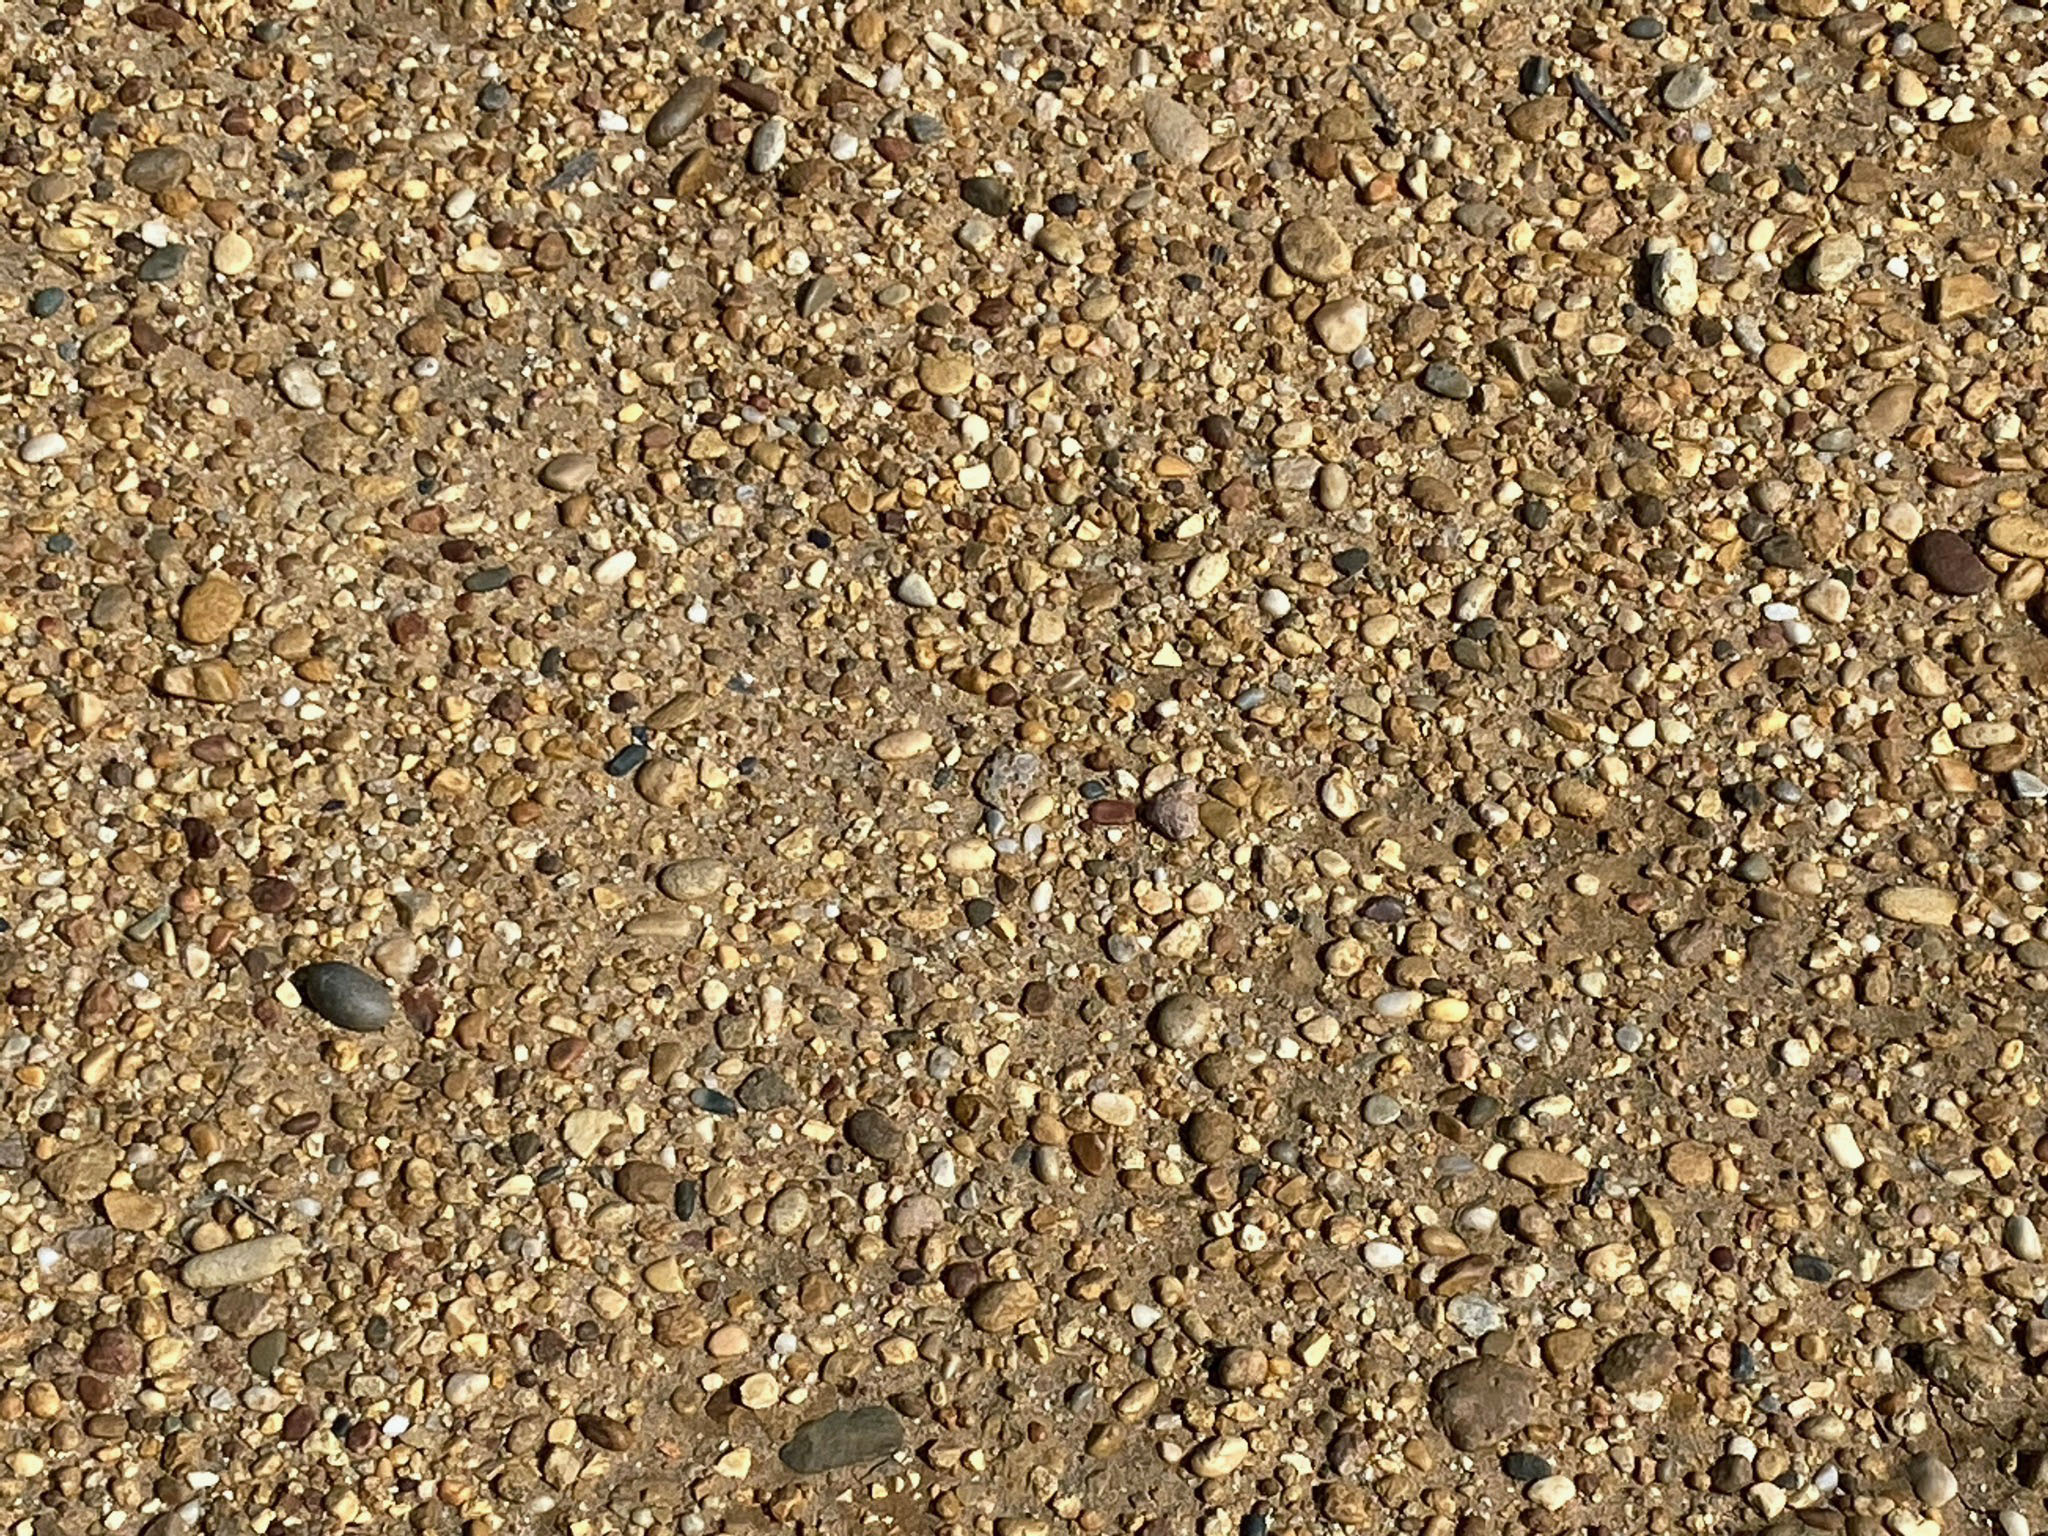
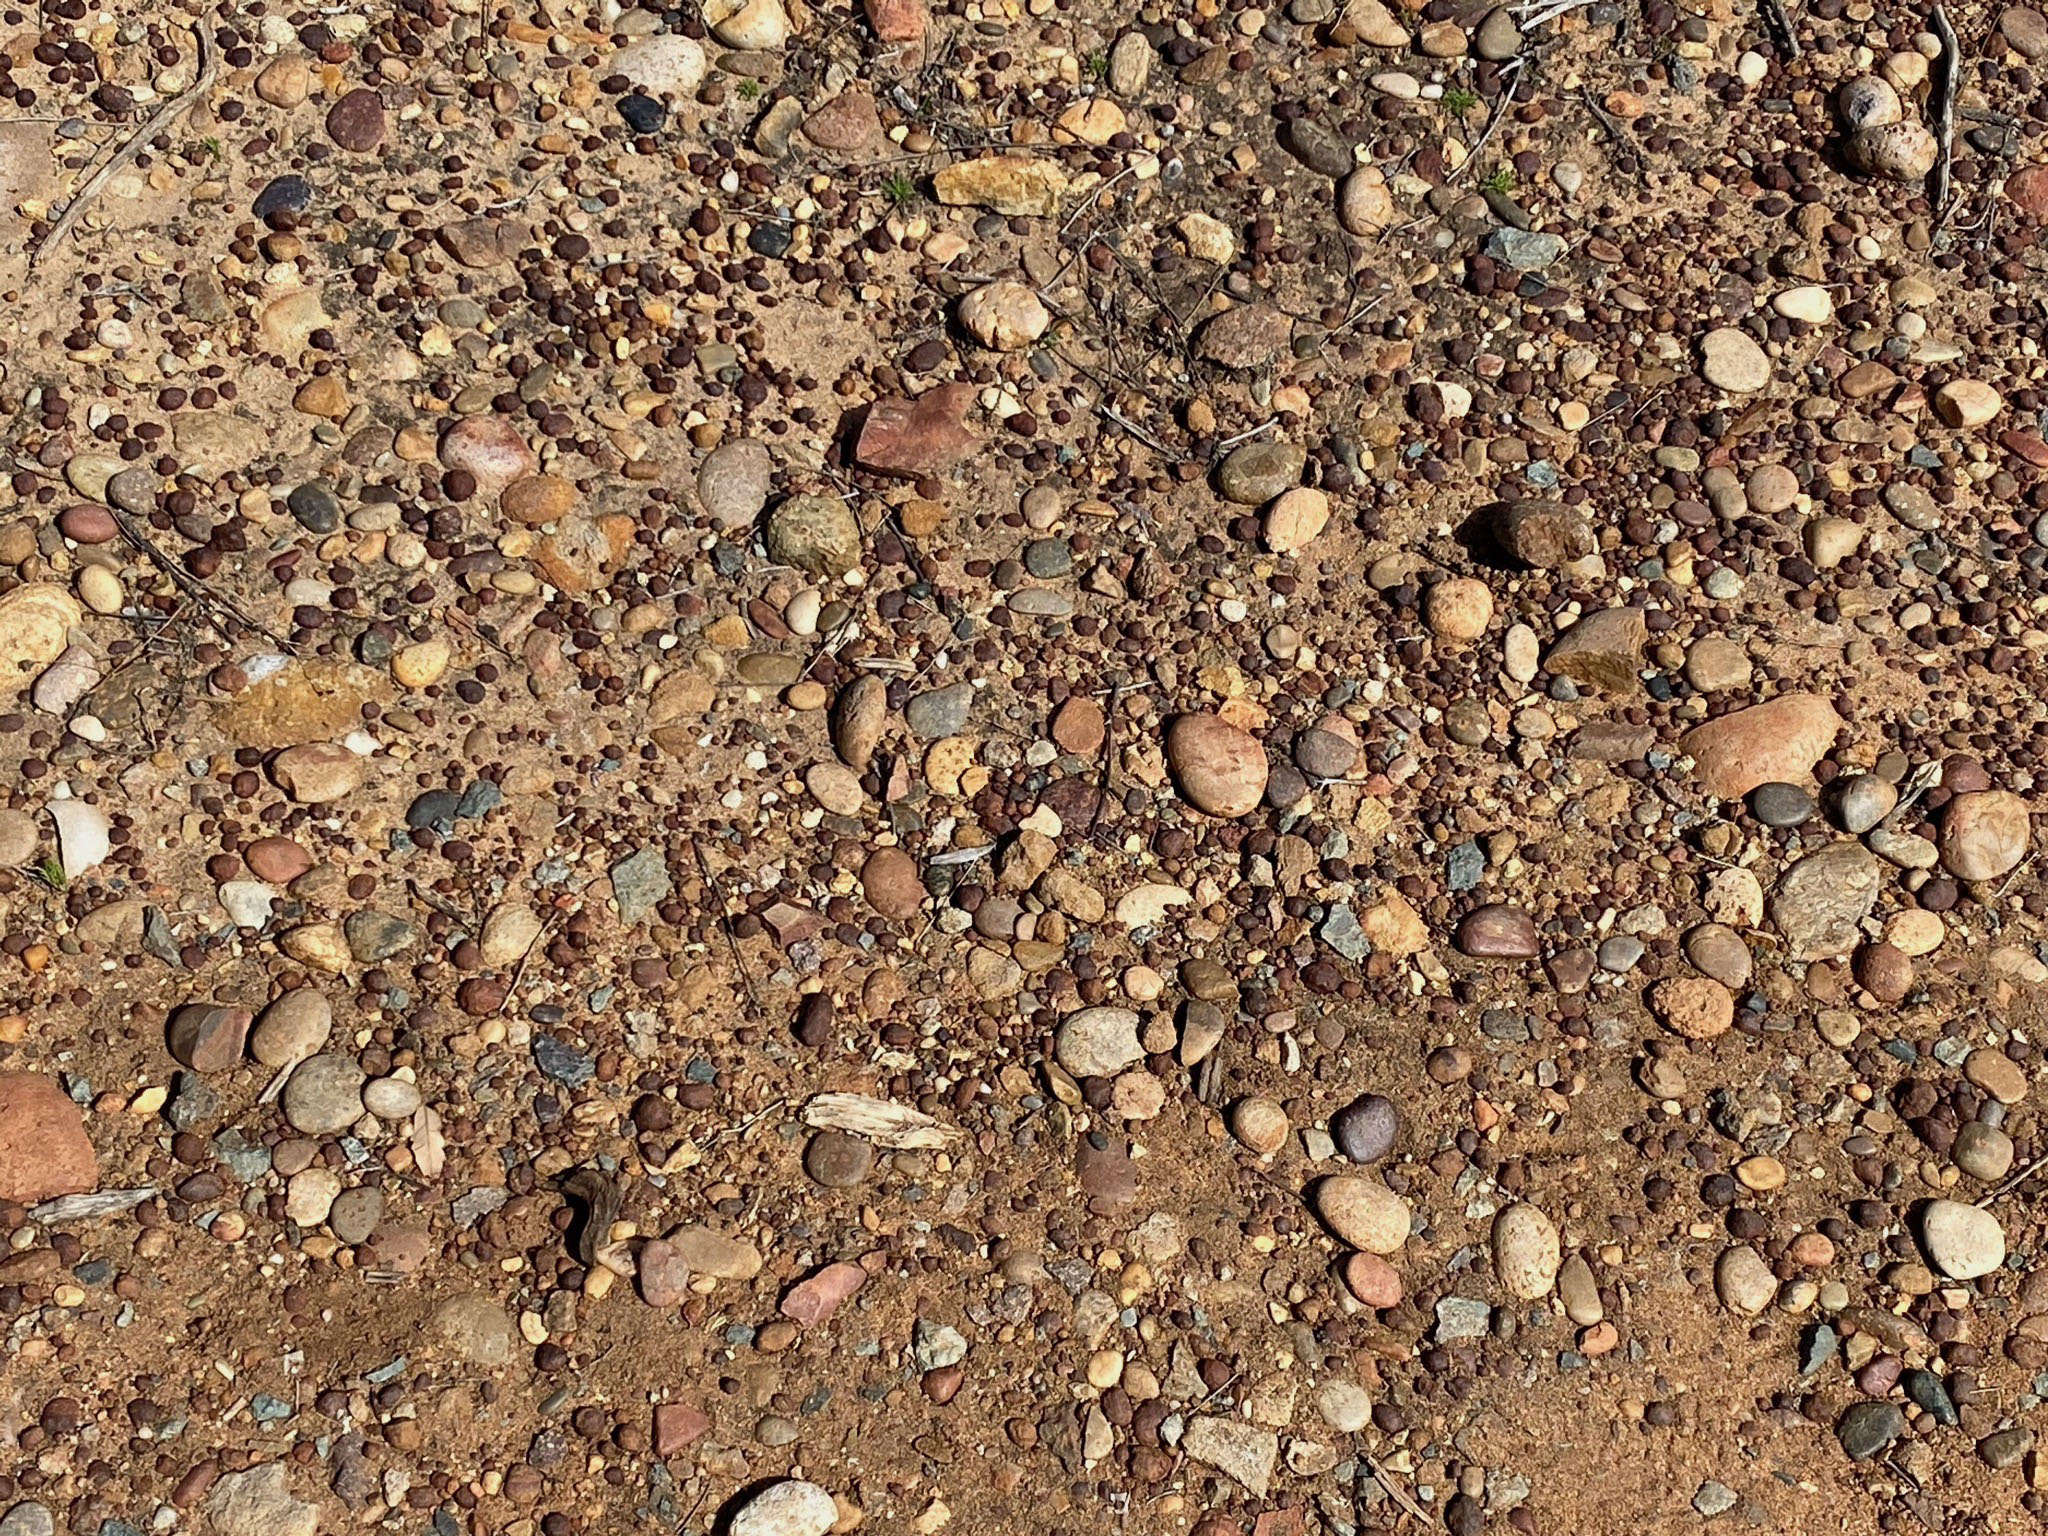
Geology of the Torrey Pines Extension AreaFigure 169 is a generalize geologic cross section of the Extension area (see Torrey Pines Stratigraphy [Figure 7]). The geology is very similar to the Torrey Pines Mesa area.The Delmar Formation (Middle Eocene age) exists beneath the lower slope areas near the lagoon by is not exposed below plant cover and surficial colluvium deposits. The Torrey Sandstone (Middle Eocene age) is locally exposed as massive white outcrops of cross-bedded sandstone locally in the middle slopes and along ridges (Figures 170 to 172). The Lindavista Formation (late-Early Pleistocene) unconformably overlies the top of the Torrey Sandstone and forms the orange-brown caprock surface of the surrounding mesa (Figures 173-179). It includes the soft, badlands-forming sediment beneath the caprock surface. The Linda Vista Formation is locally about 20-30 feet thick. The top of the mesa is locally covered in extensive areas by small ironstone concretions (most are roughly 0.5 to 2 inches in diameter). The concretions are accumulating on the surface as softer, cement-depleted sandstone erodes away, concentrating the tightly cemented, sandy ironstone concretions on the surface (Figures 180 and 181). The ironstone concretions may have formed where pyrite/marcasite (FeS2) crystals have been replace through leaching and oxidation by hematite (Fe3O4), limonite (FeO(OH)·nH2O), and other metal oxides, creating the dense matrix holding the concretions together. The pyrite probably formed in the organic-rich silt/sandy sediments in a marine setting when sediments of the Lindavista Formation were originally deposited in early-Late Pleistocene time when the marine terraces associated with the formation were actively forming. As the land rose, and old marine terraces became exposed to sub-aerial weathering. The iron-oxide minerals are more stable than other minerals in arid and semiarid settings. Ironstone concretions can be found in association with the oldest marine terrace deposits in many locations through San Diego County. The Bay Point Formation (Late Pleistocene) occurs in scattered pockets on the slopes between the the Linda Vista escarpment and the lagoon. The marine terrace deposits and features along the coast transition to lagoonal shoreline deposits and elevated stream terrace deposits and features along Sorrento Valley (and its stream tributary valleys). The ancient terraces are preserved as step-like benches in some places along the canyons, but most have degraded or eroded away over time. Evidence of the remnants of Bay Point Formation can be seen in the form of patches of sorted gravels in some areas along the trails (Figures 182 and 183). These gravels were originally derived and reworked from older Eocene-age river deposits and reworked by stream and wave action as sea level rose and fell during the Pleistocene ice ages. Figure 184 is a view from Red Ridge that shows a local outcrop of the Bay Point Formation (gray) below outcrops of theLindavista Formation (reddish) and on top of Torrey Sandstone (white). Mesa lands and mountain peaks east of Torrey Pines Extension: Figure 185 provides a panoramic view looking to the east of Red Ridge in the Torrey Pines Extension area. The view shows the broad mesa that extends to the base of the foothills, highlands, and mountain peaks in the core of the Peninsular Ranges. The mesa top extends east across the Miramar Mesa region and is capped by the Lindavista Formation of Early Pleistocene age (and possibly older) when the mesa top was actually the eroded surface of the shallow continental shelf and embayments when the land was 400 to 800 feet lower than today (and/or sea level was also higher). The ancient shoreline ran along the base of the mountain front. Since then, the mesas area has been uplifted and dissected by streams that carved canyon. Some of the canyons follow carved zones of weakness in the rocks along fault zones that cut the mesas. |
|


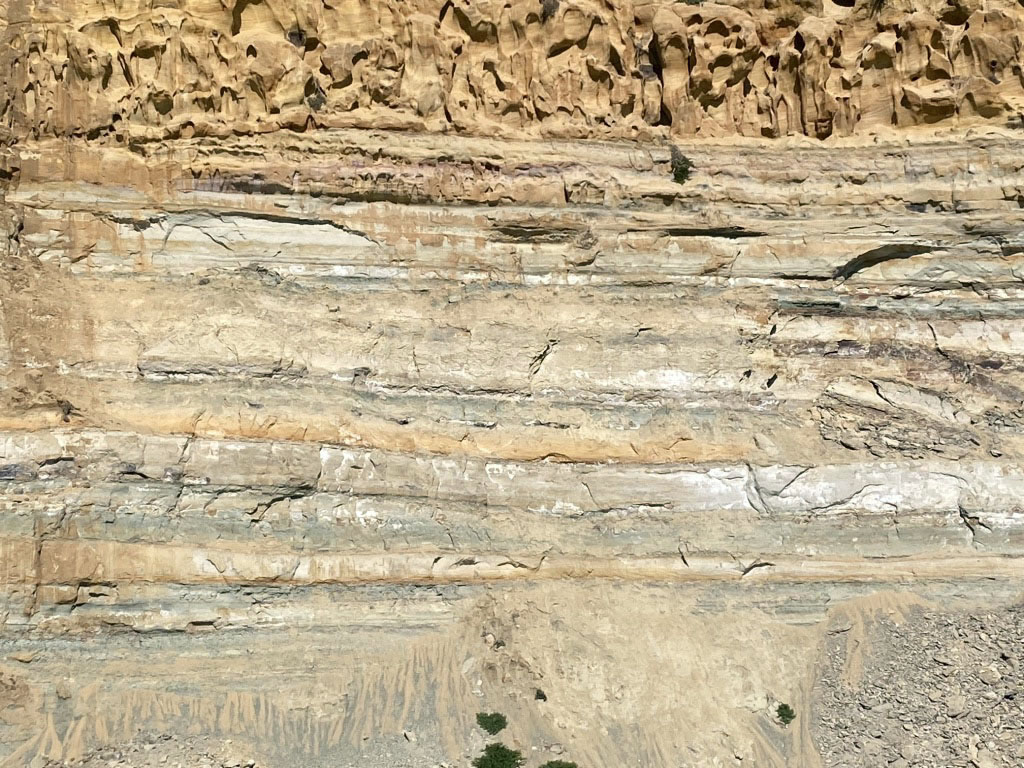
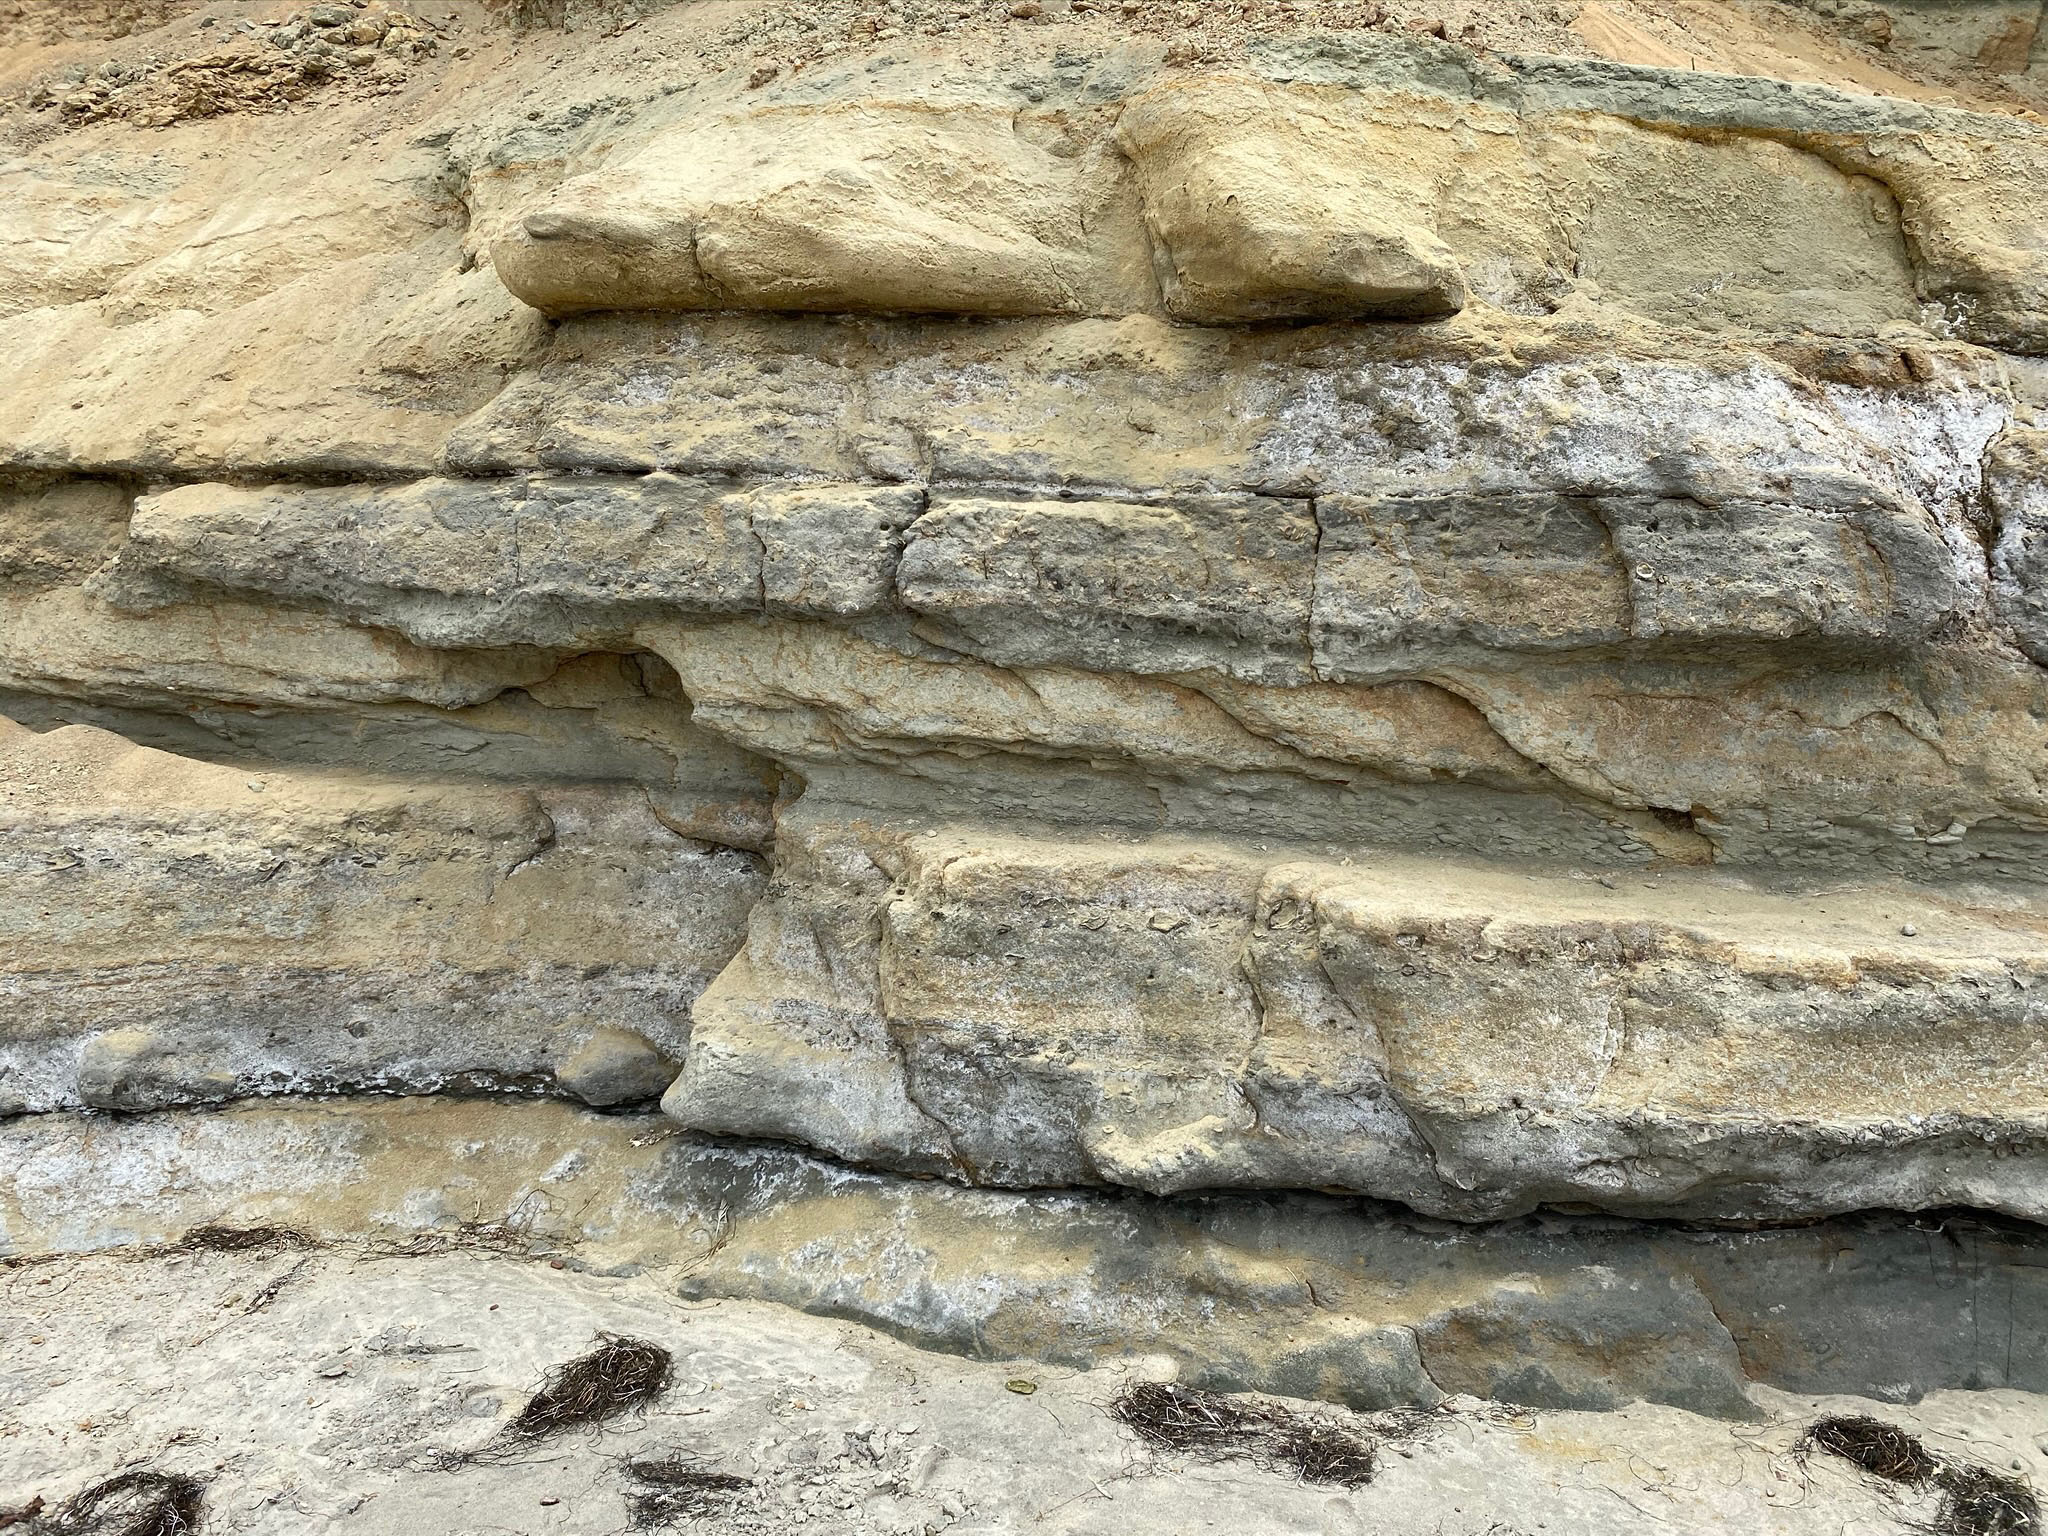
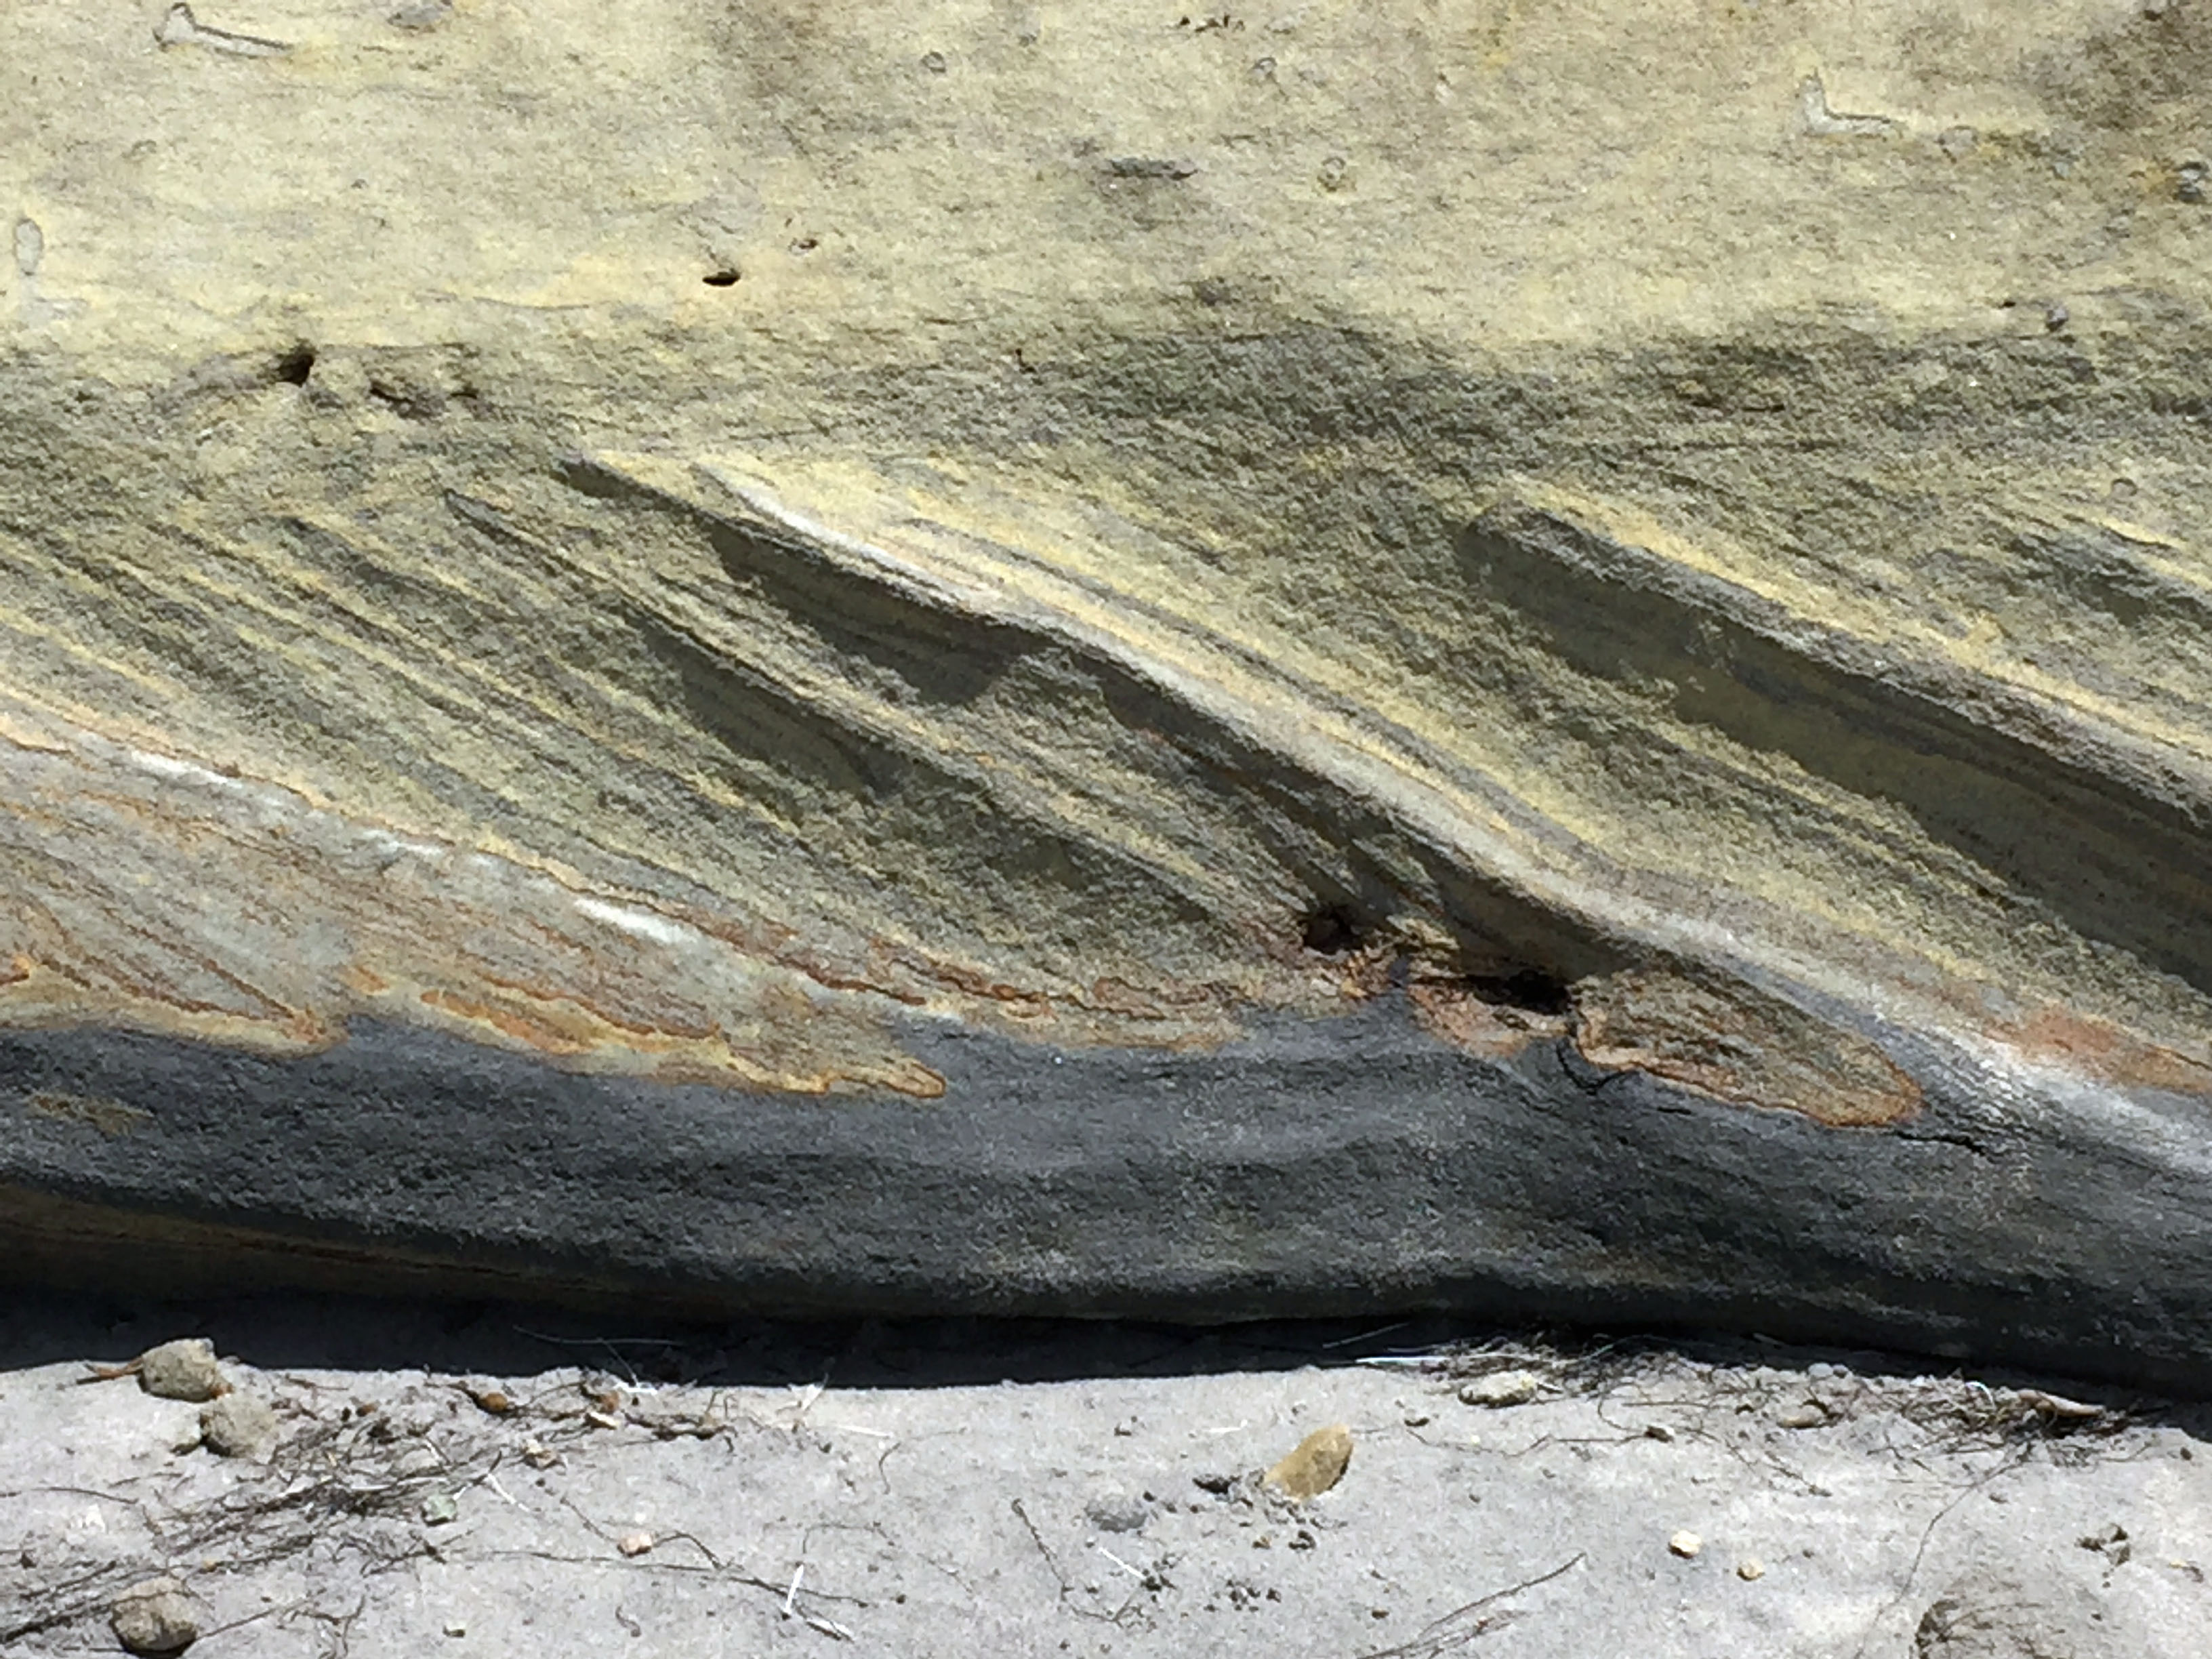
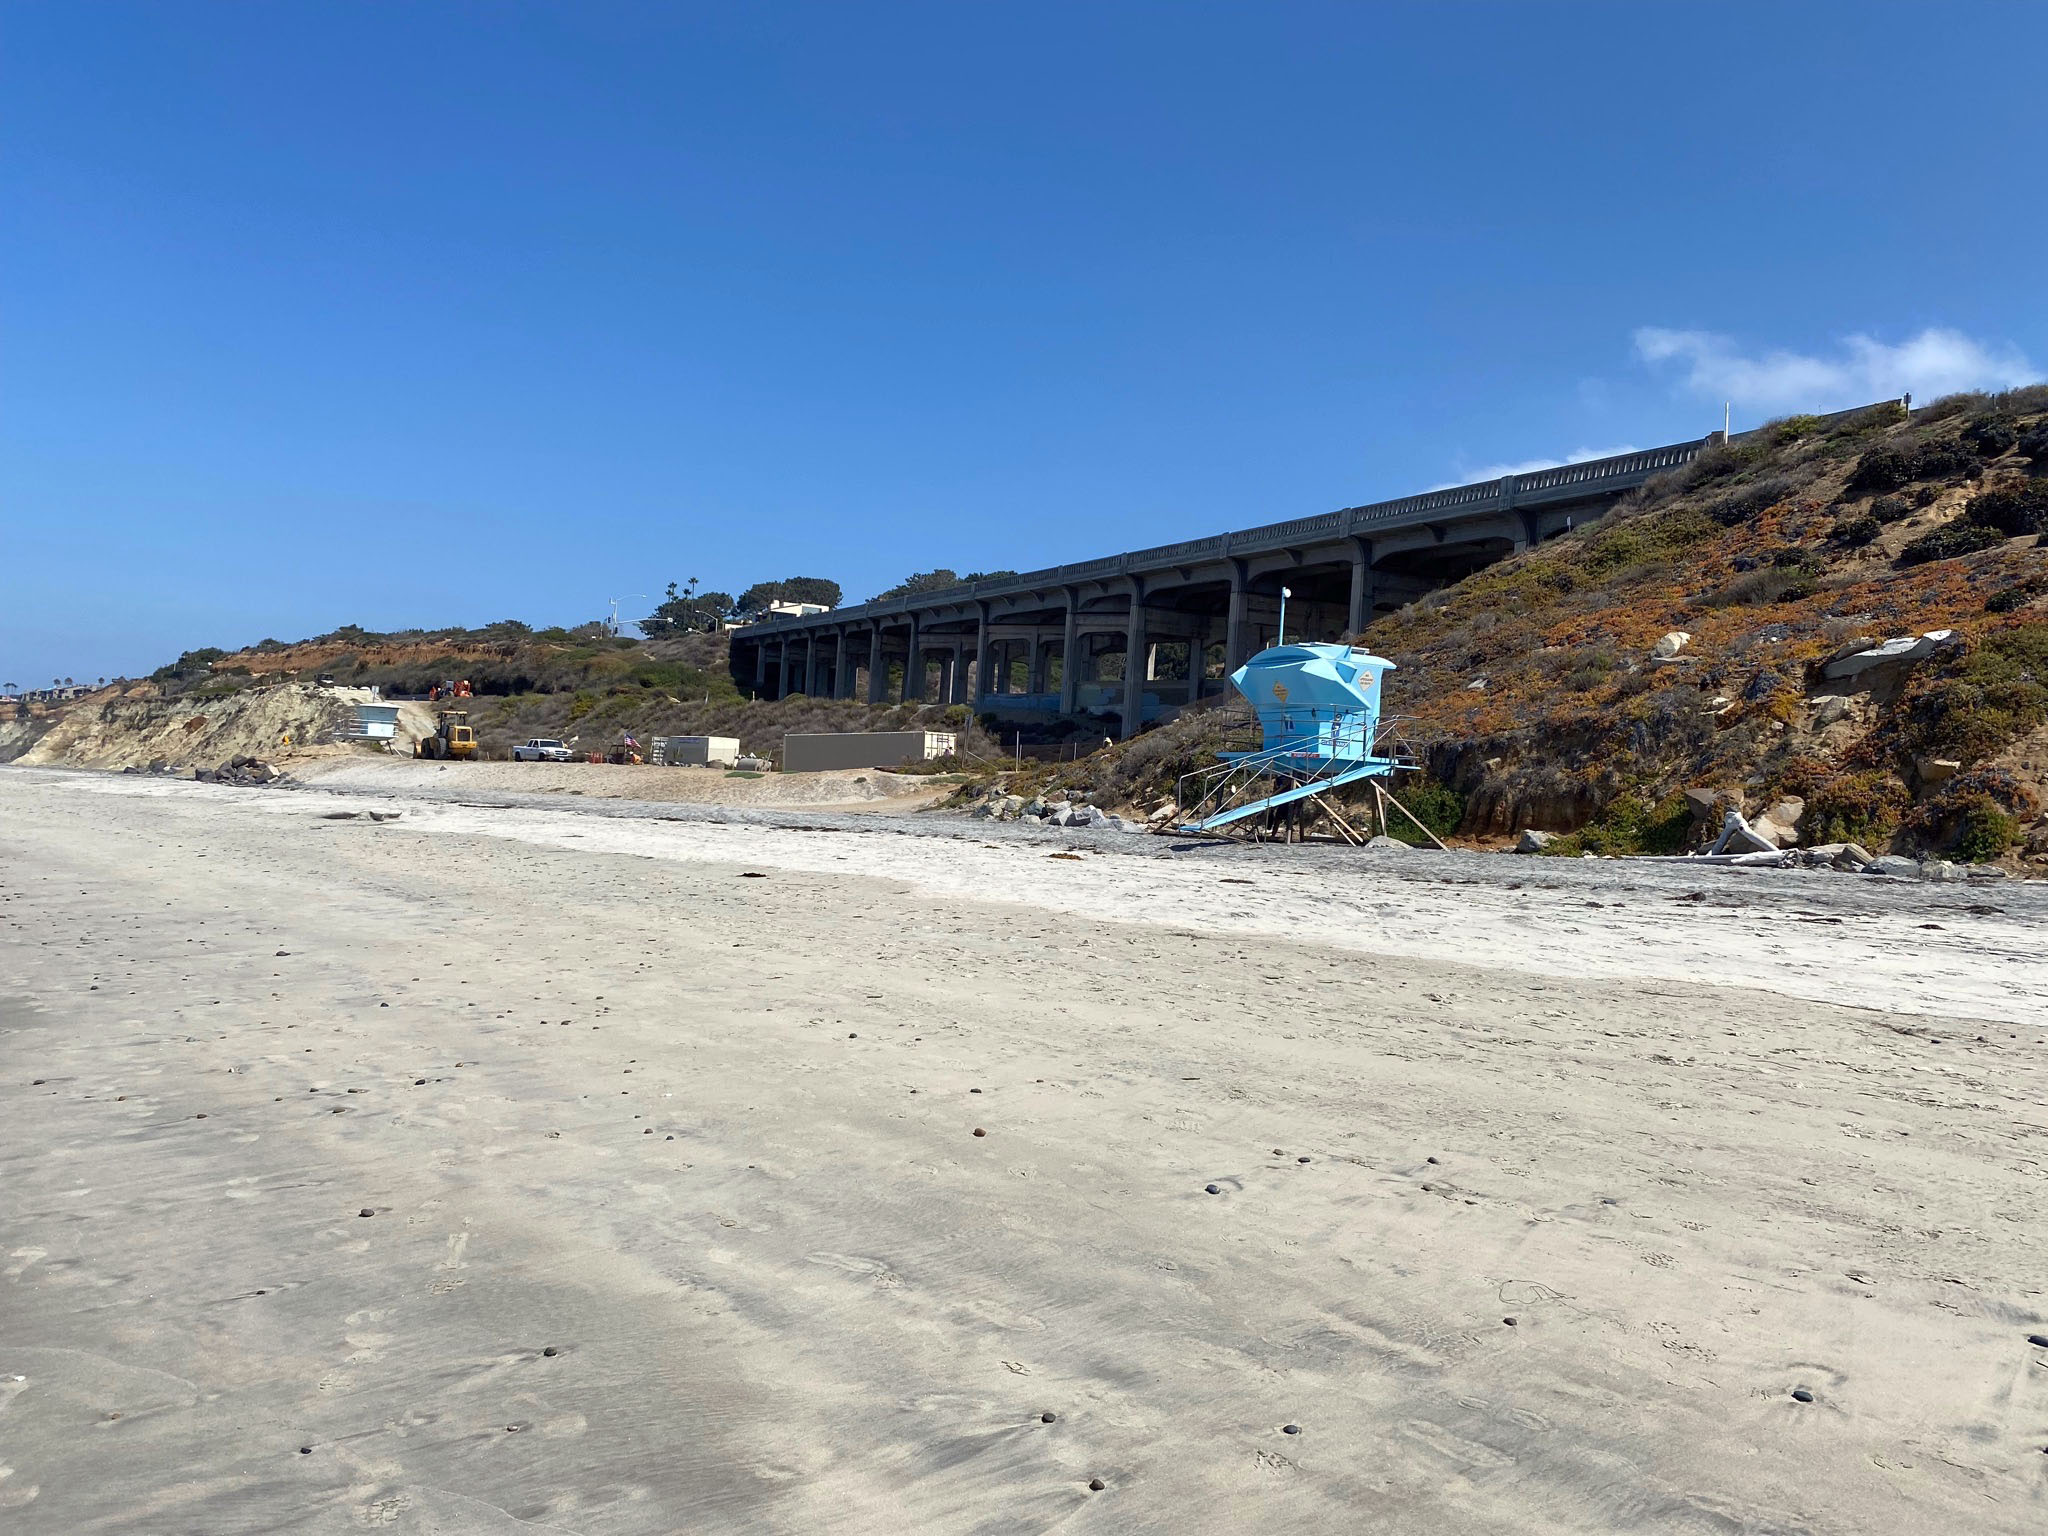
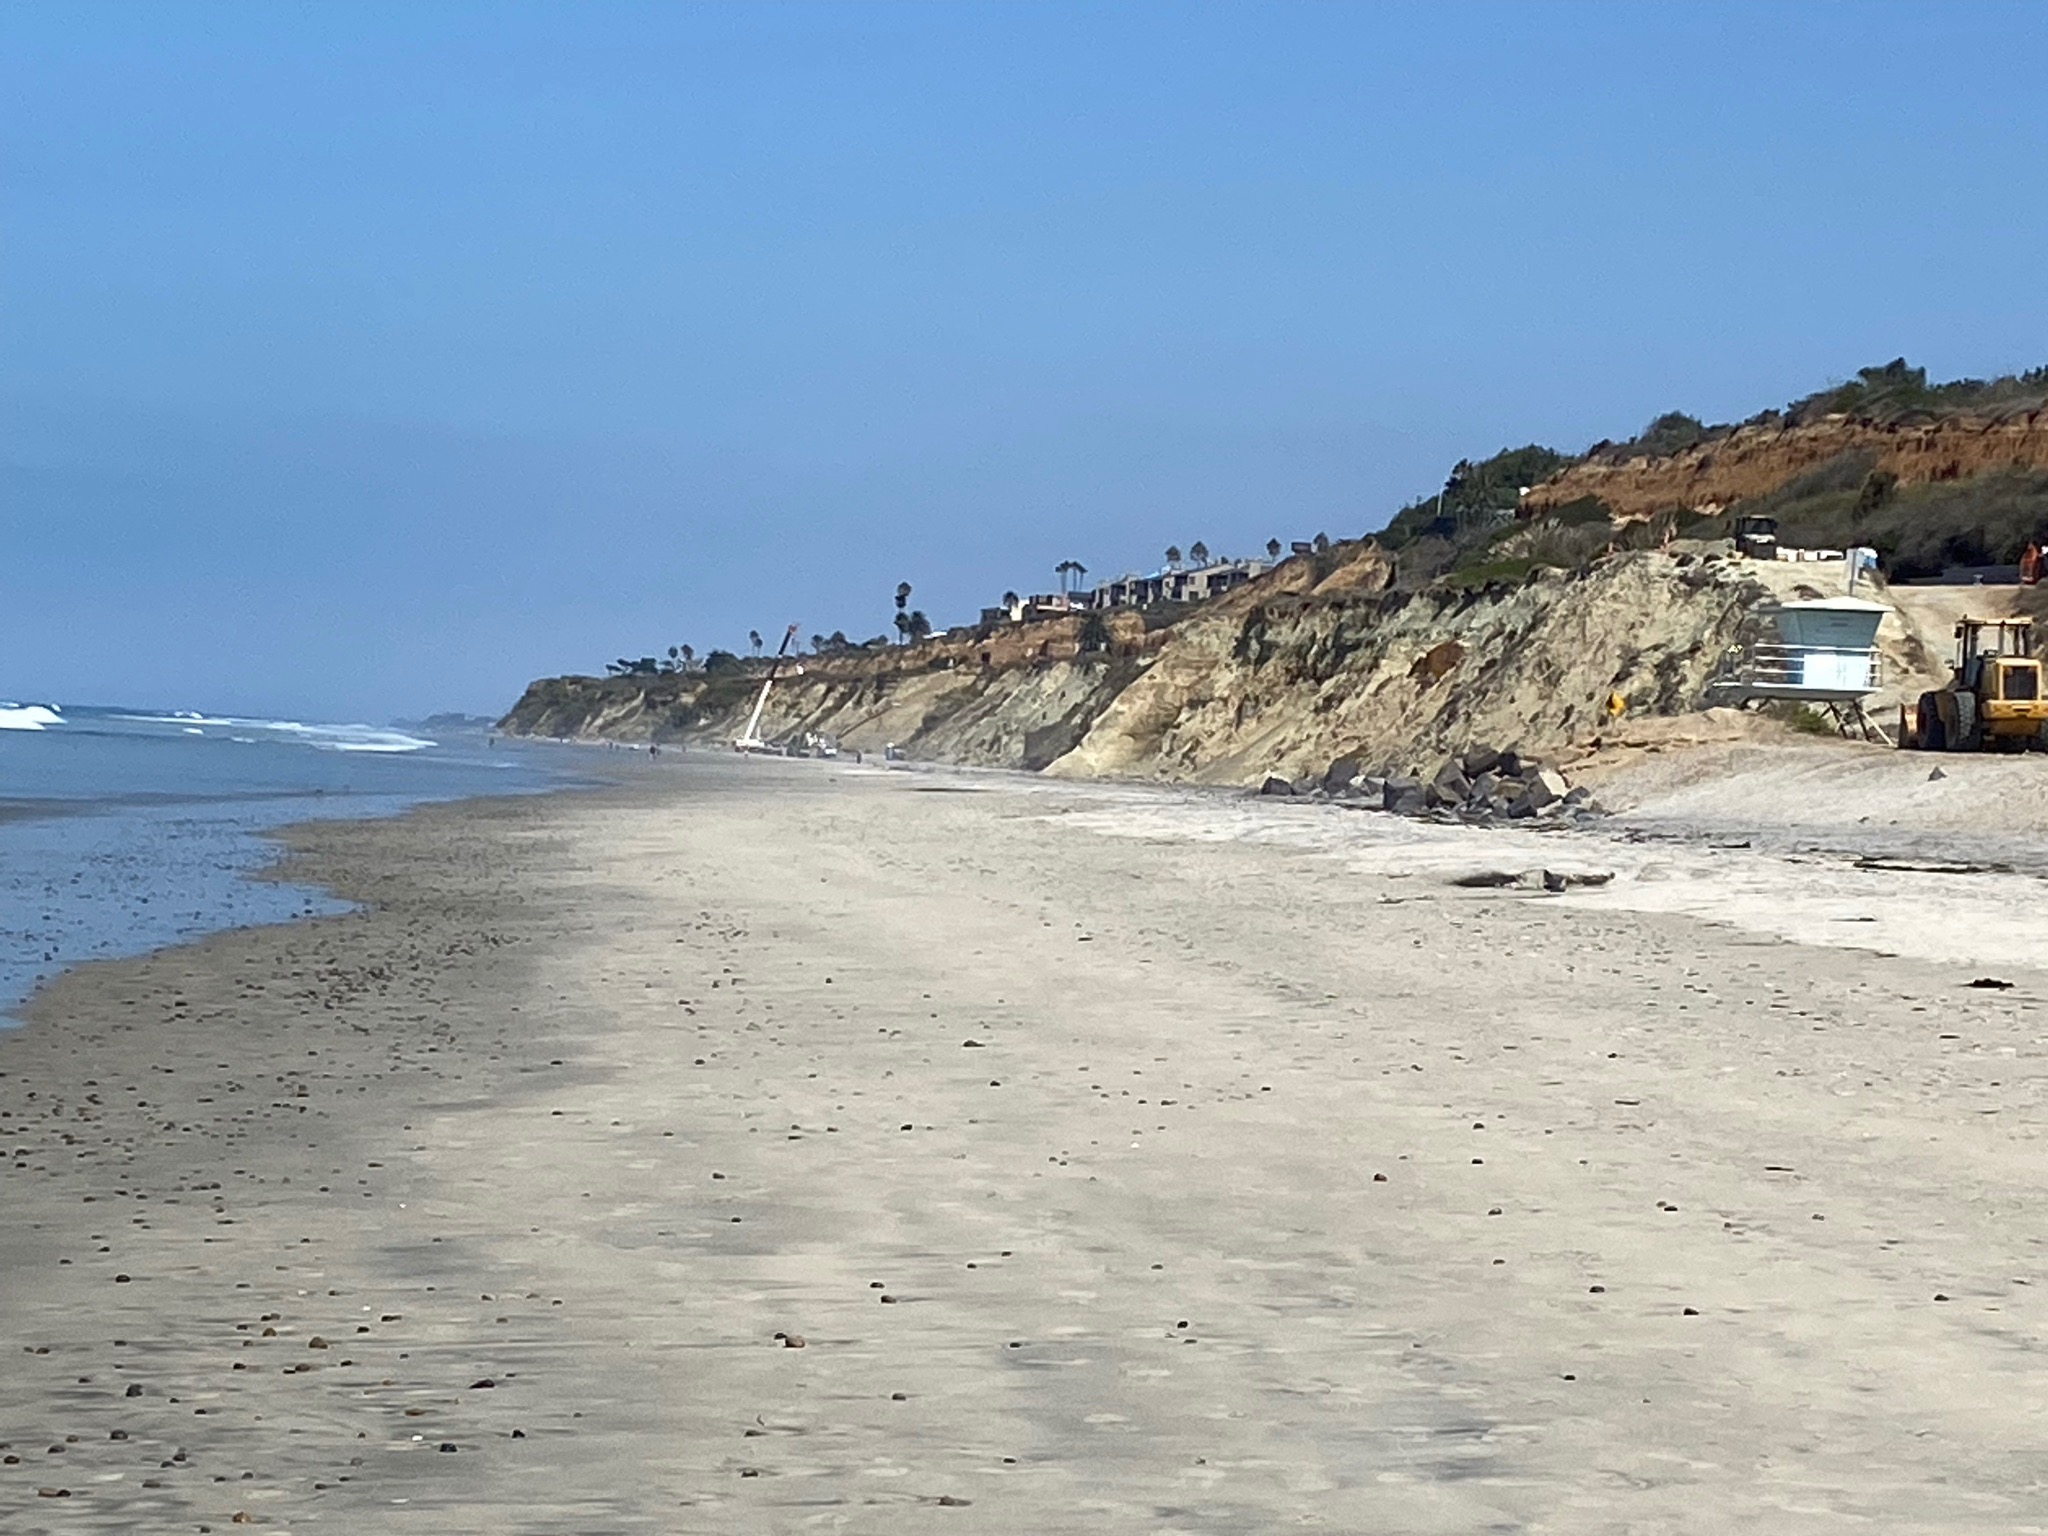
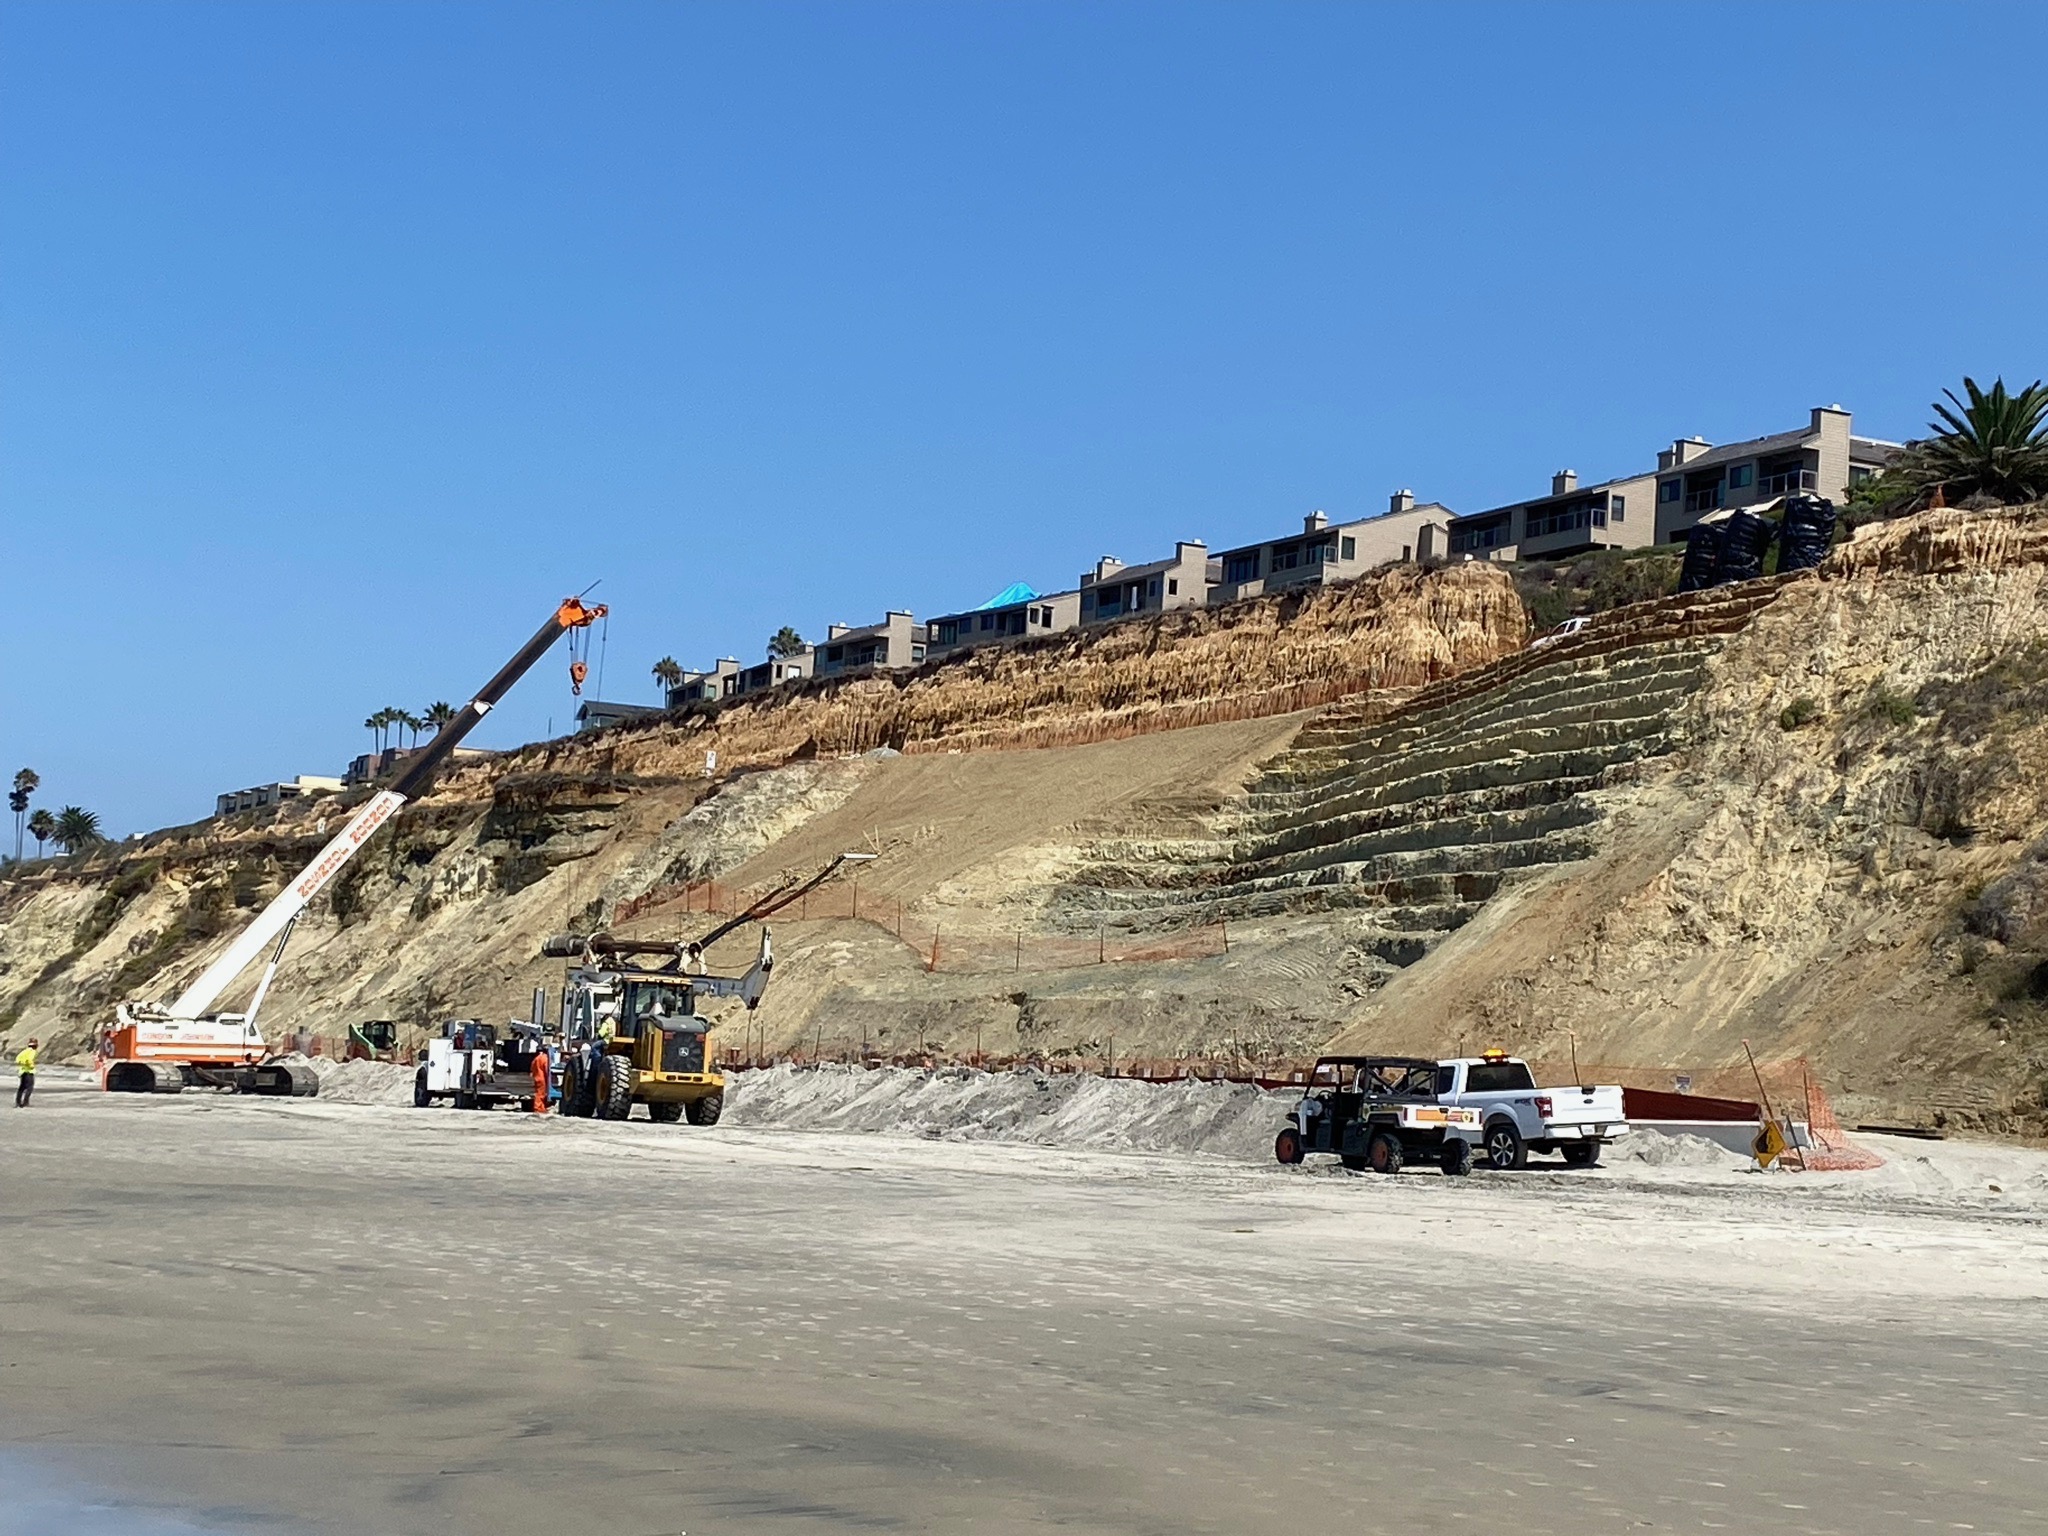
North Beach (Torrey Pines State Beach)North Beach is about a mile-long section of beach and sea cliffs north of the bridge over the tidal inlet to Peñasquitos Lagoon (Figure 186). This section of the state park beach is somewhat less visited than the park beach south of the bridge. The setting isn't quite as scenic or natural as the southern part of the park, partly because the coastal rail line cuts along a man-modified shelf on the sea cliff (Figures 187 and 188). In addition, a Delmar Heights housing development caps the northern end of the sea cliff, and part of the sea cliff is currently being modified with a sea wall to prevent erosion and landsliding impacting the rail line (Figure 189). However, because of the rail line and sea cliff, the beach is less accessible, and is therefore generally less traveled (Figures 190-192). North of the state park boundary the public beach is part of Del Mar South Beach Park (Figure 193). Sedimentary rocks exposed in the lower part of the sea cliff are part of the Del Mar Formation (Middle Eocene)(Figures 194 to 196). The sedimentary deposits consist of poorly consolidated, silty green shale with lighter-colored small to larger lens-shaped sand bodies that represents ancient submarine channel fill deposits. Figure 197 shows a series of clastic dikes extending downward from the base of a channel sandstone deposit. Features like this suggest that the underlying mudrock may have been experience subaerial exposure before sea level rose again and shallow marine channel sediment fill was deposited on top. |
|


Selected References and ResourcesAbbott, P. L., 1999, The Rise and Fall of San Diego: 150 Million Years of History Recorded In Sedimentary Rocks: Sunbelt Publications, San Diego, CA, 231 p.Beachapedia, 2018, State of the Beach/State Reports/CA/Beach Erosion: Beachapeida.org: http://www.beachapedia.org/State_of_the_Beach/State_Reports/CA/Beach_Erosion Brown, J.E., [~1996], Geologic Formations of Western San Diego County: Geiconsultants.com, 7 p. [no longer available online]. California Geological Survey, 2020, Data Viewer (Geologic Map of California): https://maps.conservation.ca.gov/#dataviewer. Givens, C.R., and Kennedy, M.P., 1979, Eocene molluscan stages and their correlation, San Diego area, California, IN Abbott, P.L., ed., Eocene depositional systems, San Diego, California; [field trip no. 18]: Geological Society of America Field Trip Guidebook, Joint Fall field trip of Society of Economic Paleontologists and Mineralogists, Pacific Section, and Geological Society of America, [92nd] annual meeting, San Diego, CA, November 8-9, 1979, no. 18, p. 81-95. Google Earth, [2020]: https://www.google.com/earth/ Hanna, M.A., 1926, Geology of the La Jolla quadrangle, California: University of California Publications in Geological Sciences, v. 16, no. 7, p. 187-246, (incl. geologic map, scale 1:62,500). Hertlein, L.G., and Grant, U.S., IV, 1939, Geology and oil possibilities of southwestern San Diego County: California Journal of Mines and Geology, v. 35, no. 1, p. 57-58. Imbrie, J., Hays, J.D., Martinson, D.G., McIntyre, A., Mix, A.C., Morley, J.J., Pisias, N.G., Prell, W.L., Shackleton, N.J., 1984, The orbital theory of Pleistocene climate: Support from a revised chronology of the marine δ18O record, in Berger, A., Imbrie, J., Hays, J., Kukla, G., and Saltzman, B., eds., Milankovitch and climate: Understanding the response to astronomical forcing: Dordrecht, D. Reidel Publishing Company, p. 269-305. Kennedy, G. L., 1973, A marine invertebrate faunule from the Lindavista Formation, San Diego, California: Transactions of the San Diego Society of Natural History, V. 17, no. 10, p. 119-127. Kennedy, M.P. and Moore, G.W., 1971, Stratigraphic relations of Upper Cretaceous and Eocene formations, San Diego coastal area, California: American Association of Petroleum Geologists Bulletin, v. 55, no. 5, p. 709-722. Kennedy, M.P. and Peterson, G.L., 1975, Geology of the San Diego Metropolitan Area, California: California Division of Mines and Geology, Bulletin 200, 56 p. (with geologic maps). Kennedy, M.P. and Tan, S.S., 2005, Geologic map of the San Diego 30' x 60' quadrangle, California: California Department of Conservation (see next reference). Kennedy, M.P. and Tan, S.S., 2008, Geologic map of the San Diego 30' x 60' quadrangle, California: California Geological Survey Regional Geologic Map No. 3., Map Scale: 1:100,000, https://ngmdb.usgs.gov/Prodesc/proddesc_84173.htm; with pamphlet: https://ca.water.usgs.gov/projects/sandiego/data/gis/geology/kennedy2008/RGM3_San_Diego_2008_Pamphlet.pdf. Kern, J.P., Stump, T.E., and Dowlen, R.J., 1971, An upper Pleistocene marine fauna from Mission Bay, San Diego. California. Trans. San Diego Society of Natural History Bulletin. 16, p. 329-338. Kern, J. Philip and Rockwell, Thomas K.,1992, Chronology and Deformation of Quaternary Marine Shorelines, San Diego County California: In, Quaternary Coasts of the United States: Marine and Lacustrine Systems, SEPM (Society for Sedimentary Geology) Special Publication No. 48, p. 377-382. Meldahl, K.H., 2015, Surf, Sand, and Stone: How Waves, Earthquakes, and Other Forces Shape the Southern California Coast. Oakland, CA: University of California Press, 222 p. Meldahl, K., [2019], Geologic Evolution of San Diego County's Coasts and Lagoons: Mira Costa Community College (fieldtrip report): http://h-m-herms.net/My%20Web/SELC-D/Geology/San_Diego_Coast%20(SEL%20docent%20version).pdf. Moore, G.W., 1972, Offshore extension of the Rose Canyon Fault, San Diego, California, IN Geological Survey Research 1972: U.S. Geological Survey Professional Paper, 800-C, p. C113-C116. Mueller, K., [2002?]. Origins of Coastal Uplift in San Diego and Orange Counties: Huge Blind Thrusts or Aseismic Rift Shoulder? USGS Research Grant, Final Report: Award Number 01HQGR0031: https://earthquake.usgs.gov/cfusion/external_grants/reports/01HQGR0031.pdf Muhs, Daniel R., Webmiller, J.F., Simmons, K.R., and York, L.L., 2004, Quaternary sea-level history of the United States: in The Quaternary Period in the United States, Gillespie, A.R. and Porter, S.C., Developments in Quaternary Science, v. 1, Elsevier Publ., p. 147-183. NOAA, 2020, Climatological Datasets: National Oceanographic and Atmospheric Administration (NOAA), National Centers for Environmental information: https://www.ncdc.noaa.gov/data-access/paleoclimatology-data/datasets. San Diego History Center, 2020, Timeline of San Diego History: https://sandiegohistory.org/archives/biographysubject/timeline/ Schulz, Marjorie, Lawrence, C, Muhs, D, Prentice, C., and Flanagan, S., 2018, Landscapes from the Waves—Marine Terraces of California: USGS Fact Sheet: https://pubs.usgs.gov/fs/2018/3002/fs20183002.pdf . Spratt, R.M. and Lislecki, L.E., 2016, A Late Pleistocene sea level stack: Climate of the Past, v. 12, p. 1079-1092. Stamm, N., 2000, U.S. Geological Survey, Geolex—Significant Publications: https://ngmdb.usgs.gov/Geolex/search. Stright, L. Stweart, J. Camion, K. and Graham, S., 2014, Geologic and seismic modeling of a coarse-grained deep-water channel reservoir analog (Blacks' Beach, Lajolla, California: AAPG Bulletin 98 (4), p. 695-728. Tan, S.S. and Kennedy, M.P., 1996, Geologic Maps of the Northwestern Part of San Diego County, California, Open File Report 96-02, California Division of Mines and Geology. Torrey Pines Association website [2020]: https://torreypines.org/. This website has a wealth of information not presented here, particularly about the wildlife biology, ecology, geology, and history and management of the Torrey Pines State Nature Preserve. U.S. Board on Geographical Names, U.S. Geological Survey, [2020], Domestic Names [This database provides names, coordinates, and elevations of named places]: https://www.usgs.gov/core-science-systems/ngp/board-on-geographic-names/domestic-names. |
| https://gotbooks.miracosta.edu/fieldtrips/torrey_pines/index.html | 9/24/2021 |