A Guide To Selected Locations and Features Along the Rose Canyon Fault Zone In The San Diego Area, CA |
A1
This website is an introductory guide to where to see the Rose Canyon Fault Zone in the San Diego area. Much recent attention has been generated by an assessment released by the California Earthquake Authority in 2020 entitled Rose Canyon Fault Earthquake Predictions. Earthquake geologists and engineers suggest in the report that "the fault is the biggest earthquake threat to San Diego, capable of earthquake of magnitude 6.9." The fault has been studied intently for over the past century in many ways by many people. The Selected Reference section below provides a variety of technical reports that provide details beyond what is presented here. Take earthquake preparedness seriously!
The Rose Canyon Fault Zone is the southern extension of the longer Newport‐Inglewood-Rose Canyon (NIRC) Fault Zone, a coastal system of interconnected strike-slip faults and is the easternmost part of the greater offshore Inner Continental Borderlands Fault System (Figure 1). Rose Canyon Fault Zone forms the local west boundary of the Santa Ana tectonic block, which is bounded on the east by the Elsinore Fault Zone. On an even larger scale, it is an active component of the Pacific‐North America plate boundary that is interconnected with the greater California Fault System (which includes the notoriously famous San Andreas Fault). The NIRC Fault Zone roughly follows the continental shelf margin and the inner continental slope from Los Angeles extending southward into northern Baja California. The fault zone come onshore at La Jolla Bay (Figure 2). From there, the fault (or series of fault strands) bends around the easts side of Mount Soledad (the large upwarp associated with La Jolla) and follows the canyon of Rose Creek southward along the eastern side of Mission Bay. From there it splays into a series of fault strands that run under San Diego, San Diego Bay, and Coronado Island before running offshore again.
The NIRC Fault Zone poses a significant hazard to coastal Southern California because of its close proximity to the most densely populated regions of San Diego, Orange, and Los Angeles counties and Tijuana, Mexico. In California law, Alquist-Priolo Earthquake Fault Zone Act of 1971 defines an active fault is one that has ruptured in the last 11,000 years. That date is a bit nebulous in reality because faults move in many ways and at different times and different places, sometime creeping slowly, or suddenly during an earthquake. Fault movements can trigger gravity-induced landsliding and slumping that can take place along fault zones. In any case, an active fault is one that has shown significant displacement during Holocene time. |
Click on images for a larger view. |

Fig. 1. Map showing the Newport-Inglewood-Rose Canyon Fault Zone.
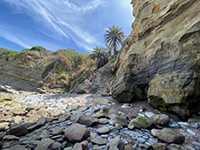
Fig. 2. Rose Canyon Fault (Mount Soledad Fault strand) exposed at La Jolla Bay.
|
A2
The Physical Characteristics of the Rose Canyon Fault Zone
For comparison, Figures 3 and 4 illustrate underground and surface features associated with fault zones (like the Rose Canyon Fault). The Rose Canyon Fault Zone includes a mix of right-lateral strike-slip faults, normal faults, and faults with oblique displacement. These faults range in size from small, local faults to larger fault strands that extend for many miles. There are multiple strands of the fault in some areas, and the fault zone is comprised of both recently active and older, inactive faults.
Estimates vary, but fault zone studies involving trenching and studies of geomorphic expression show that the Rose Canyon Fault displays an average displacement of less than about 2 mm/yr (Rockwell, 2010). This is minimal when compared with displacement along other California faults, including about 12 mm/yr for the San Jacinto Fault and about 25 mm for the San Andreas Fault (Bennett and others, 2004). Researchers have estimated that the Rose Canyon Fault shows a range of 4 to 6 kilometers of right-lateral displacement since the fault began to form in Pliocene time, roughly 4 million years ago. In contrast, other faults display much greater displacement, such as illustrated by the offset of the Miocene-age Pinnacles-Neenach volcanic field by the San Andreas Fault. The volcanic field was split by the fault when it formed and the two halves have moved about 195 miles apart by strike-slip displacement.
Figure 5 is a map of the Rose Canyon Fault Zone and other earthquake faults in the onshore San Diego area that show evidence of rupture or displacements displacements in Quaternary and Holocene time. The most active strands of the fault zone display evidence of rupture in Holocene time, entitling them to the name of earthquake faults - faults with the capacity to generate damaging earthquakes.
Although it may come as a bit of relief to know that the Rose Canyon Fault appears to be not as active as other major faults in California, the risk of earthquake-related catastrophe is quite real, and is compounded by the problem that many millions of people now live along the NIRC Fault Zone corridor. In addition, a major earthquake along the fault zone during strong wildfire or flood conditions could result in major catastrophe. Figure 6 is a map of earthquake epicenters (with earthquake magnitudes greater than 1.5) for the years of 1970 to 2010 in Southern California. Although it shows active faults, it also show that some fault zones and either inactive (having released stored energy from a past earthquake) or is locked (building up to a potential earthquake). Note on the map that there was very little earthquake activity along the NIRC Fault Zone.
However, several large earthquakes have occurred associated with coastal borderland faults that have been felt throughout the SoCal region. It should be noted that in 1933 the magnitude 6.4 Long Beach earthquake on the Newport-Inglewood Fault killed 115 people and caused an estimated $40 million in damage. For comparison, within 6 days in February 1956 in San Miguel in northern Baja California, three strong earthquake (magnitude 6.8, 6.4, and 6.3) occurred on a coastal borderlands fault similar to the Rose Canyon Fault. The San Diego earthquake of 1862 has been estimated at about a magnitude 6 event that resulted in some surface rupture and moderate damage in the Old Town area and produced a small tsunami in San Diego Bay. Earthquake trench studies along the fault zone suggest that a large event happened in the mid-1700s and three older event happened in the last 3300 years with the largest about A.D. 1300 (Singleton and others, 2019). These authors also suggest that the recurrence interval of ~700 years, (somewhat alarming in that the last big one was ~ 700 years ago). Will one happen today or soon? Who knows? All we can do is be prepared as best we can. |
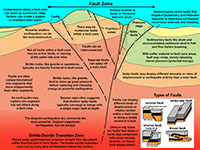
Fig. 3. Characteristics of fault zones in cross section with different kinds of faults and features illustrated. |
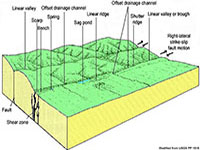
Fig. 4. Landscape features (geomorphic expression) of strike-slip fault systems affecting stream valleys. |
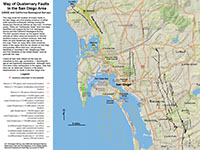
Fig. 5. Faults in the San Diego area that show displacements during Quaternary or Holocene time. |
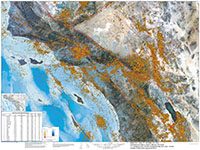
Fig. 6. USGS map of Southern California showing epicenters of earthquakes recorded 1970 to 2010. |
|
A3
Field Trip Destinations To See the Rose Canyon Fault in the San Diego Area
The discussions below describe outdoor destinations to observe coastal and landscape features associated with the Rose Canyon Fault Zone. This is gallery including maps and photographs taken in the spring of 2021. The image tour starts in the north at La Jolla Bay and works its way south along the fault zone with selected field-trip stops destinations including the top of Mount Soledad, Old Town, Fault Line Park in San Diego, Coronado Tidelands Park, and Hotel del Coronado areas.
|
A4
Rose Canyon Fault Zone Along La Jolla Bay
The Rose Canyon Fault Zone comes onshore in La Jolla Bay. There area is riddled with faults that show varying degrees of offset. Most of those that are visible in the sea cliffs display only minor offset except for the largest exposed in the Corner of the bay (Figure 7). Another active strand of fault shown on the Alquist-Priolo Fault Zone maps for the area is hidden beneath the sand of La Jolla Shores Beach. It is not visible where parkland, roads, and development construction removed any surface expression of the fault. The discussions below review ways to see Rose Canyon Fault Zone features include a casual walk along the Coast Walk Trail. Other ways to see faults and geologic include features commercial underground tour of a sea cave from The Cave Store, or a kayaking or snorkeling trip to along the sea cliffs to see the famous La Jolla sea caves. Ways to access seeing the variety of geologic features is discussed below. |
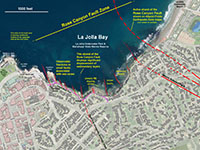
Fig. 7. Faults and coastal features map in the La Jolla Bay area. |
A5
Geology of the Rose Canyon Fault Zone In La Jolla
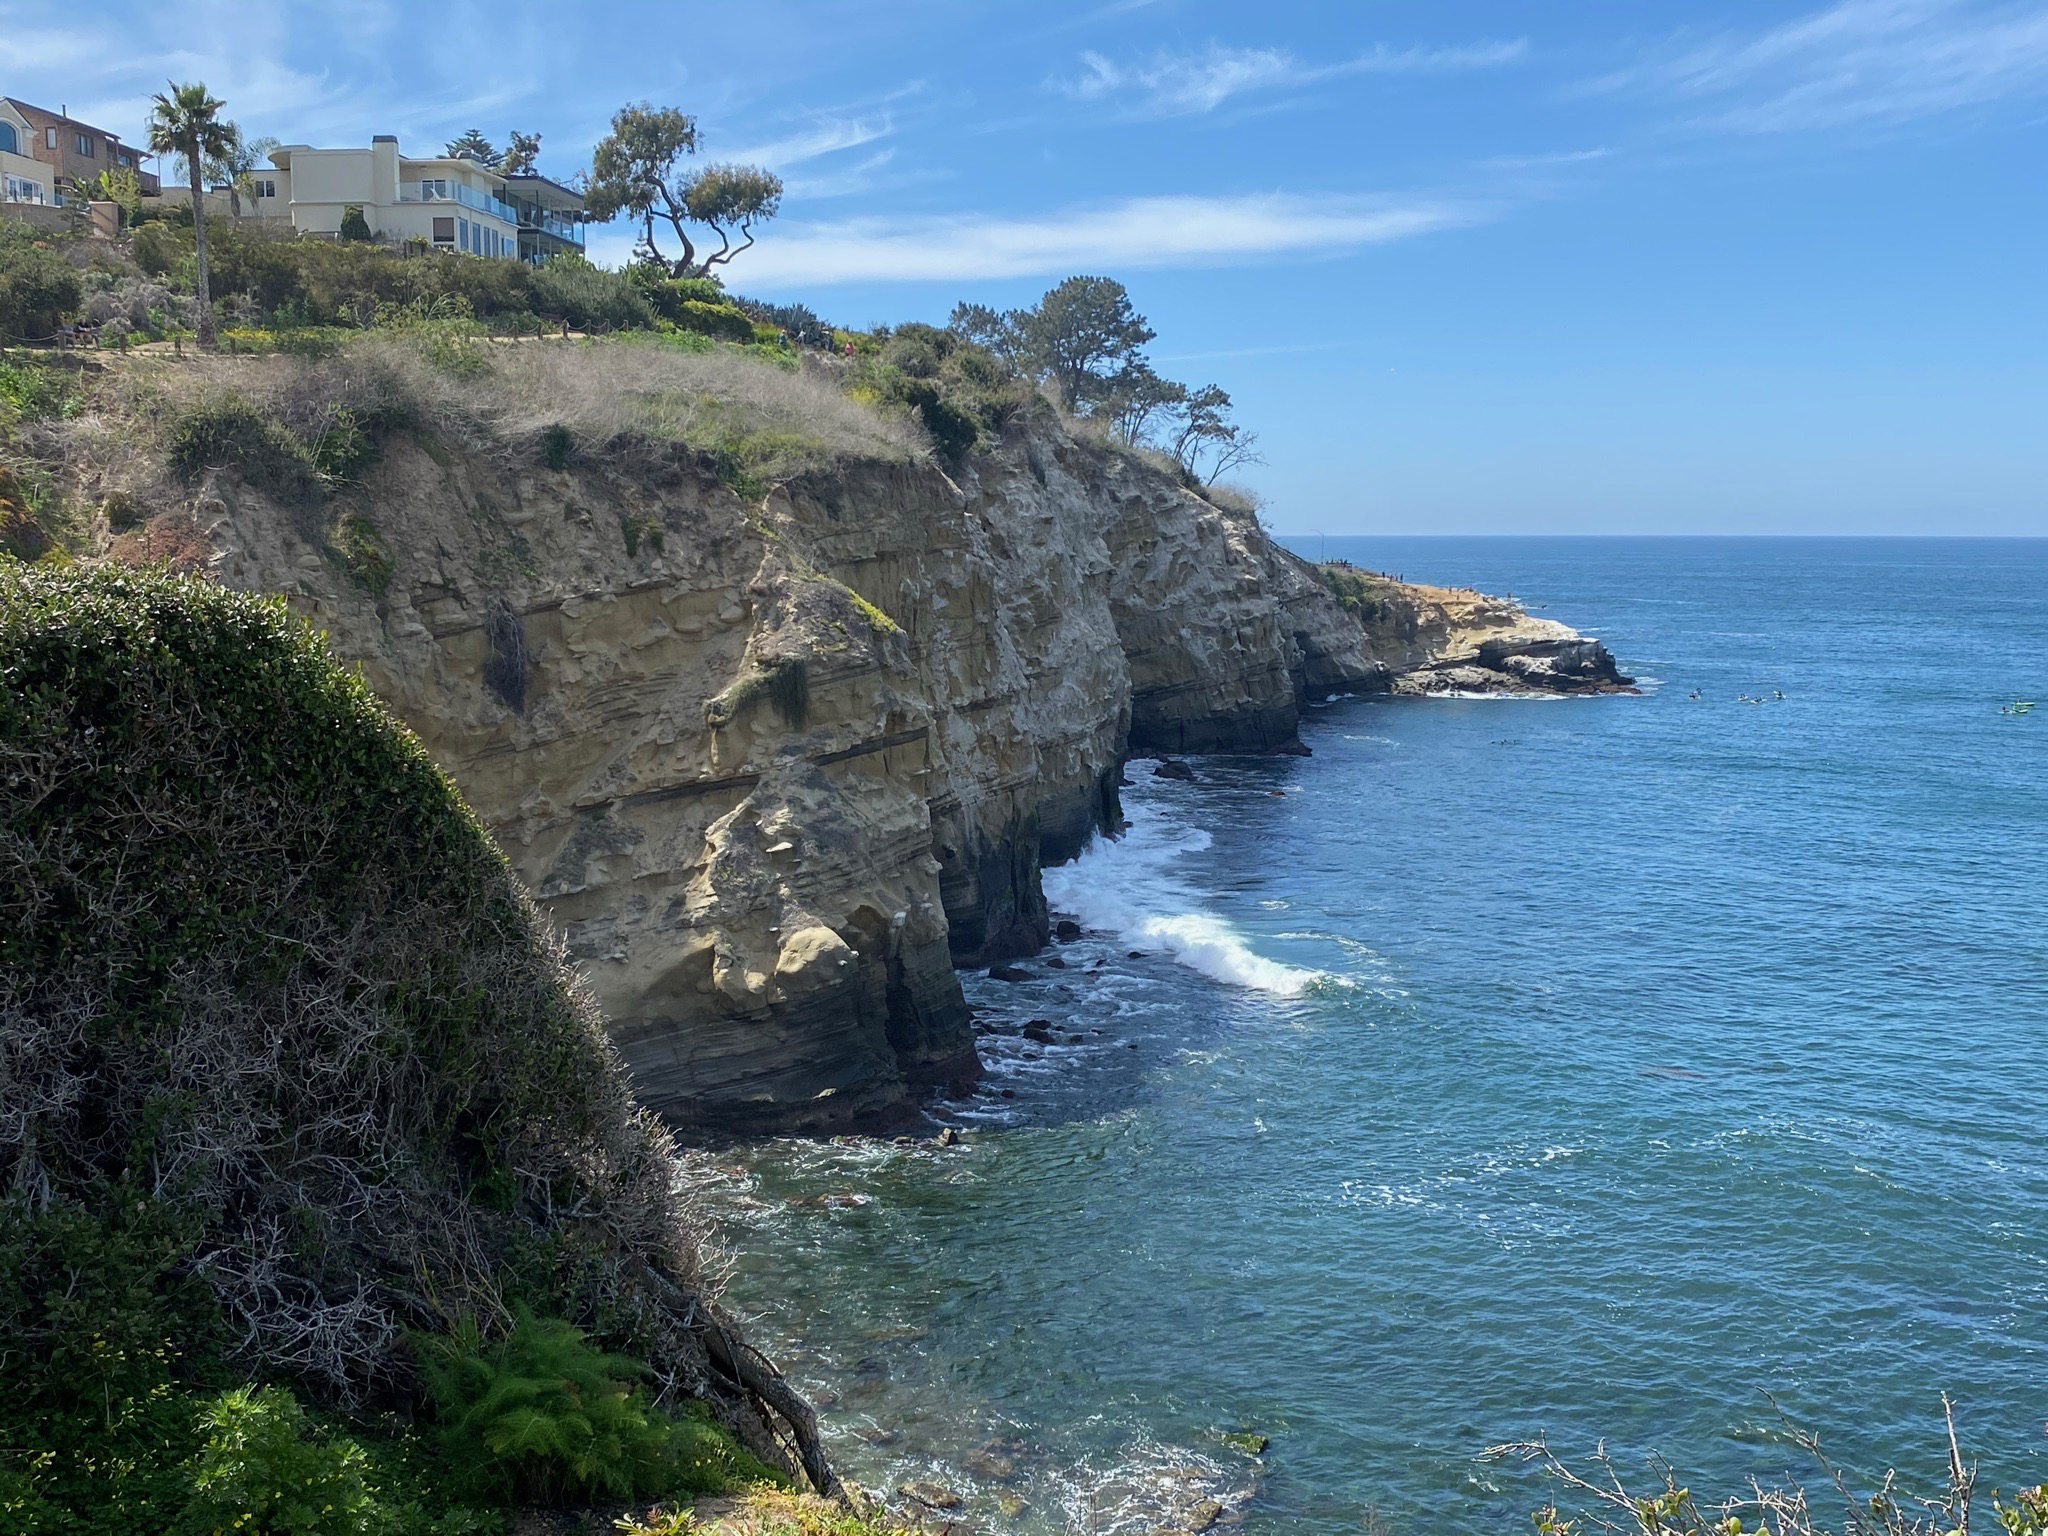
La Jolla partly owes its amazing coastal landscape to the Rose Canyon Fault, or rather the fault zone. The fault zone is actually about a half-mile wide when you include the number of small fault, fractures, and folded strata impacted by motion along the major fault strands. It is difficult to pinpoint where the zone begins and ends because, other than in the sea cliffs, the faults are not exposed or are poorly defined by surficial landscape features. From La Jolla Bay, the fault zone crosses through and along the northeast side of Mount Soledad, then follows Rose Canyon southward to the eastern shore region of Mission Bay. Figure 8 shows the location of the main earthquake faults in the La Jolla area. Figure 9 is a geologic map that show addition faults and geologic structures in the same area as the previous map. The well-exposed bedrock in the sea cliffs along La Jolla Bay provides an exception location to see detailed characteristics of the fault zone. The largest exposed fault known as the Rose Canyon Fault is exposed in the Corner of the bay in the vicinity of the Devil's Slide. Numerous other small, local faults and fracture zones are exposed in the sea cliffs distrubuted around the south end of the bay.
The bedrock exposed around La Jolla Point and in the sea cliffs around the La Jolla Bay are part of the Point Loma Formation. The formation consists of layers of buff-colored, thin-to-thick layers of sandstone interbedded with gray-to black siltstone, and gray shale. Further inland around Mount Soledad, the rock formation contains massive beds of conglomerate. These rocks formed from sediments deposited in offshore submarine channels and seafloor fan environments, and as underwater landslide deposits. They accumulated during the Late Cretaceous Period — Campanian to Maastrichtian Epochs, roughly 80 to 70 million years ago, based on biostratigraphic dating of mollusks and microfossils preserved in the rocks. The measured thickness of the formation is about 400 meters but only a portion is exposed in any sea cliff location. The Point Loma Formation crops out all along the coast of the Point Loma Peninsula, around Point La Jolla, and along the sea cliffs around southern La Jolla Bay. these layers are shown as shades of gray and green on the geologic map.
South of Point La Jolla the exposed layers of the Point Loma Formation are gently dipping at about 5 to 15 degrees mostly to the east. At Point La Jolla and along La Jolla Bay the layers dip to the south at an increasing angle from about 20 to 30 degrees to a maximum of about 50 degrees in the middle of the broad fault zone.
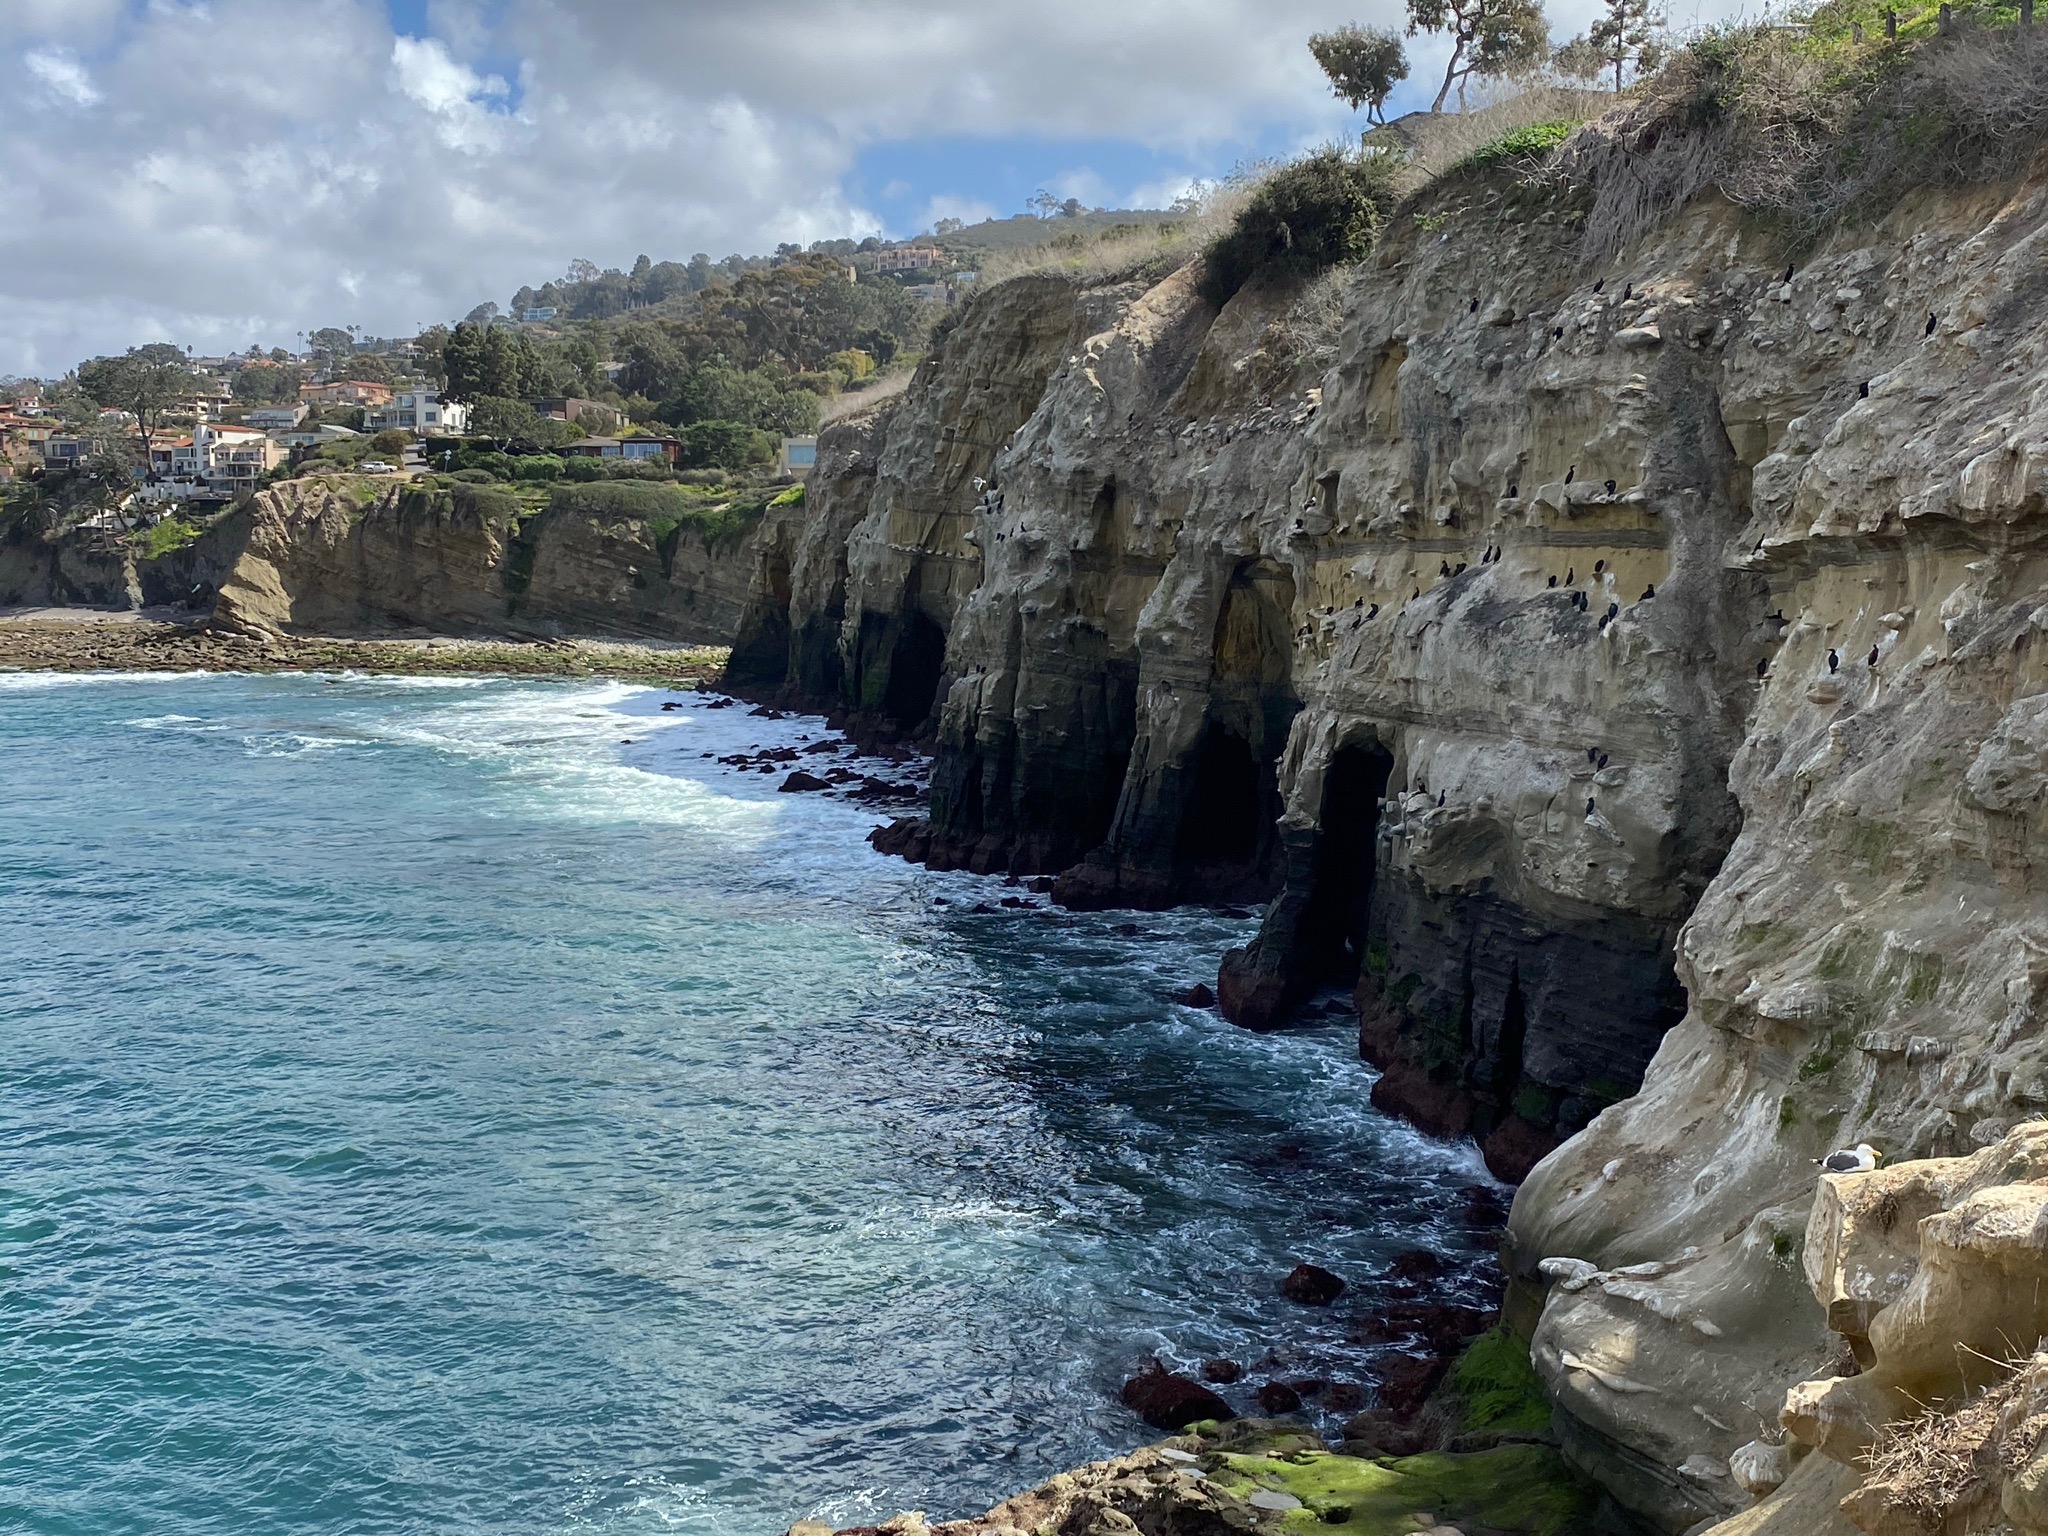
Fractures and small faults (with minimal offset) begin to appear in the sea cliffs between La Jolla Cove and Goldfish Point and in the La Jolla Sea Caves area. Wave erosion along the faults and fractures are the origin of the numerous sea caves in the sea cliffs.
The Point Loma Formation is unconformably overlain by sedimentary rocks of Eocene age, roughly 40 to 45 million years in age. These rocks are well exposed in the massive sea cliffs north of Scripps Pier, along Blacks Beach, and Torrey Pines Sate Beach (Figure 10). On Mount Soledad, these rocks are given names including Scripps Formation and Ardath Shale within the La Jolla Group. Rocks of Eocene age are shown as color brown on the geologic map where they occur at or near the surface in the La Jolla area.
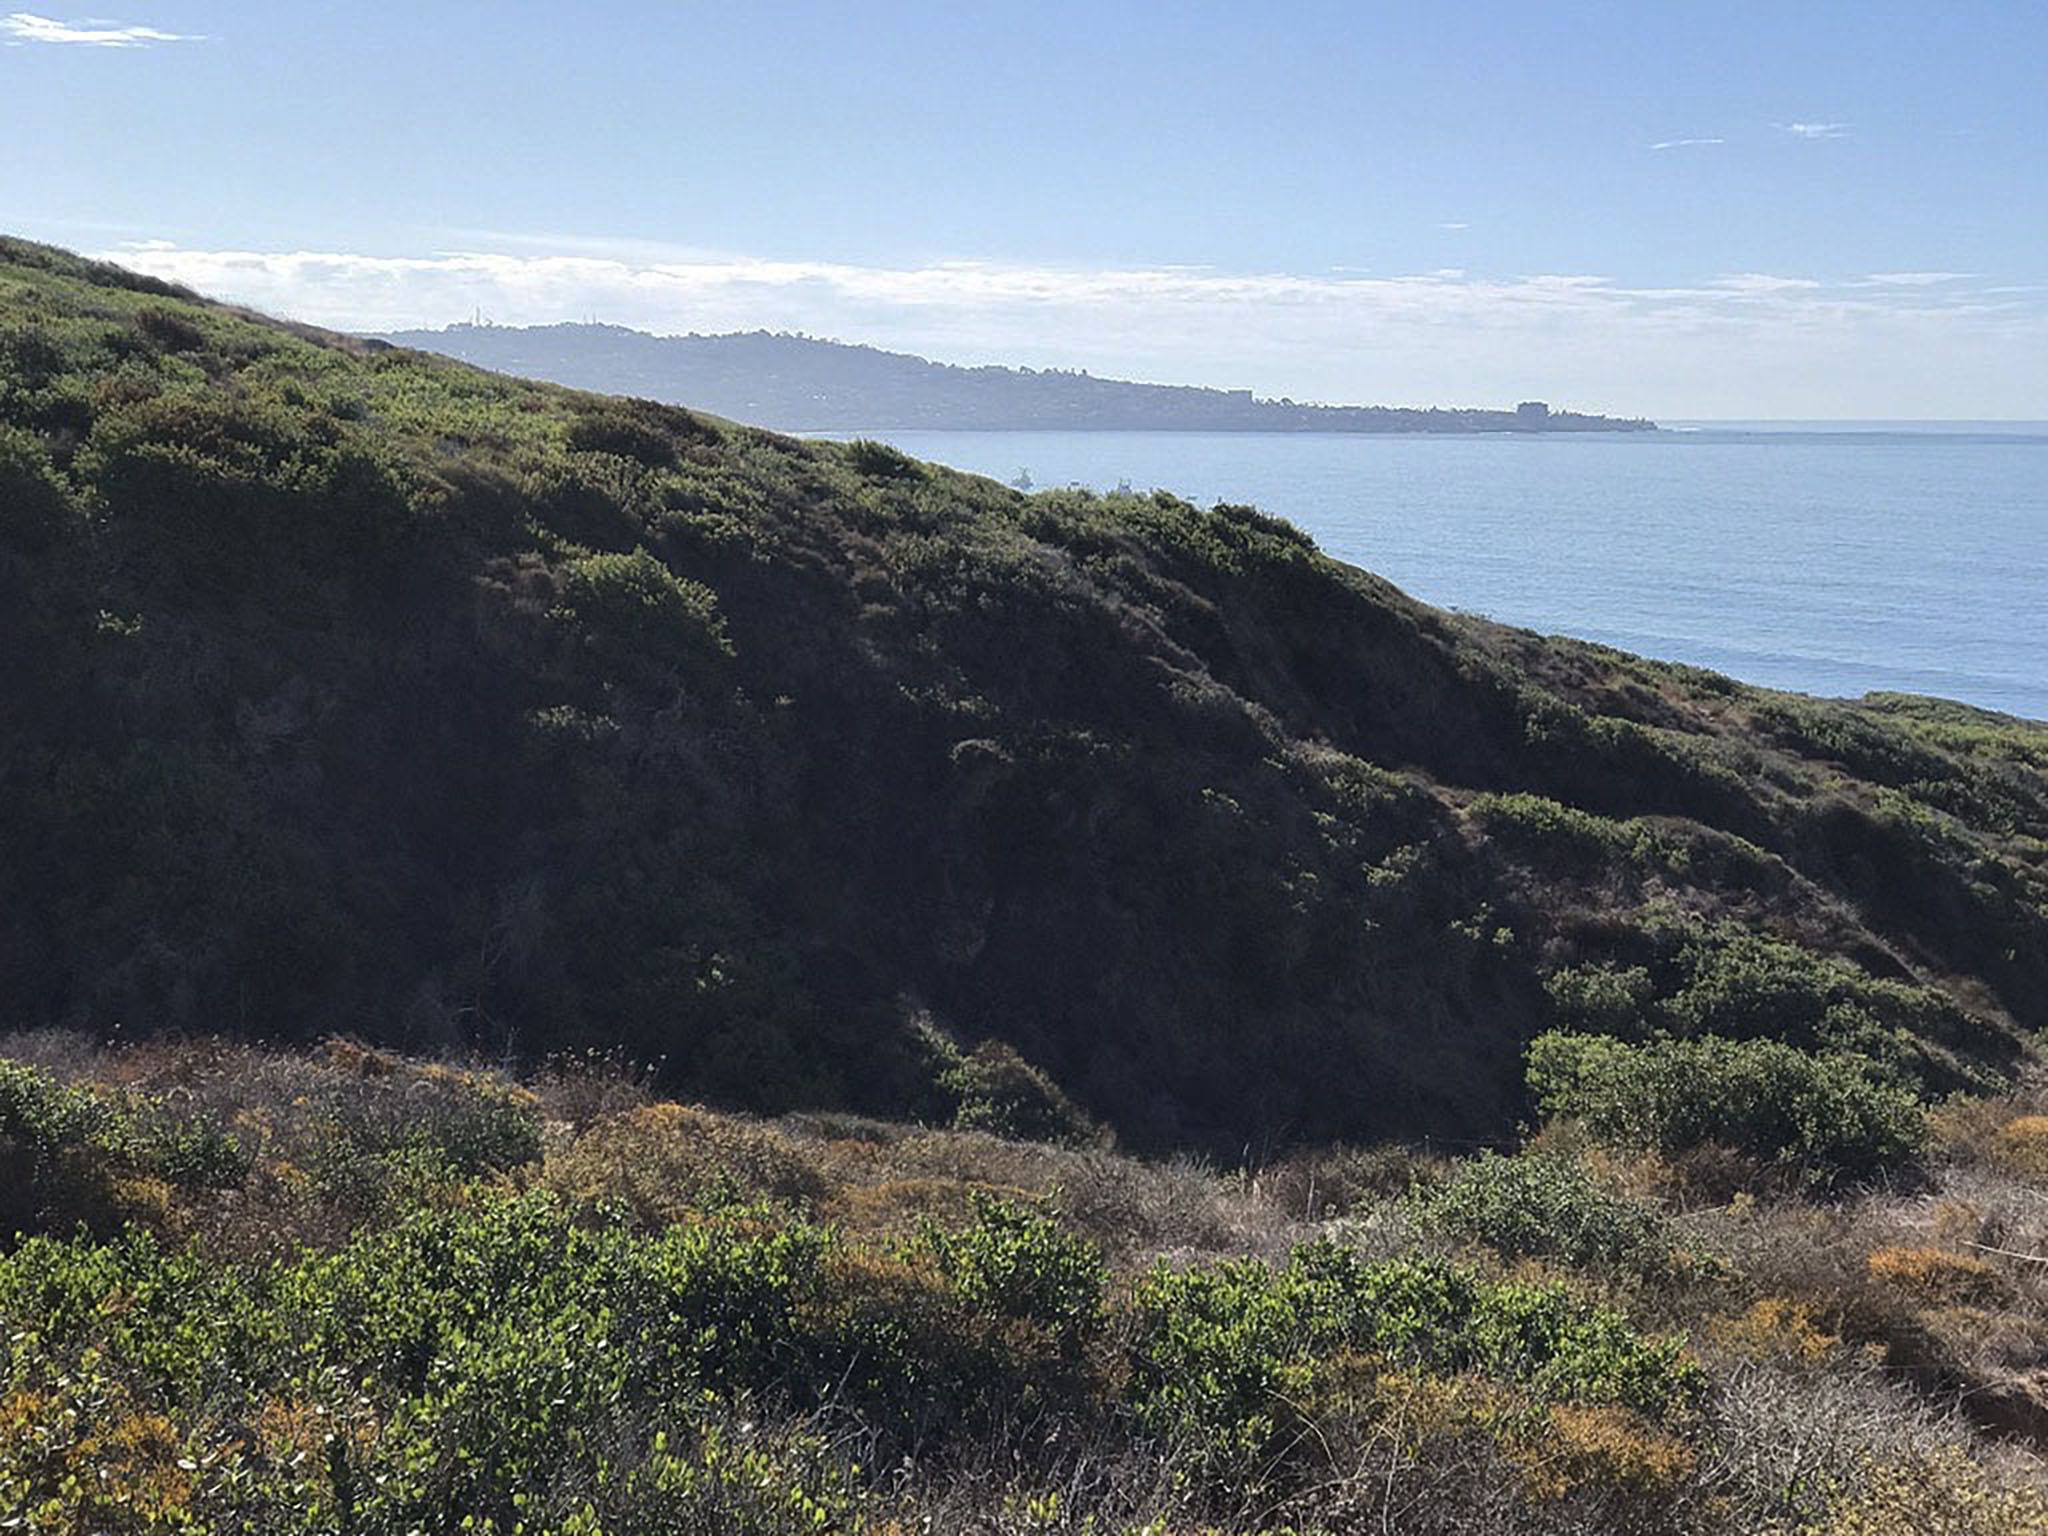
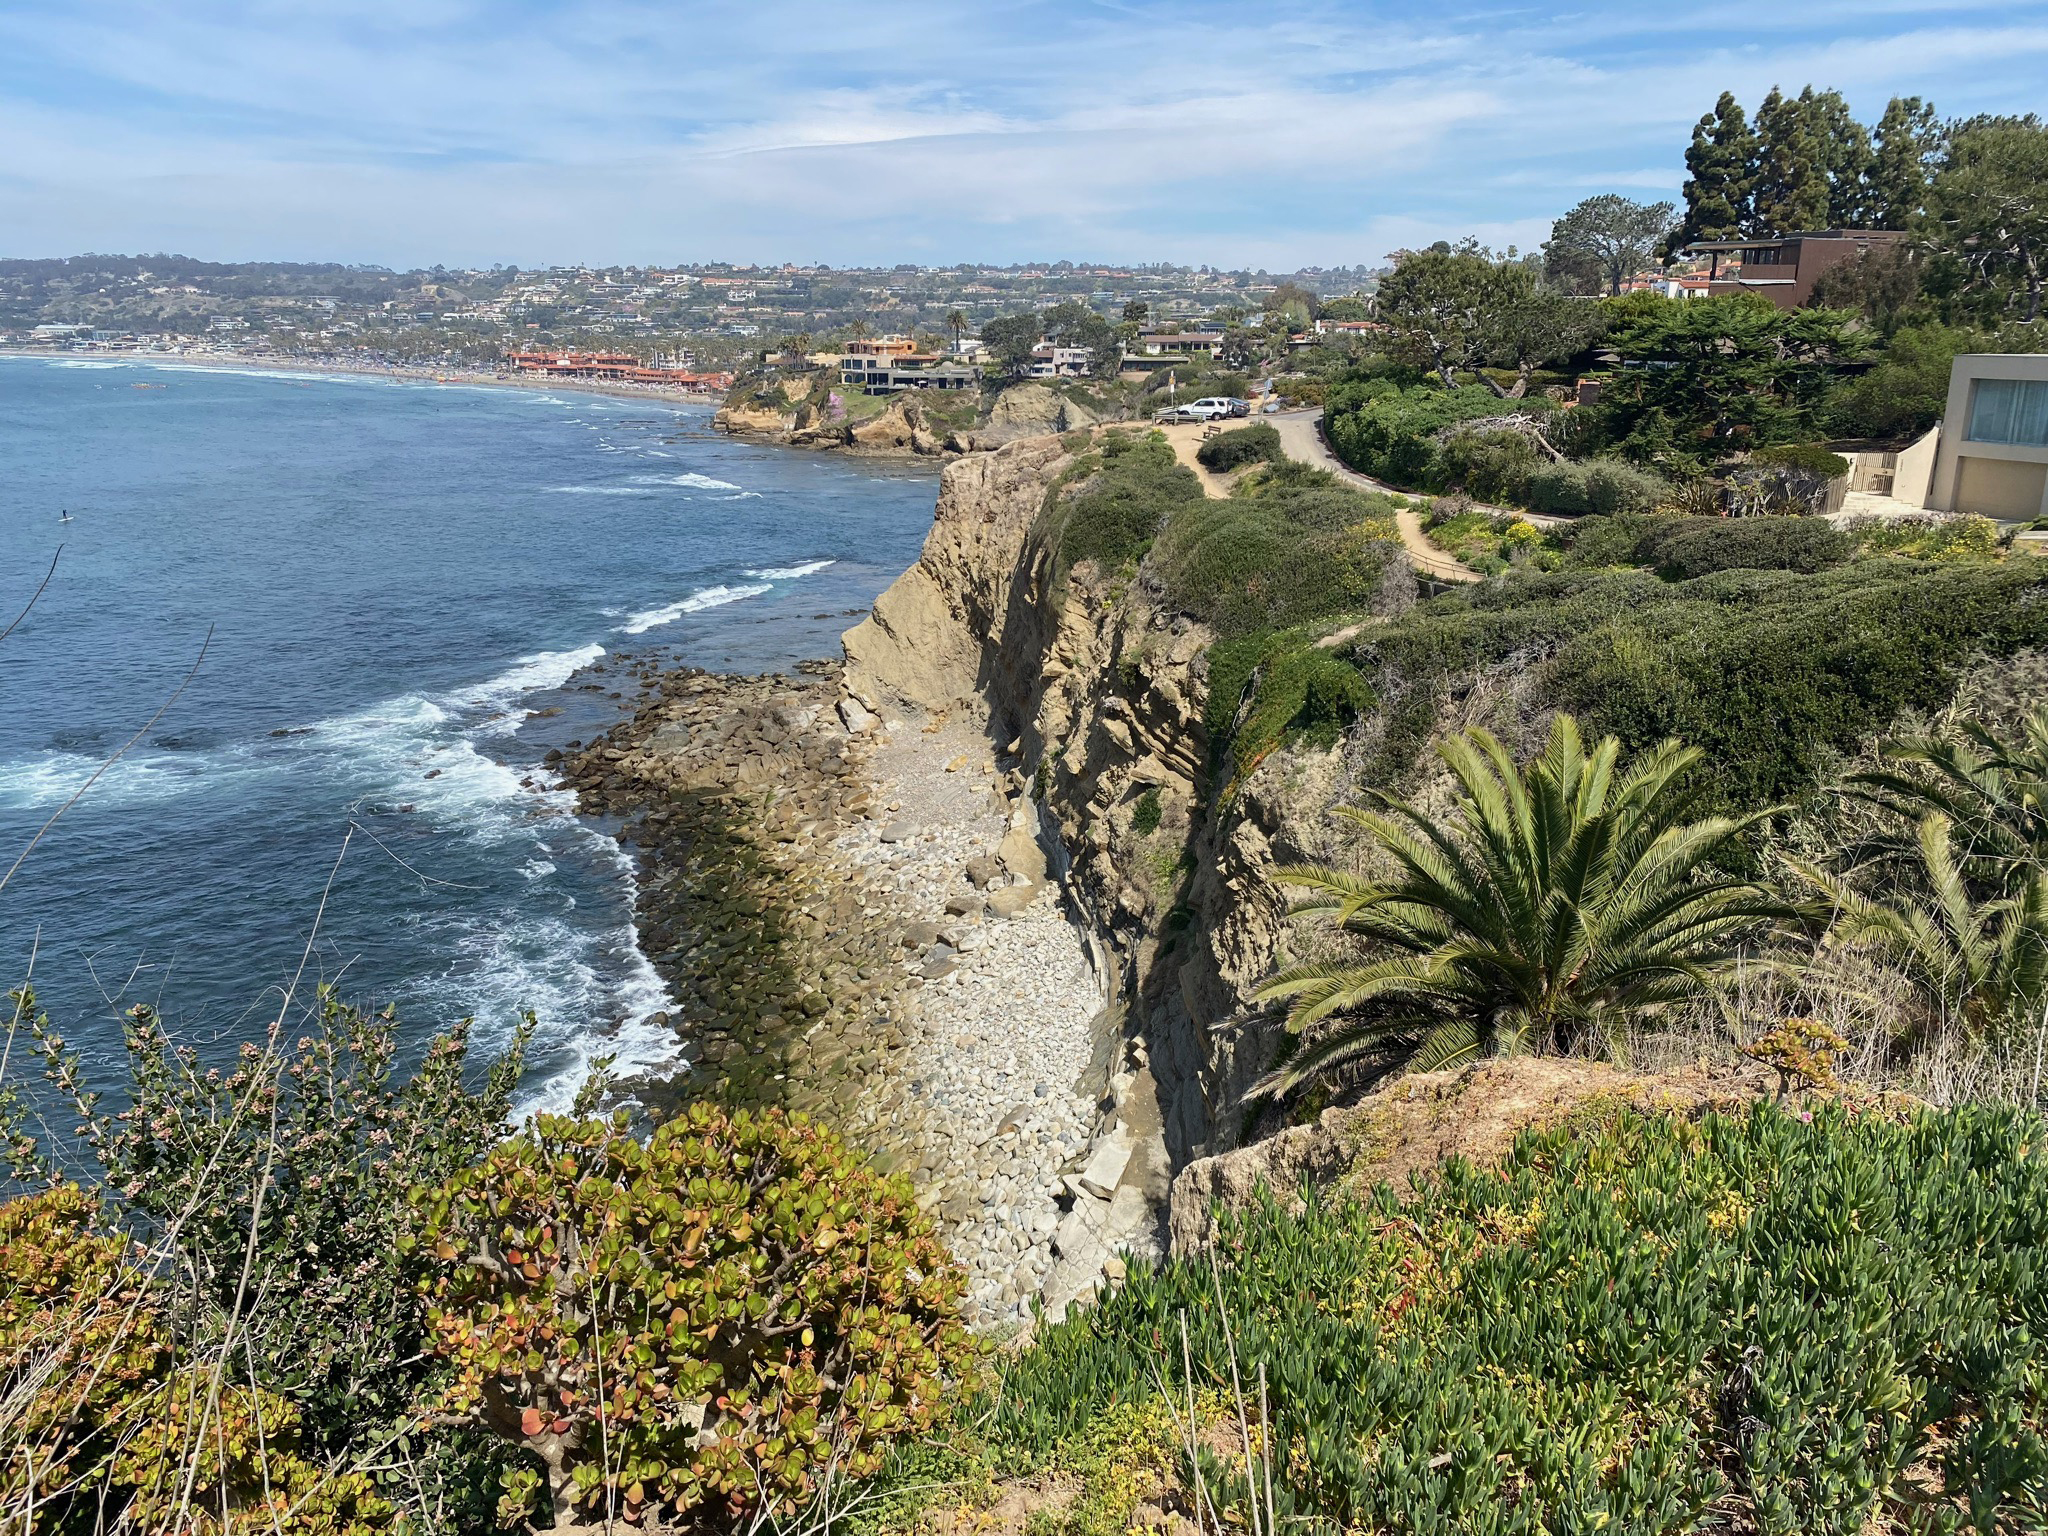
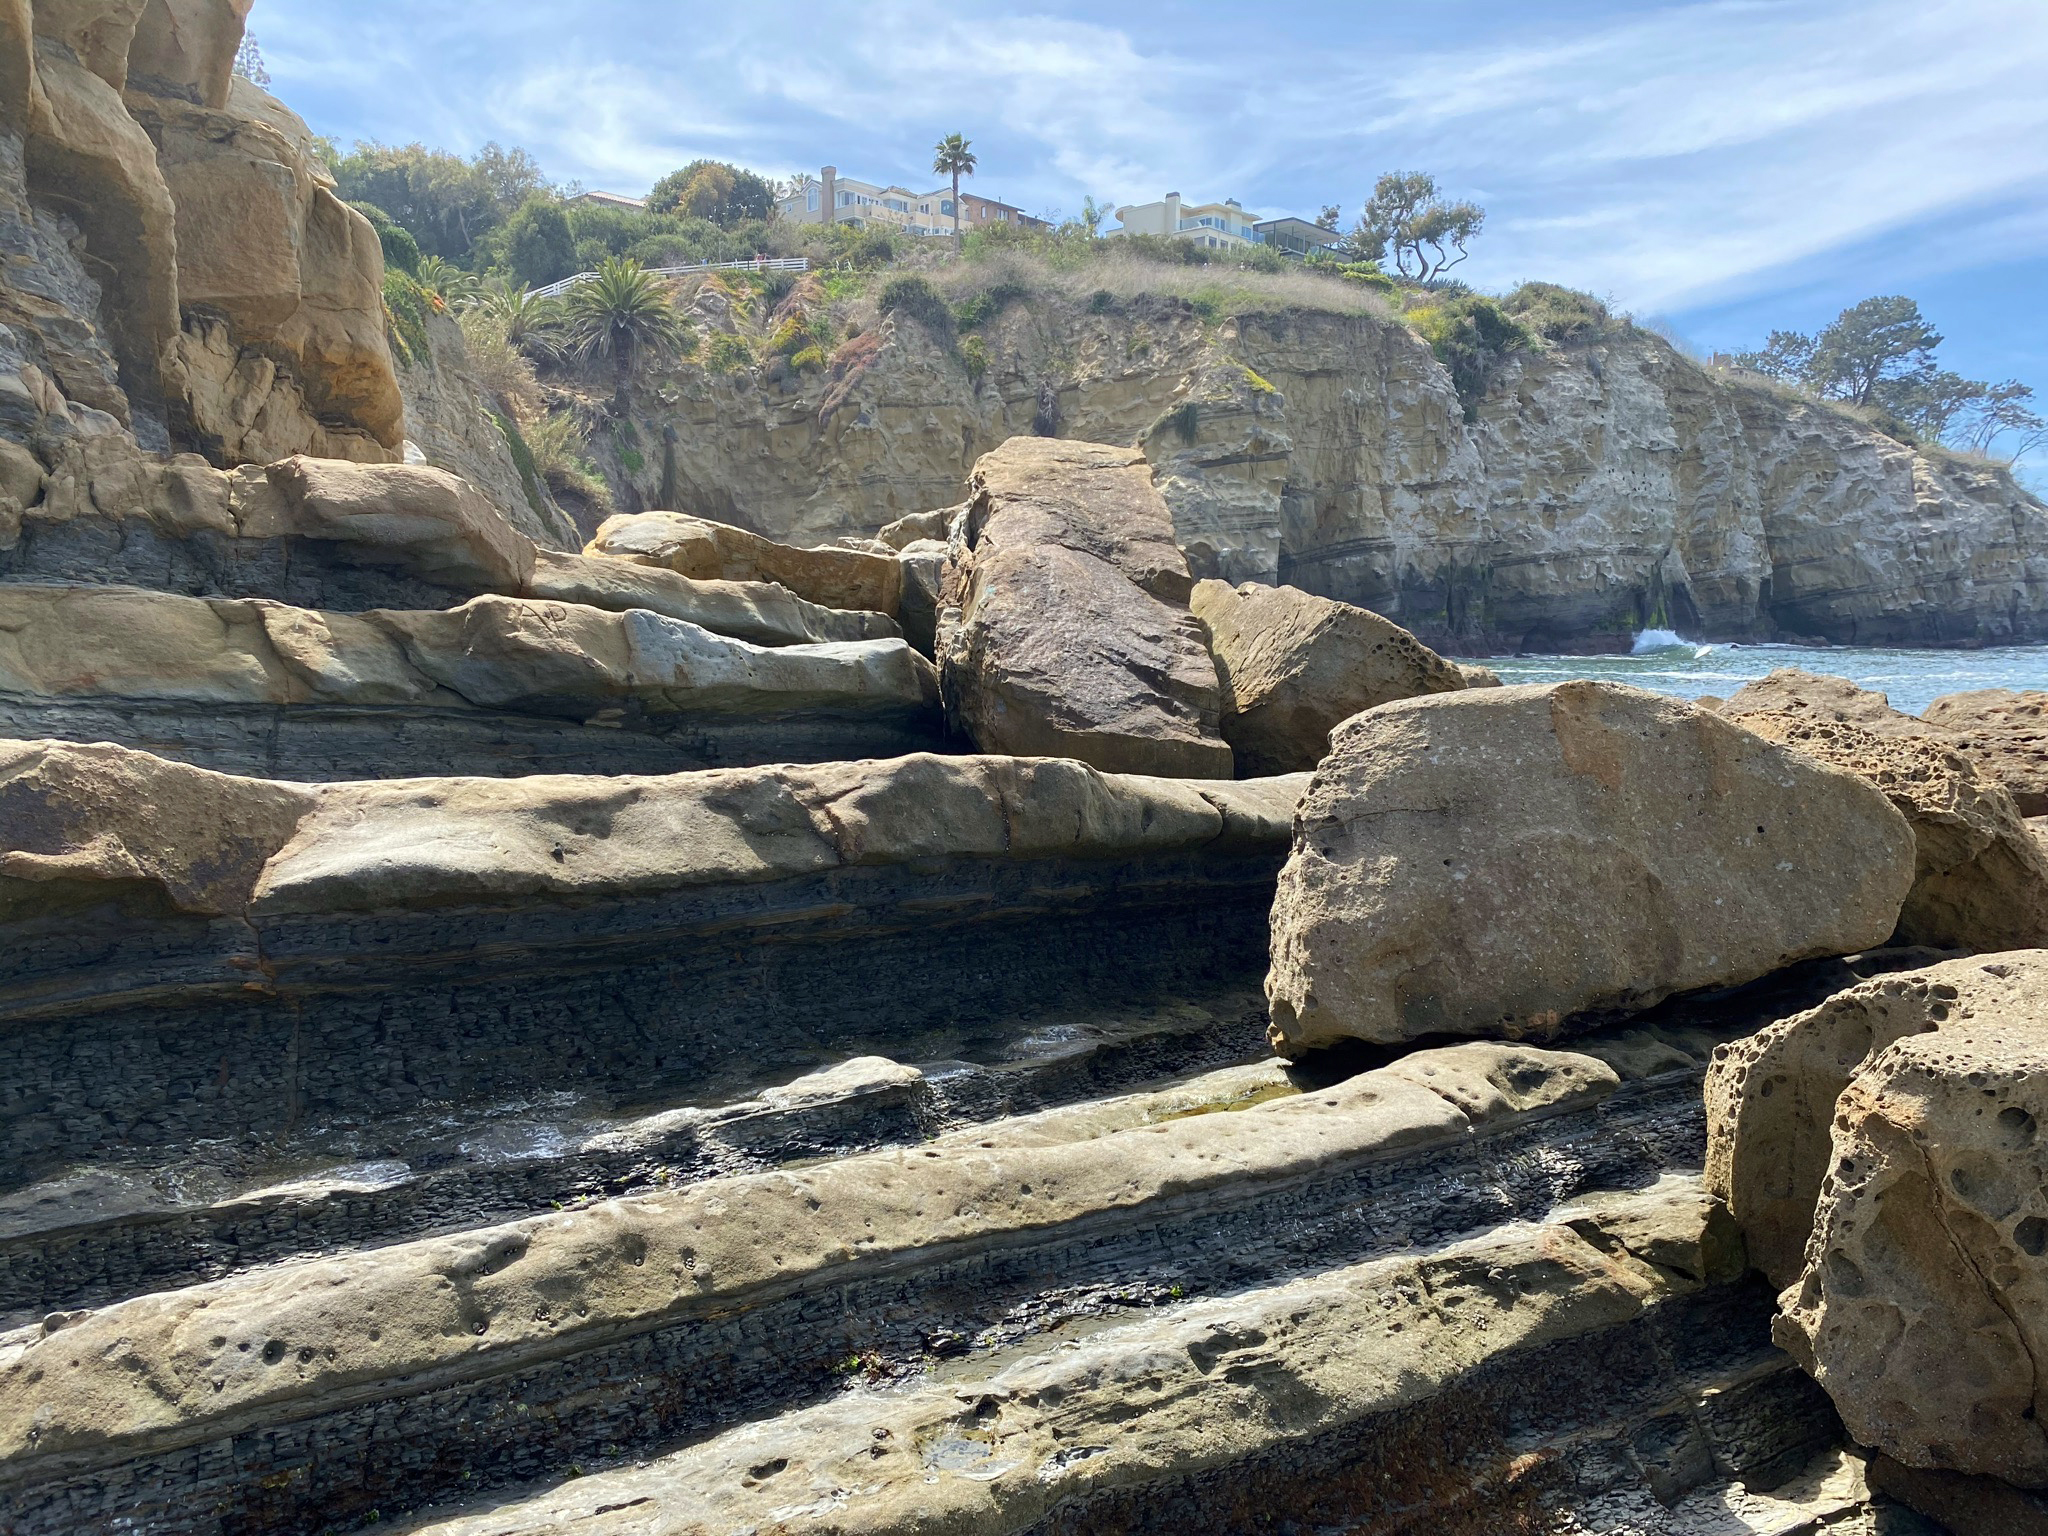
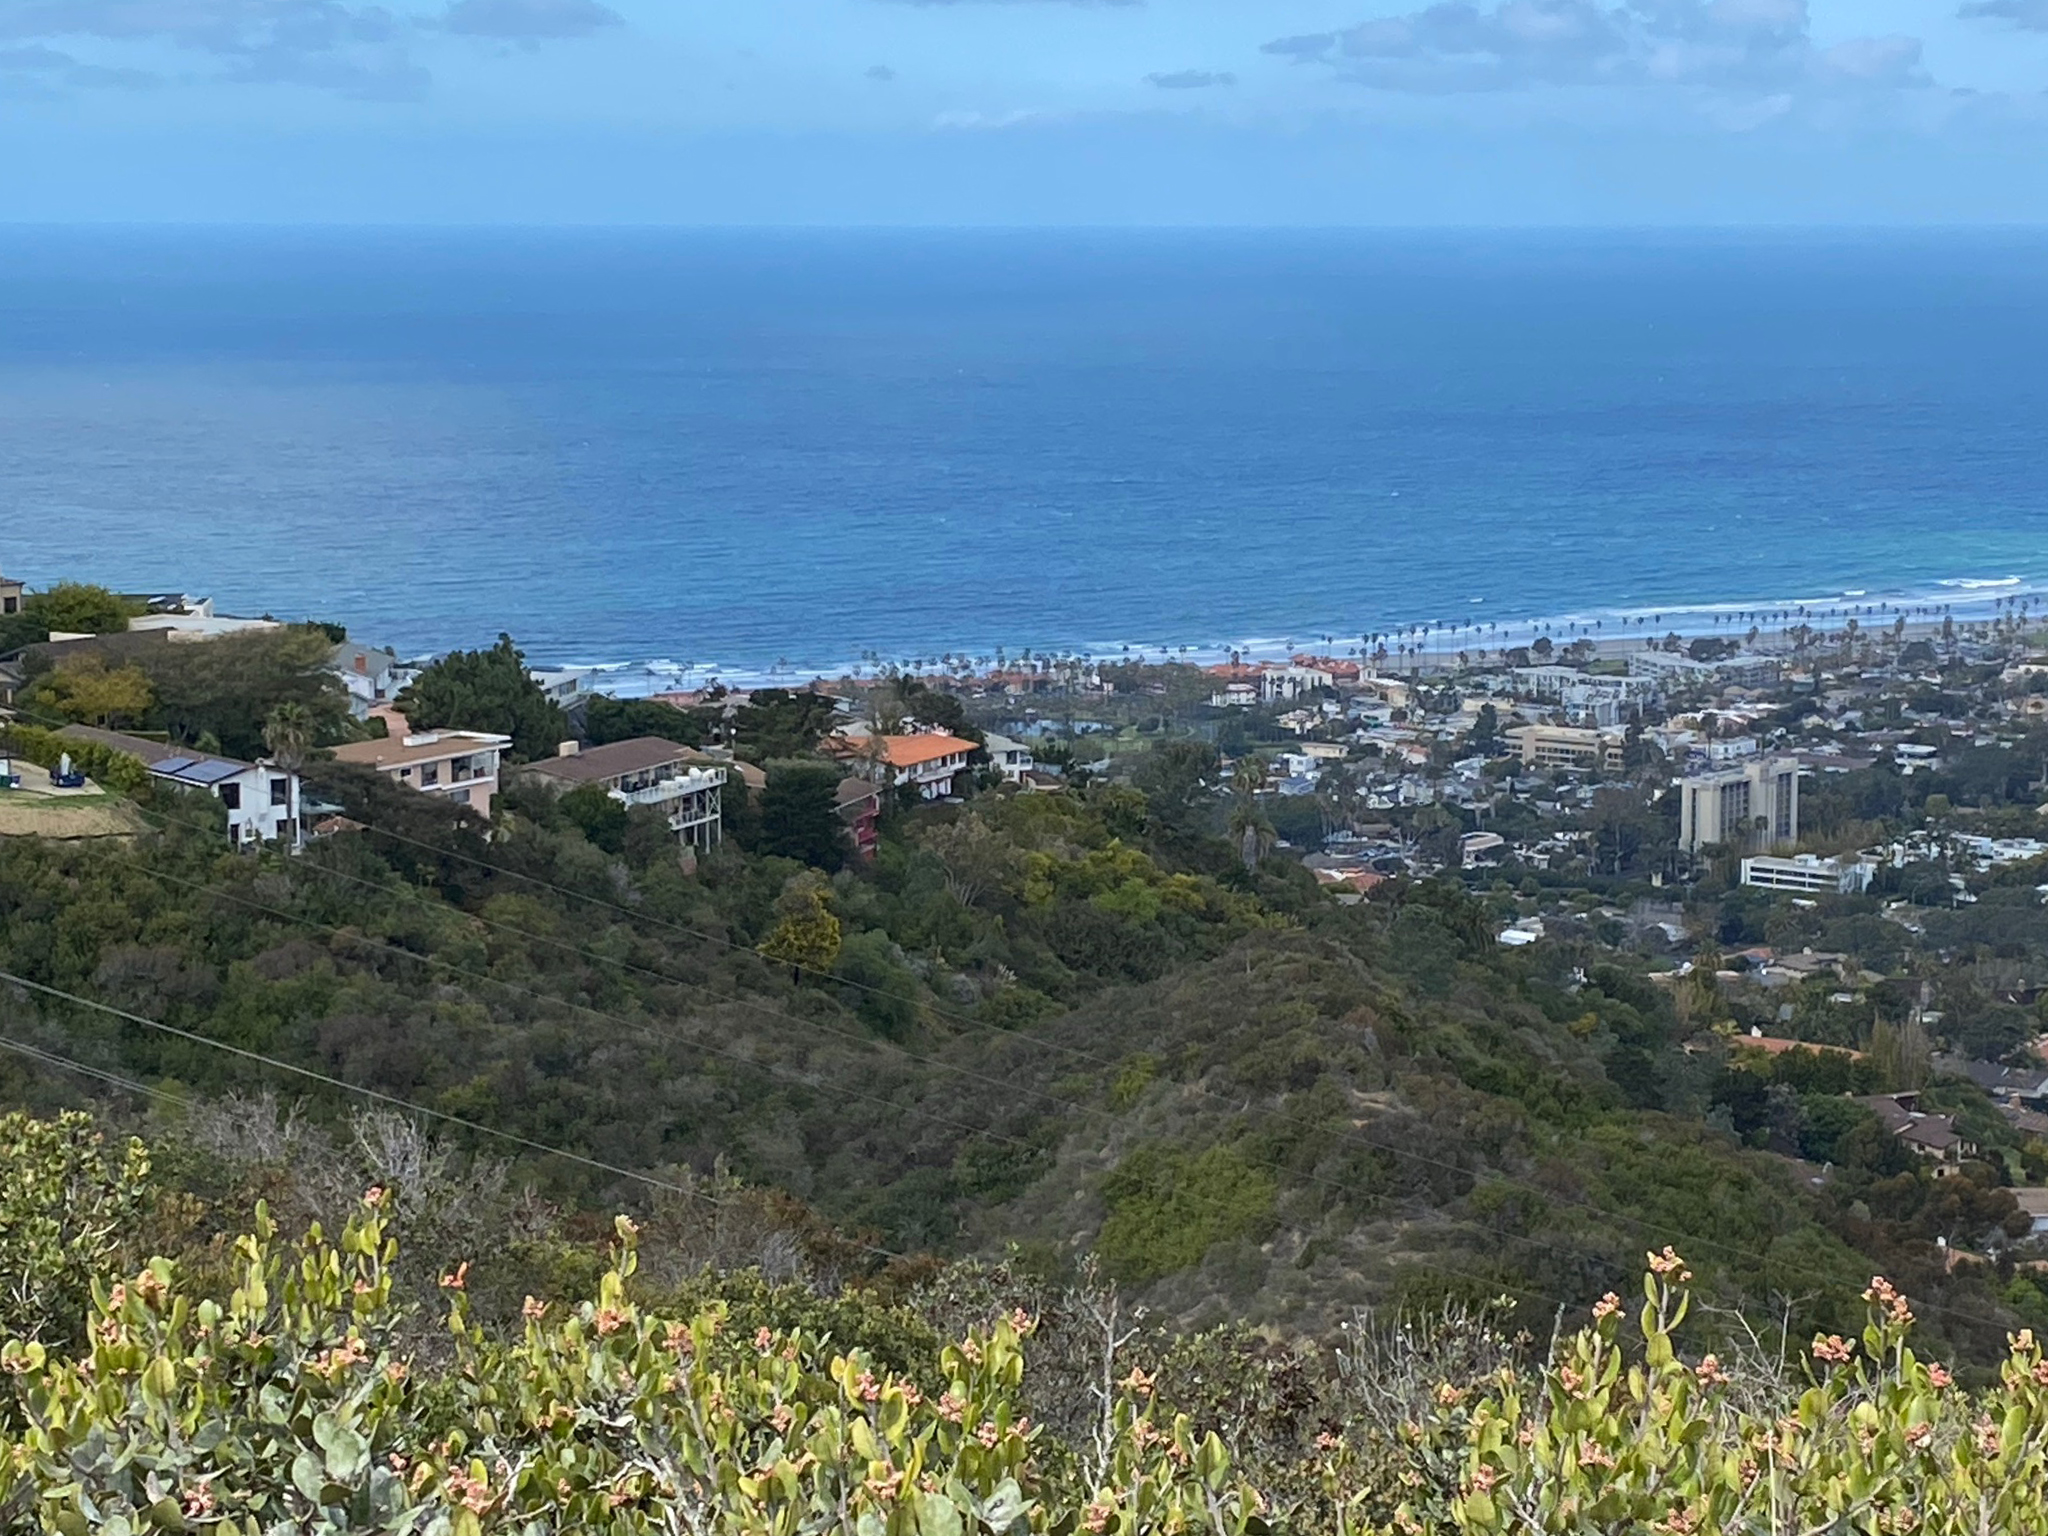
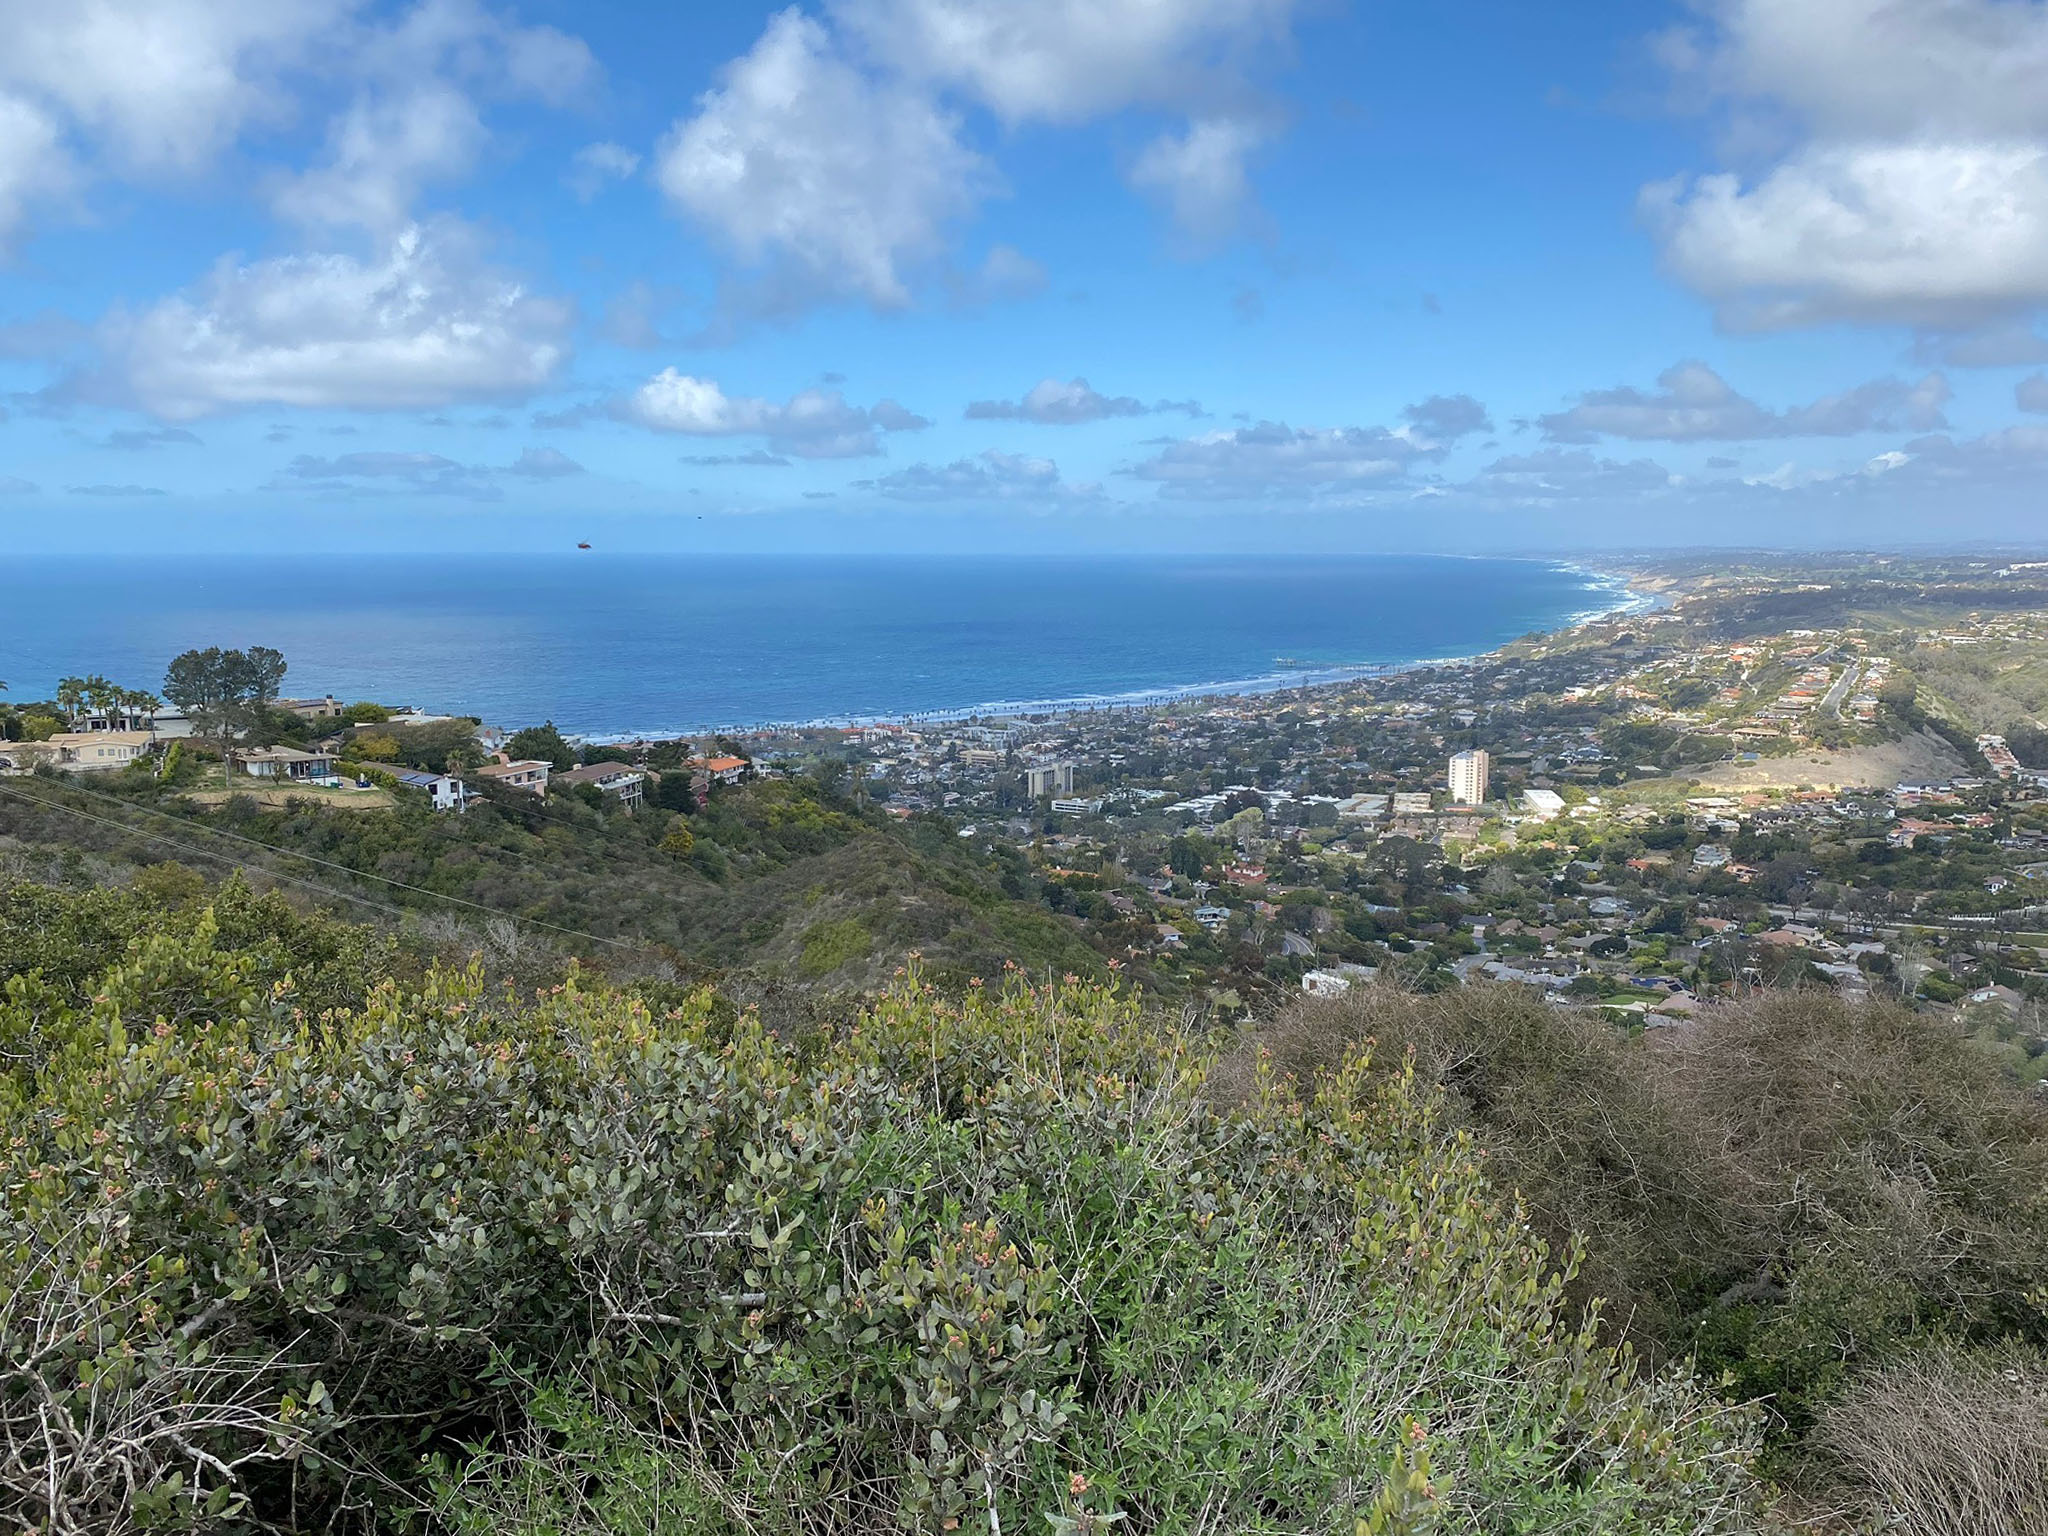
The La Jolla landscape was sculpted by the competing forces of tectonics (faulting, folding, uplift) and erosion (coastal erosion and stream incision). Looking south from the Torrey Pines area it is easy to see the step-like character of the increasingly older marine terraces (and higher) as you go from Point La Jolla to the top of Mount Soledad (Figure 11).
|
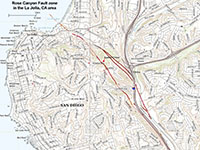
Fig. 8. Rose Canyon Fault Zone showing "active faults" in the La Jolla area. Additional faults and geologic structures are show of geologic map.
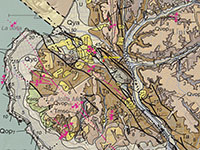
Fig. 9. Geologic map of the La Jolla area including Rose Canyon Fault Zone (CGS geologic quadrangle map).
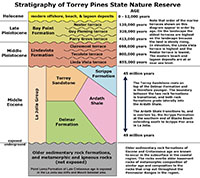 Fig. 10. Quaternary and Eocene stratigraphy of Torrey Pines area north of La Jolla Bay. Fig. 10. Quaternary and Eocene stratigraphy of Torrey Pines area north of La Jolla Bay.
|
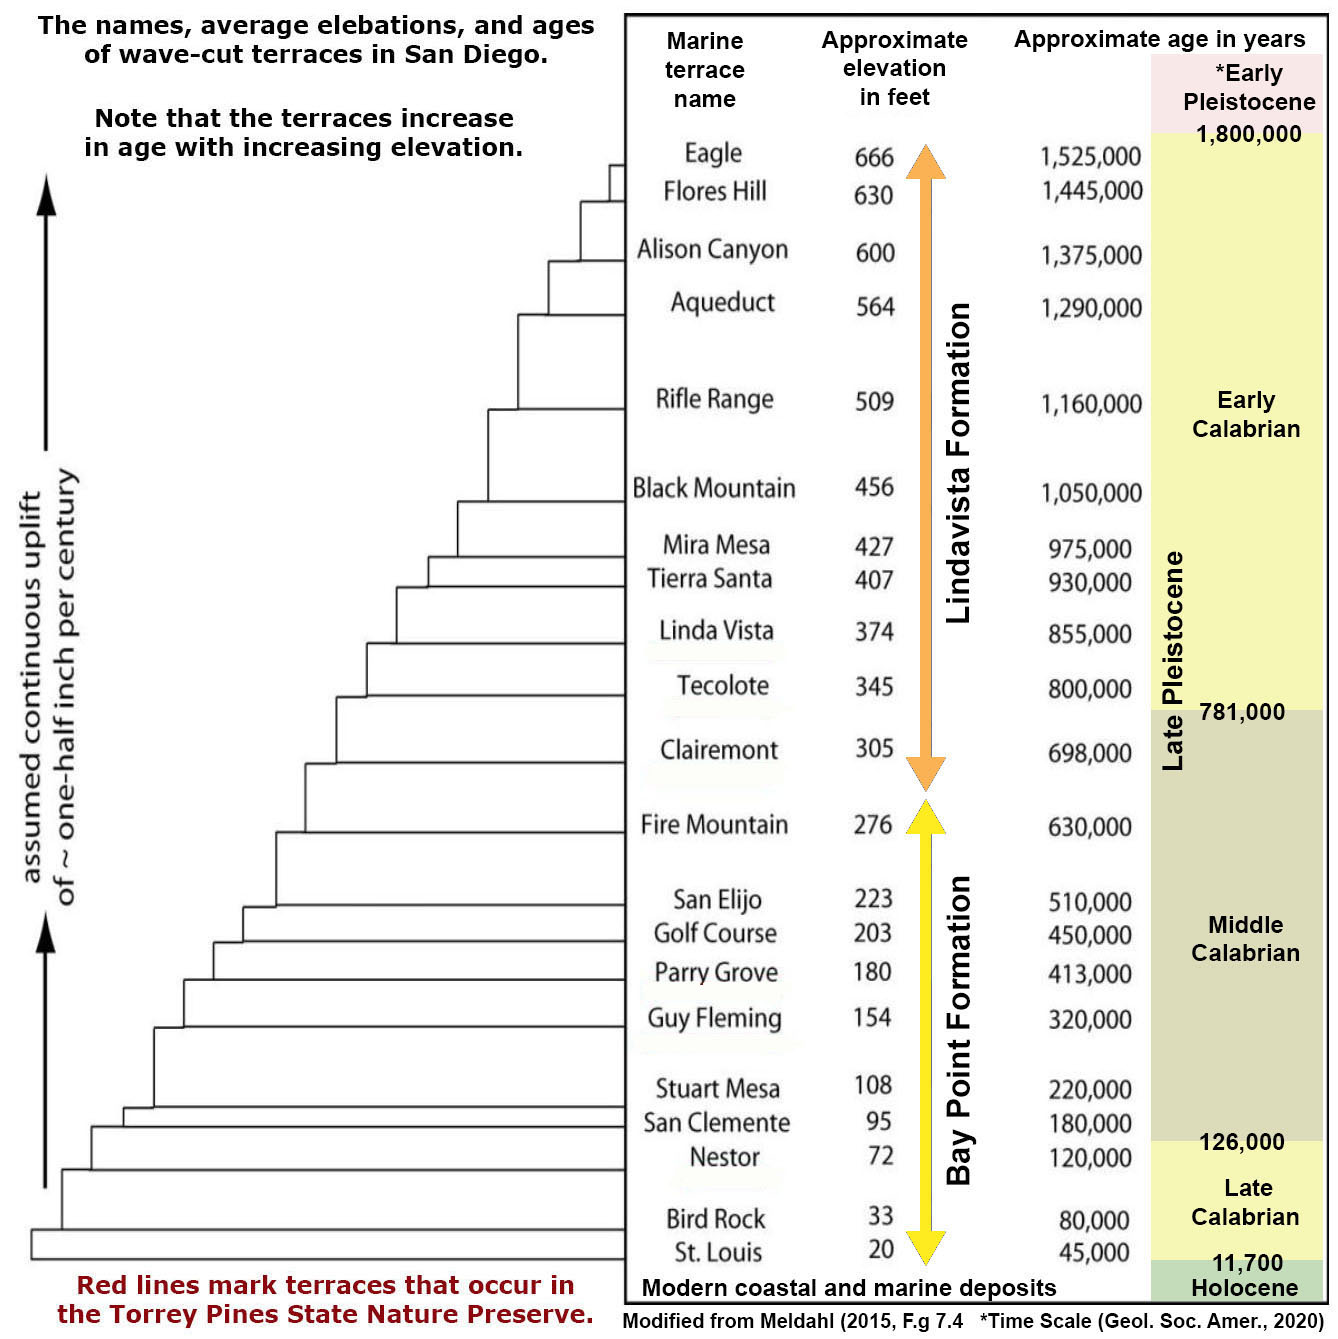
The top of the sea cliffs around La Jolla Bay are locally capped with marine terrace deposits of Late Pleistocene. Sedimentary deposits on the terraces are assigned the collectively named Bay Point Formation. Each marine terrace is associated with a rise and fall of sea level going back in time with each ice age of the Pleistocene epoch. Figure X is a classic attempt to correlate the sequence and ages of the 21 named marine terraces in the San Diego region in various locations where they are preserved. Figure 12 shows the marine terraces in the Torrey Pines area where they are well defined (and named).
The most prominent marine terraces are associate with the Lindavista Formation. The Lindavista Formation forms the caprock of all the mesa regions north and east of San Diego and west of the mountain front. The Lindavista Formation accumulated on the wave-carved surface of the continental shelf and coastal plain when both sea levels were higher and the lands surface was lower. The coastal region is slowly rising, about a centimeter per century. However, Mount Soledad is rising at about twice that rate because of uplift along the fault. |

Fig. 11. View looking south from Torrey Pines Mesa toward La Jolla showing the Pleistocene-age step-like marine terraces on the west side of Mount Soledad. |
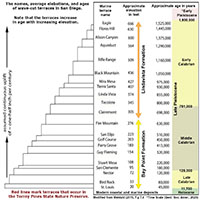
Fig. 12. Age and elevation of named marine terraces in the San Diego region. |
A6
The Coast Walk From La Jolla Point to Torrey Pines Road
The easiest way to get an appreciation of the Rose Canyon Fault Zone is to take the scenic Coast Walk along the sea cliffs around La Jolla Bay (see Figure 7). A good starting point is along the Shore Path in Ellen Browning Scripps Park (parking is in high demand here, especially on weekends). The walk starting at La Jolla Point and heading east is about one mile, one way. The first part of the walk is along the Shore Path, a sidewalk with exhibit areas that runs along Shore Boulevard past La Jolla Cove and along the top of the sea cliffs east to Goldfish Point. The Coast Walk Trail starts Goldfish Point and continues around the Corner of La Jolla Bay to its norhern end at Torrey Pines Road. This route is among the most visited,scenic, and geologically interesting portions of the San Diego coastline.
|
A7
La Jolla Shore Path From La Jolla Point to Goldfish Point
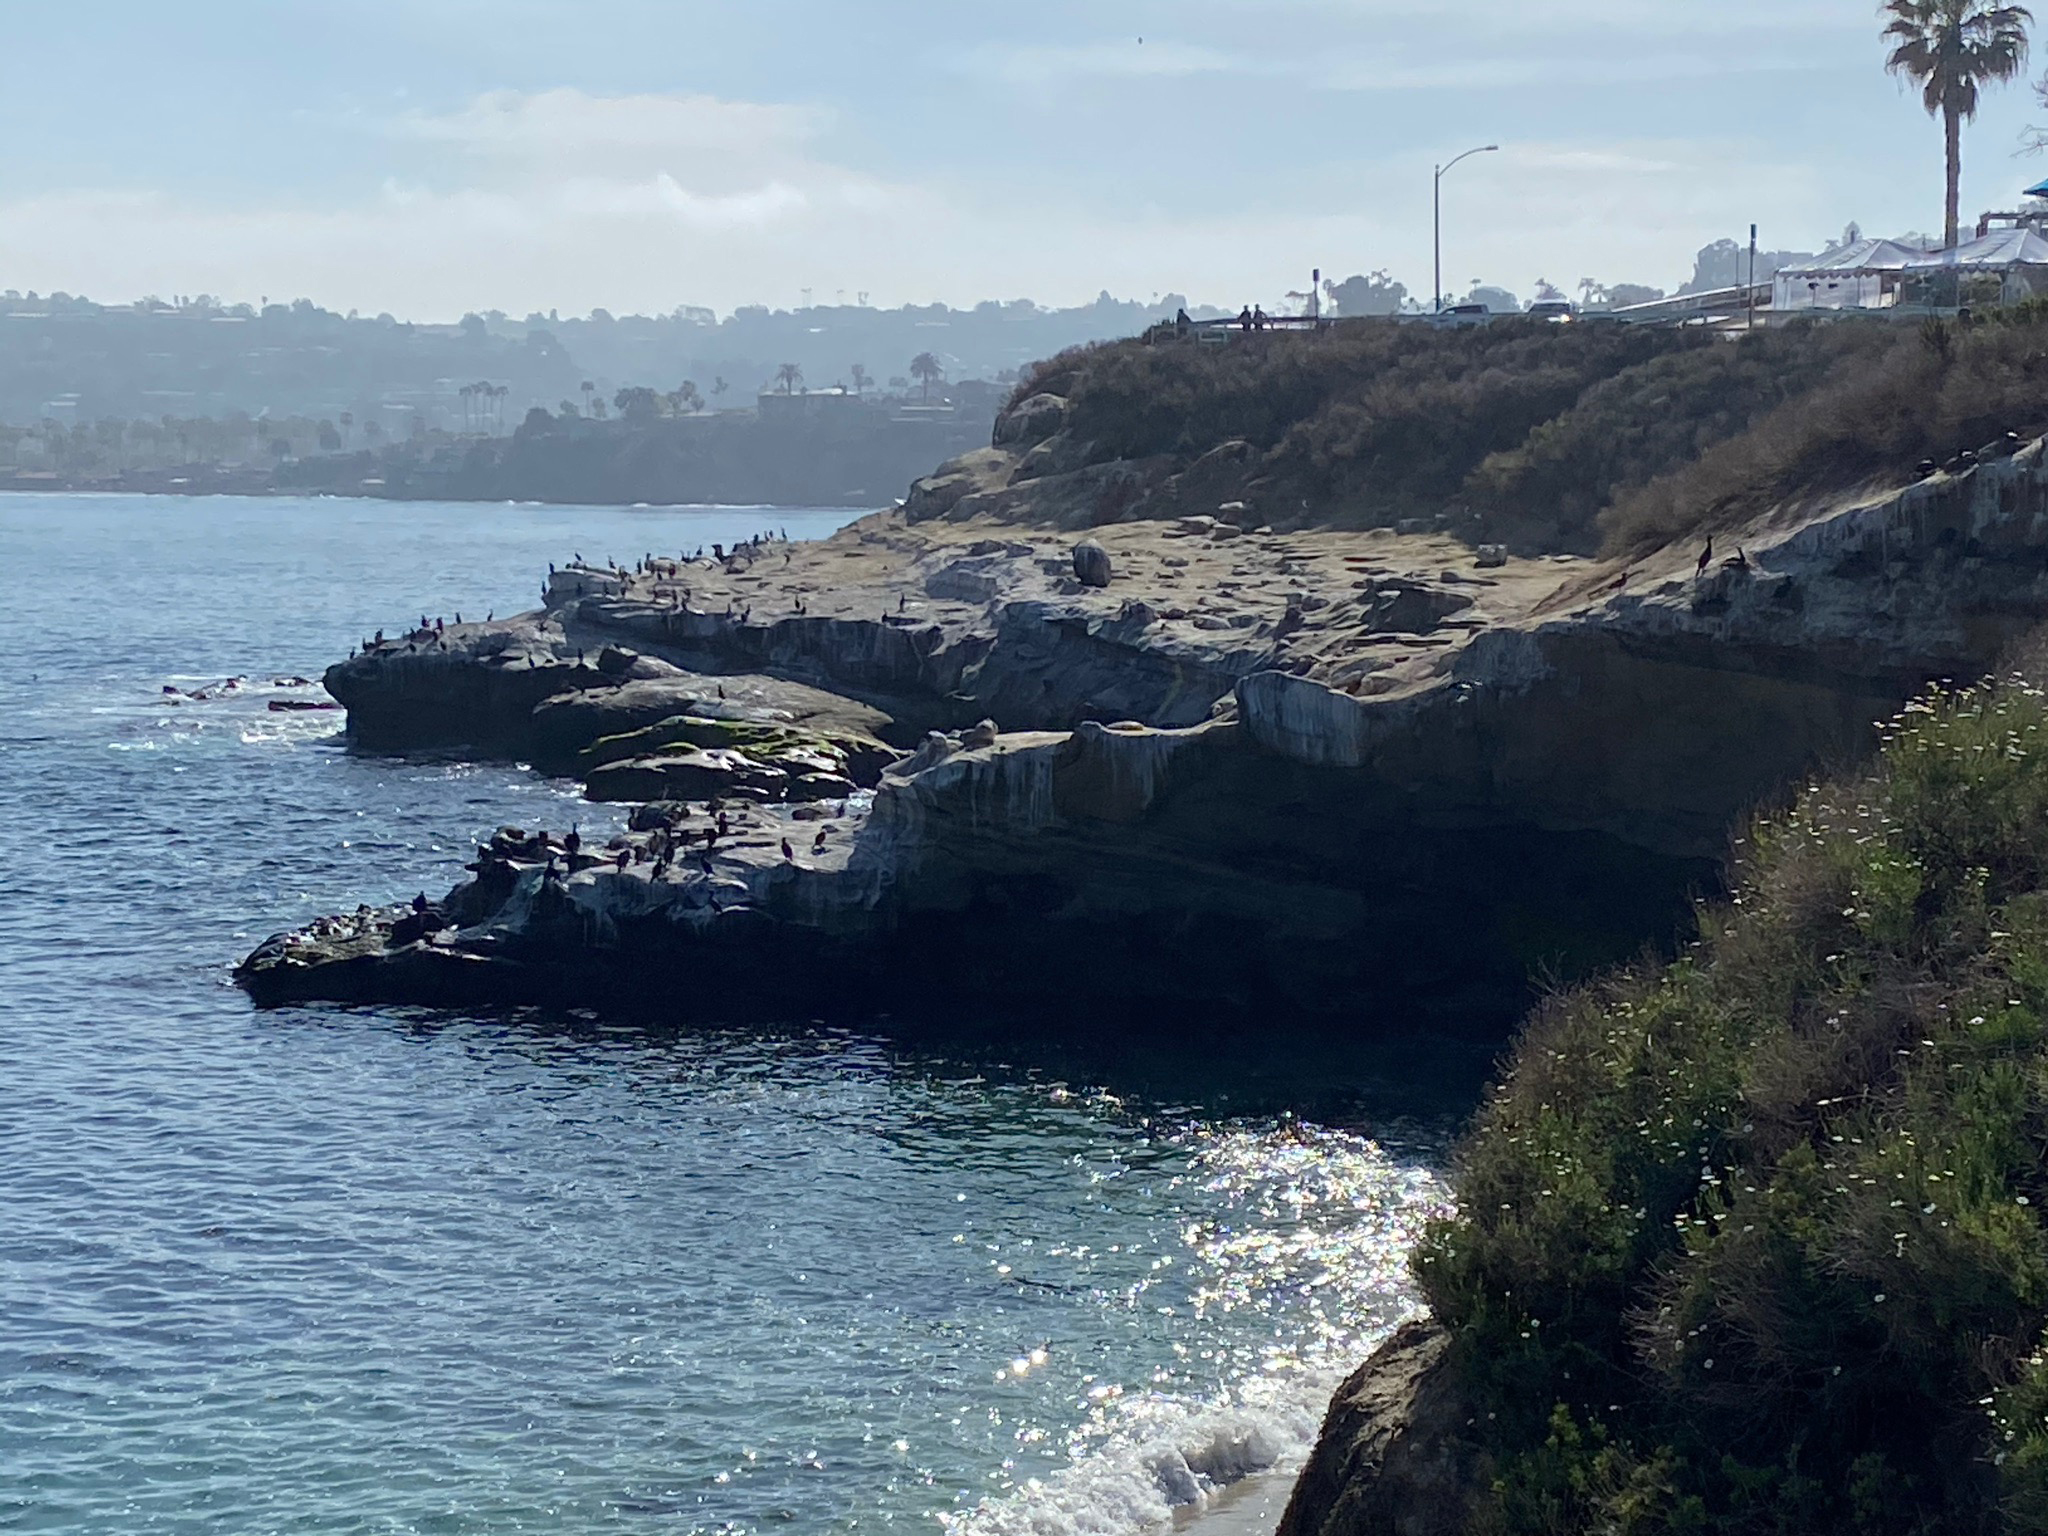
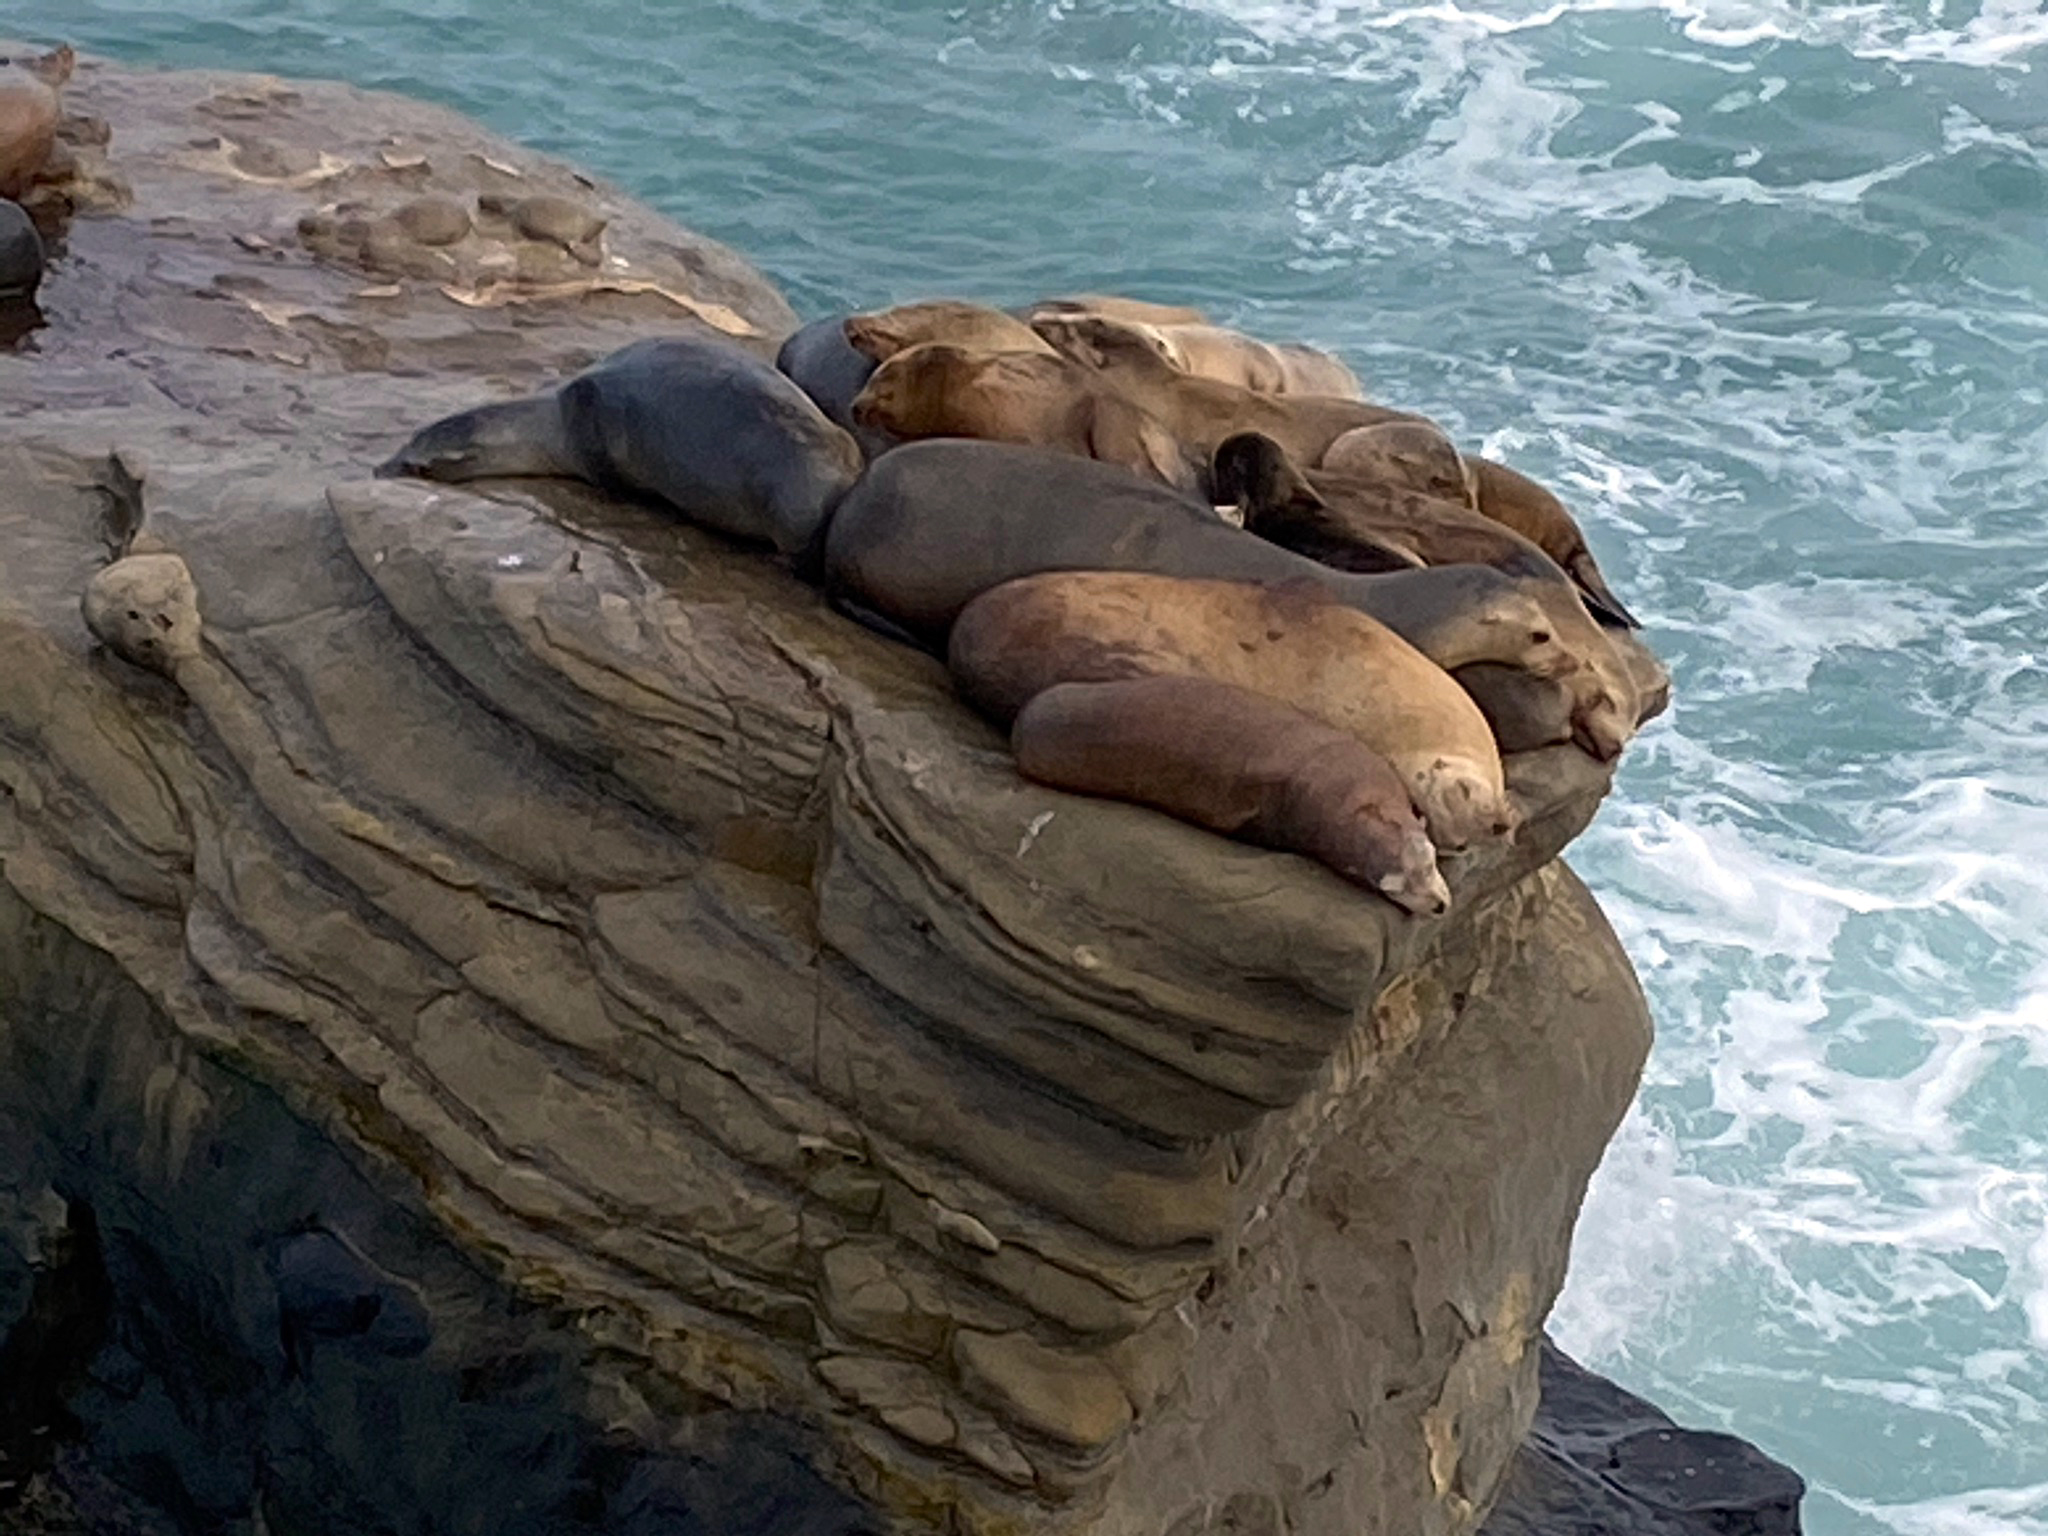
La Jolla Point with its Shore Path is a major tourist destination. Wave action has carved the Point Loma Formation shaping ledges of sandstone in the sea cliffs at La Jolla Point (Figure 13). The low ledges along the shore are now home of a sea lion colony (Figure 14).
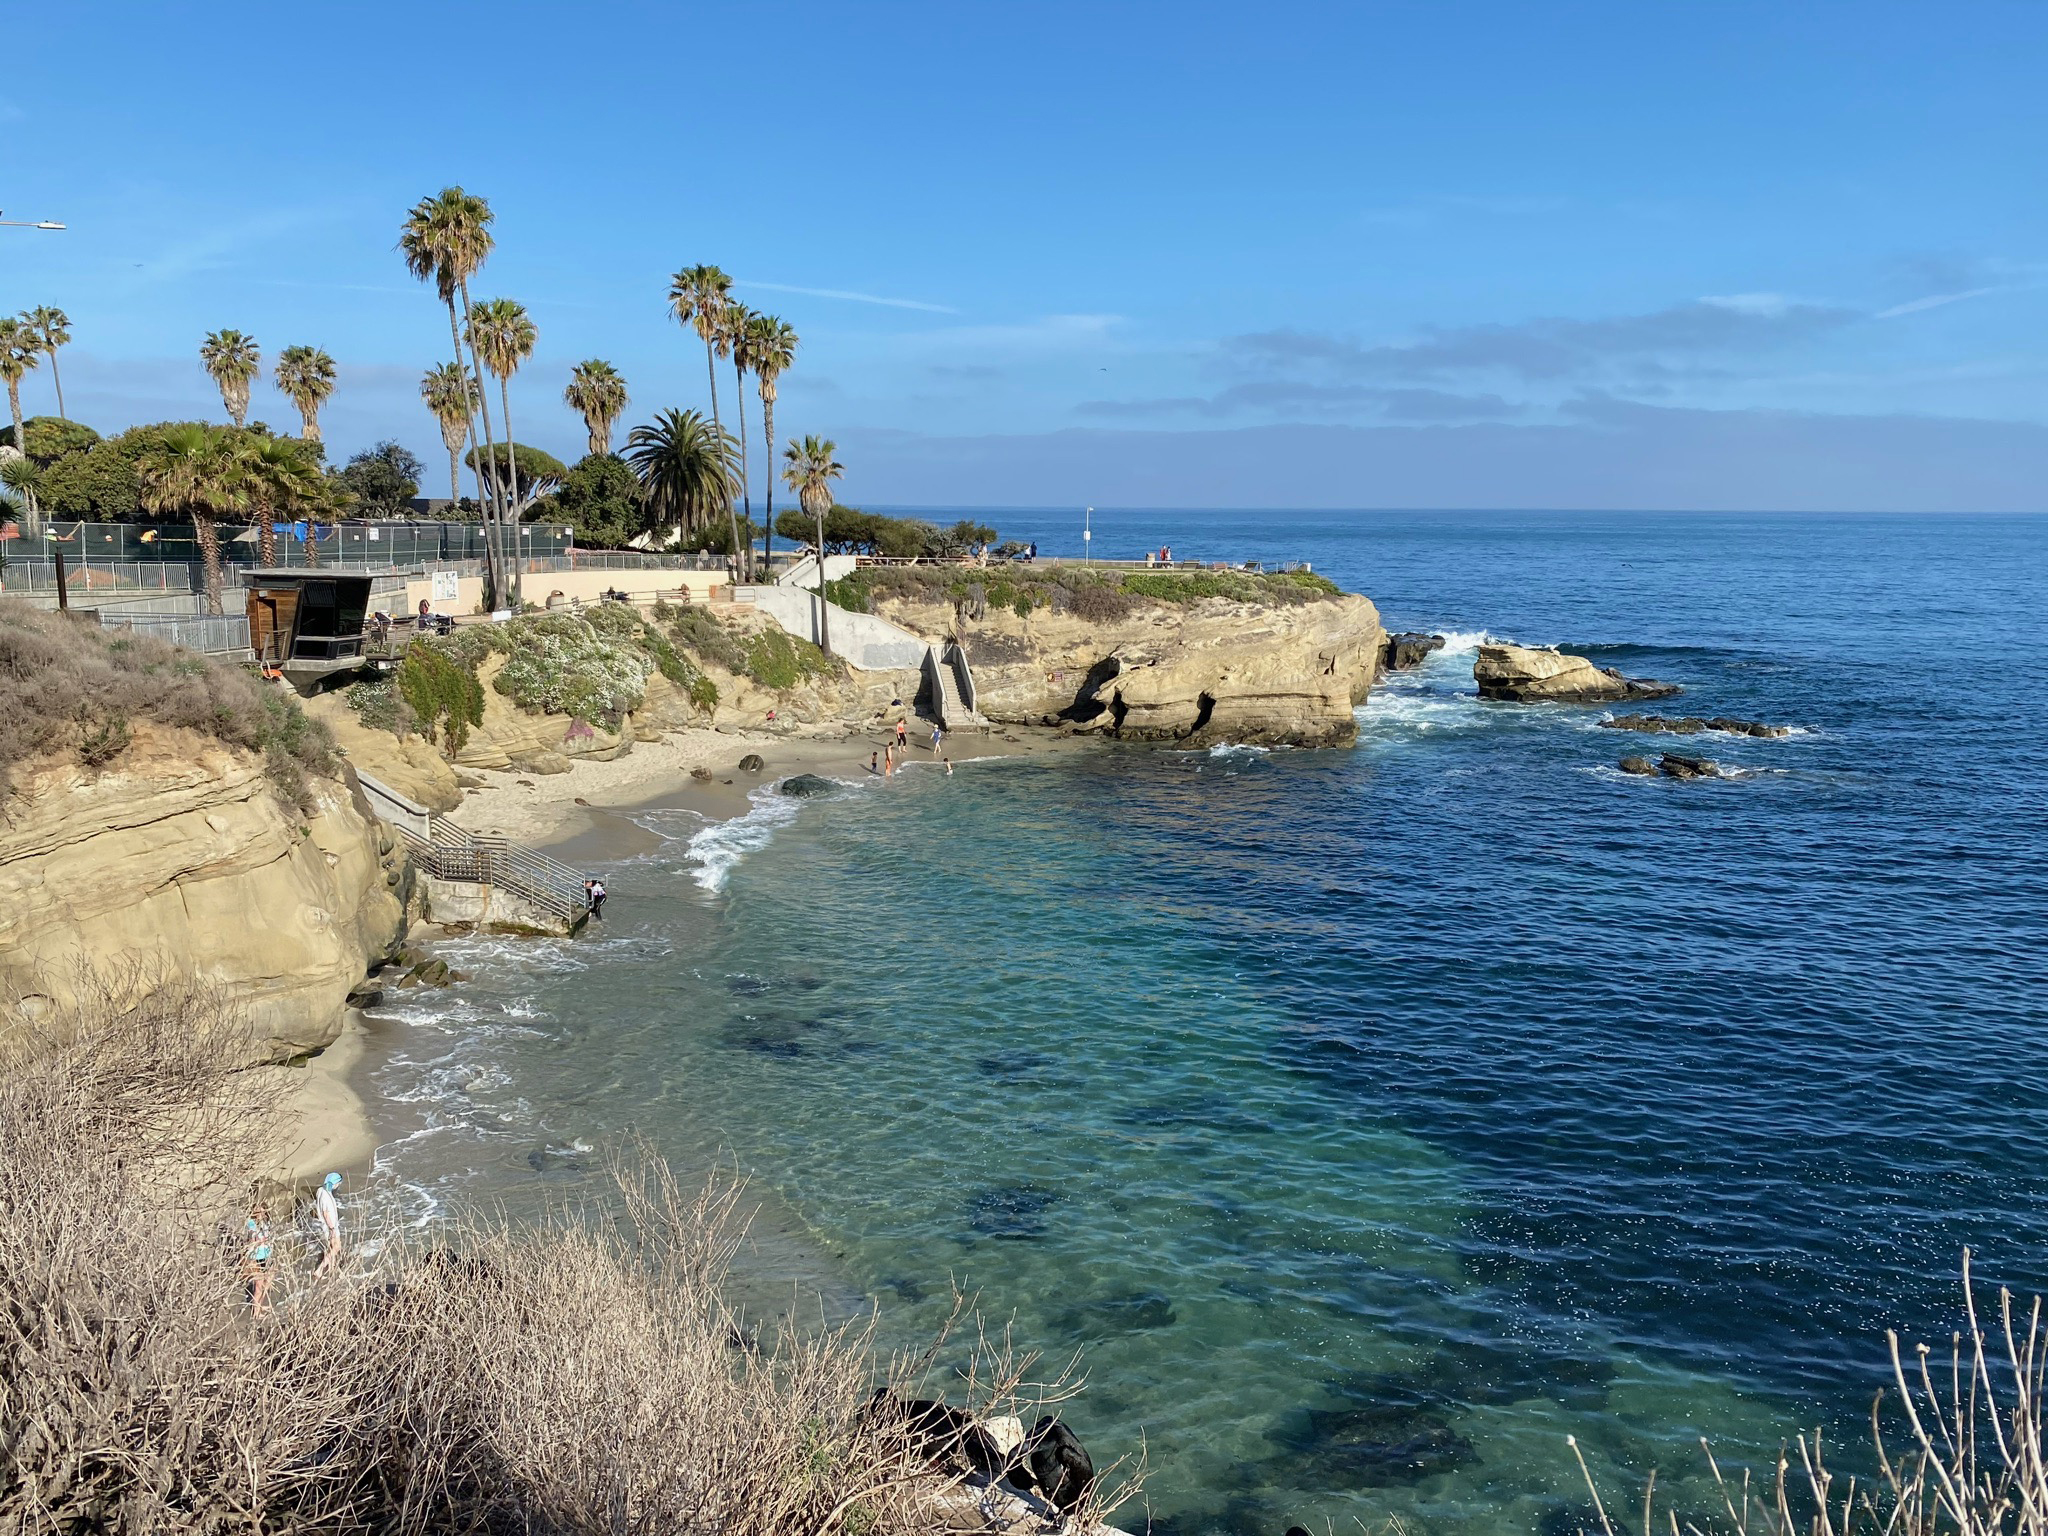
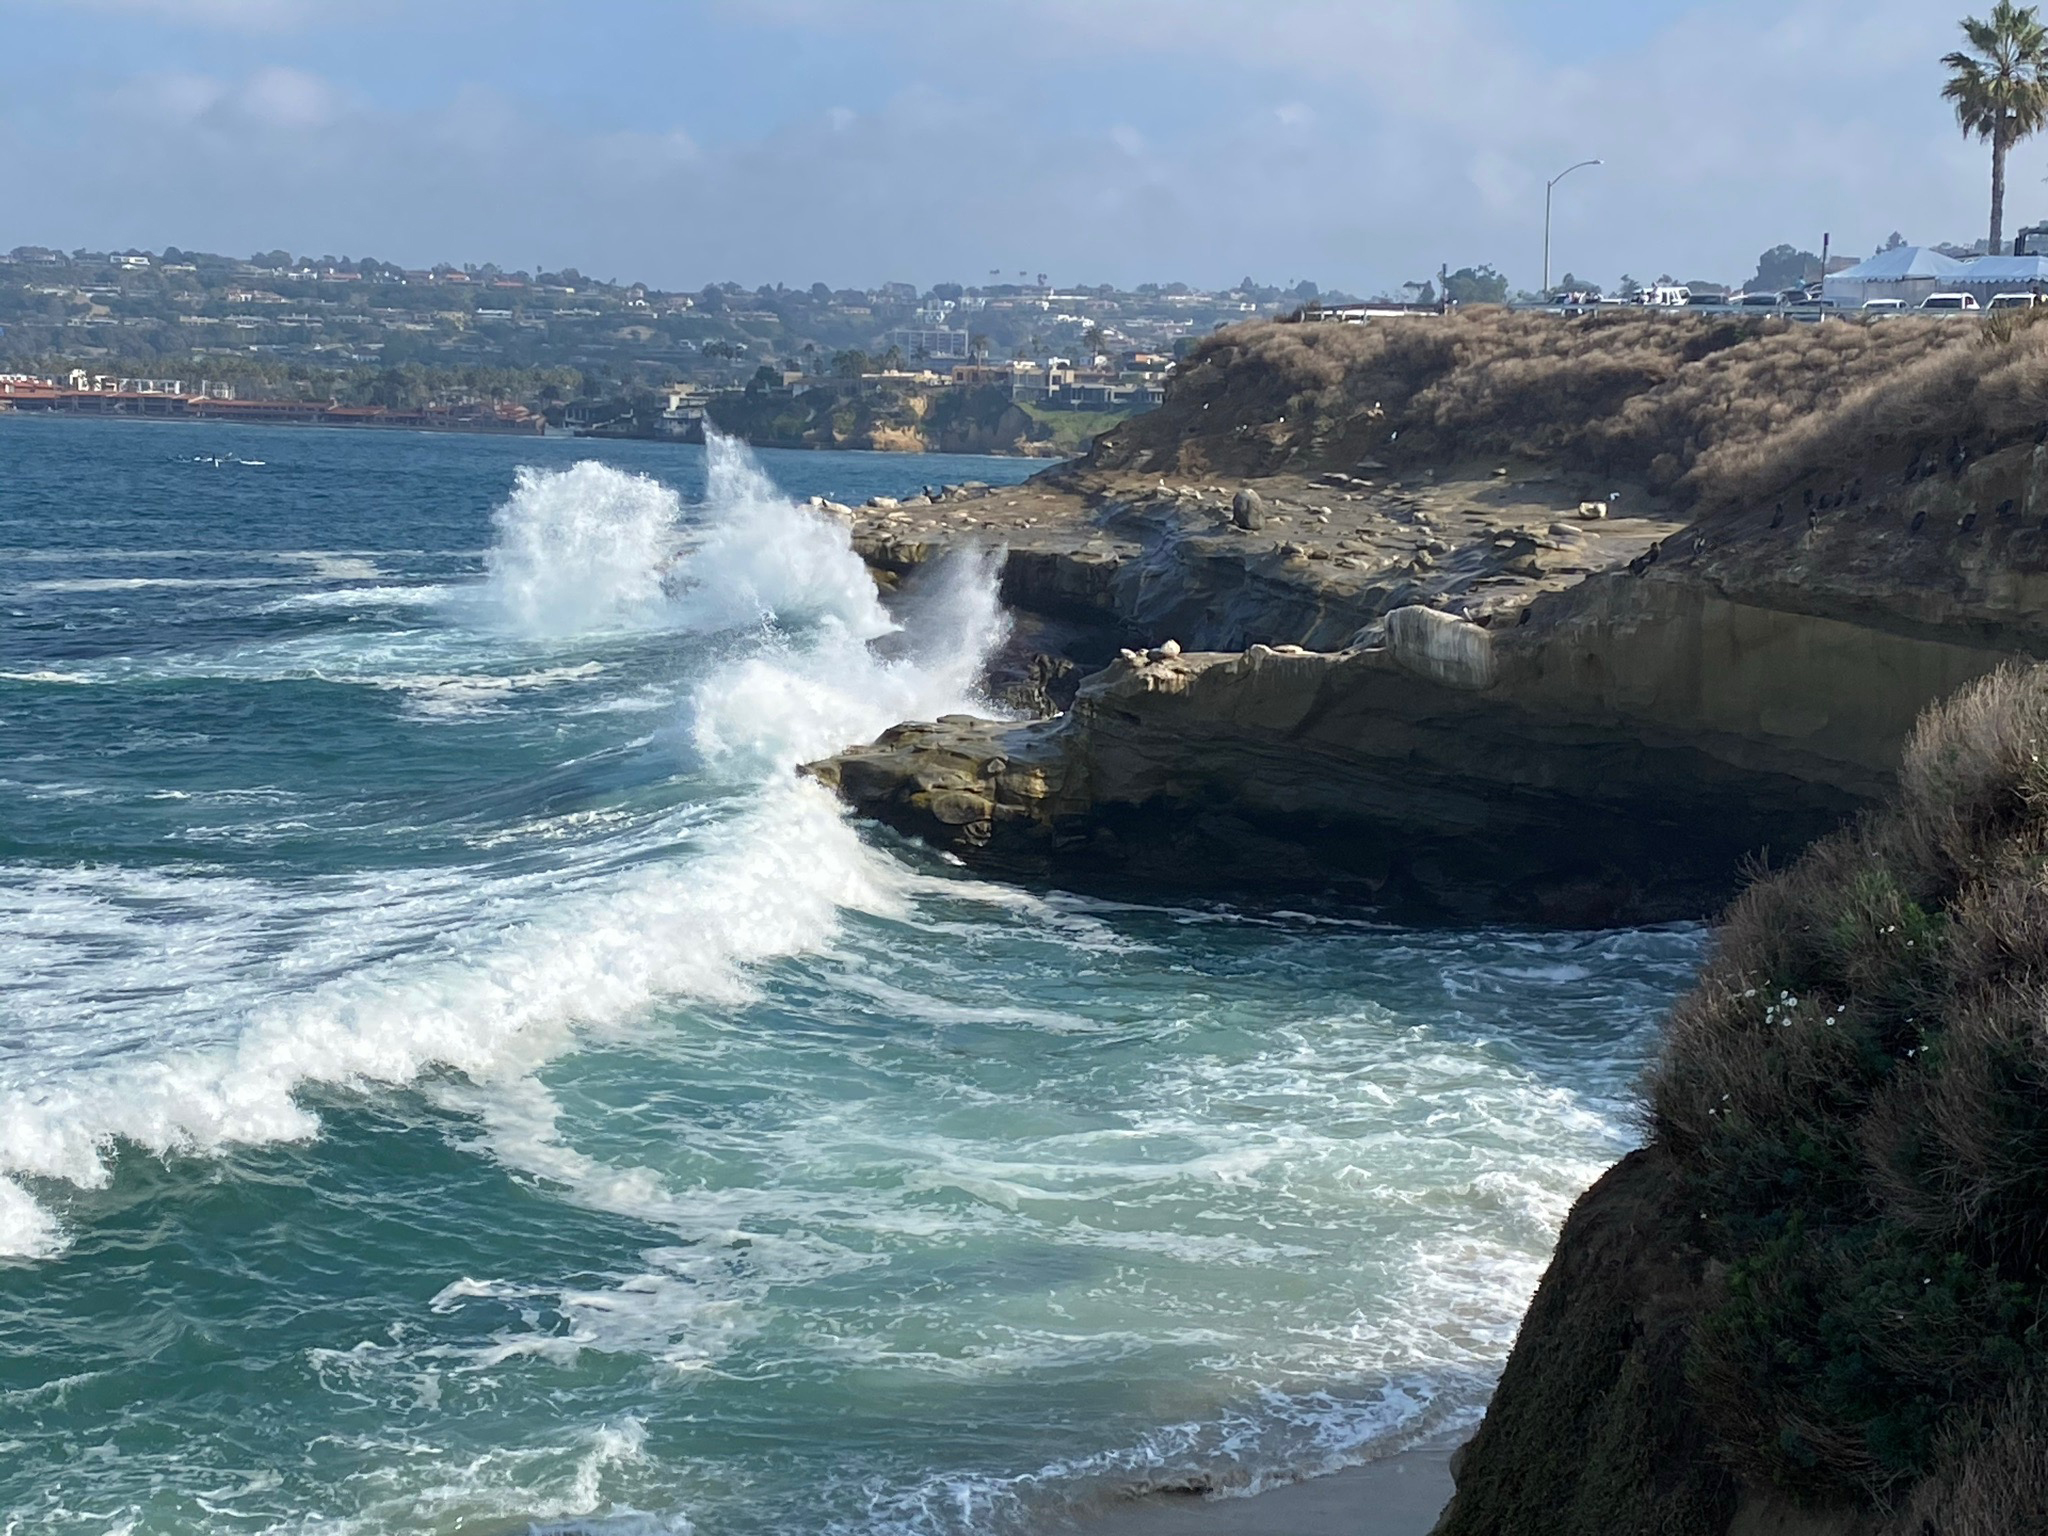
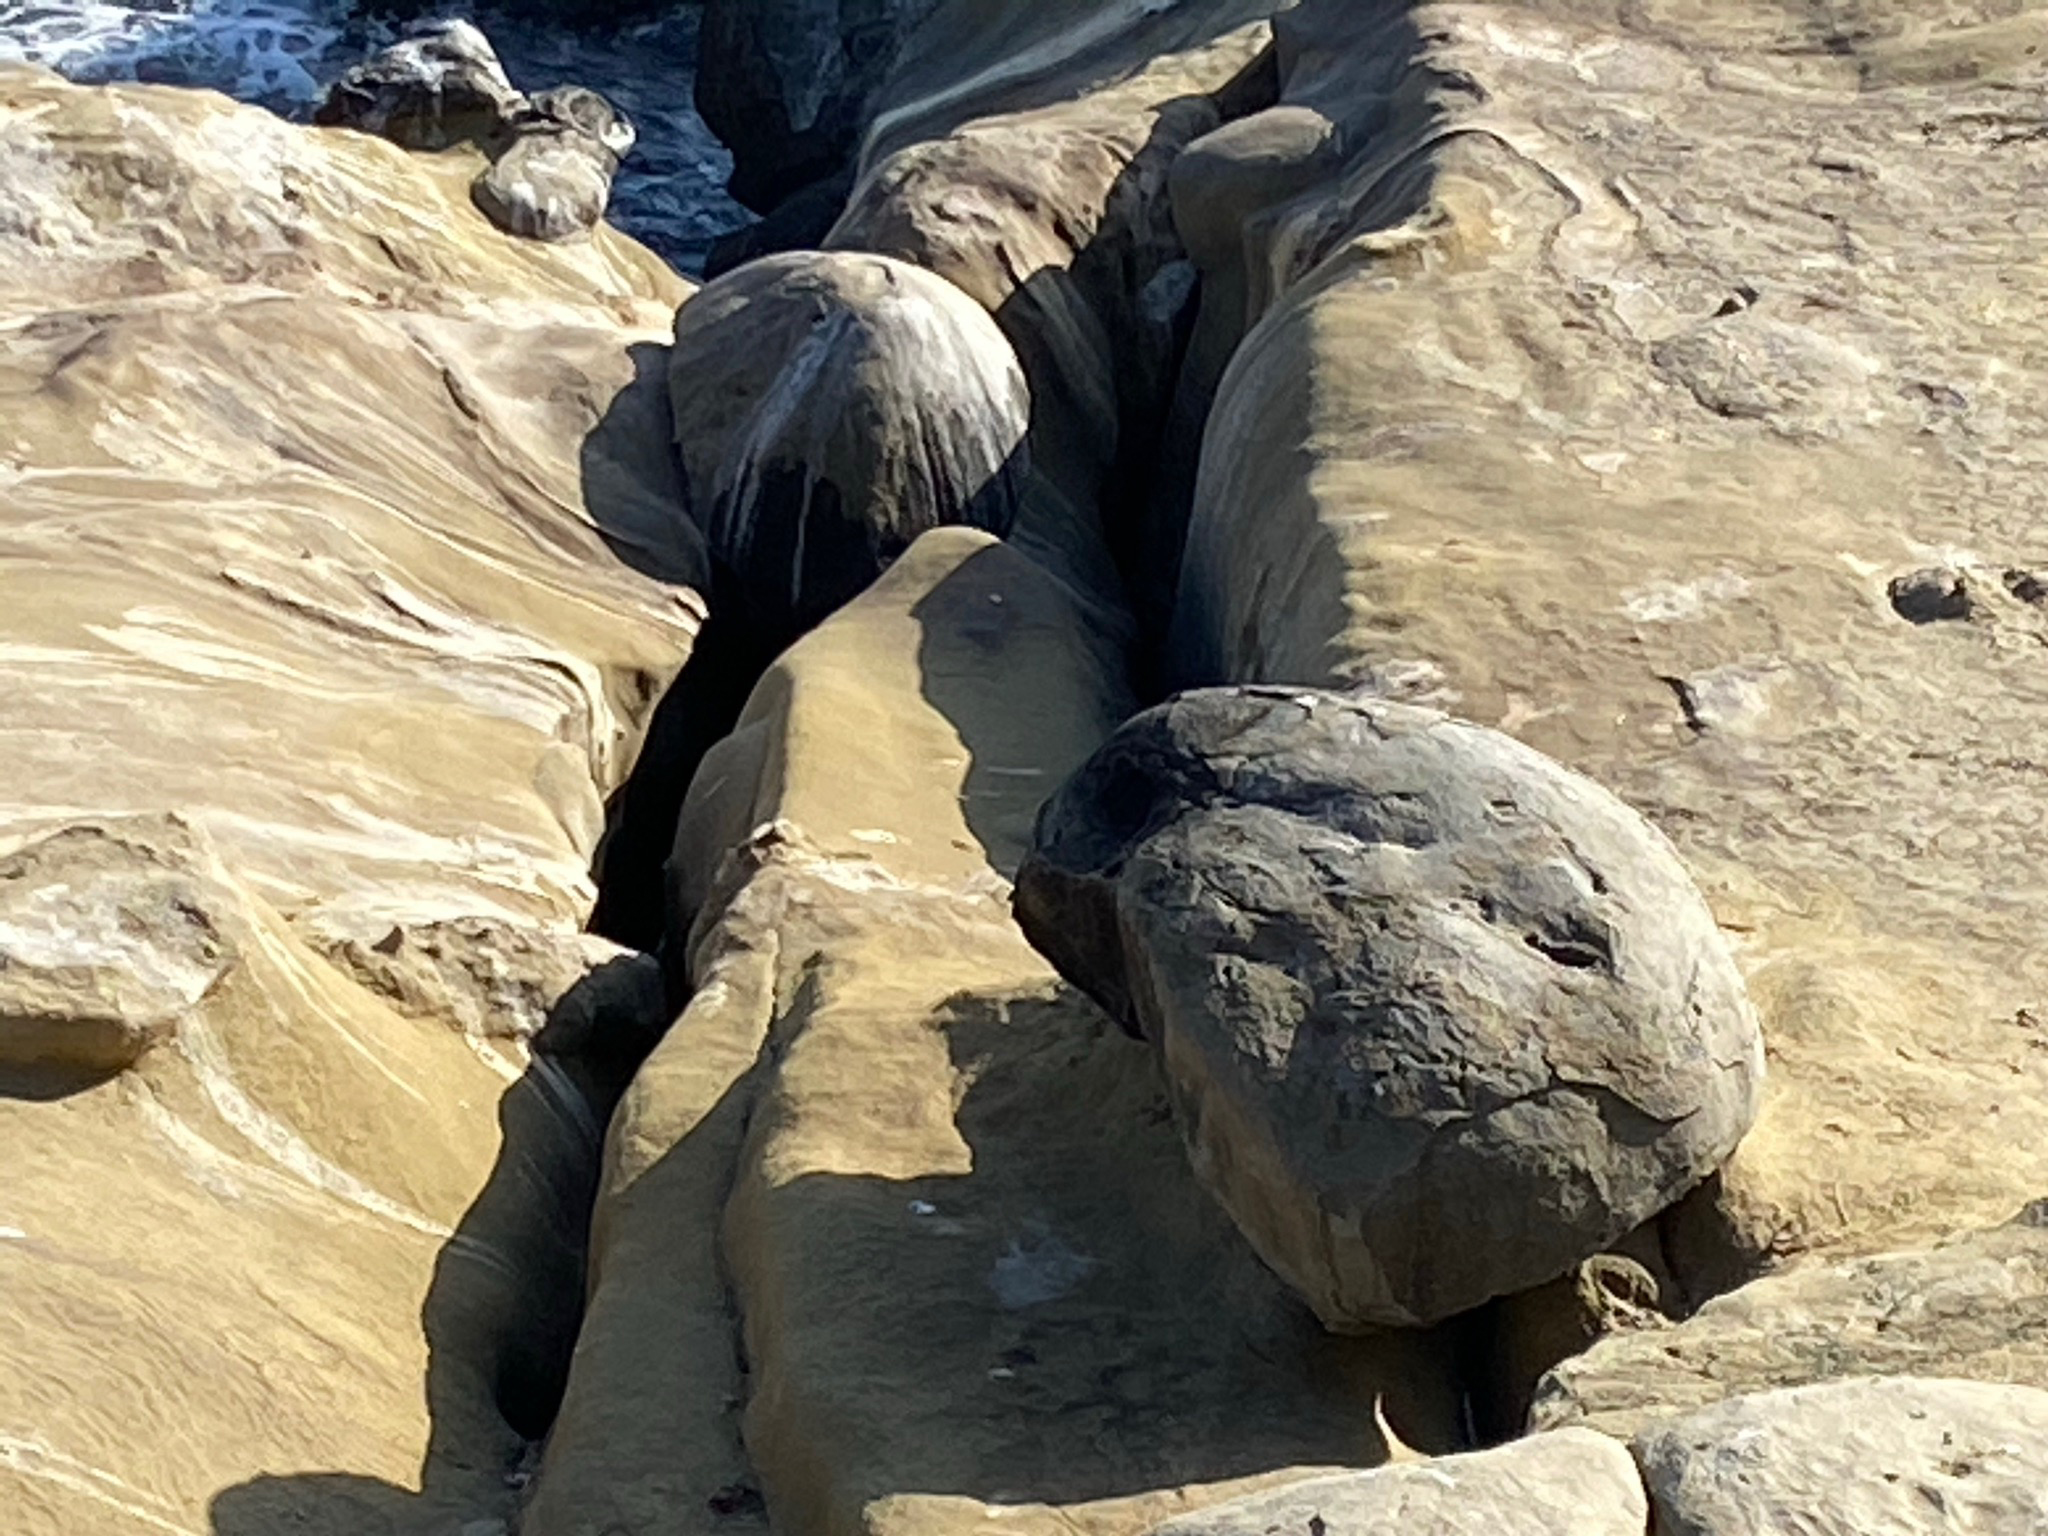
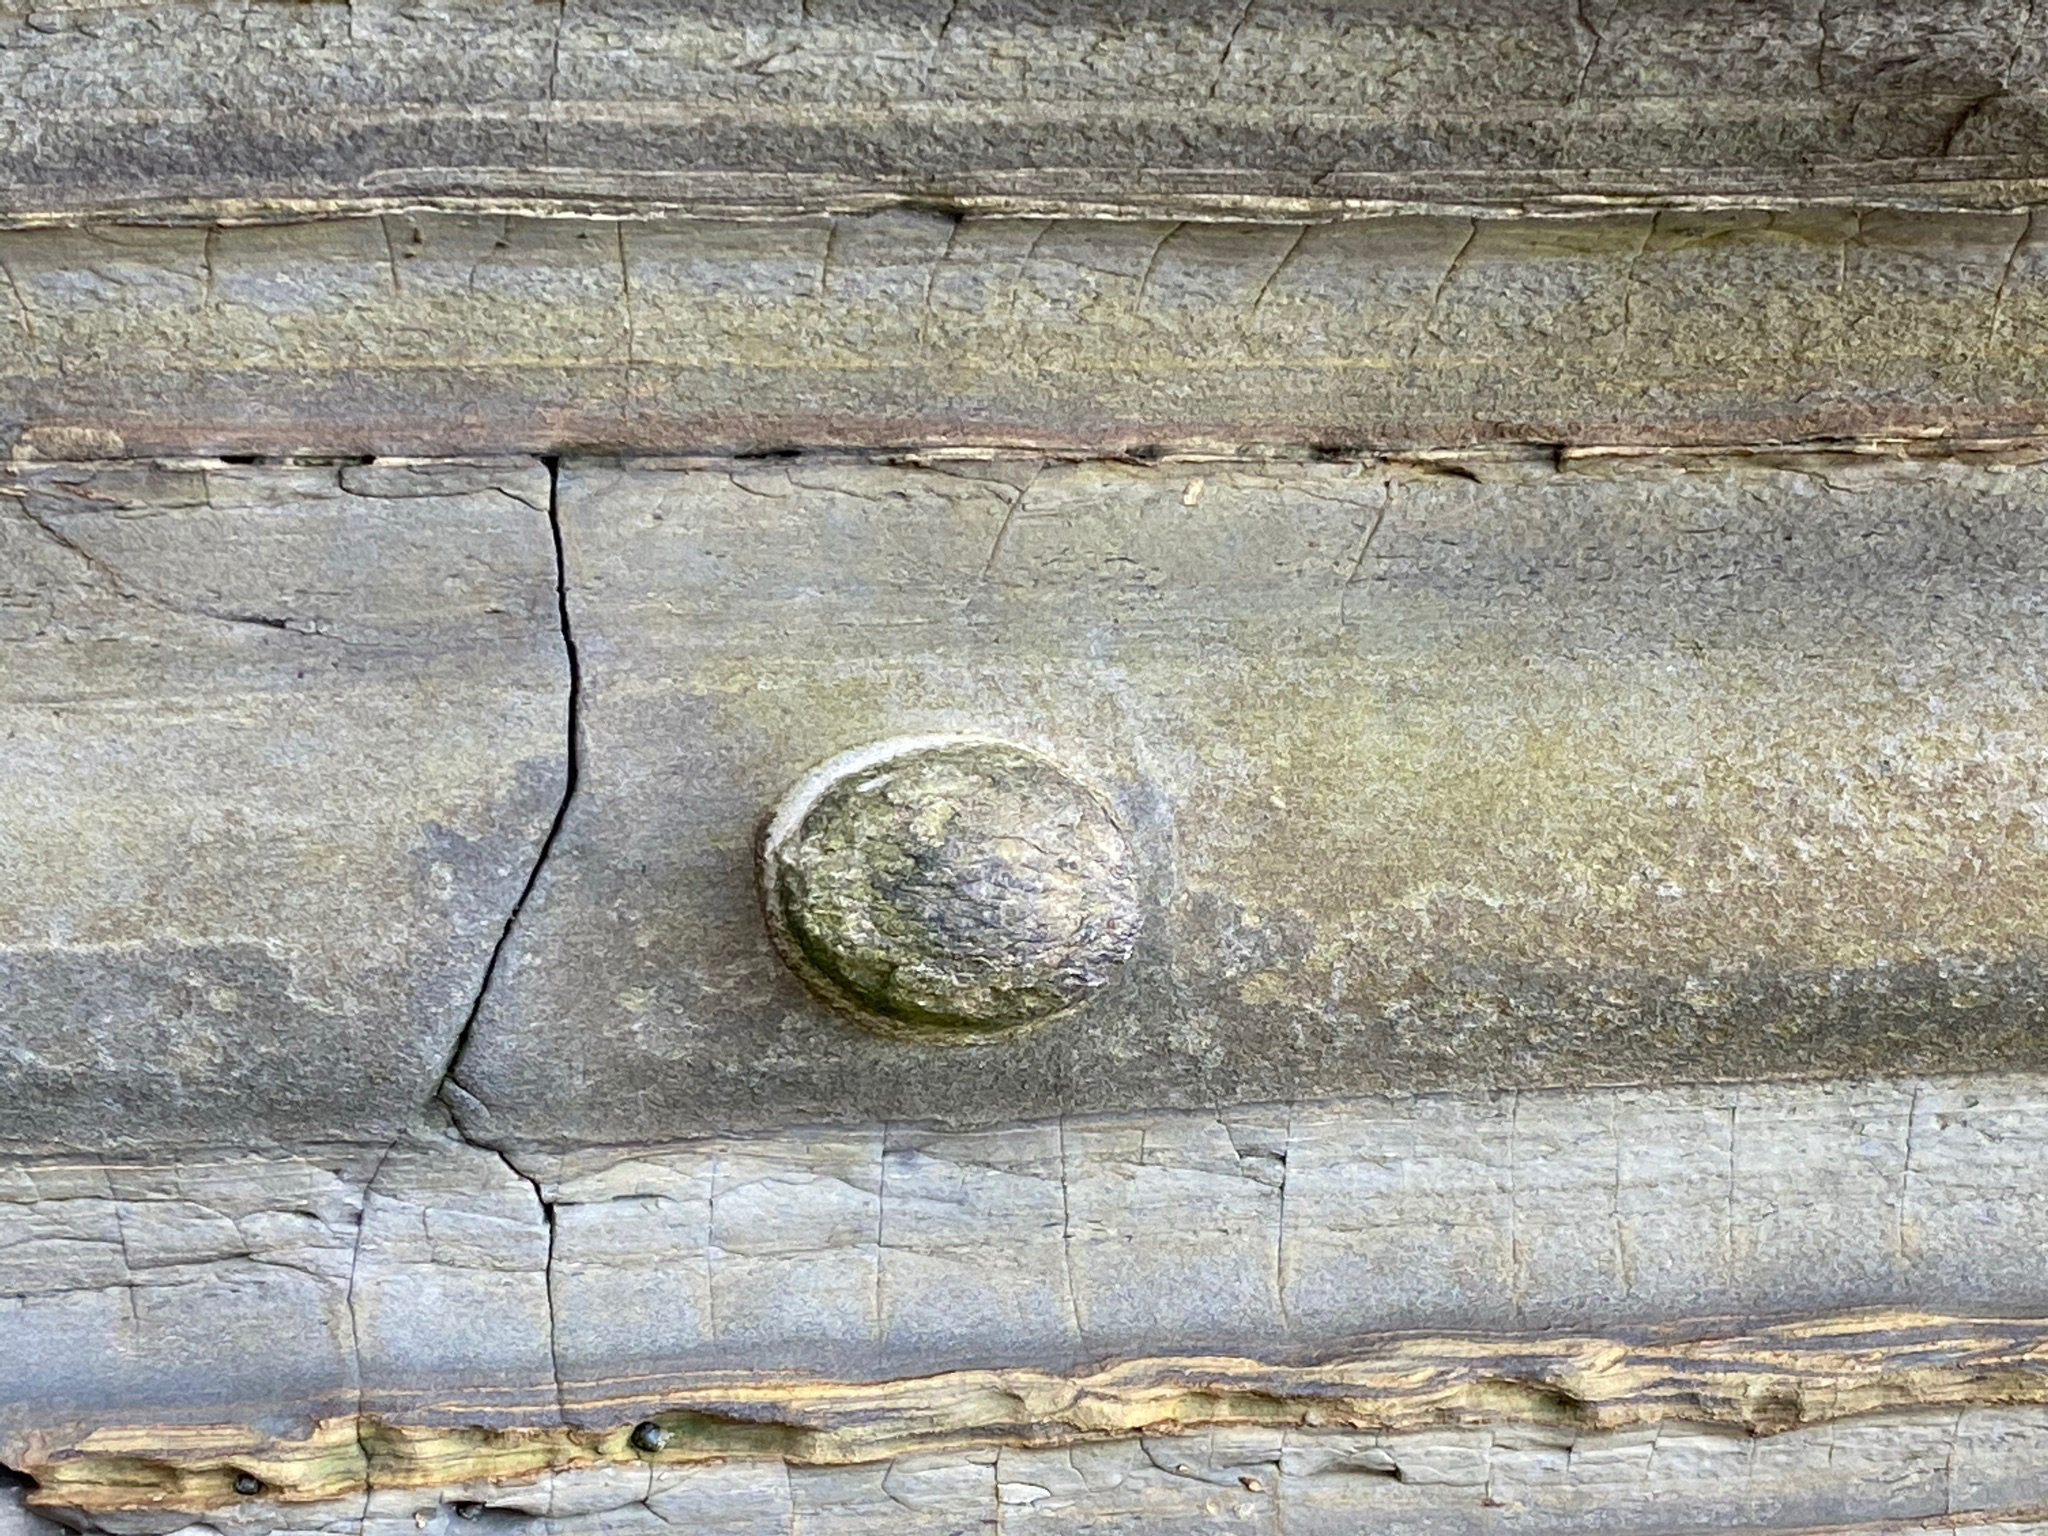
La Jolla Cove is a small bay with a beach on the east side of Point La Jolla (Figures 15 and 16). The cove is used by snorkelers and divers to swim out to explore the Underwater Park (discussed below). Note the contrast between a calm sea day versus when high swells are coming in along the coast (Figures 17 and 18). High waves create extremely hazardous conditions. They are also the force that carves the sea caves, arches, sea stacks, and headlands along the shore (Figures 19 to 21). Figures 22 and 23 show the first of severa; significant fracture zones (with possibly small, local faults) that cut the Point Loma Formation along the sea cliffs. The large, rounded rocks are concretions weathering out of the sandstone in the Point Loma Formation.
Goldfish Point is host to Clam's Cave, the first of a series of sea caves that have formed along fracture zones and small faults exposed in the sea cliff (Figure 24). Sunny Jim's Sea Cave associated with The Cave Store is on the east side of Goldfish Point (discussed below). |
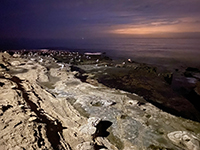
Fig. 13. View west over rocks and birds after sunset at La Jolla Point.
|
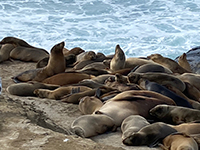
Fig. 14. Sea lions on the rocky shore at La Jolla Point.
|
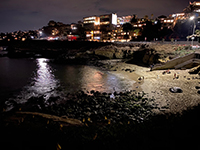
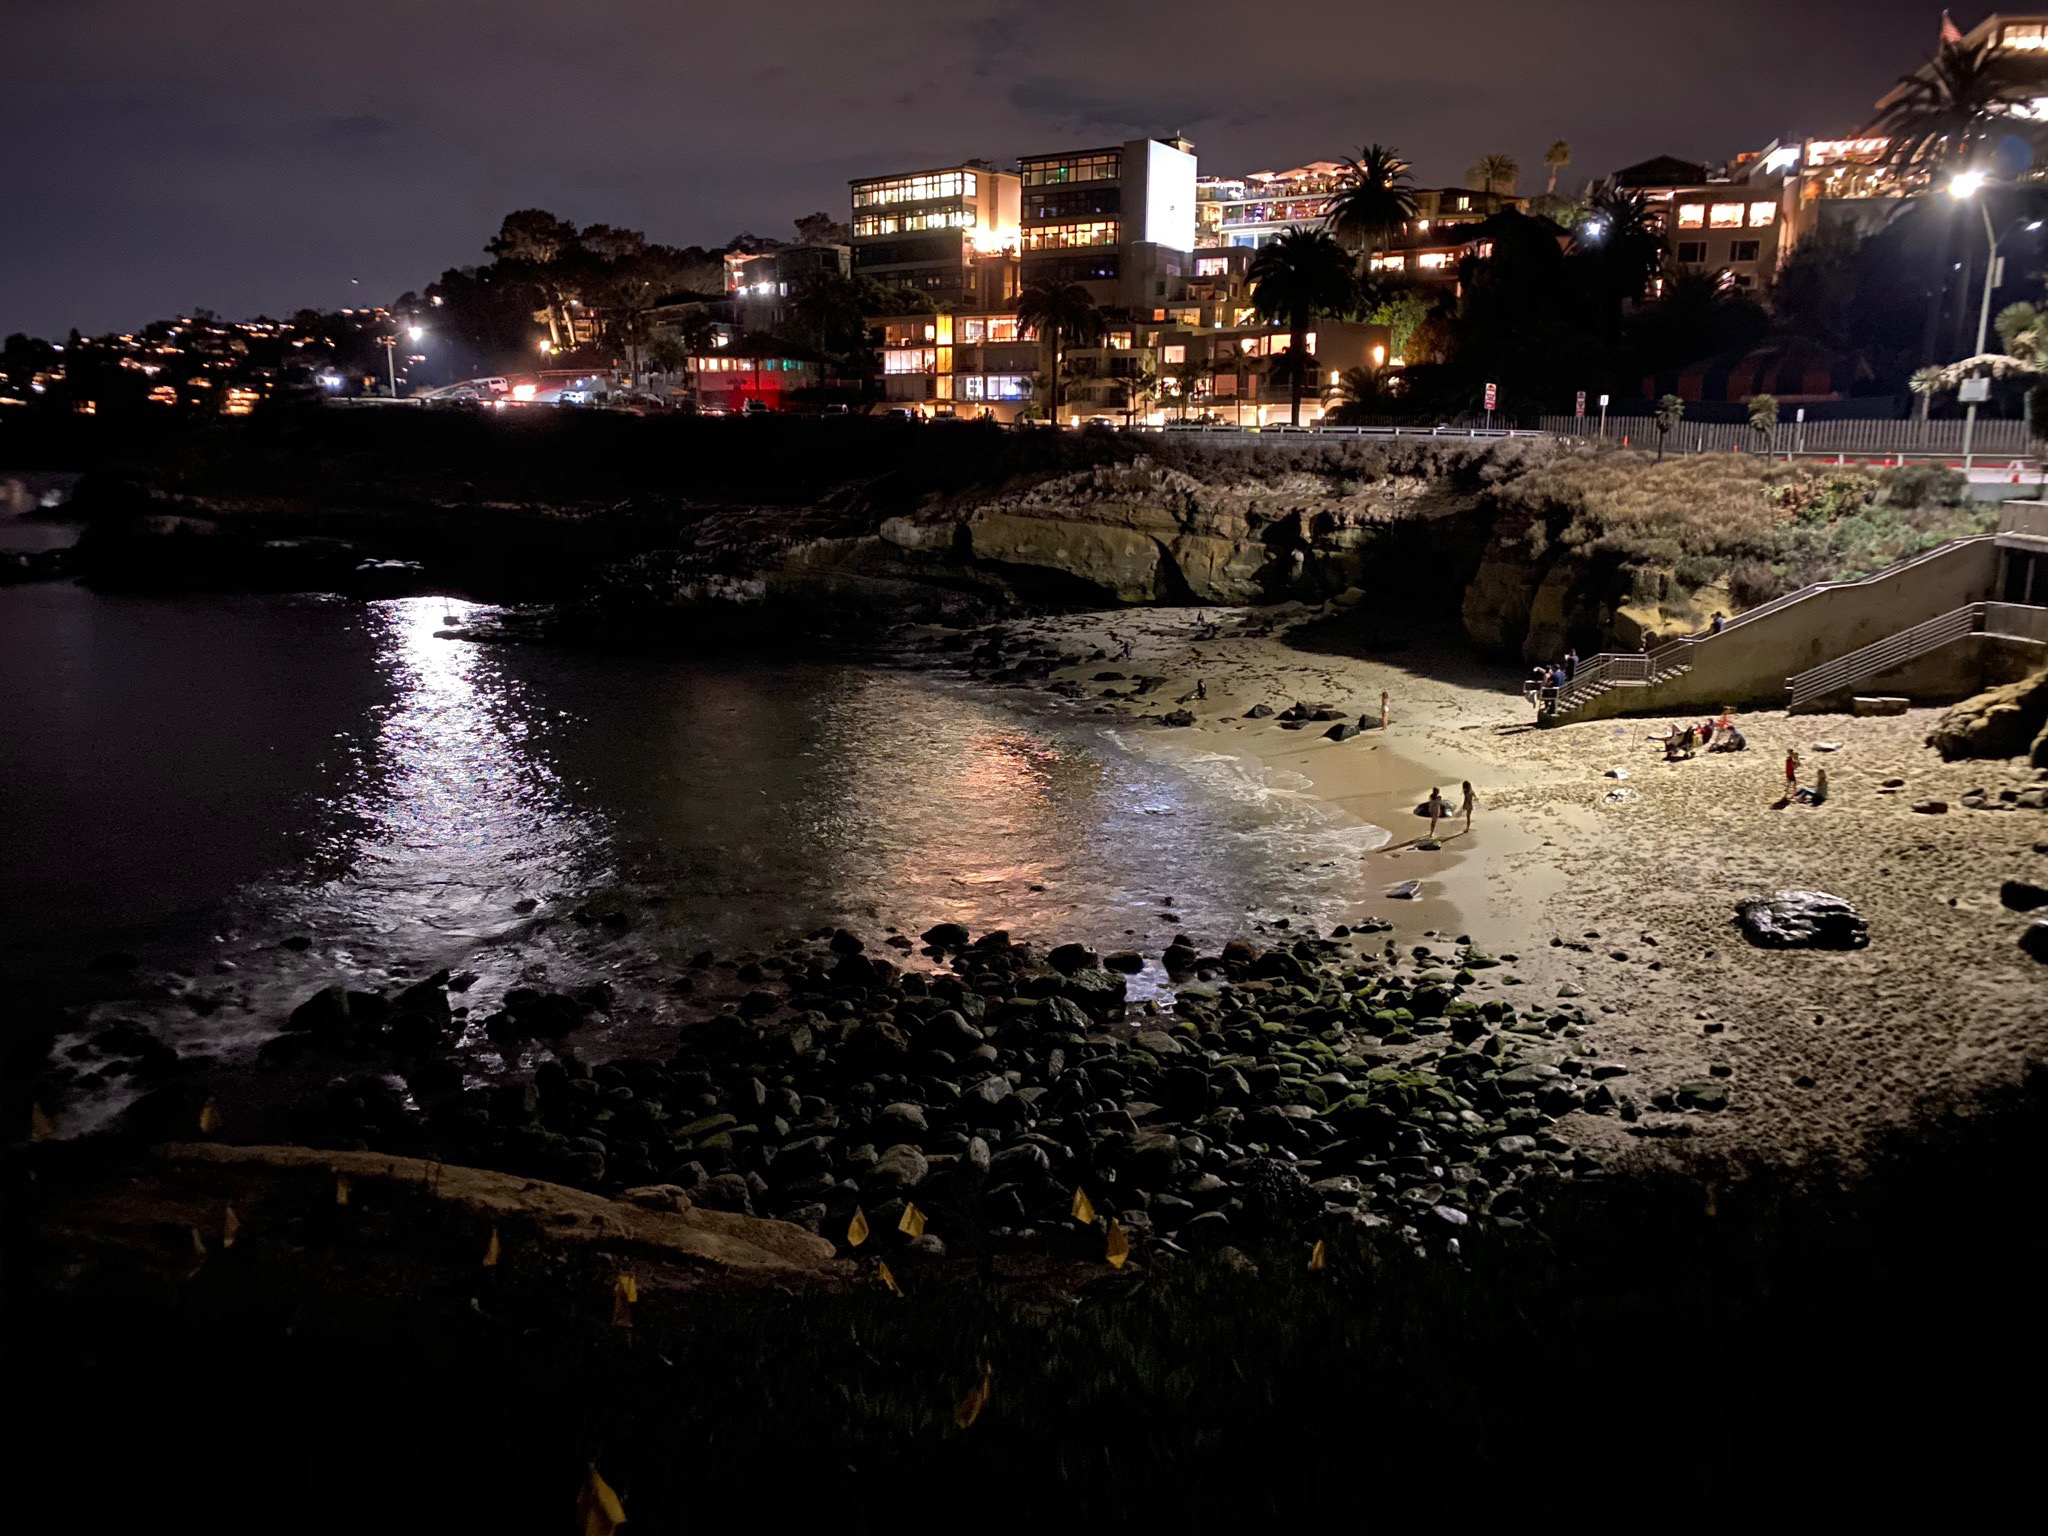
Fig. 15. View looking east at night at La Jolla Cove with the La Jolla urban skyline.
|
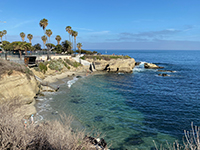
Fig. 16. Cretaceous-age strata exposed around La Jolla Cove dips to the south.
|

Fig. 17. Elevated wave-cut-bench on east side of La Jolla Cove.
|

Fig. 18. Waves crashing on headlands near La Jolla Cove.
|

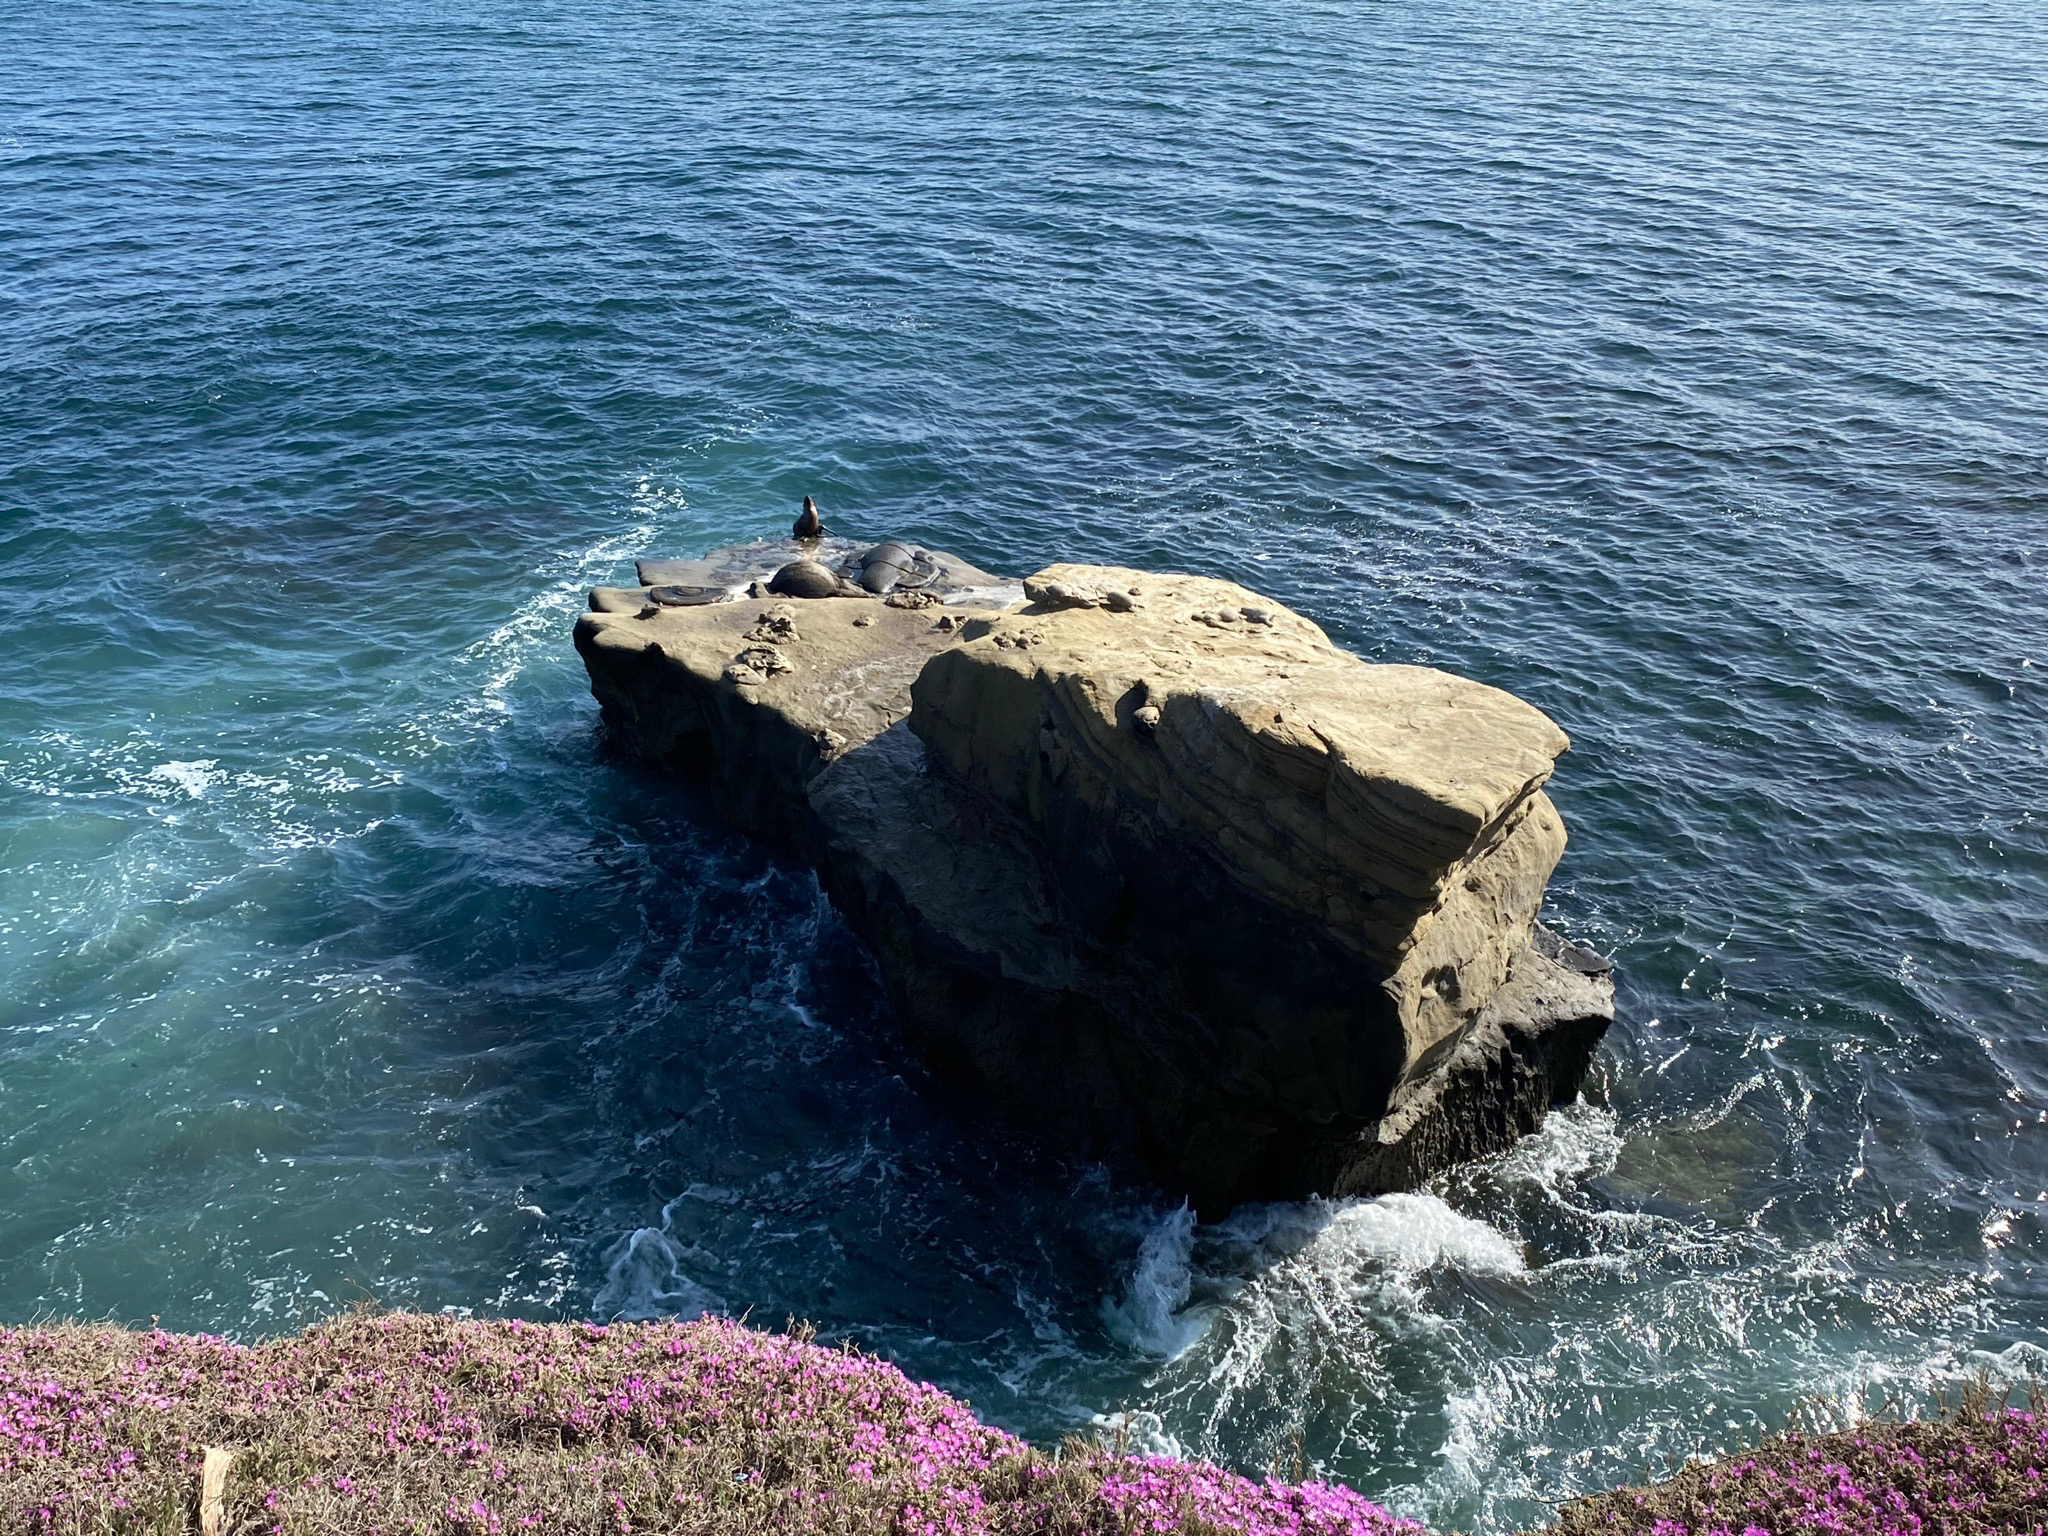
Fig. 19. Small sea stack off the headland on the west side of La Jolla Cove. |

Fig. 20. Sea lions on on dipping Cretaceous strata on La Jolla Cove's sea stack. |

Fig. 21. A small sea cave (or arch) on the west side of La Jolla Cove.
|

Fig. 22. Erosion along fracture exposes concretions in Cretaceous-age sandstone near La Jolla Cove.
|
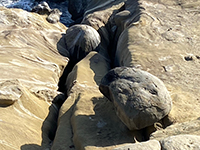
Fig. 23. Concretions weathering out along fractures in Cretaceous sandstone in sea cliff east of La Jolla Cove. |
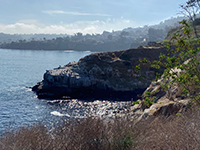
Fig. 24. Goldfish Point juts out next to the cove with Clam's Cave, the only sea cave you can easily see from the trail.
|
|
A8
The Cave Store and Sunny Jim's Sea Cave Tour
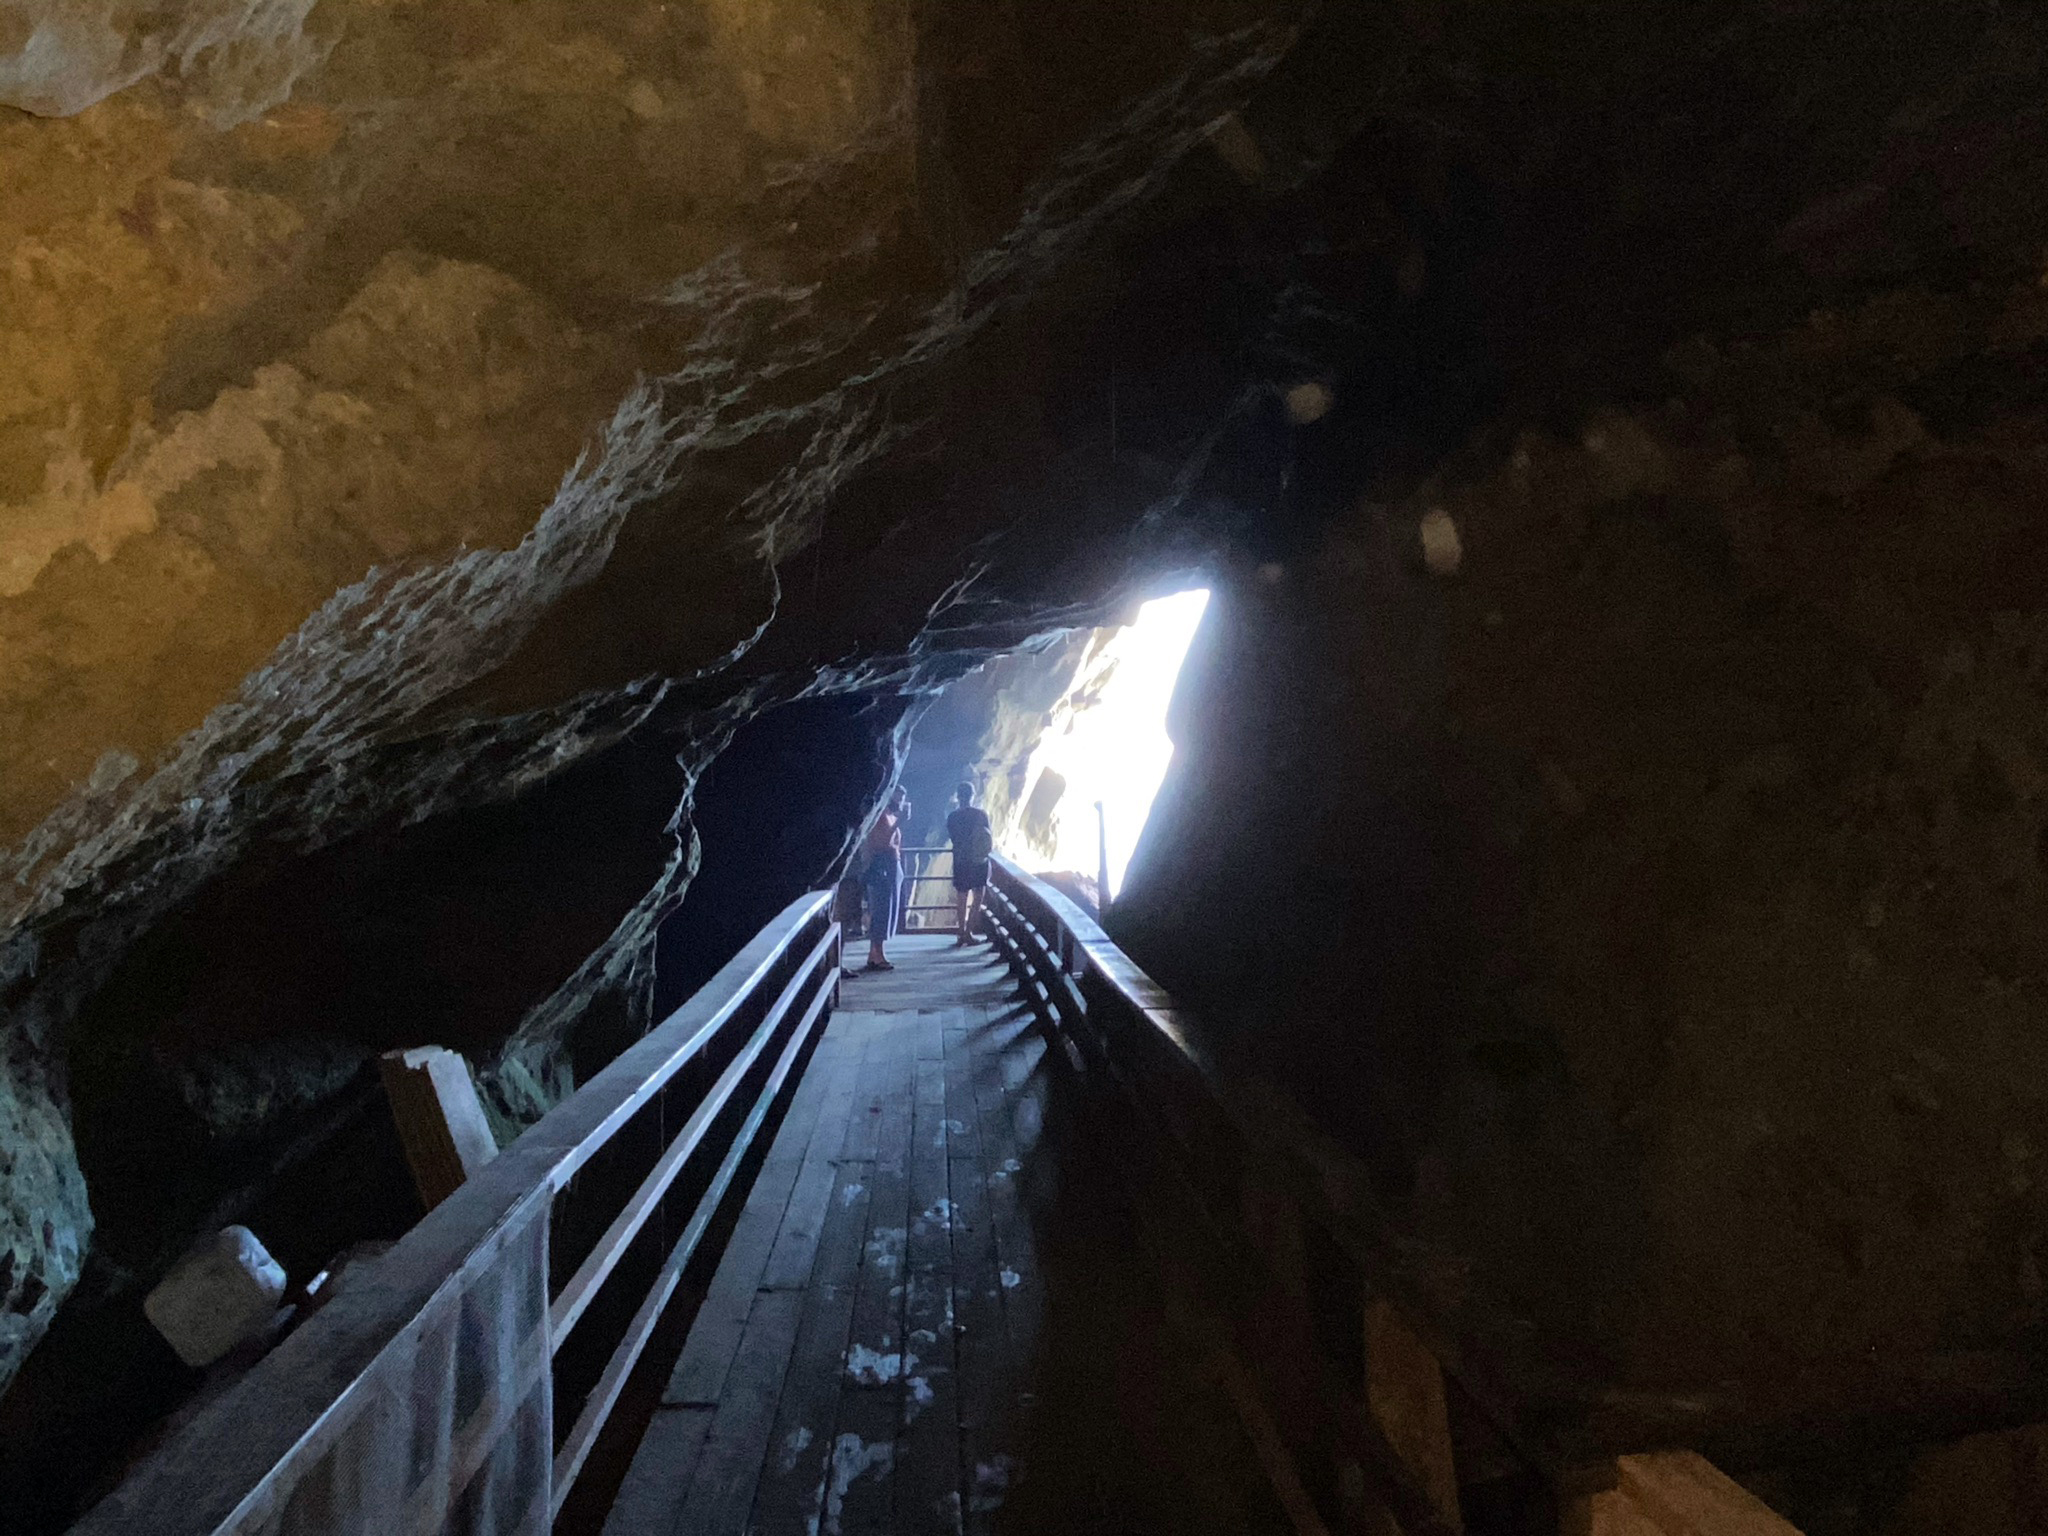
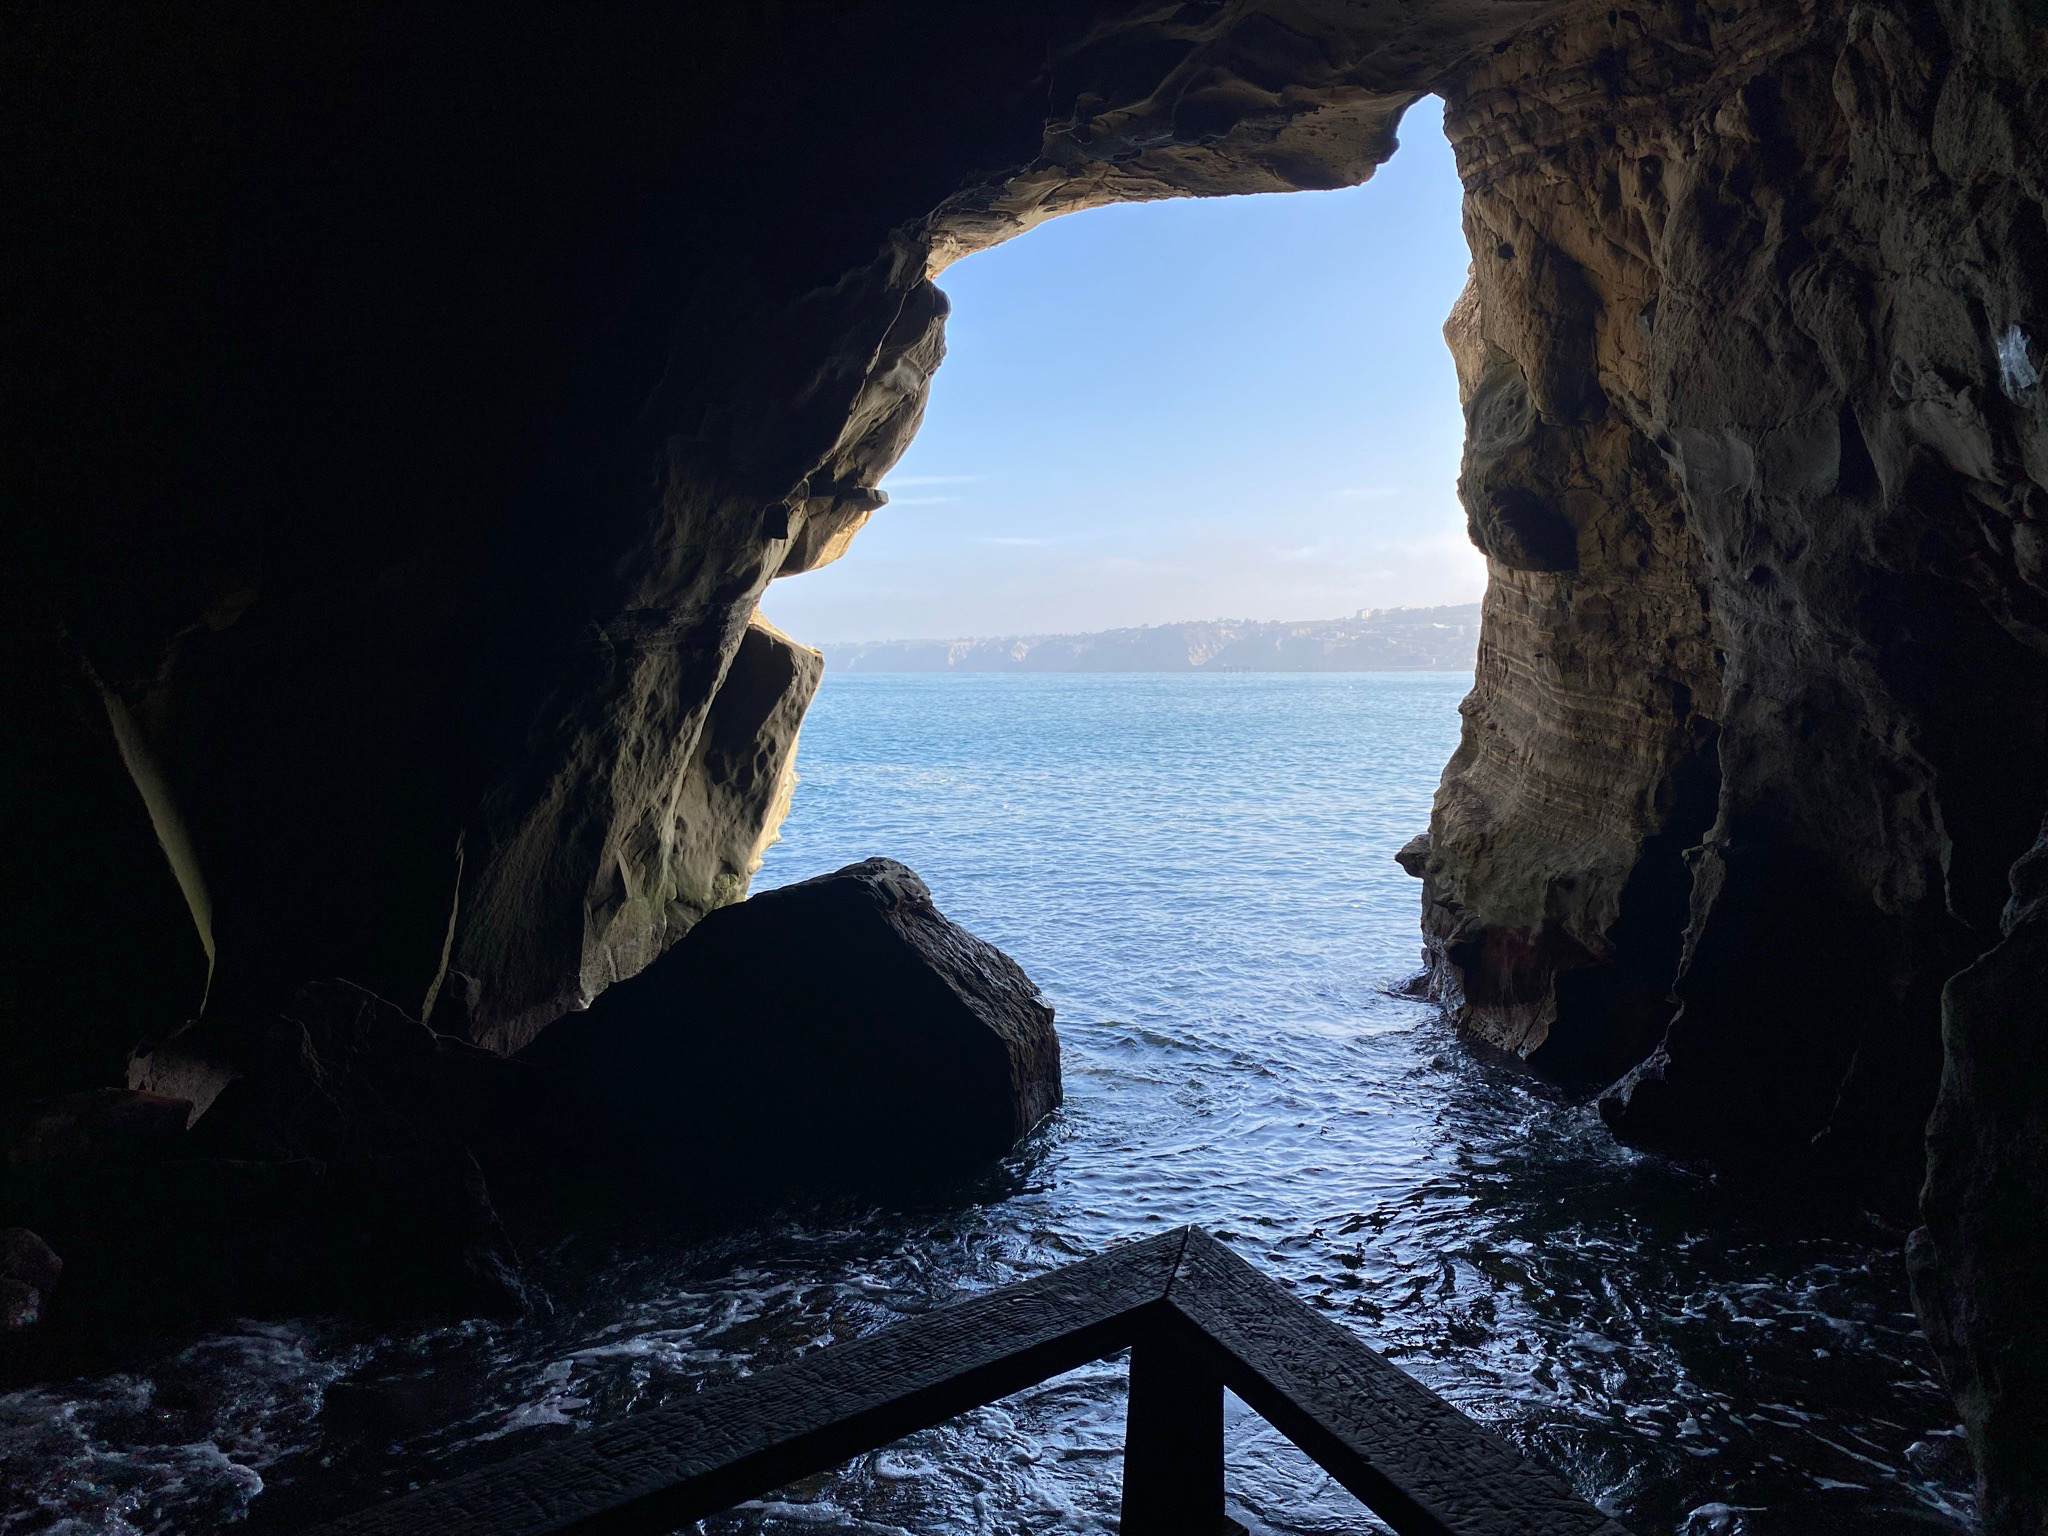
The western end of the Coast Walk Trail starts near The Cave Store located at 1325 Coast Boulevard not far from La Jolla Cove (Figure 25). The Cave Store is host to a dug-out tunnel constructed in 1902 that connects to the Sunny Jim's Sea Cave. Local lore is that bootleggers used the sea cave and tunnel during Prohibition to smuggle alcohol and opium into San Diego. Self-guided tours starting in the store are 15-20 minutes and involve descending and climbing 144 stairs. Reservations can be made to take tours on some days, or you can stand in line and wait for an opportunity to walk in (see their website for details).
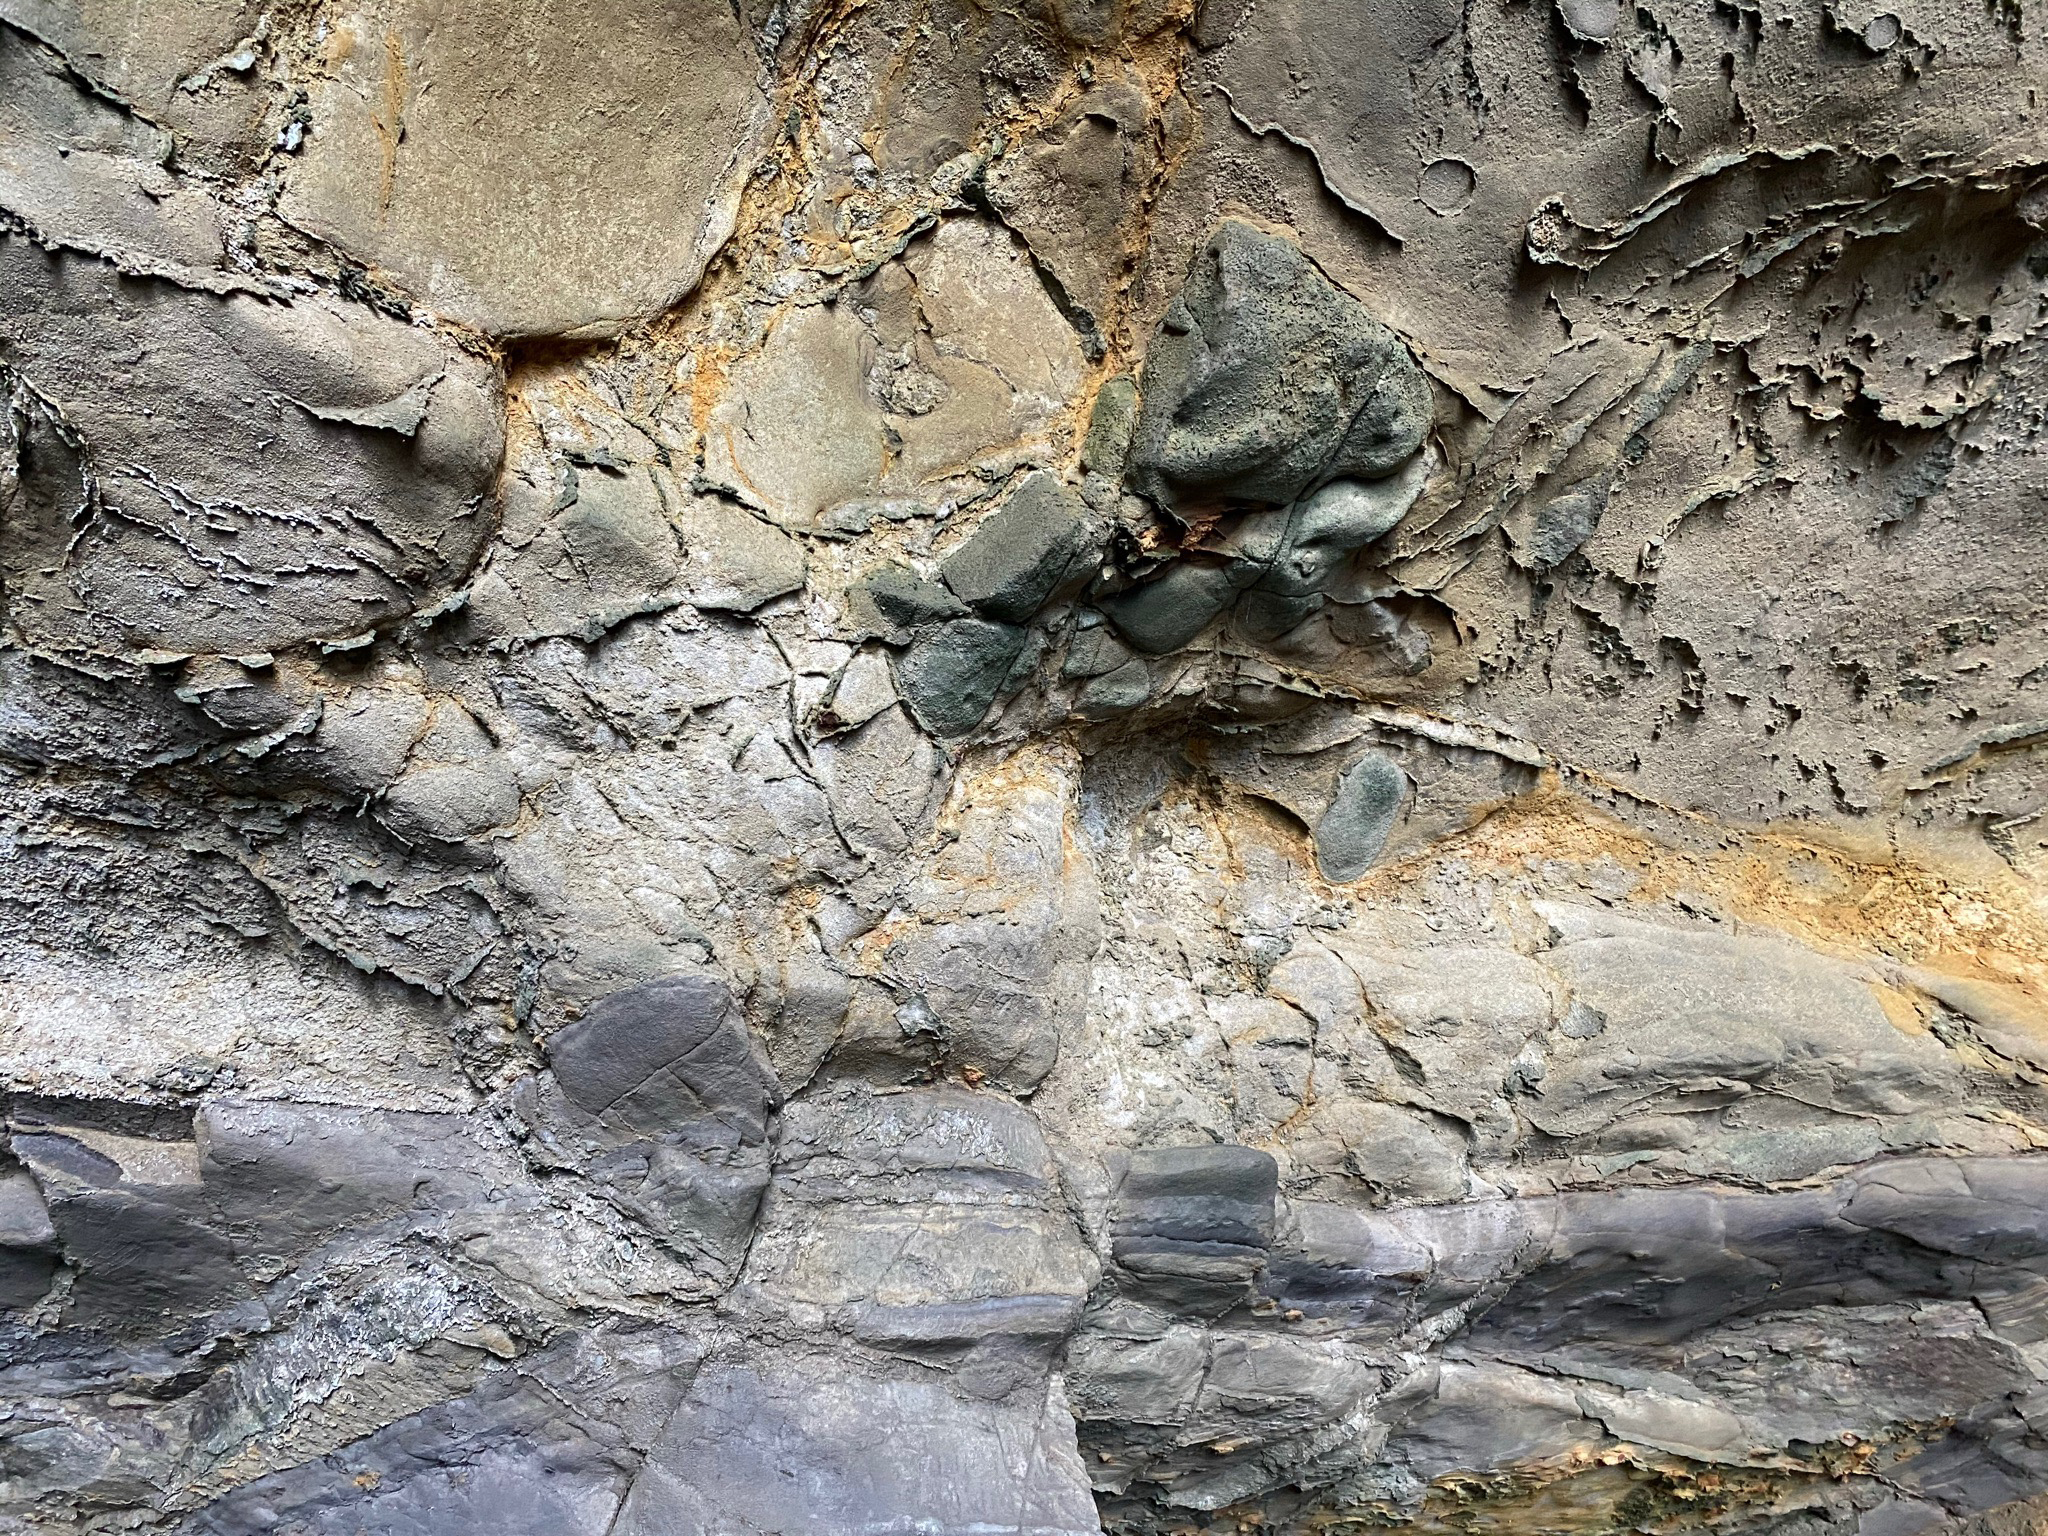
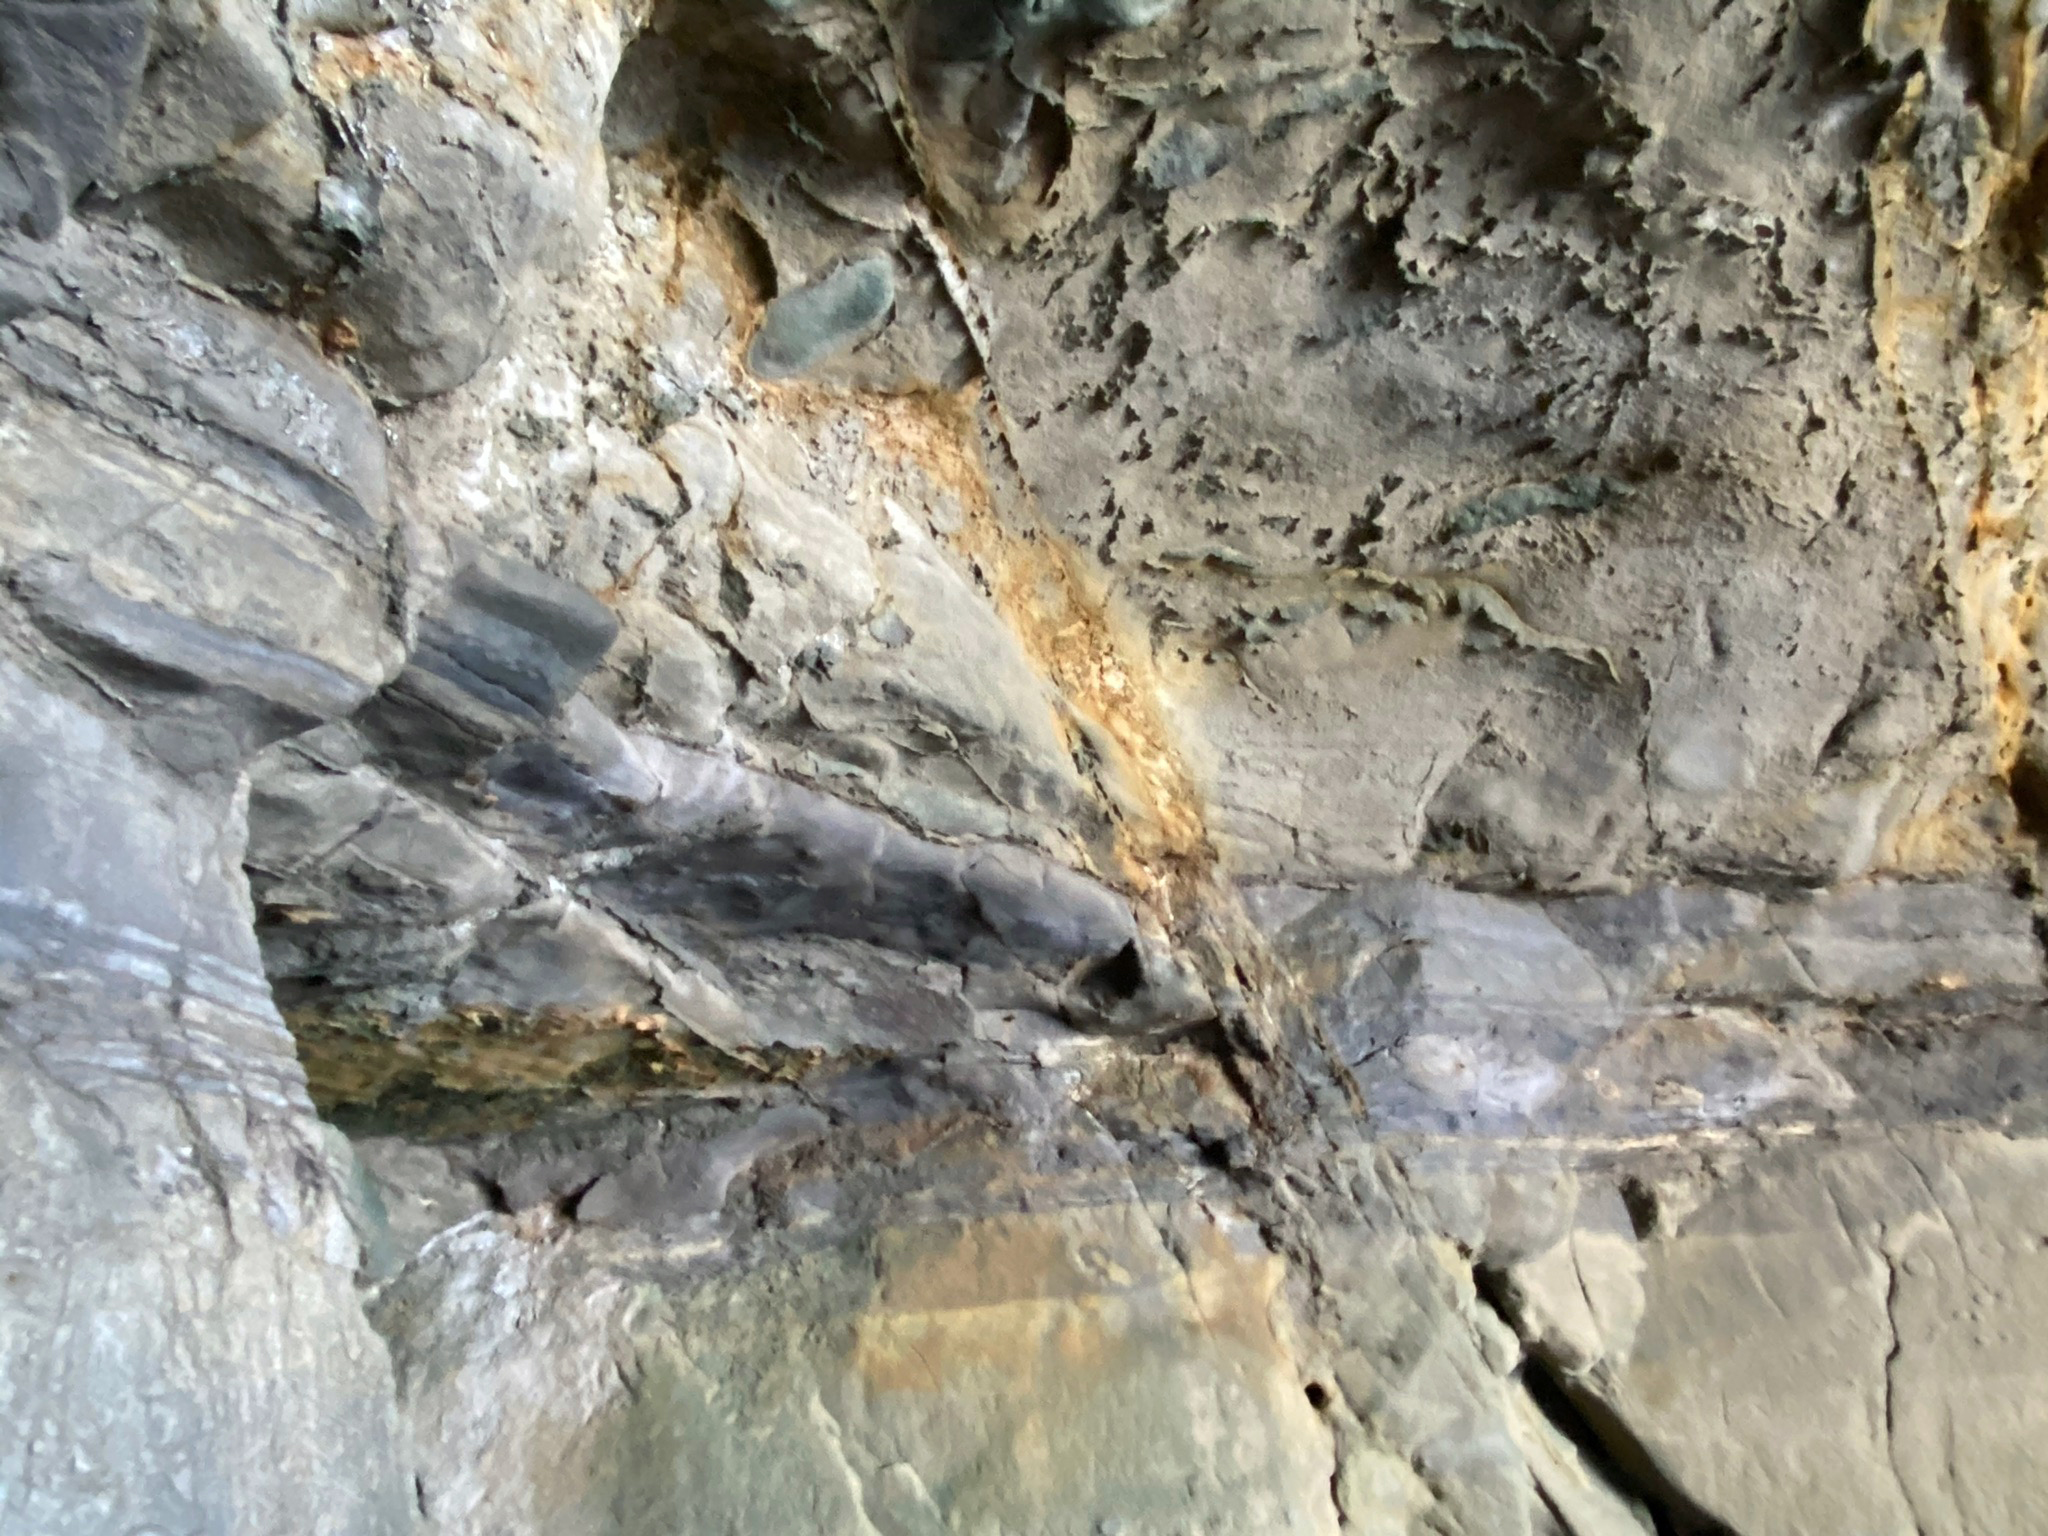
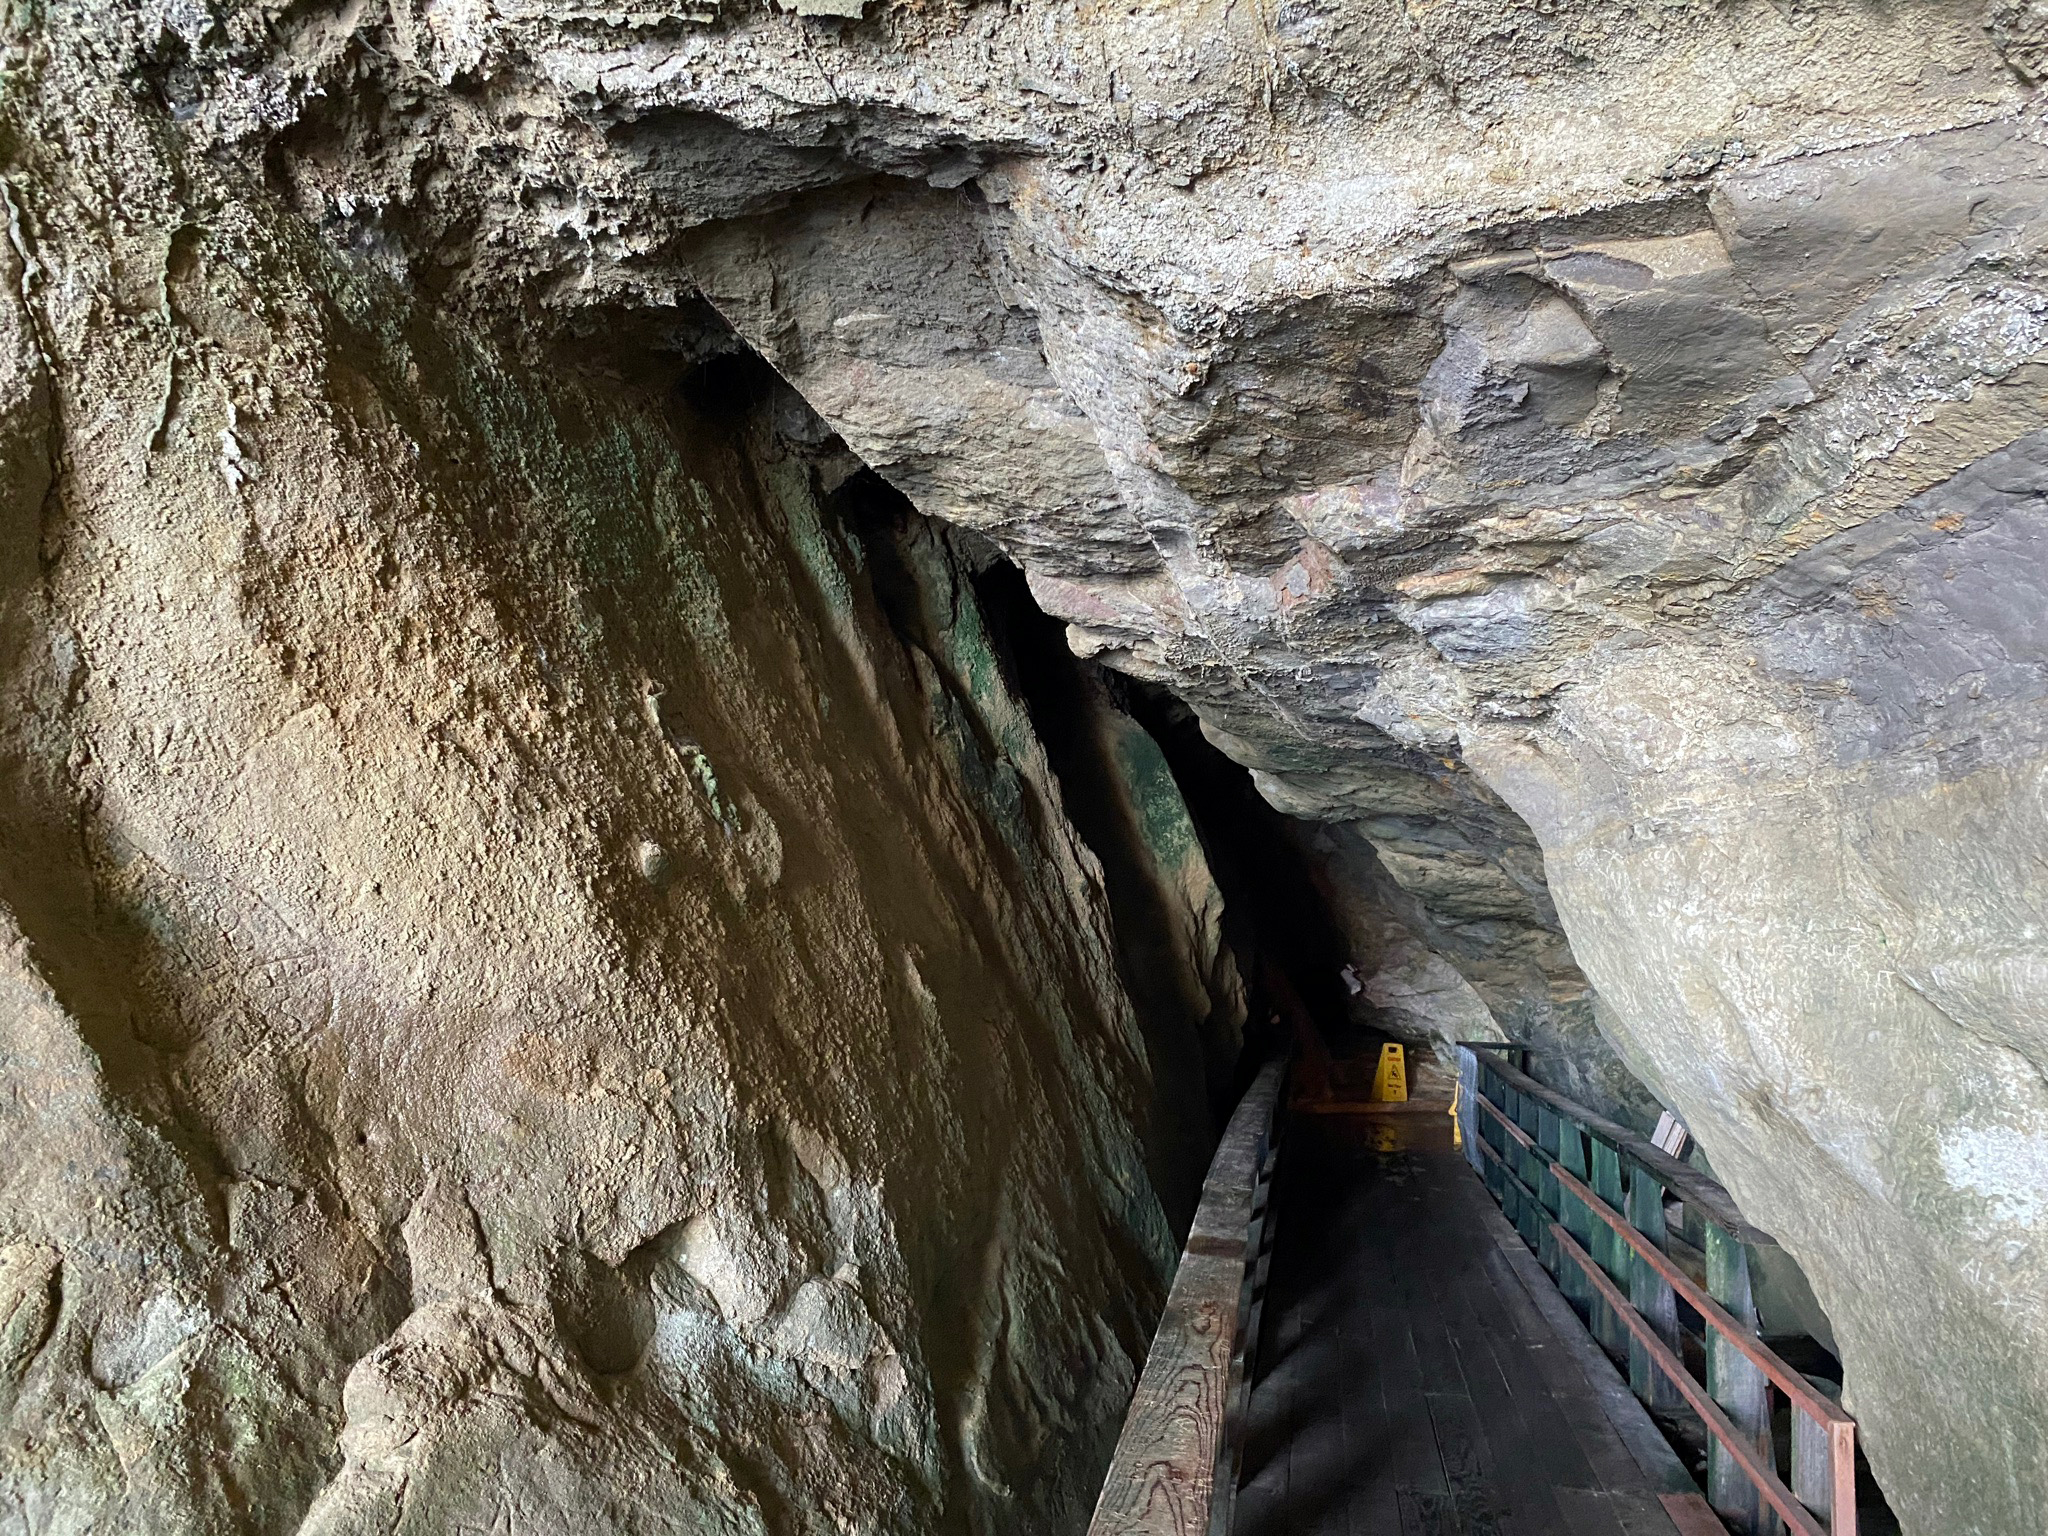
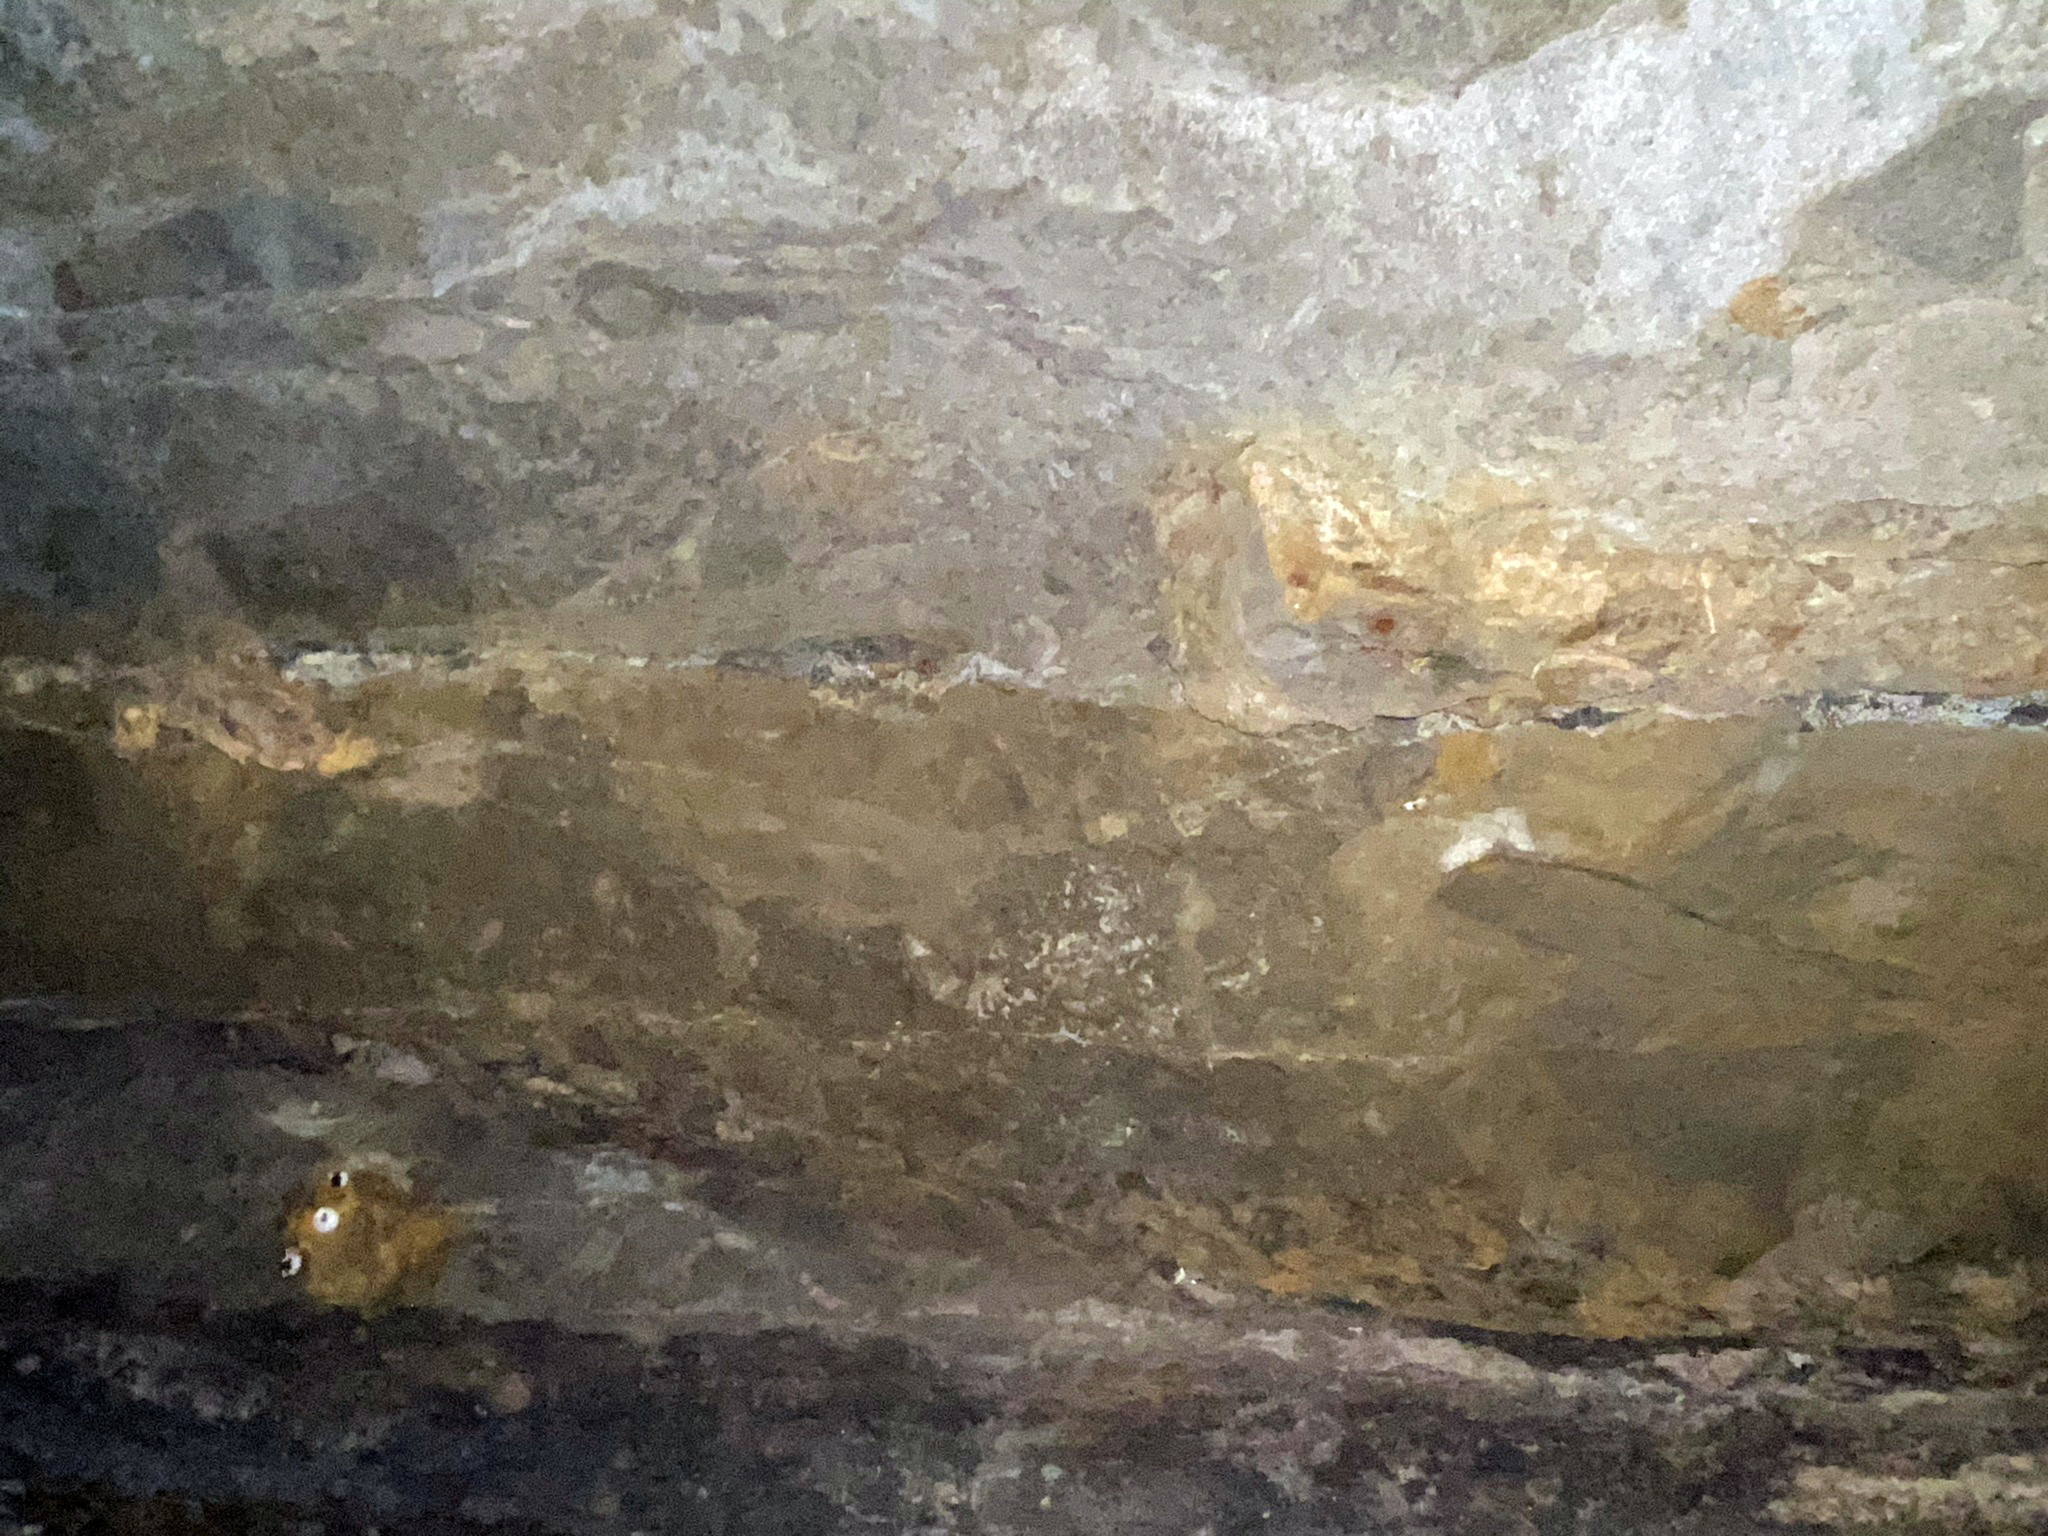
The passage down the stairs is an interesting way to see the Cretaceous-age strata of the Point Loma Formation. Watch for low spots in the ceiling as you got through the stairs tunnel (Figures 26 and 27). The stairs lead to a platform extending toward the mouth of the sea cave (Figures 28 and 29). You can easily how the sea cave eroded along small faults and fractures in the bedrock (Figures 30 to 33). |
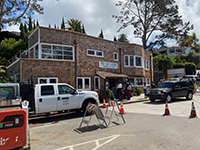
Fig. 25. The Cave Store offers a tour of the historic Sunny Jim's Sea Cave. It is one of the oldest tourist attractions in San Diego.
|
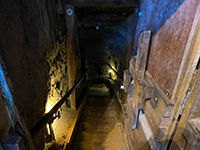
Fig. 26. Entrance to the tunnel in The Cave Store leading to Sunny Jim's Sea Cave. |
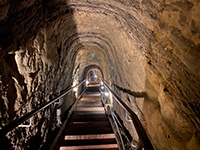
Fig. 27. Stairs leading down through the tunnel cut through Cretaceous-age strata. |

Fig. 28. Observation platform near the mouth of Sunny Jim's Sea Cave. |
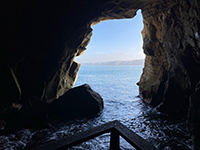
Fig. 29. View from the viewing platform at the mouth of Sunny Jim's Sea Cave. |
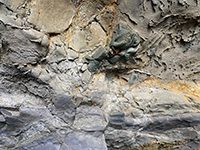
Fig. 30. Cretaceous-age deep-sea channel deposits are exposed in the sea cave wall.
|

Fig. 31. View of a small fault exposed in the wall of Sunny Jim's Sea Cave. |

Fig. 32. Sunny Jim's Sea Cave formed by erosion along a small fault/fracture zone. |

Fig. 33. Fracture lines can be seen in the sandstone roof of Sunny Jim's Sea Cave. |
|
A9
Coast Walk Trail
The La Jolla Shore Path runs from La Jolla Point eastward along Coast Boulevard past La Jolla Cove (Figure 34). It connects with Coast Walk Trail near Goldfish Point and The Cave Store (Figure 35). The Coast Walk Trail follows the top of the sea cliffs for a third of a mile between Goldfish Point and Torrey Pines Road (it is shown on the map, Figure 7). There are several overlooks along the trail where you can observe the seacliffs including some of the sea caves and fault zone features (Figures 36 and 37).
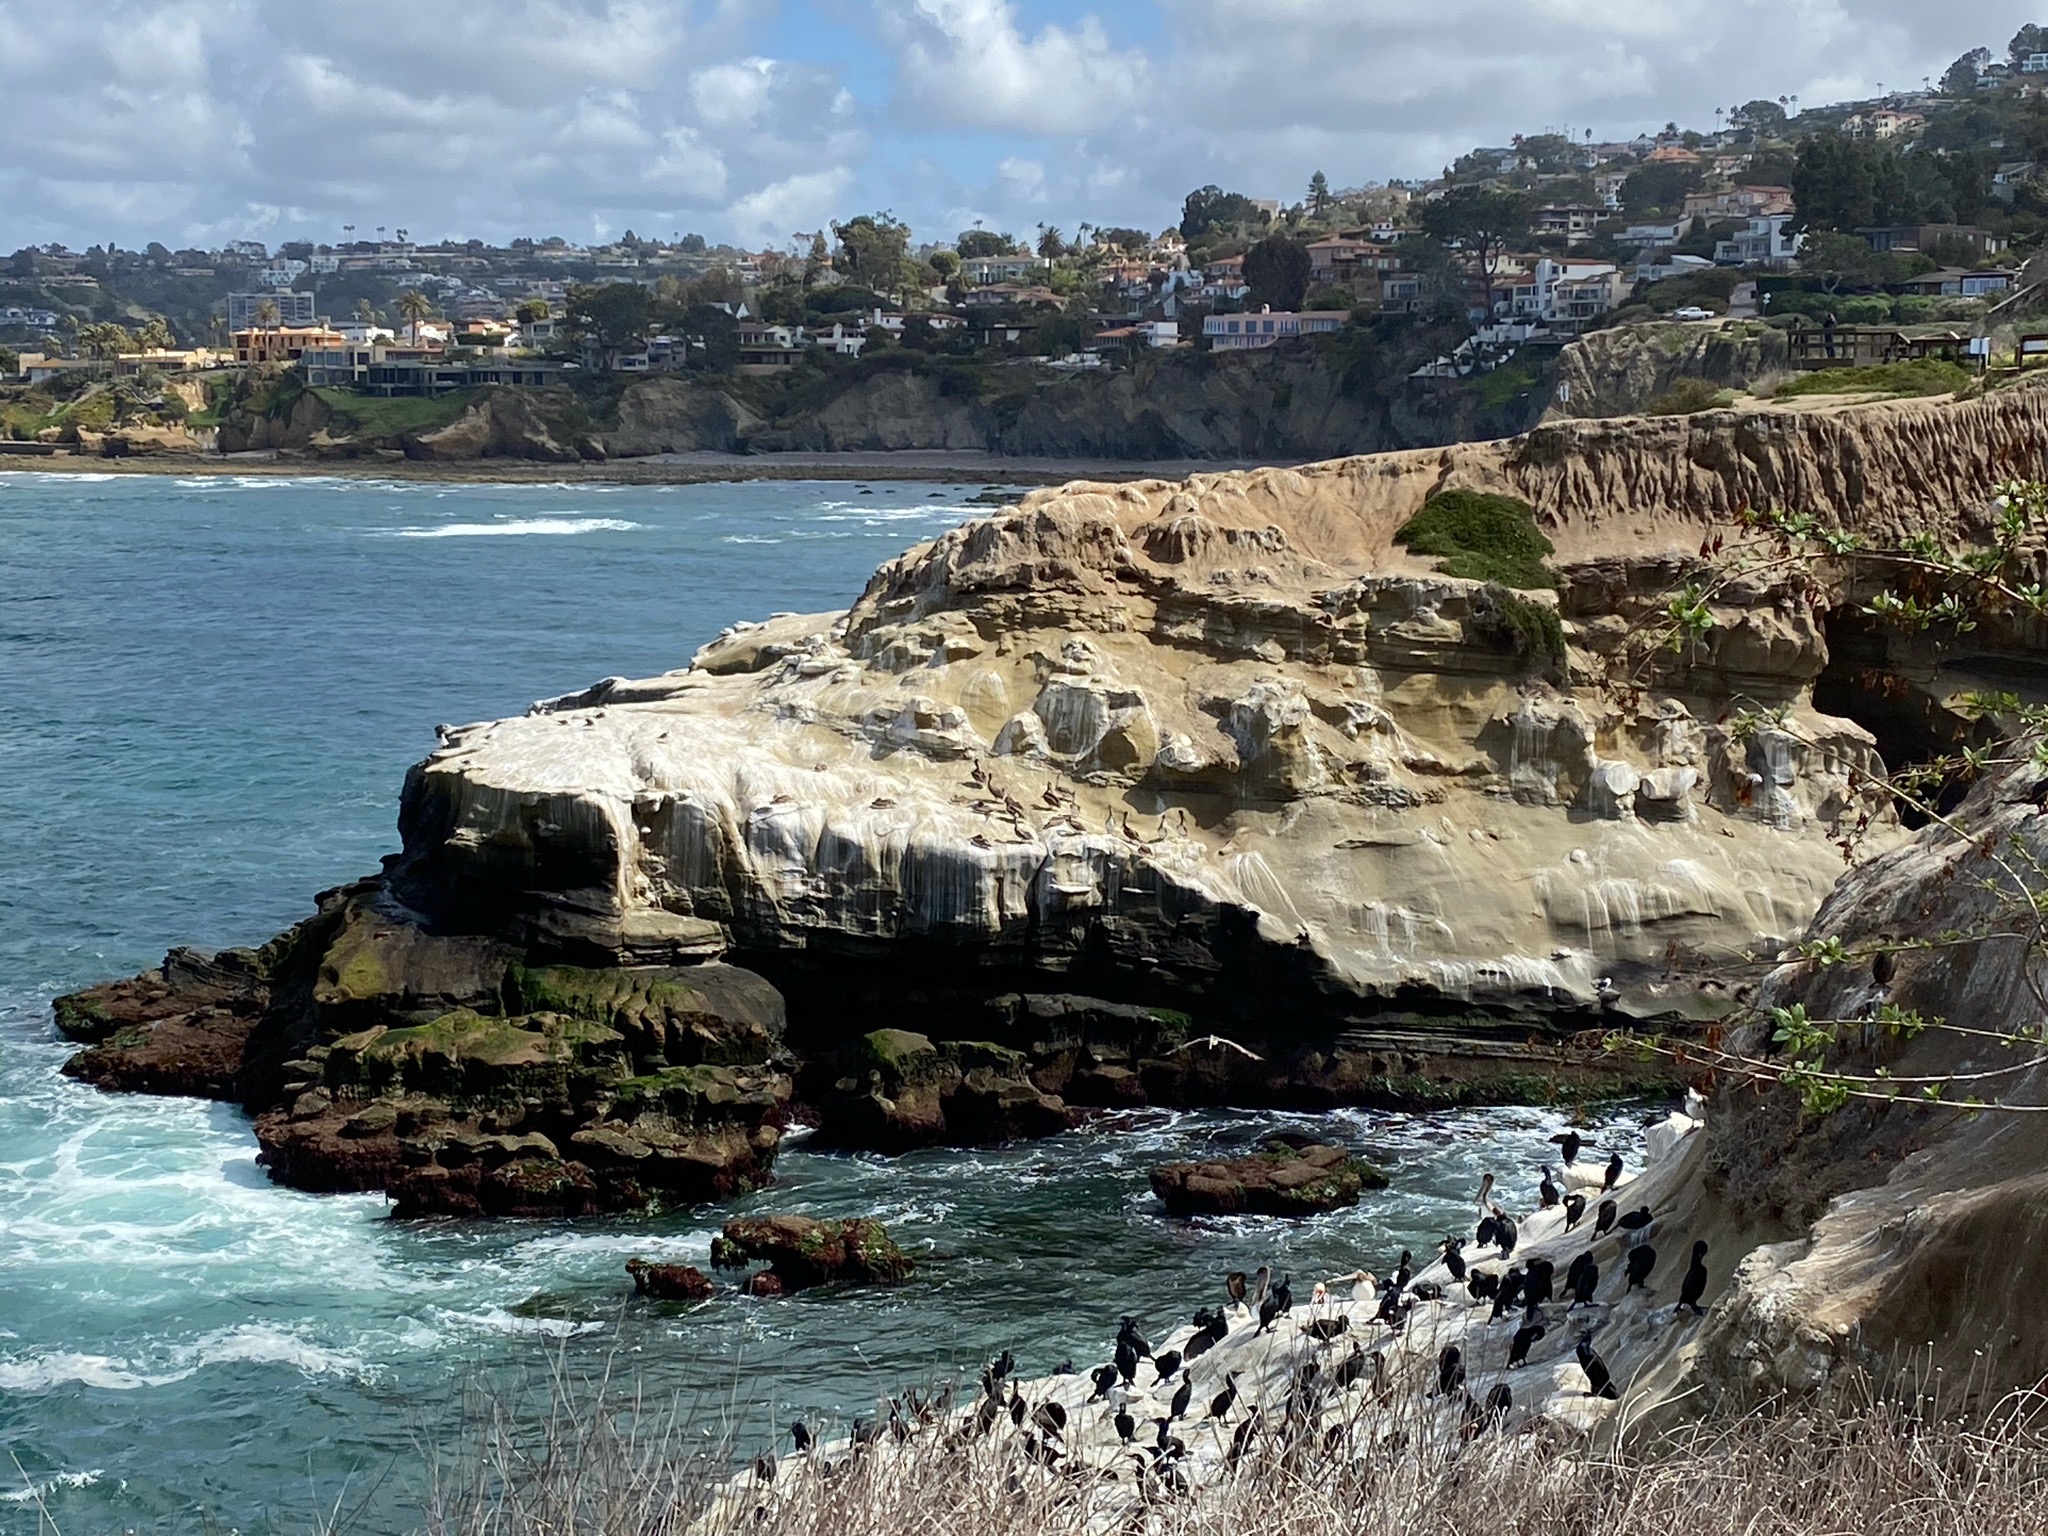
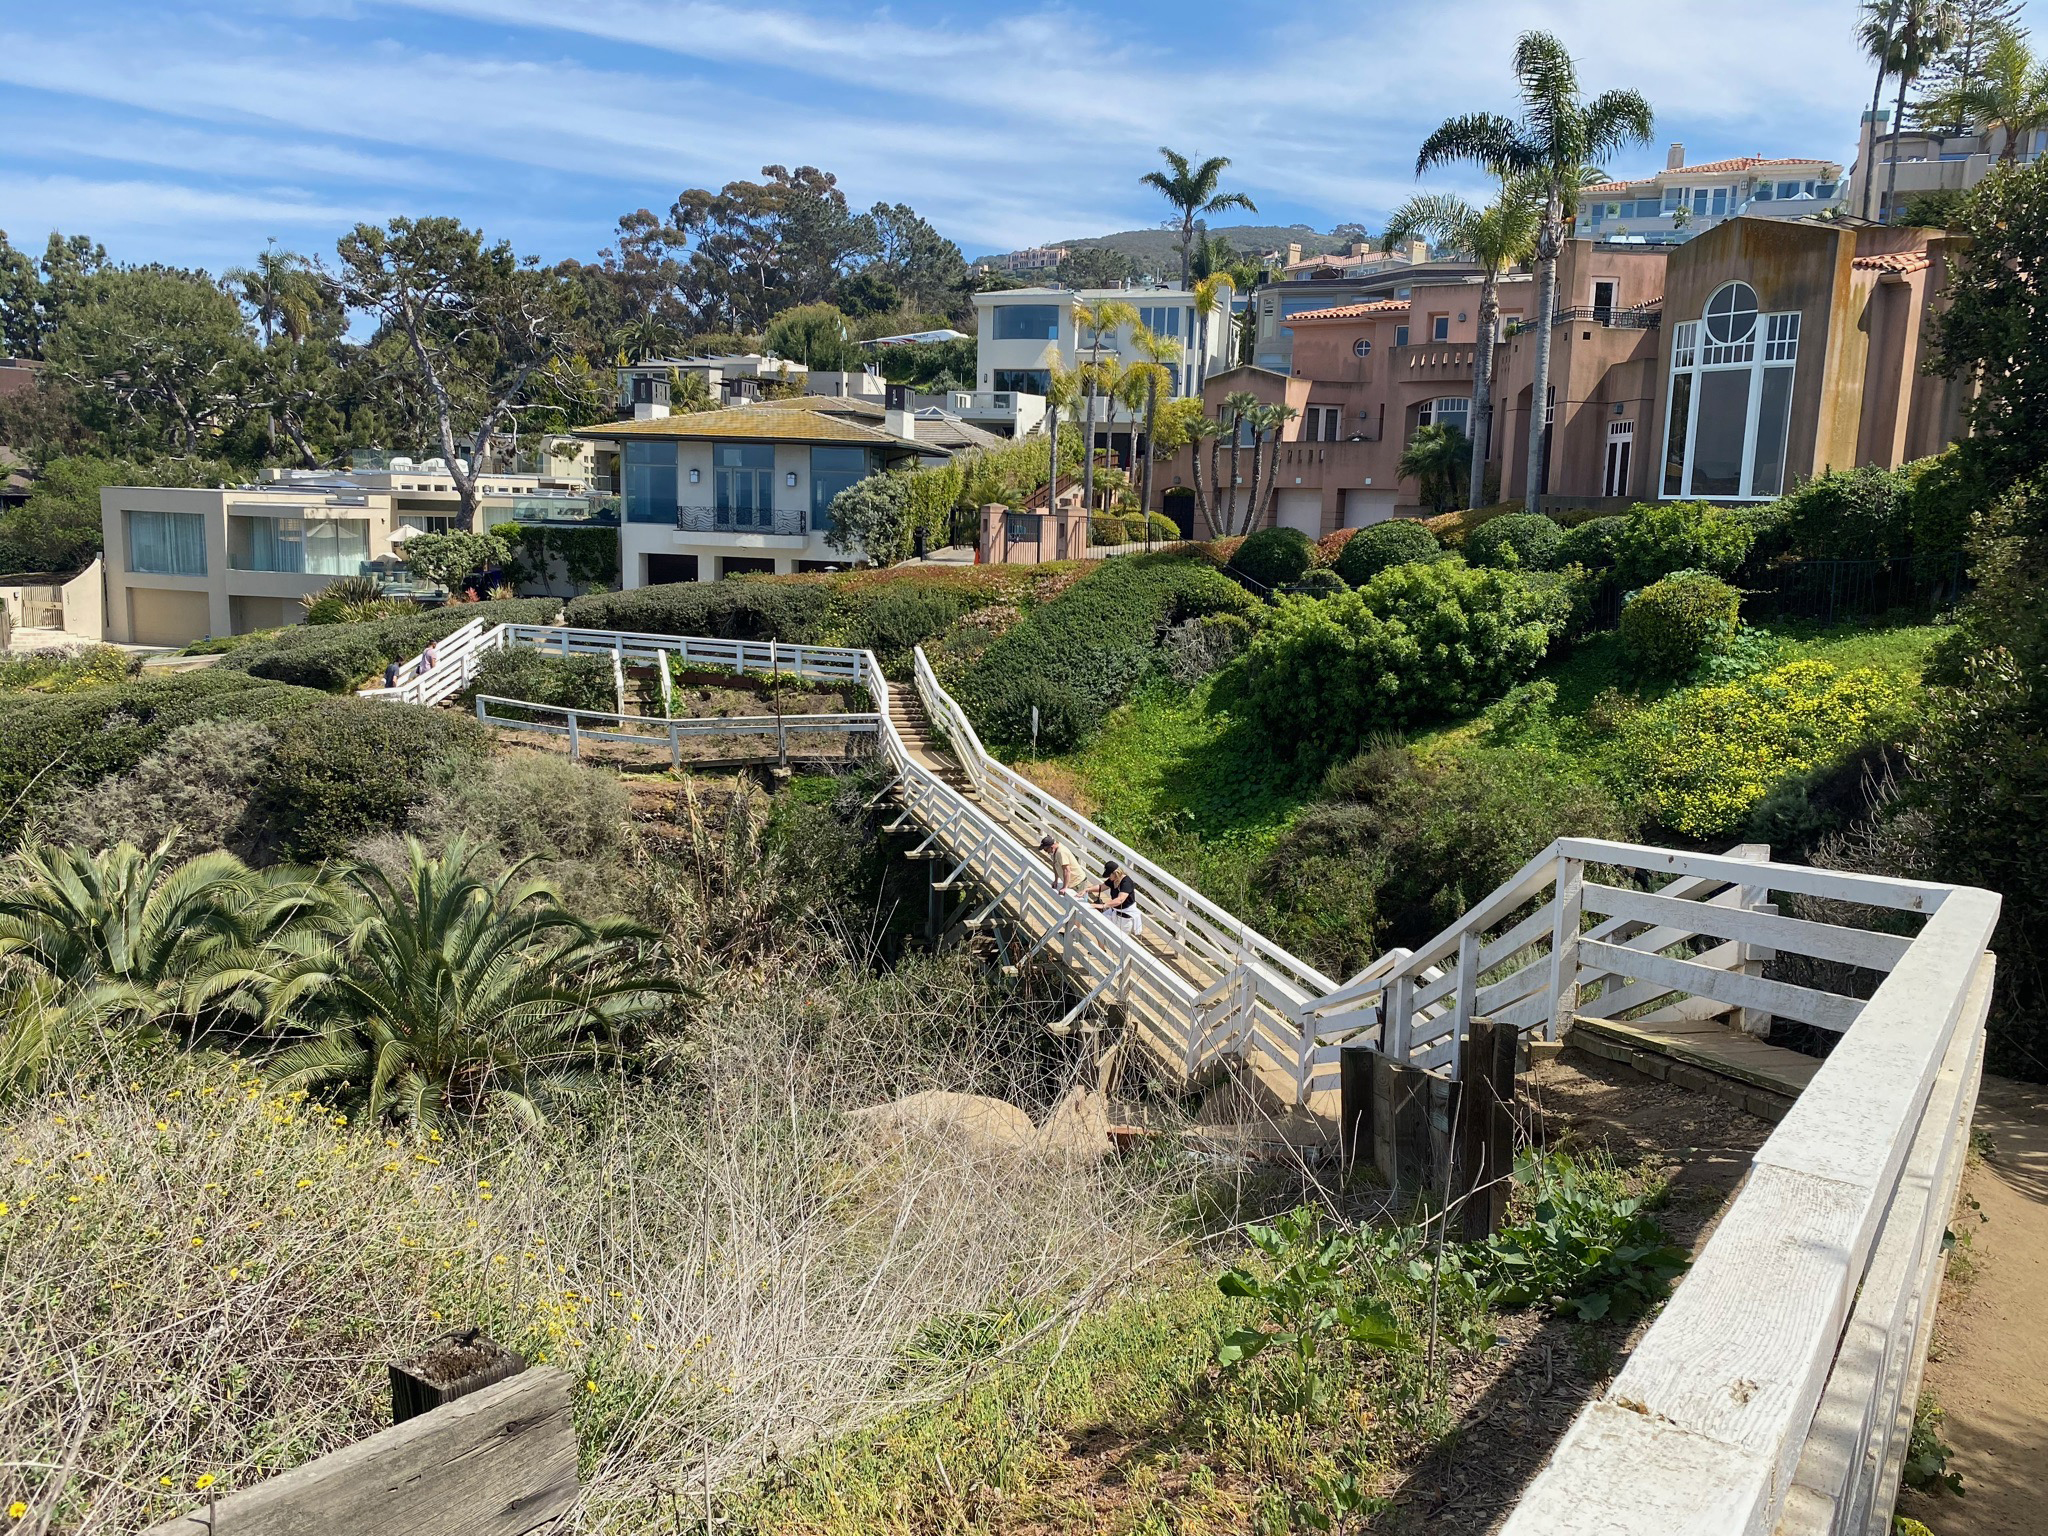
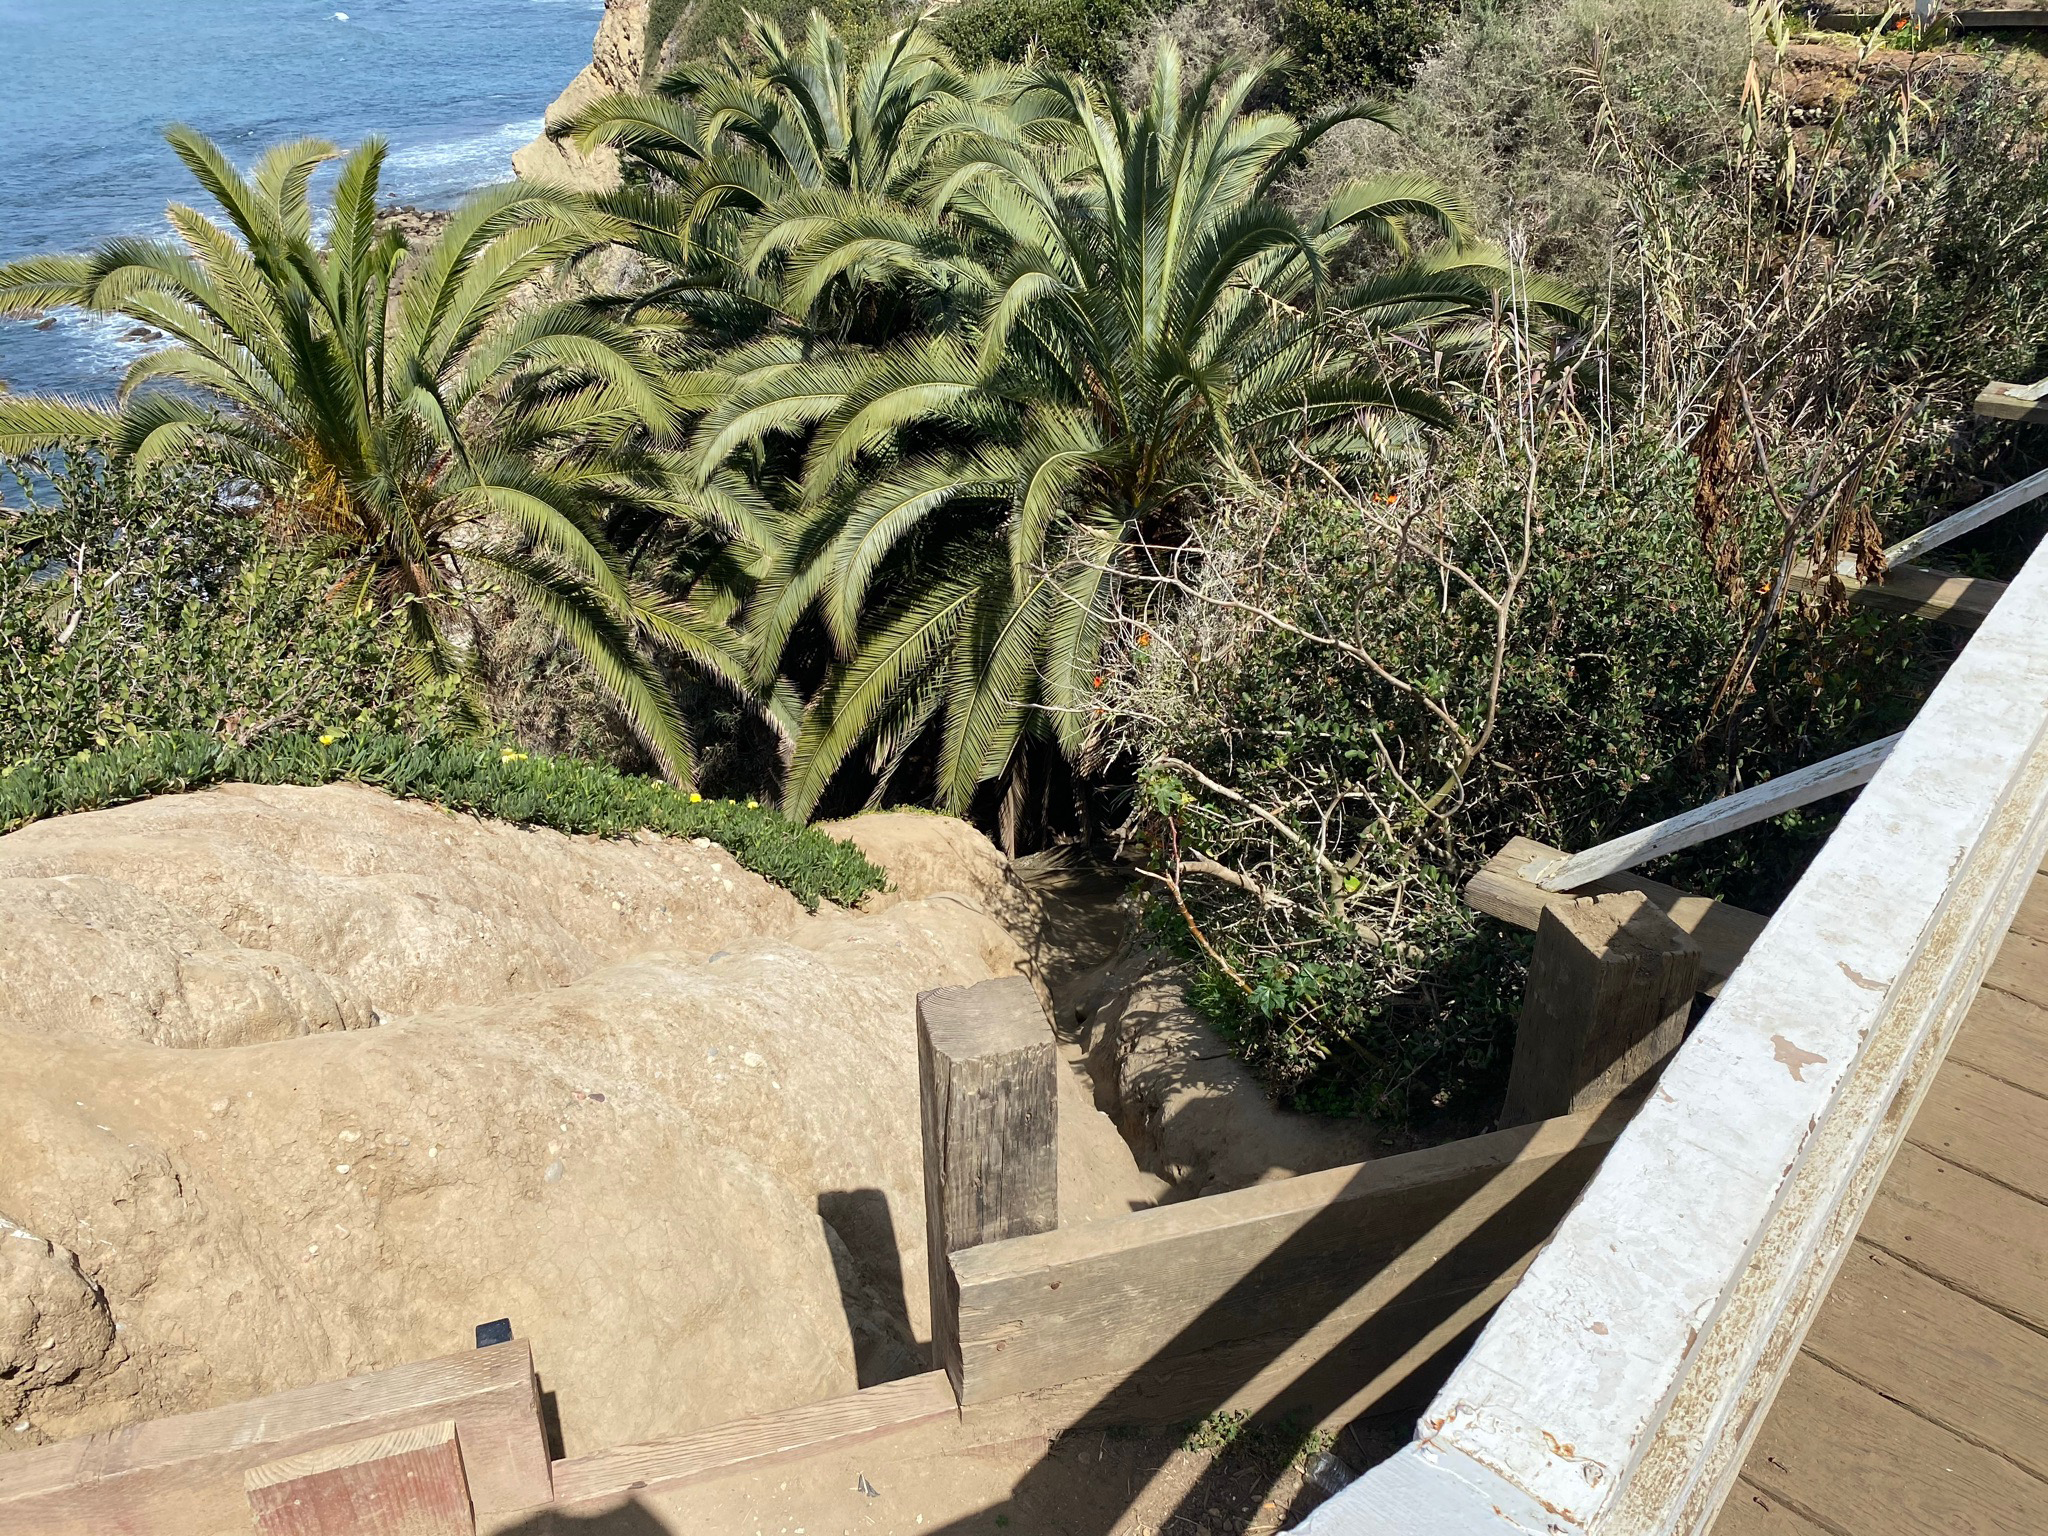
The Corner of La Jolla Bay is where a major fault strand of the Rose Canyon Fault Zone comes onshore (Figures 38 to 40). Figure 41 shows the Coast Walk pedestrian bridge that crosses a ravine associated what has be traditionally called the Rose Canyon Fault (it is one strand within the greater fault zone). A very unrecommended route called the Devil's Slide descends to the beach along the fault that runs under the bridge (Figure 42). Note the square post in image — it used by first responders to tie ropes used during rescue operations of people injured falling on the Devil's Slide or trapped on the rocky beach below. Figure 43 is a view of the fault in the Devil's Slide as seen from an overlook north the bridge. Figures 44 and 45 are views from overlooks along the Coast Walk Trail north of the bridge. Figure 46 is a panoramic view from Goldfish Point showing the Corner in La Jolla Bay. |
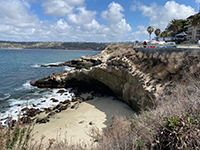
Fig. 34. The Shore Path follows Coast Boulevard above the La Jolla Cove area. |
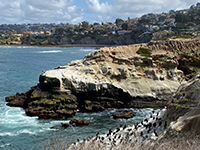
Fig. 35. Goldfish Point with Clam's Cave along the Coast Walk Trail. |
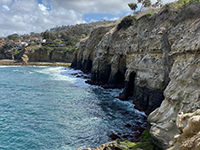
Fig. 36. View of sea cliffs and the mouths of sea caves as seen east of Goldfish Point. |
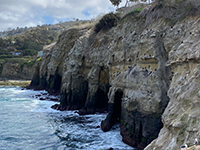
Fig. 37. Zoomed view of the seacliff and sea caves east of Goldfish Point.
|
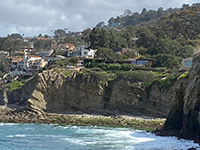
Fig. 38. The Corner of the bay where one of the larger fault strands of the Rose Canyon Fault comes onshore. |

Fig. 39. View along the Coast Trail running along the top of the sea cliff north of the bridge (near the corner in the bay).
|
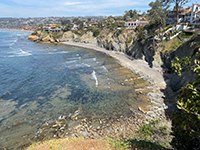
Fig. 40. View of the small bay in the corner of the larger La Jolla Bay where the Rose Canyon Fault runs offshore. |

Fig. 41. Pedestrian bridge along the Coast Trail where it crosses over a ravine along the fault zone. |
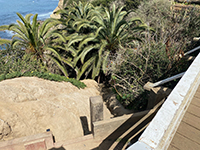
Fig. 42. The Devil's Slide route (not recommend) involves using muddy knotted ropes and a ladder. |

Fig. 43. Rose Canyon Fault is exposed at La Jolla Bay at the Devil's Slide (as shown here from Coast Walk Trail).
|
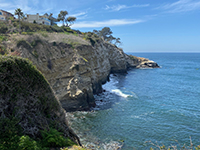
Fig. 44. View from an overlook along the Coast Trail looking back toward the cliffs with sea caves. |

Fig. 45. View of the corner in the sea cliff along La Jolla Bay where a stramd of the Rose Canyon Fault comes onshore. |
|
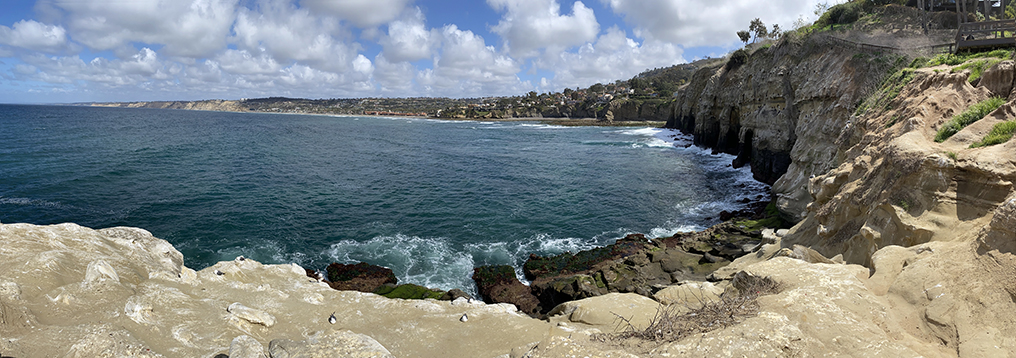
| Fig. 46. Panoramic view looking north to east at La Jolla Bay from Goldfish Point near The Cave Store and the west end of the Coast Walk Trail. |
A10
Geologic Features Within the Fault Zone Between La Jolla Community Beach and the Devil's Slide
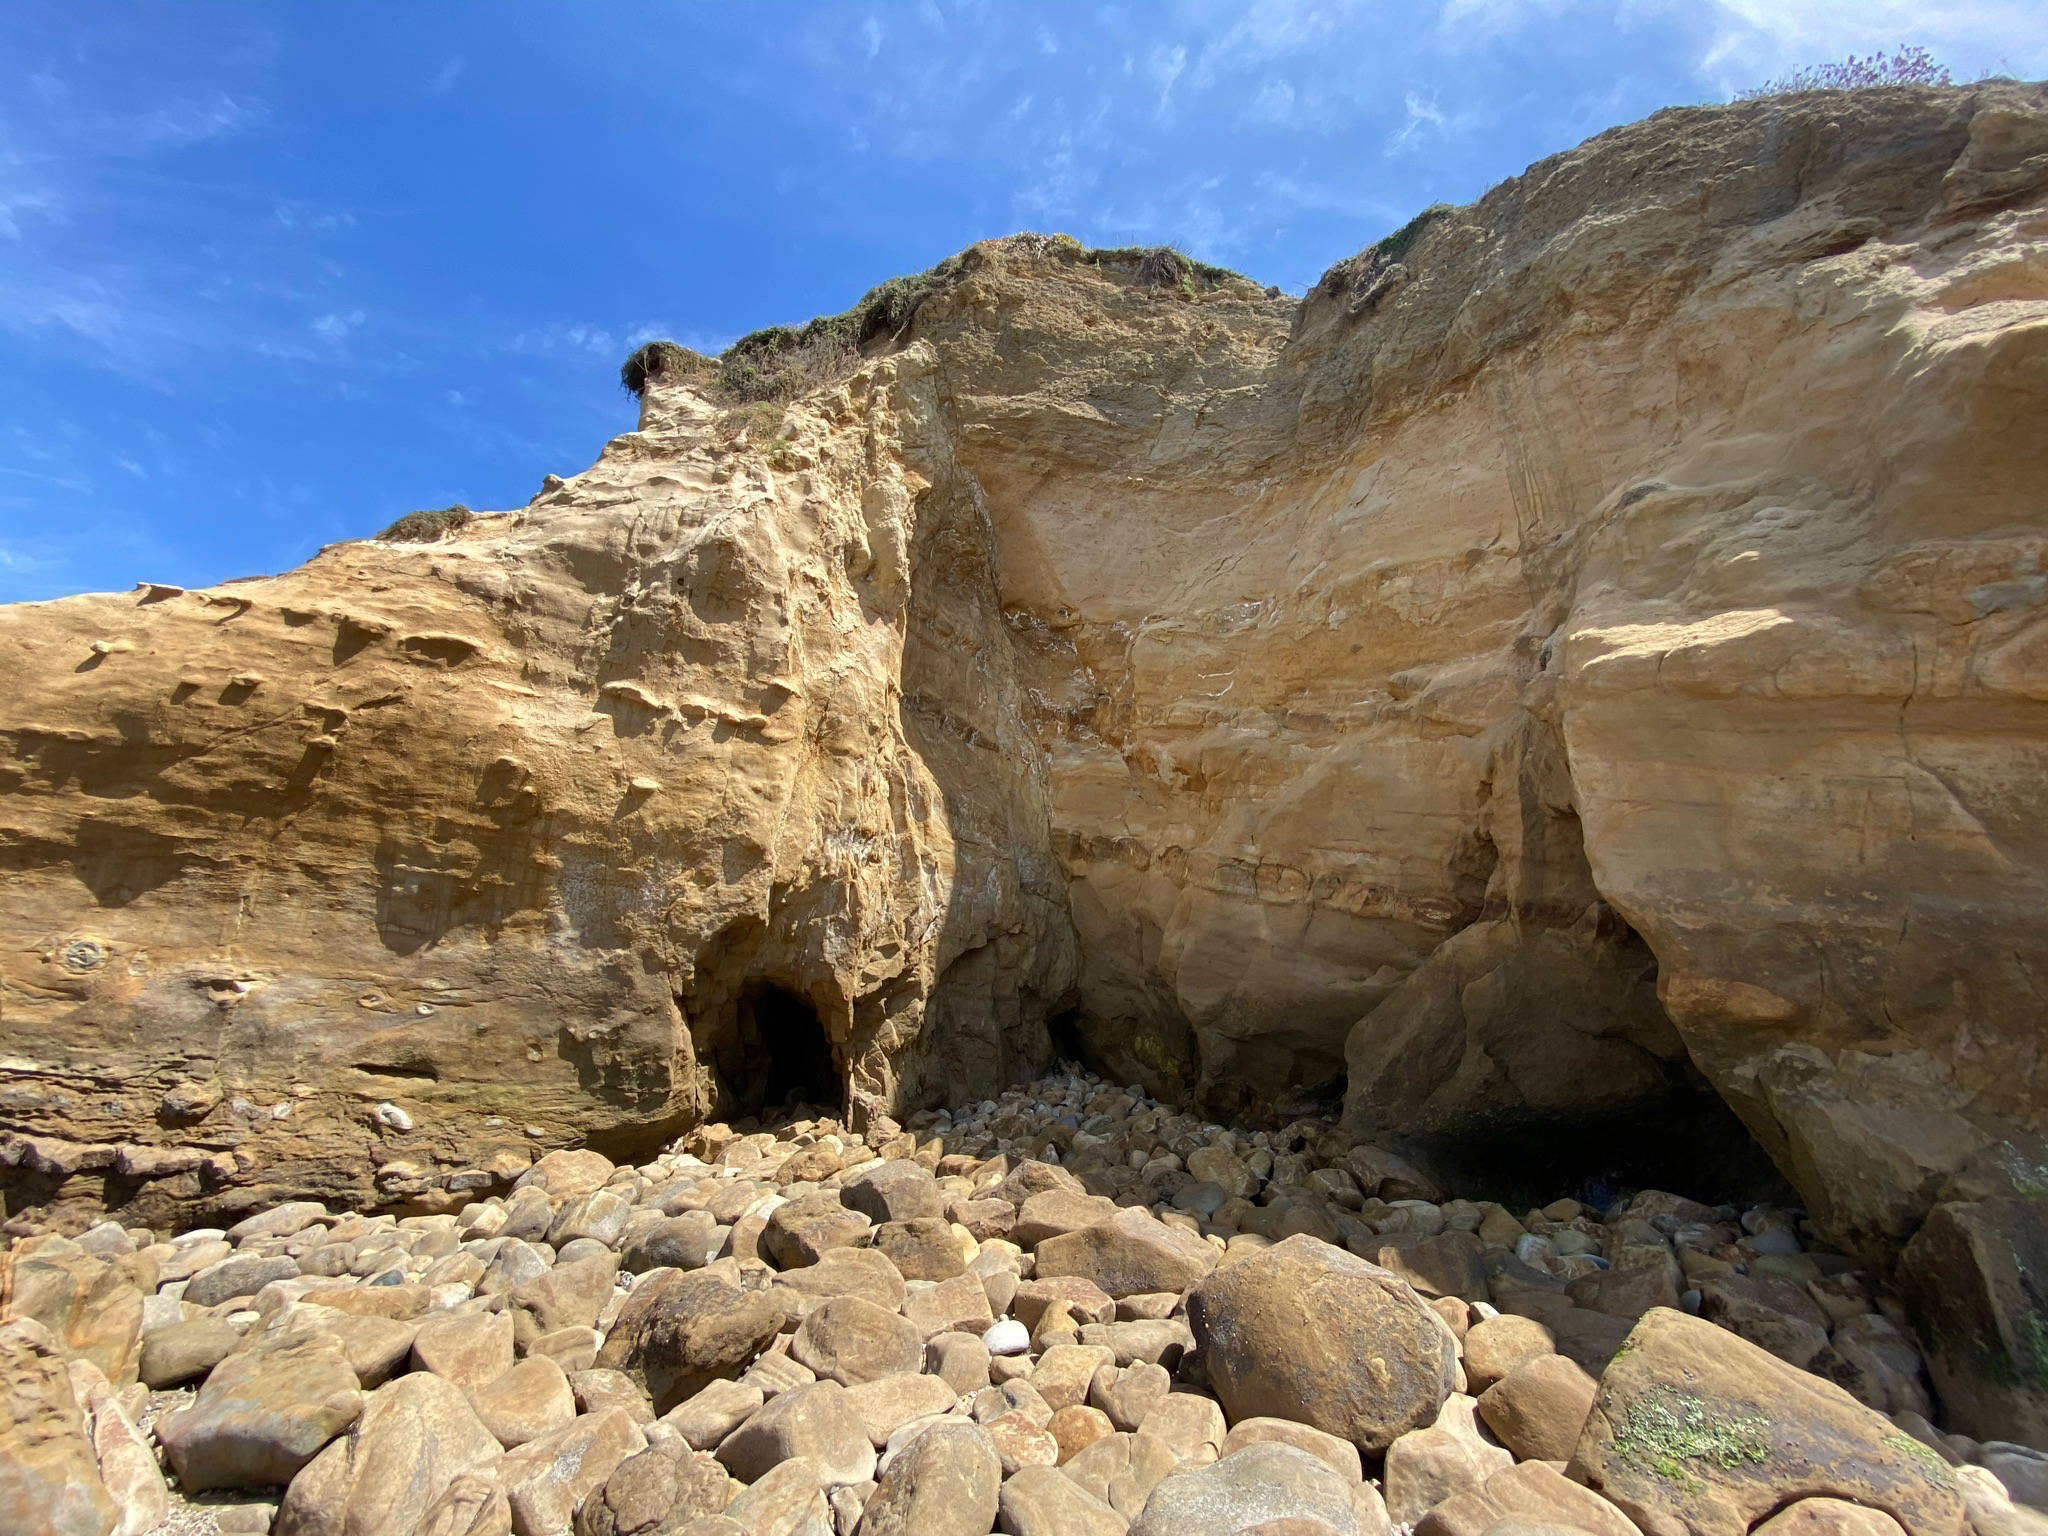
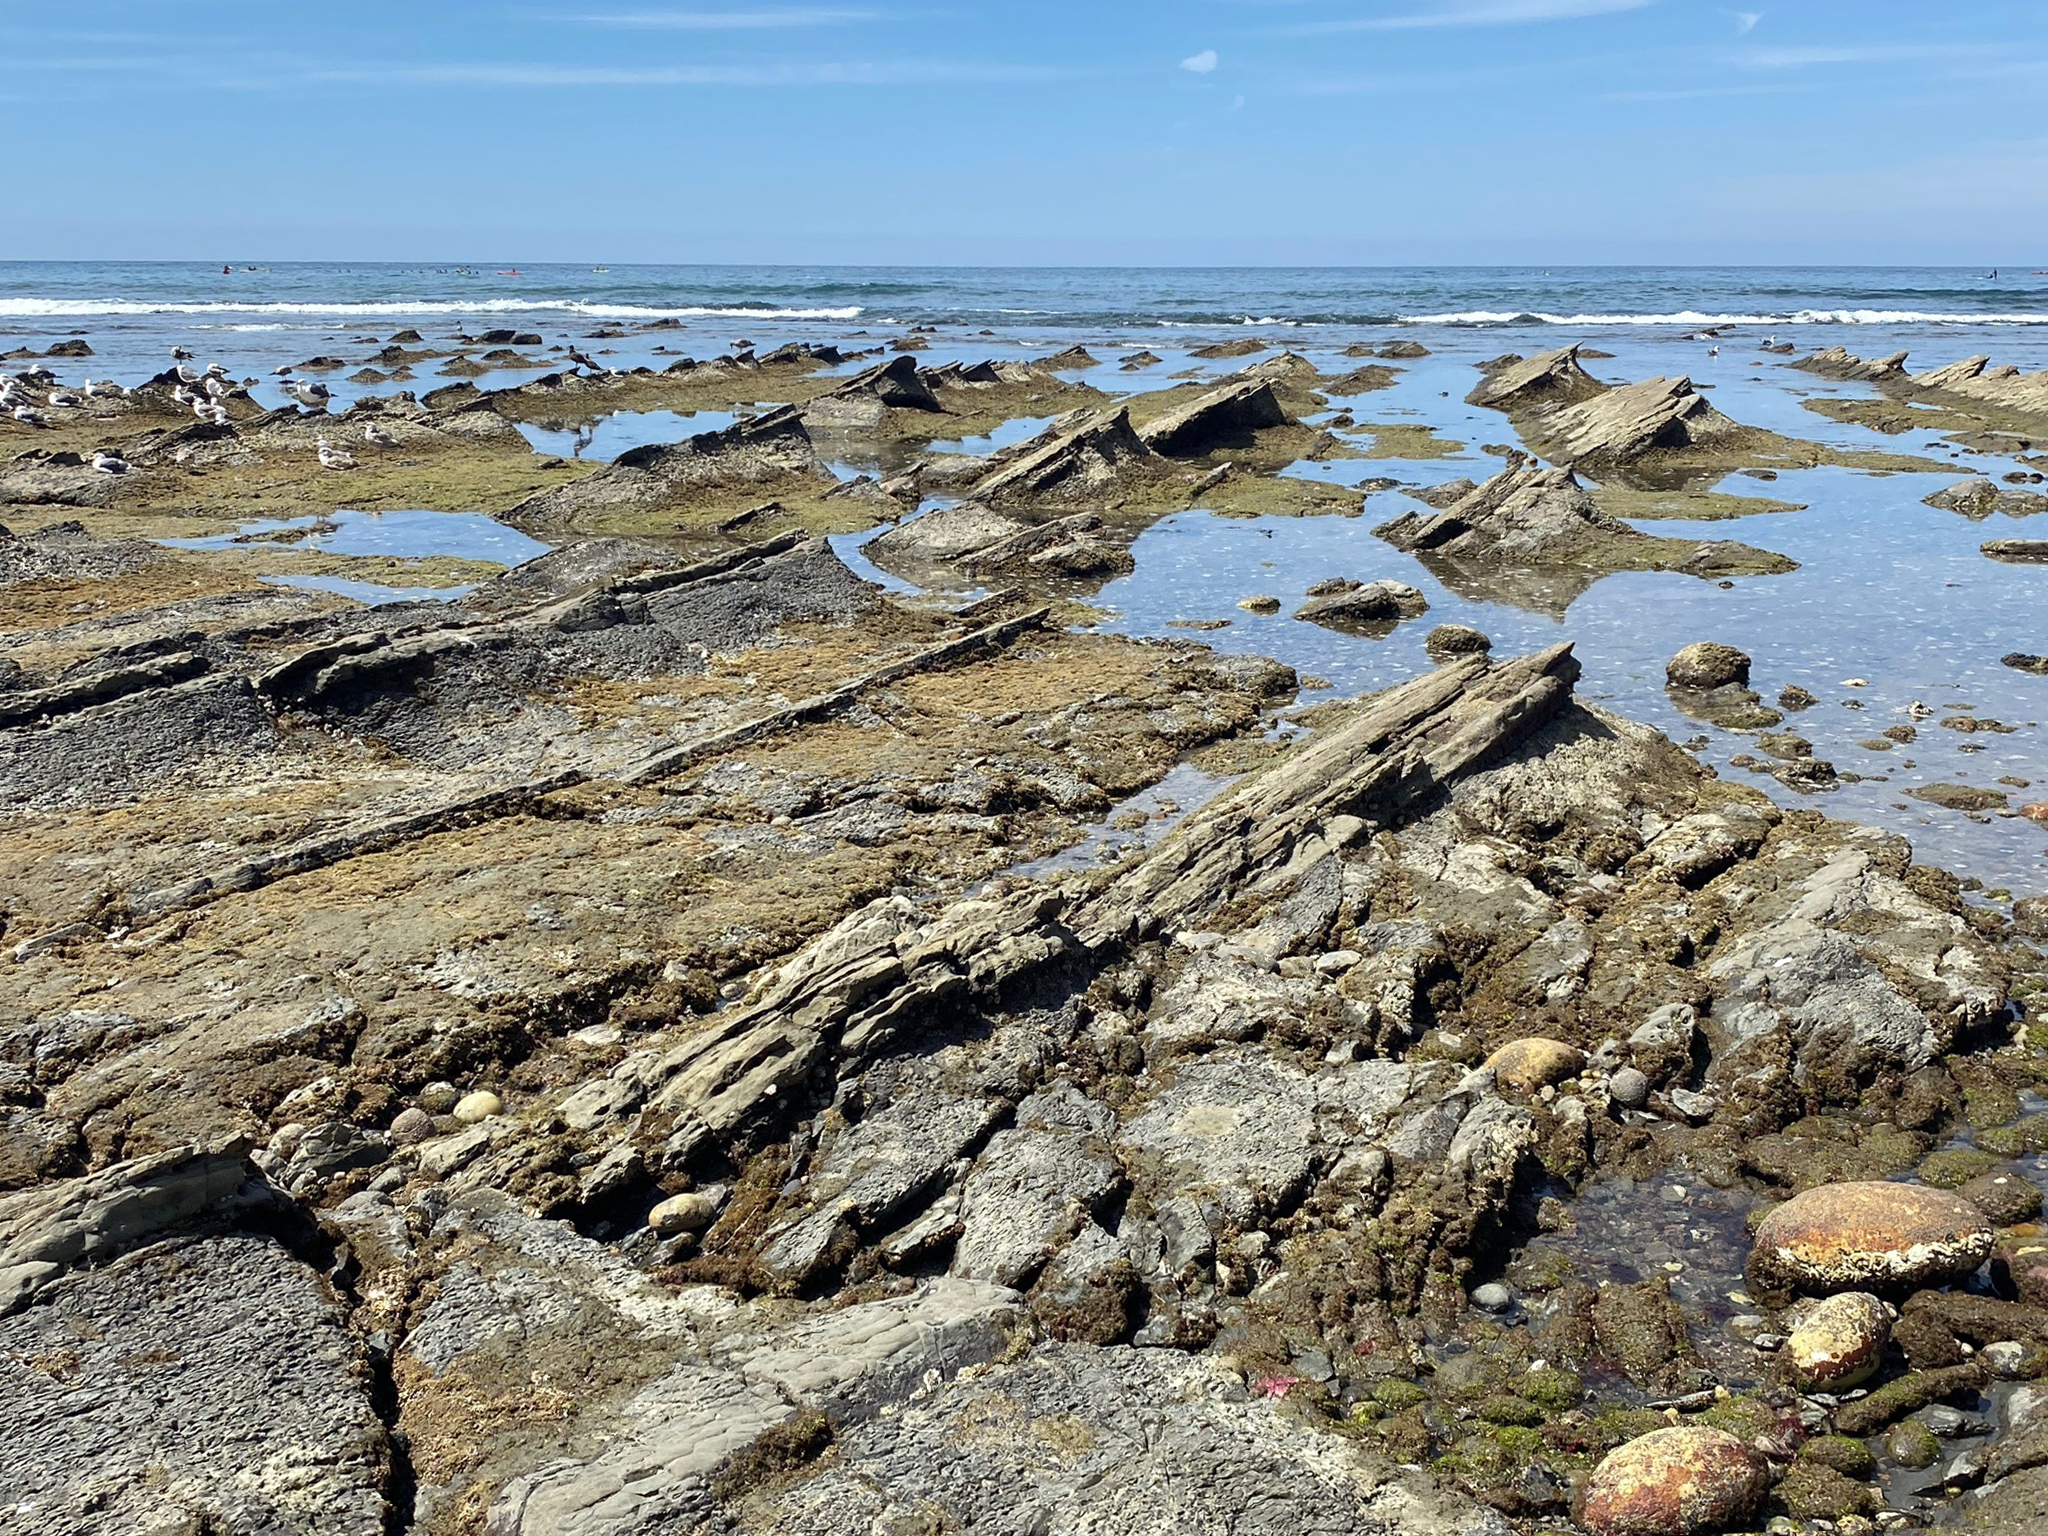
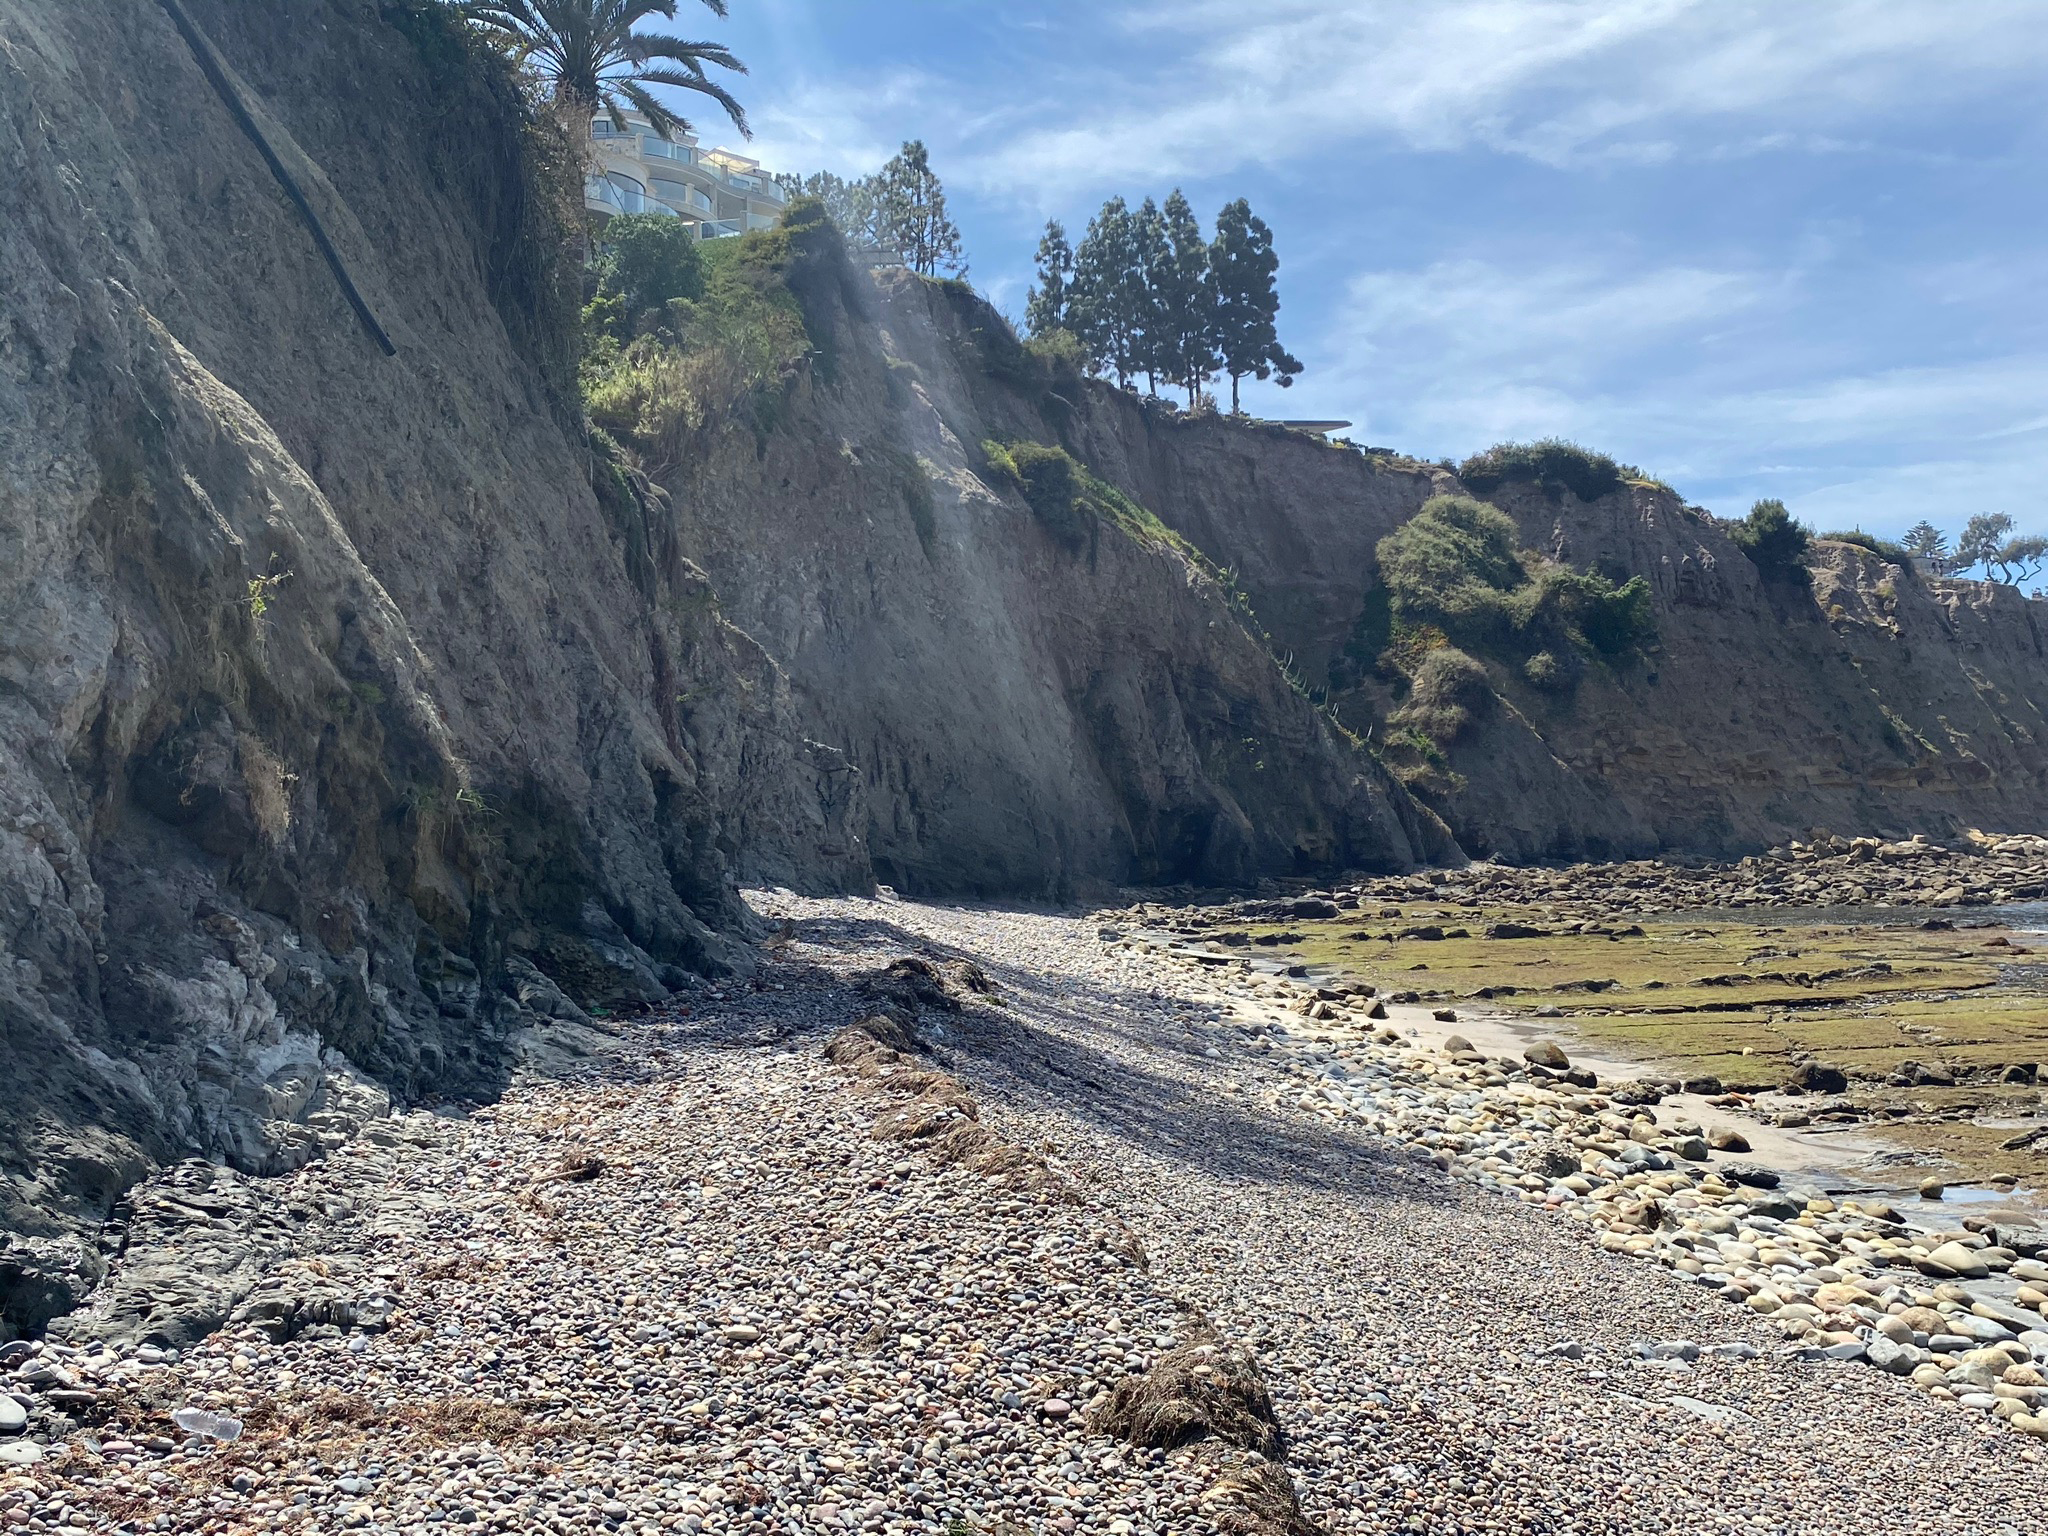
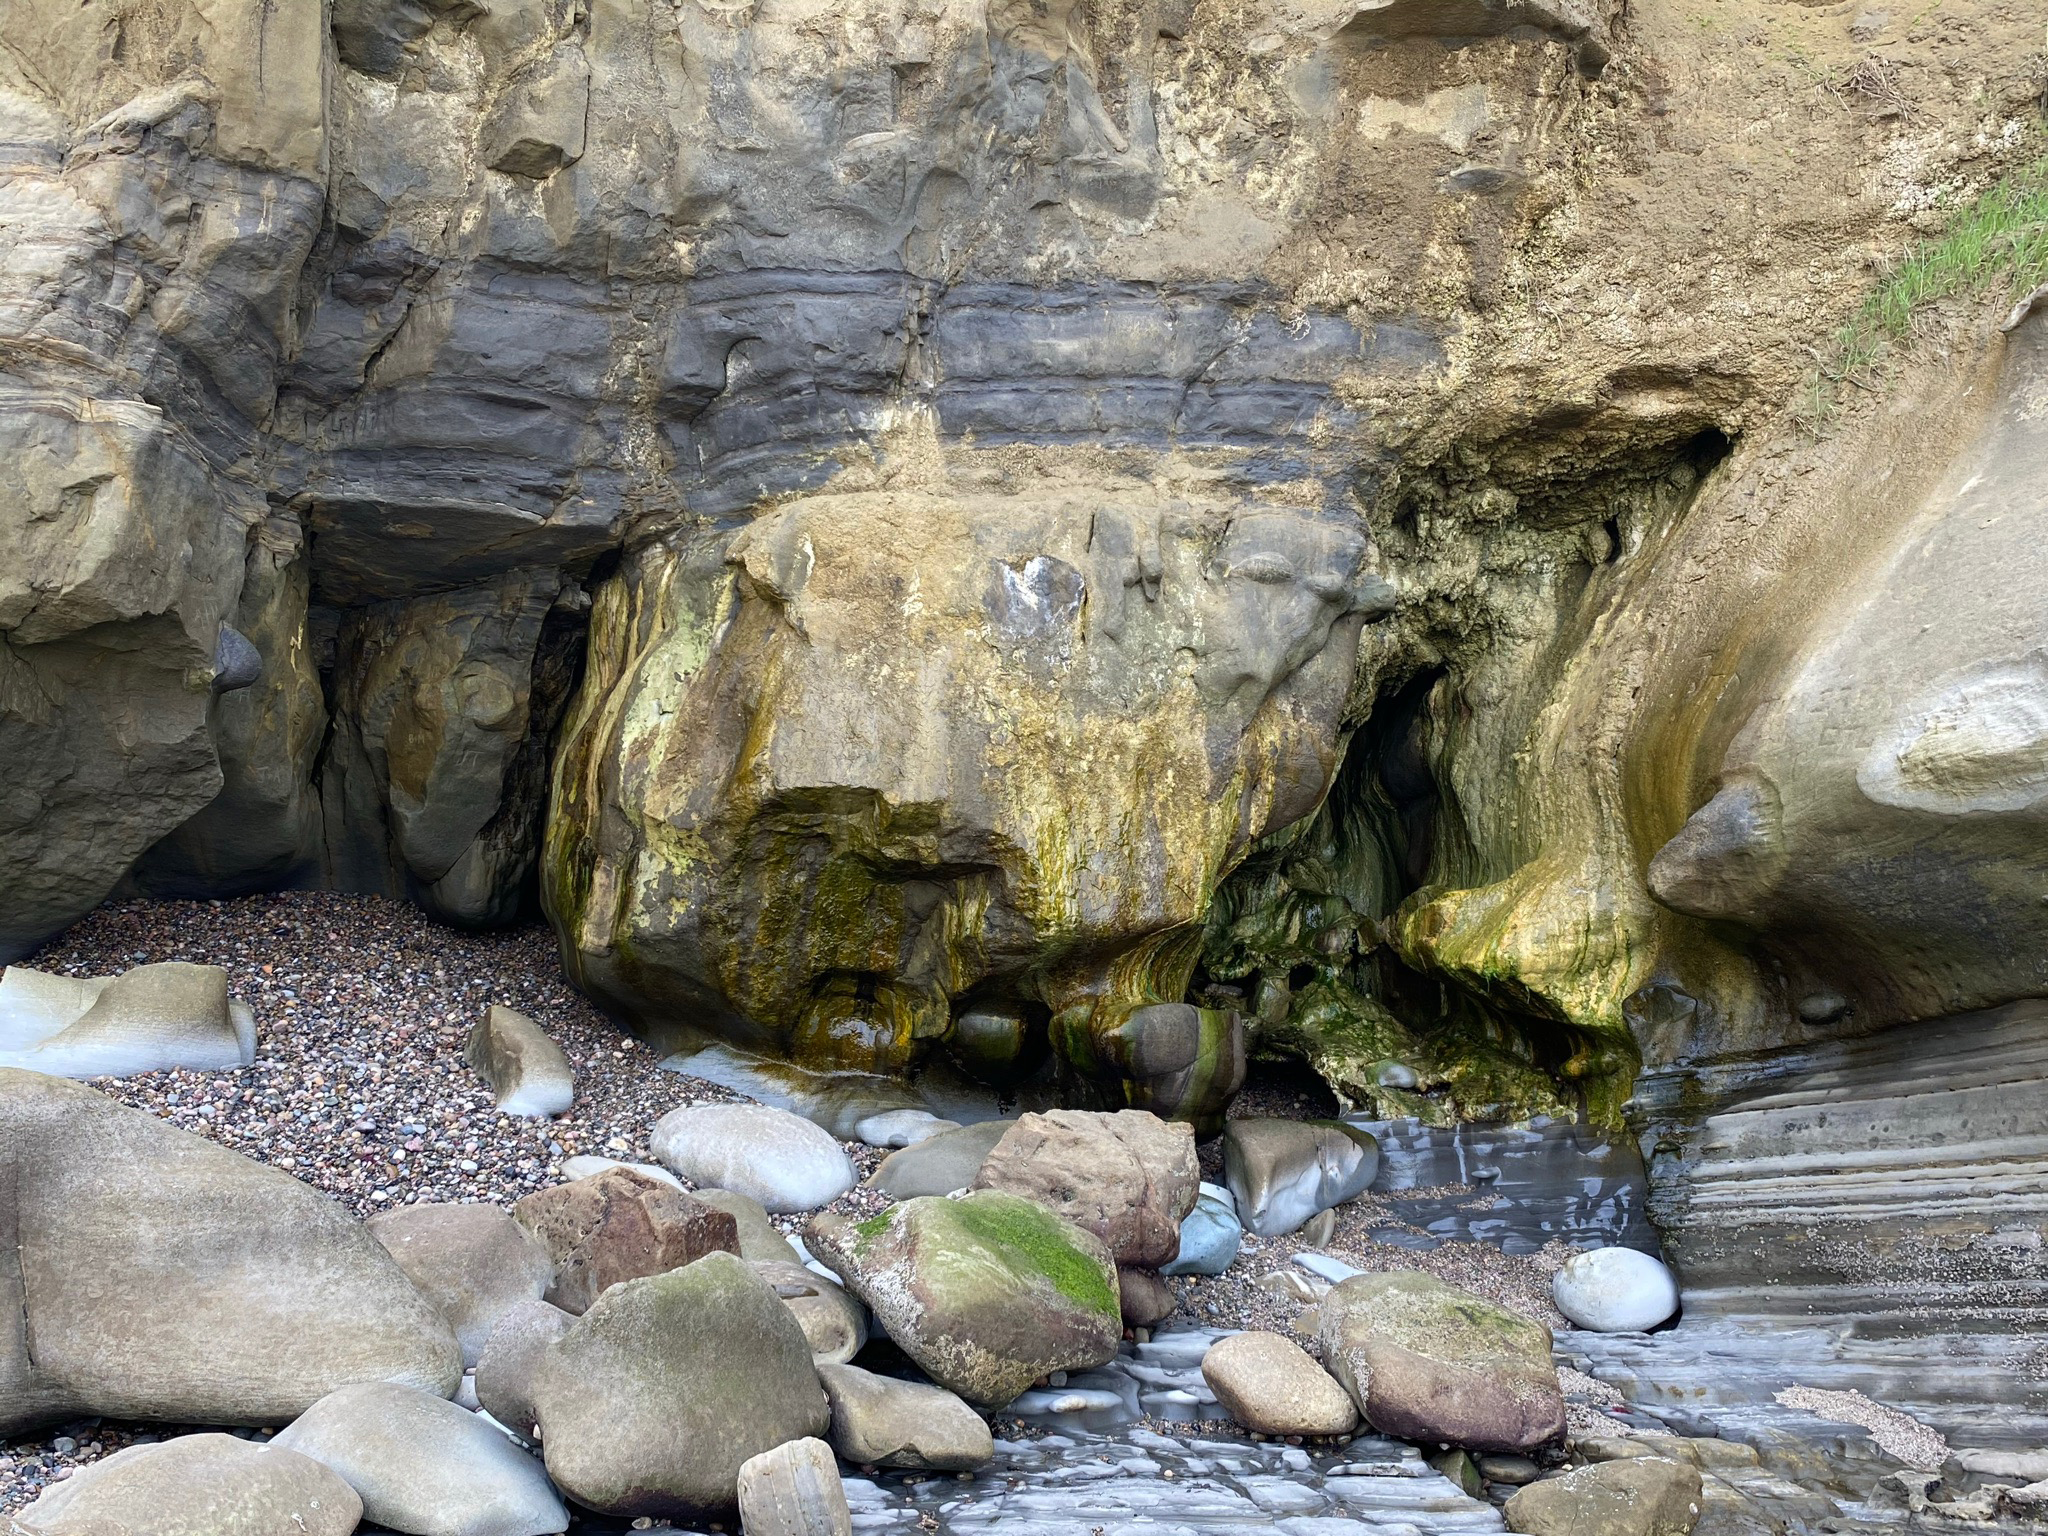
The Alquist-Priolo Earthquake Fault Zone map for La Jolla shows that an active strand comes onshore at the southern end of La Jolla Community Beach. However, the fault is not exposed at the surface — it is covered in beach sand and has been masked by a century's worth of coastal construction (Figure 47). The sea cliffs start at the south end of the beach where tide pools and a low wave-cut bench are exposed at low-low tide (Figure 48). A hike along the tide pools and sea cliffs is not recommended for most people — it can be quite hazardous for the unprepared.
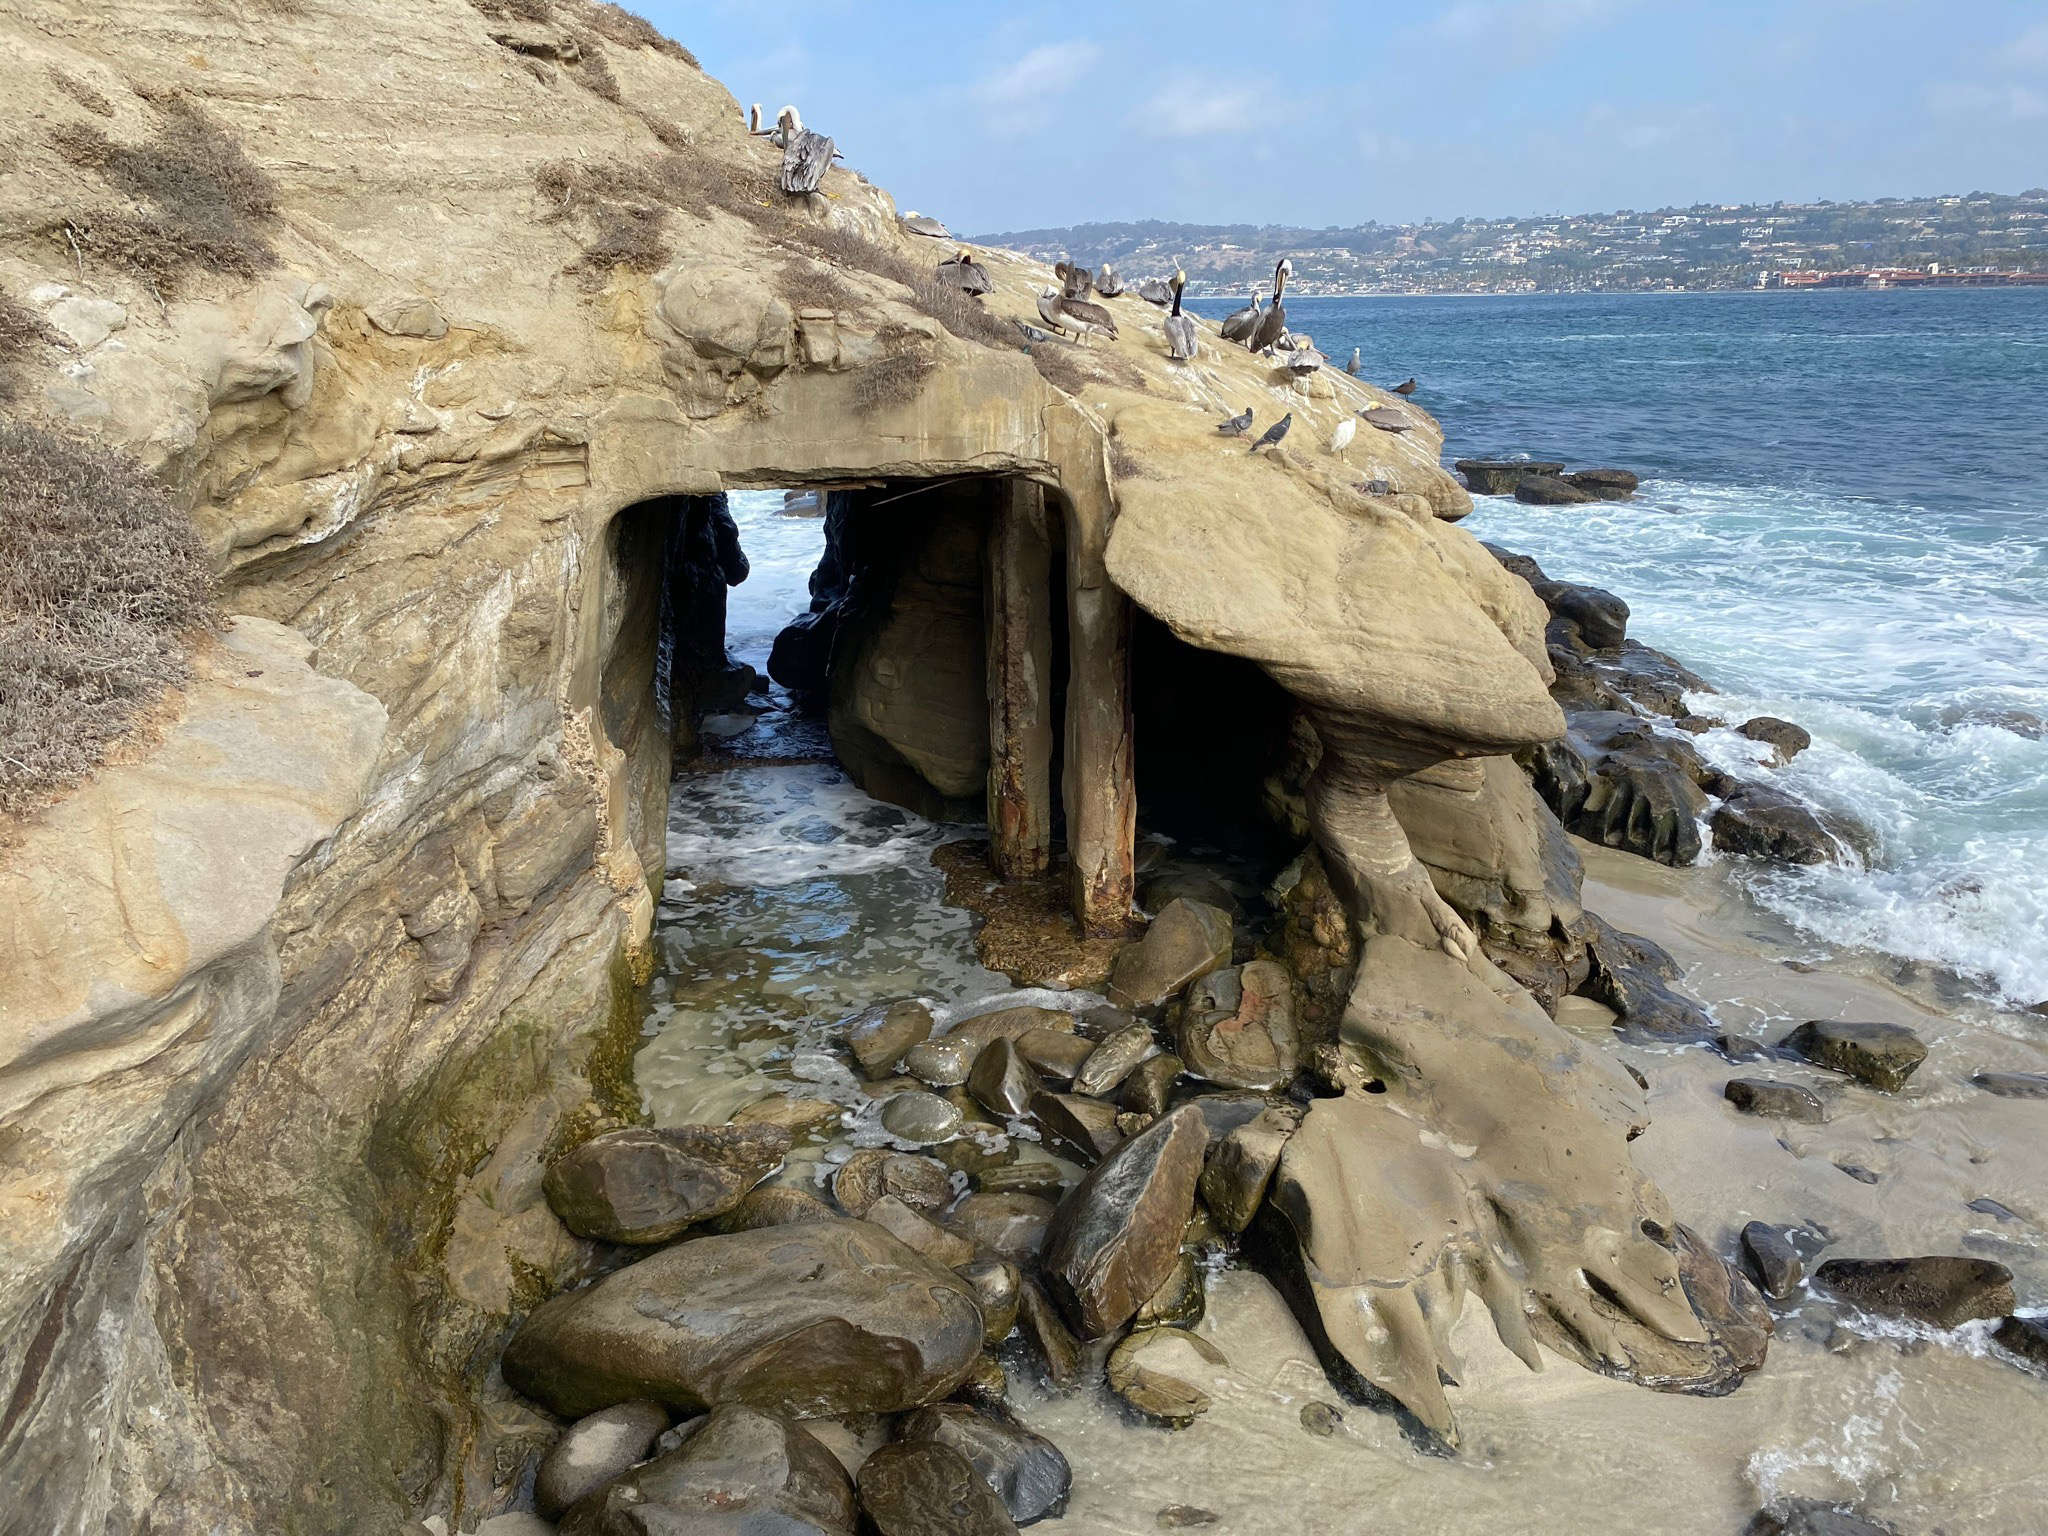
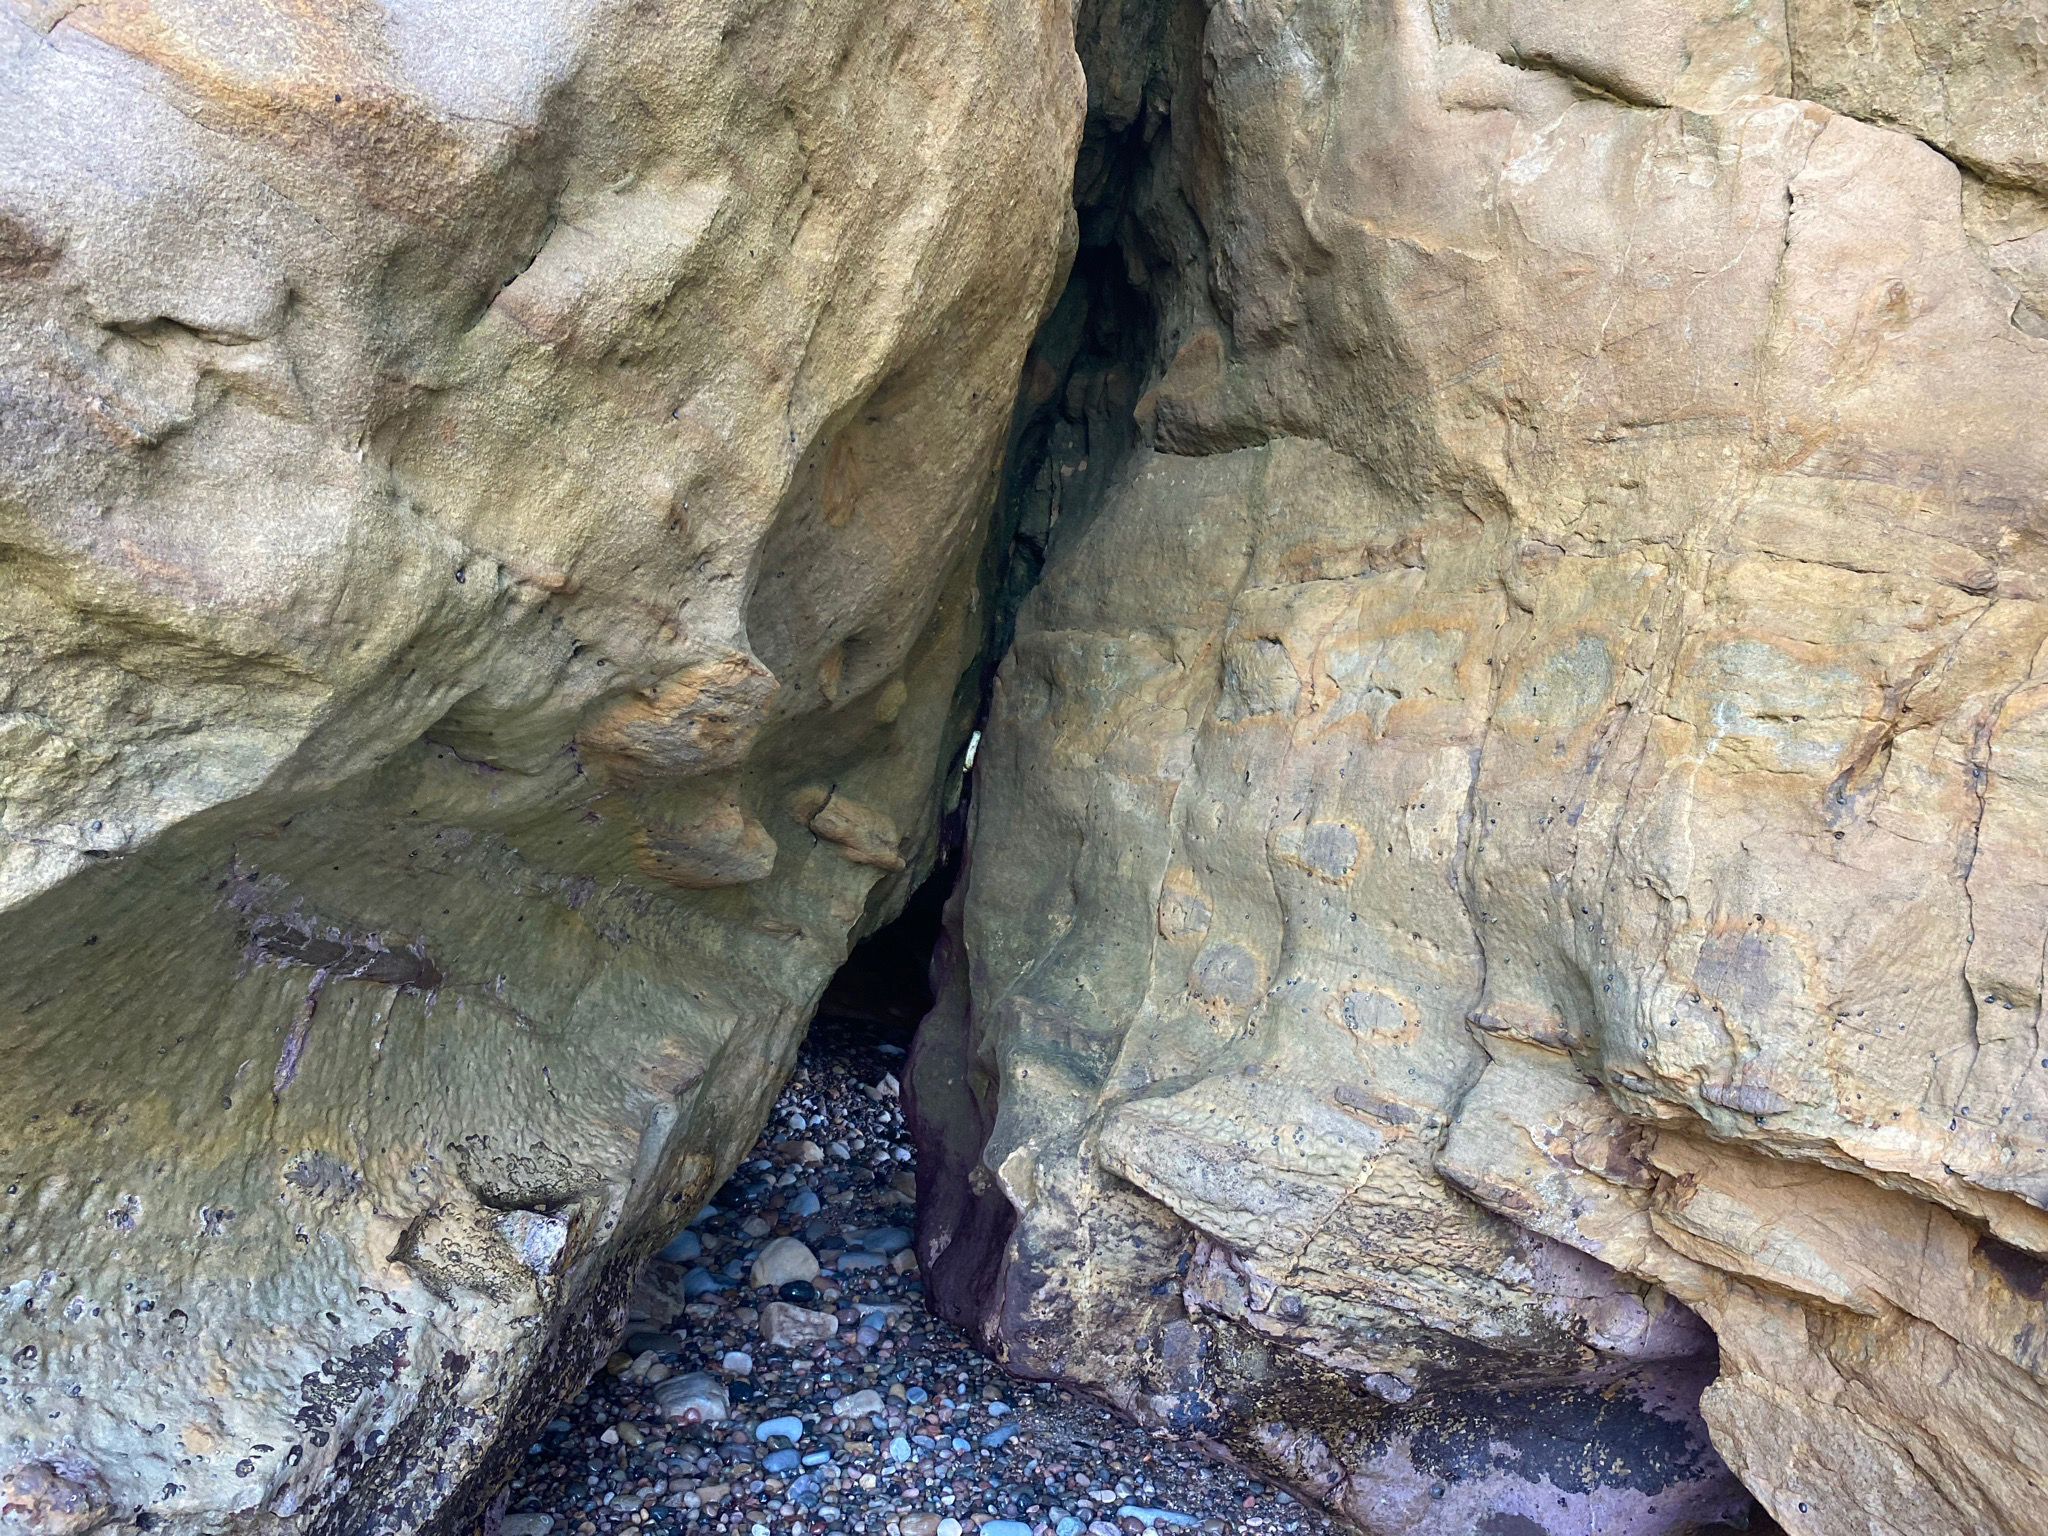
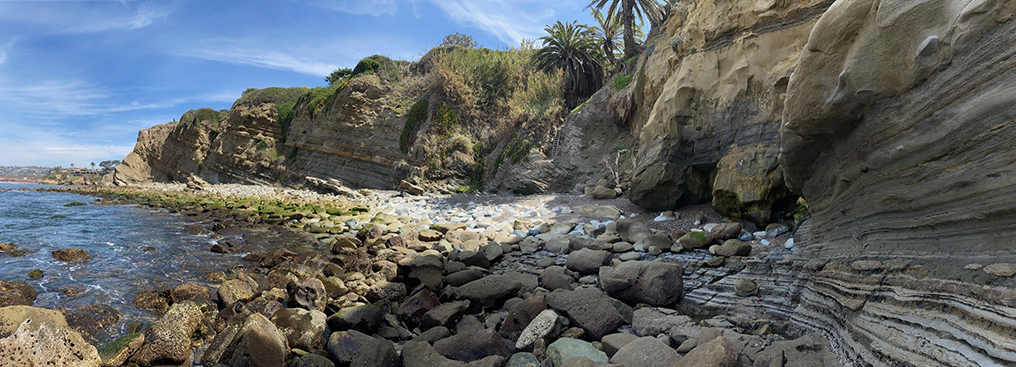
A very slippery, algae-covered cement path runs along the base of the cliff and ends at the mouth of a sea cave formed along a small fault (Figures 49 to 51). From this point onward, to continue south along the base of the sea cliffs is a treacherous journey involving wading, and crossing unstable areas covered with boulders and sea cobbles in order to get to the Devil's Slide area. Note that hiking or swimming along the base of the sea cliffs, rocky shoreline, and submerged rocks is extremely hazardous and is definitely not recommend for most people. You will definitely not want to attempt this other than at low-low tide on a day when there is very low wave activity along the bay. That being said, this section of the coastline has perhaps the most revealing geologic characteristics of the Rose Canyon Fault Zone. It is easy to see that it is a zone consisting of many small faults, fractures, and folded strata, and at least one major fault is visible in the Devil's Slide area.
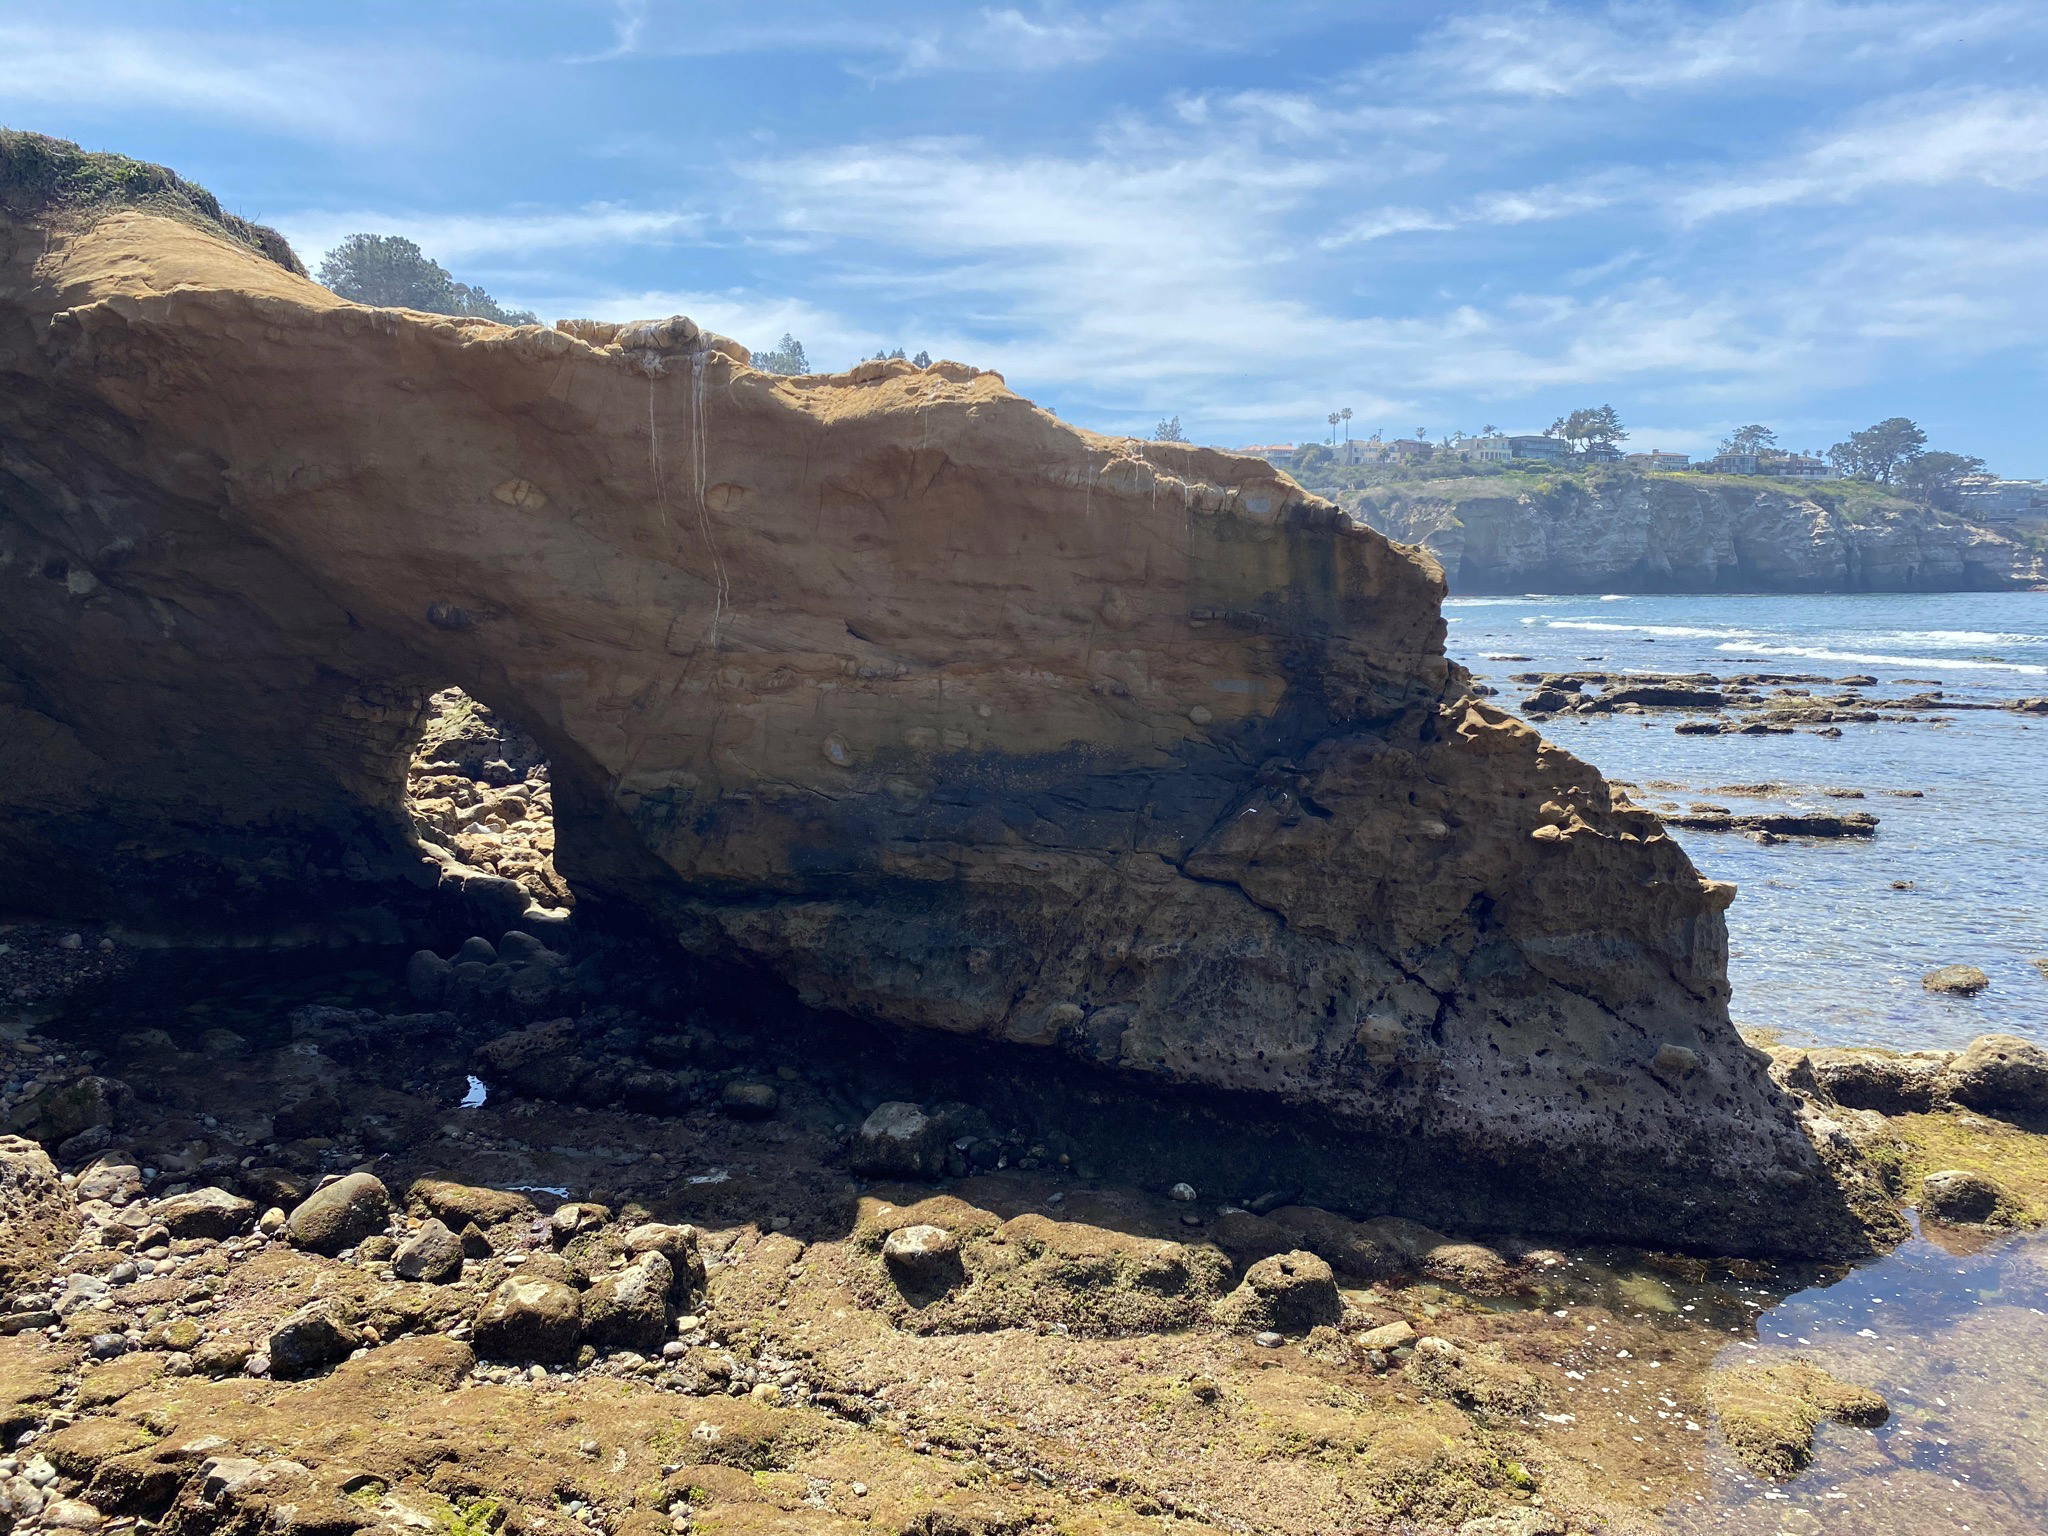
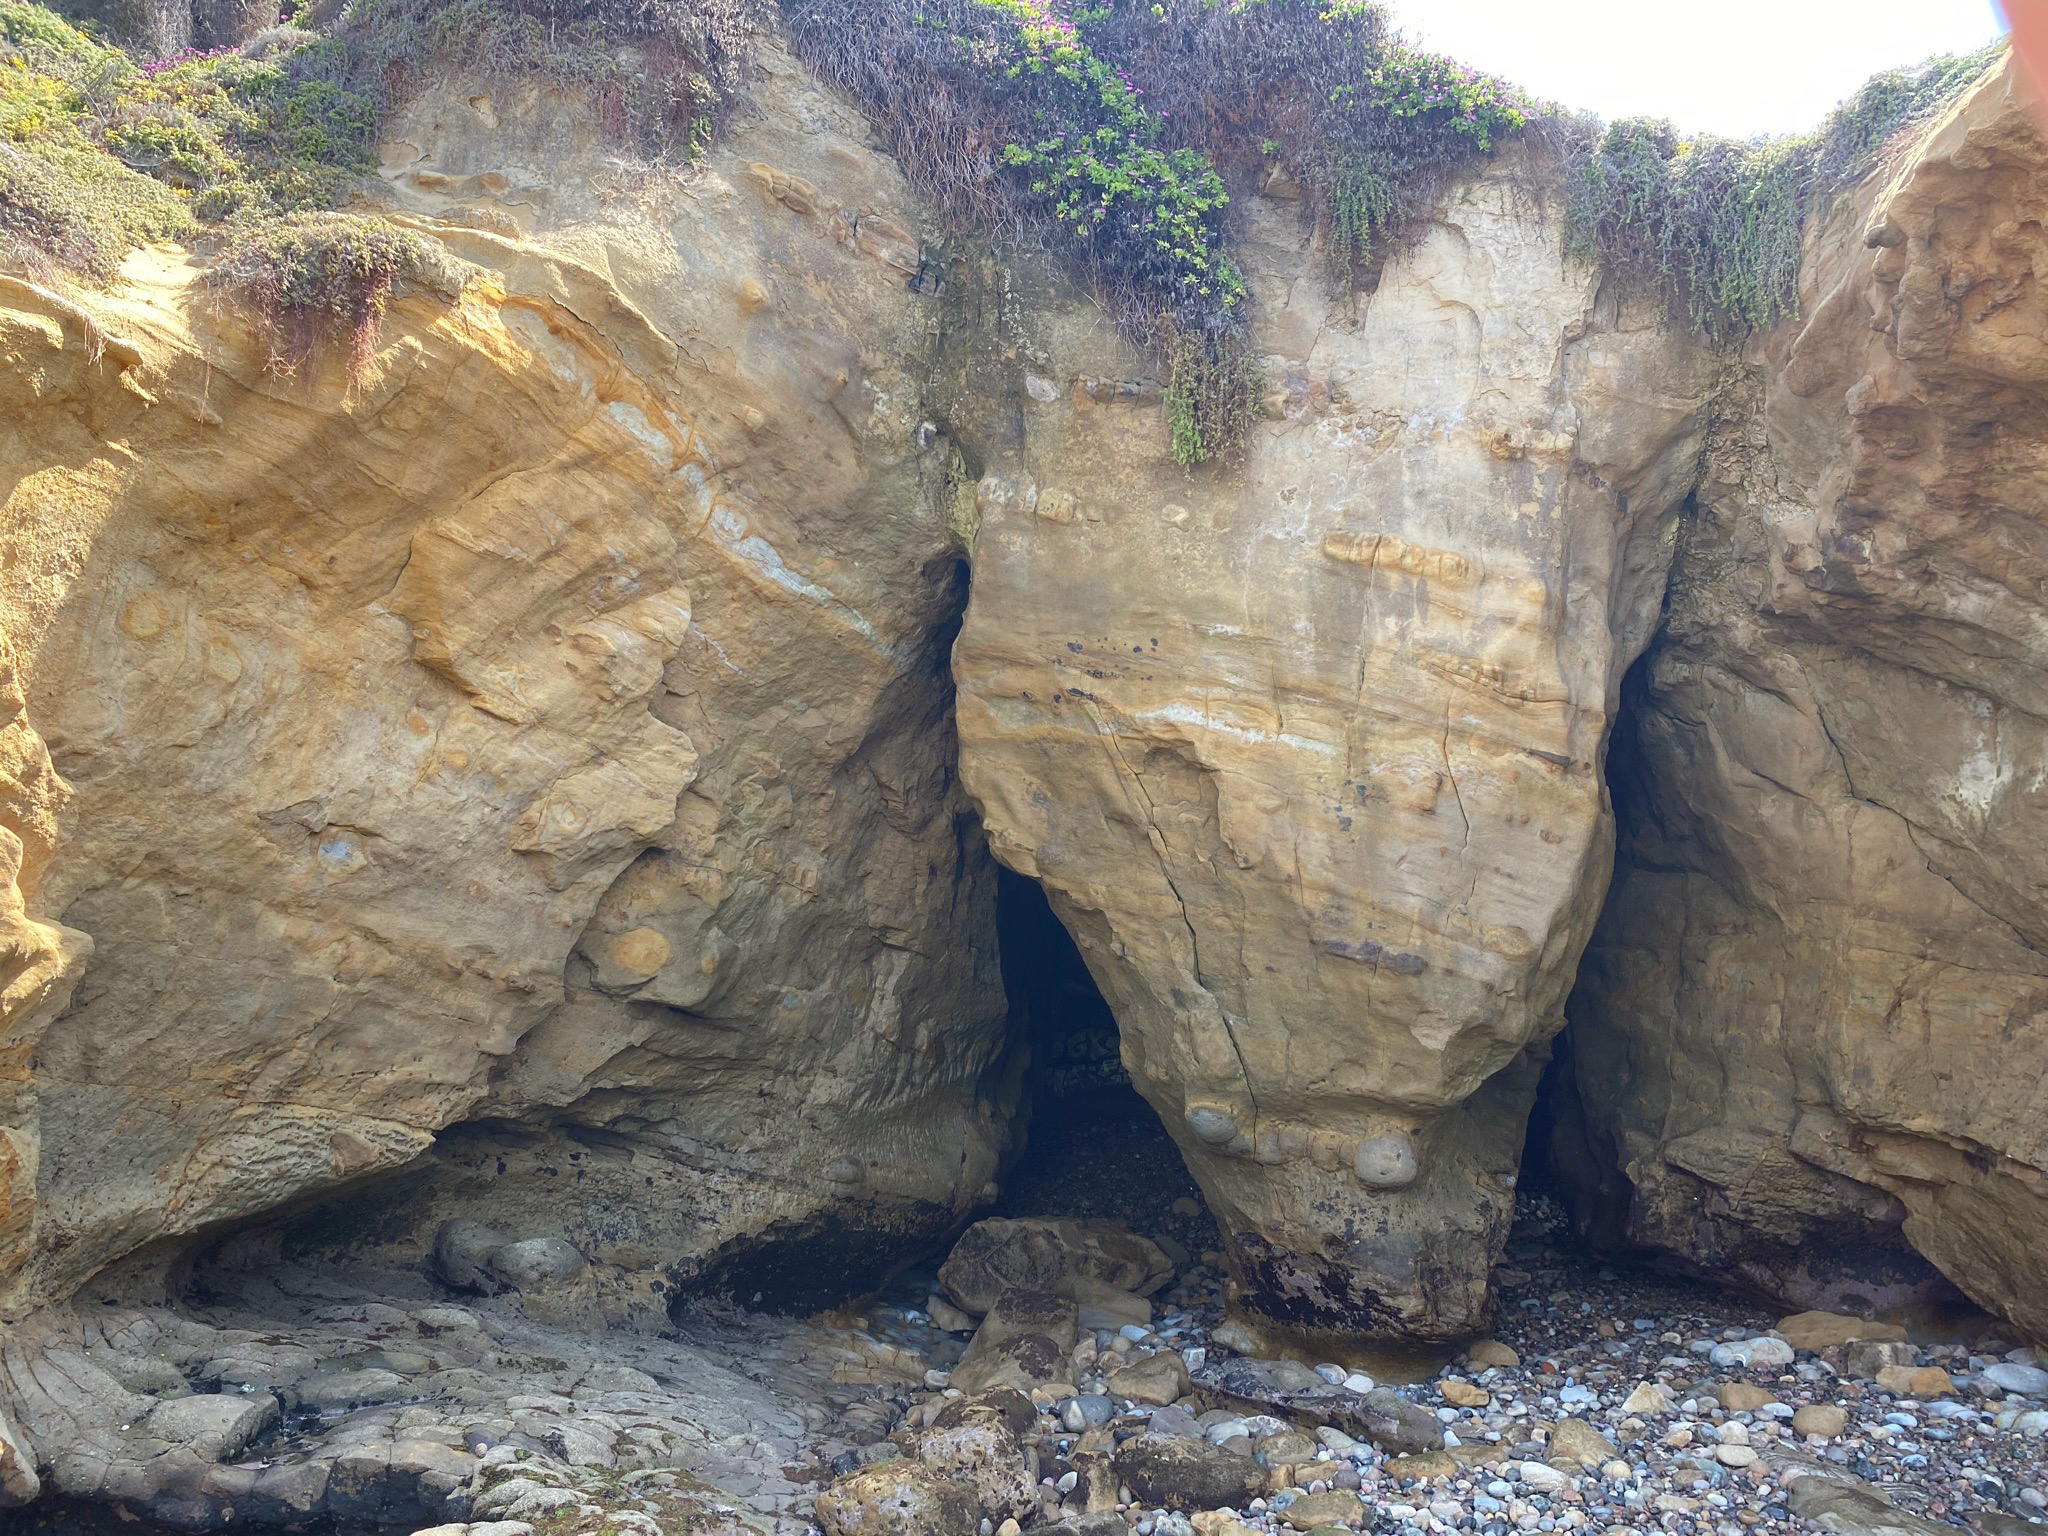
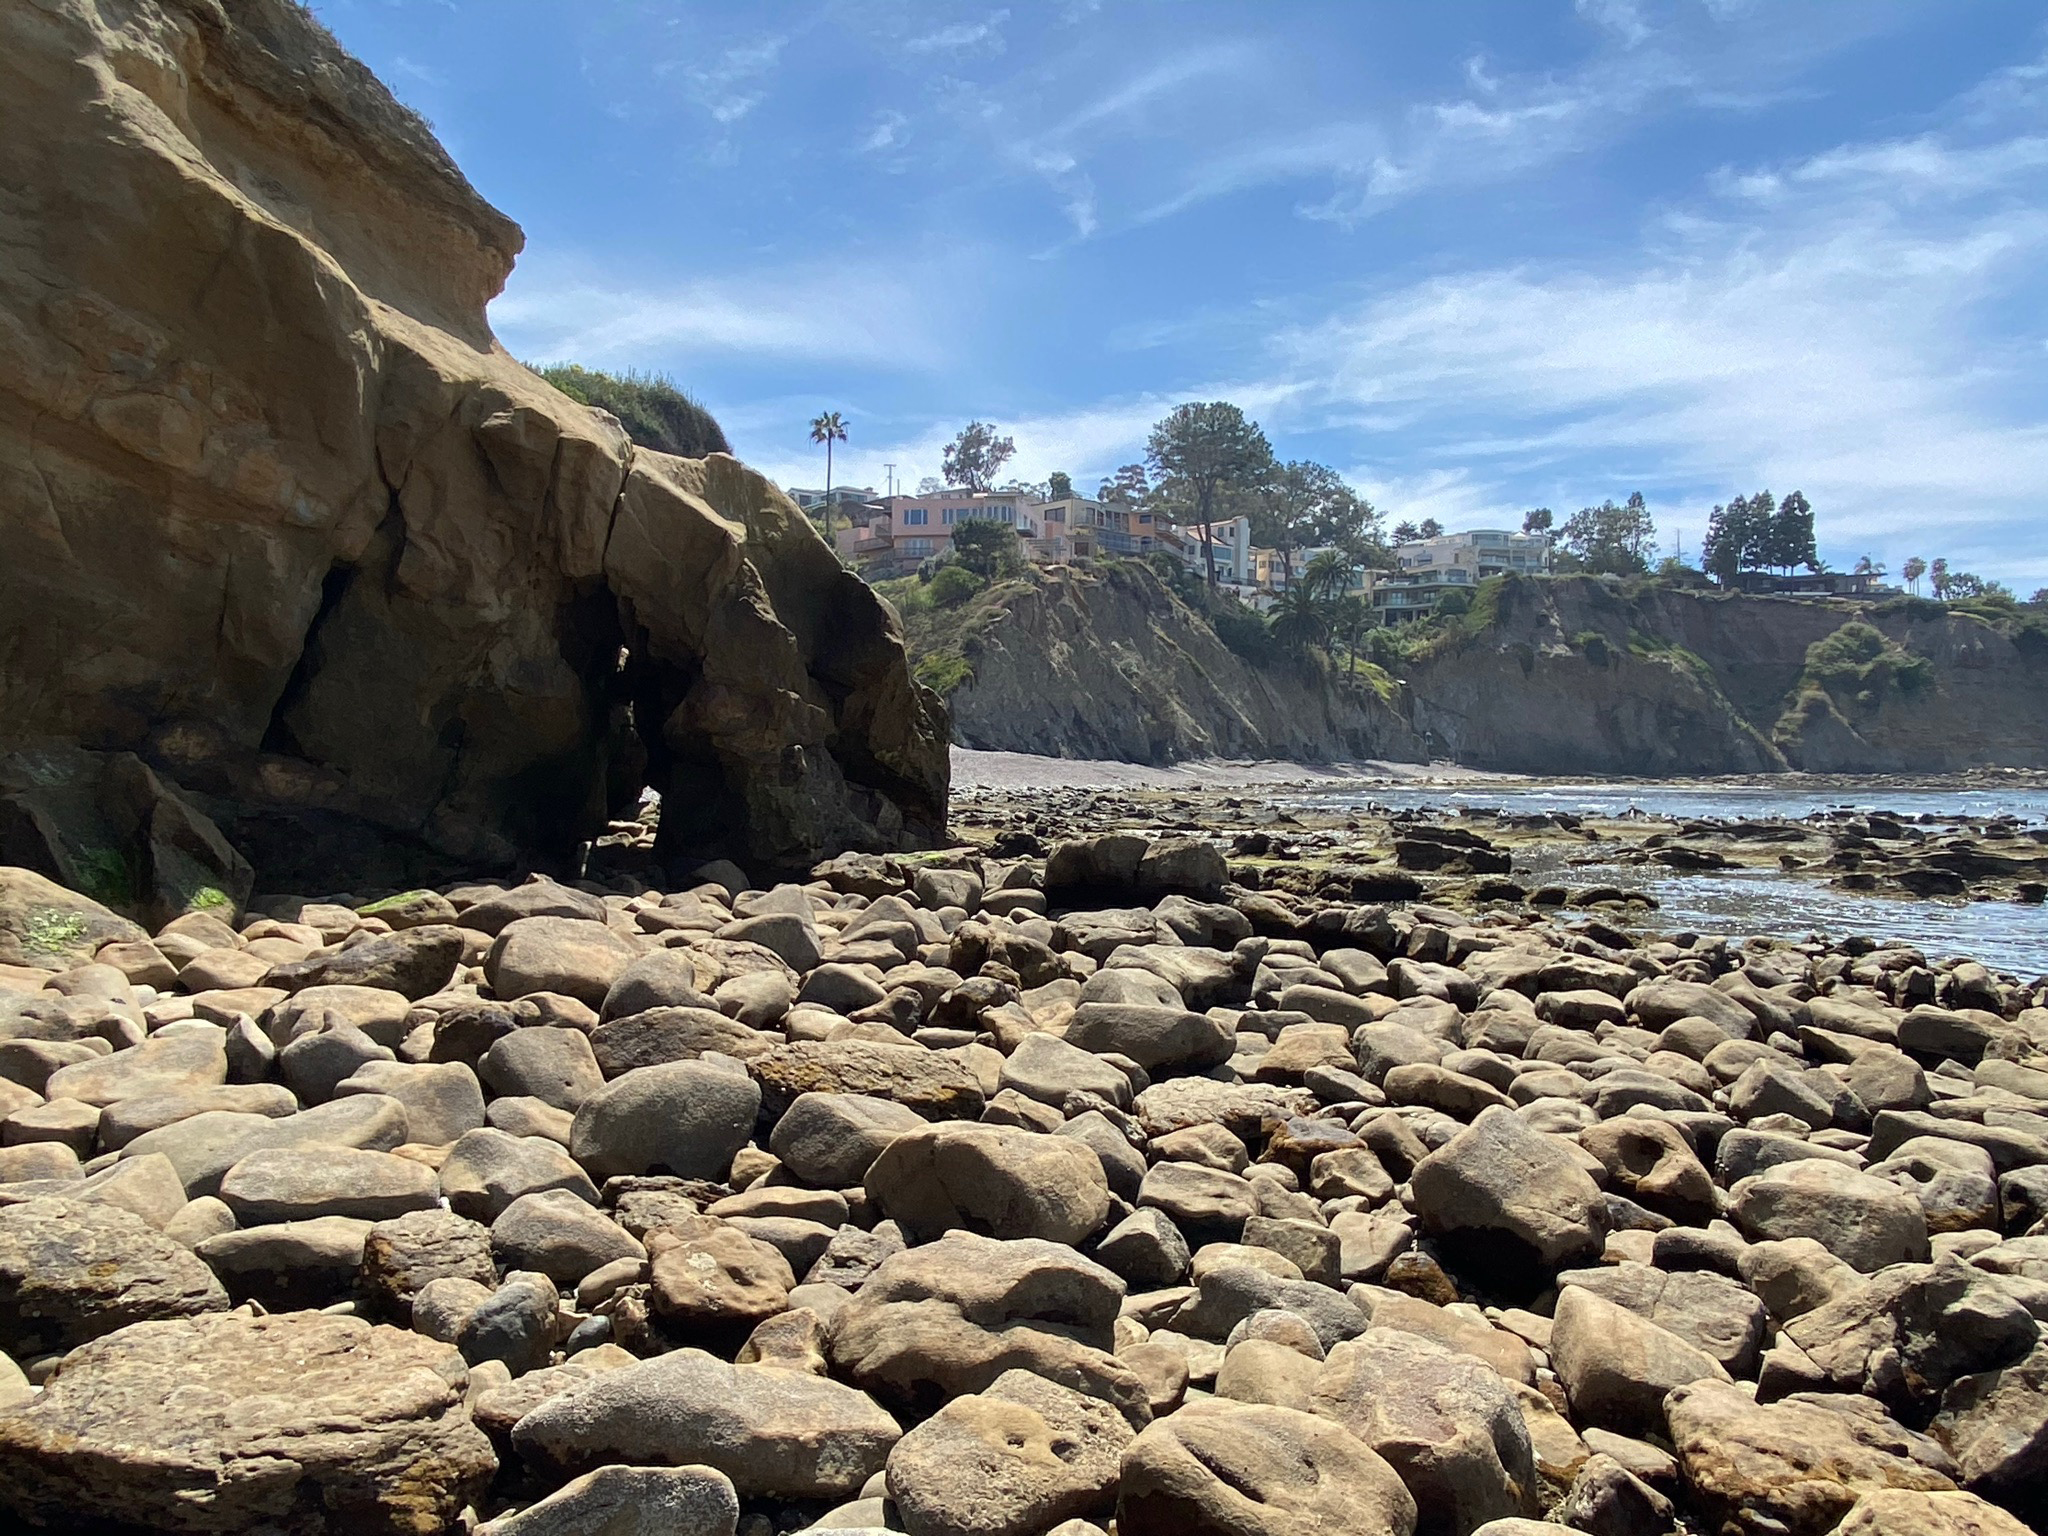
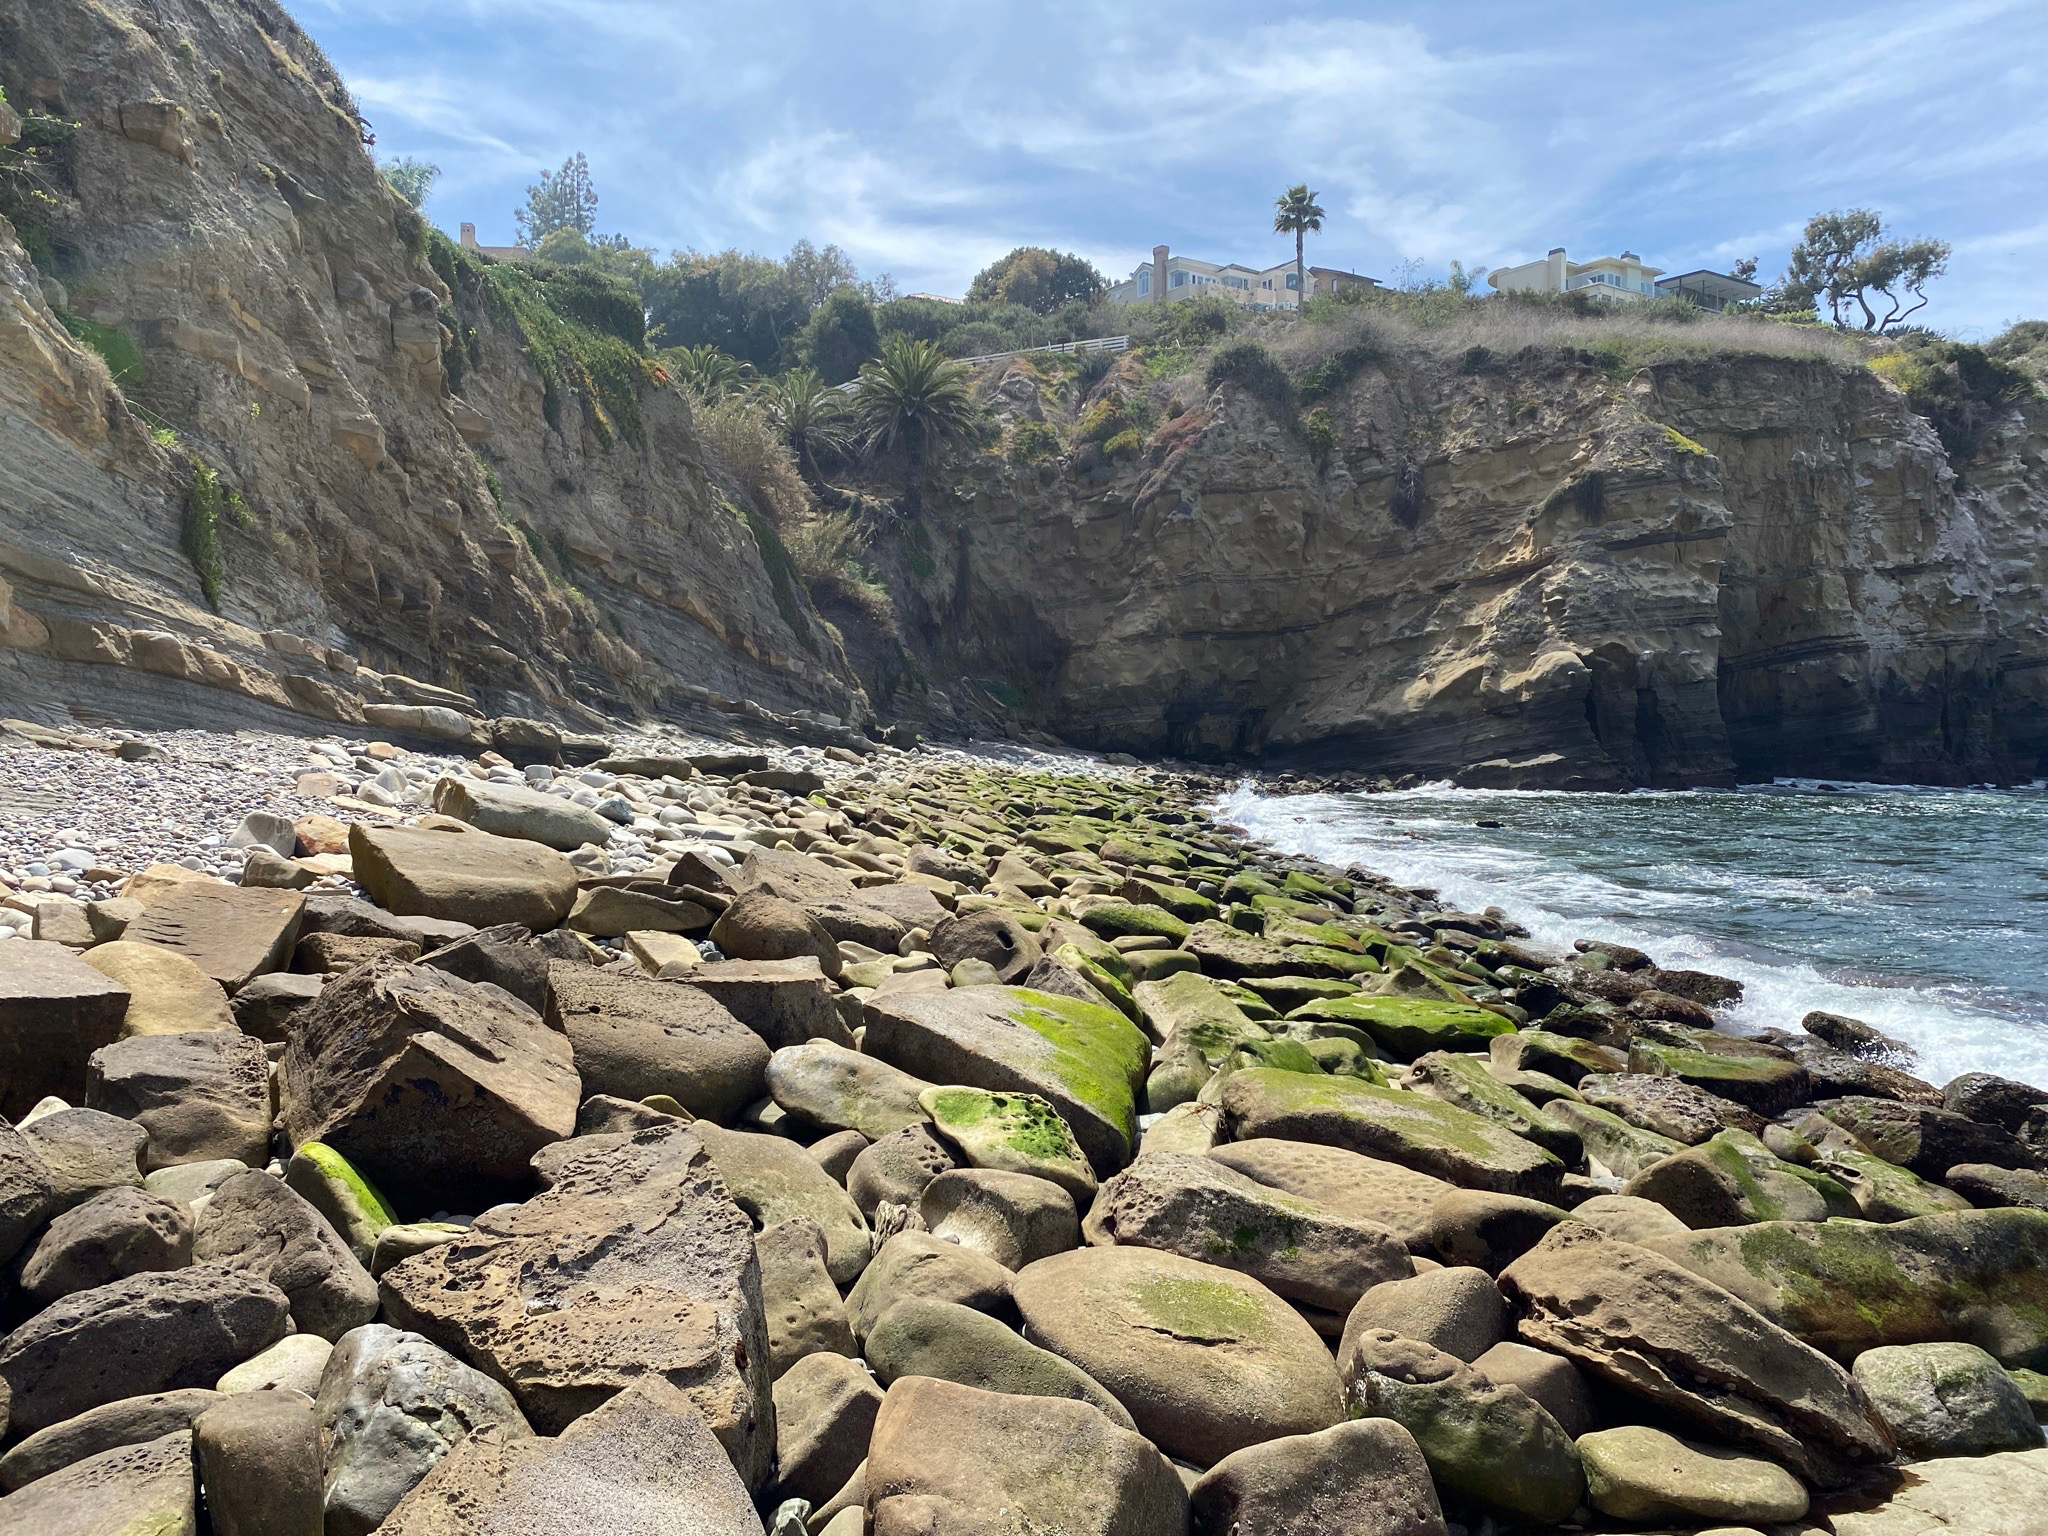
Figures 52 to 59 show small sea arches and sea caves formed along fault and fracture zones in the sea cliffs. Note the size of the boulders on the wave-cut bench in Figures 56 to 58. These boulders reflect the intense power of wave action that sometimes batters the shore and sea cliffs. |
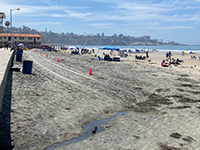
Fig. 47. View south along La Jolla Community Beach to the sea cliffs near La Jolla Point.
|

Fig. 48. Wave-cut bench and tide pool area at south end of La Jolla Community Beach. |
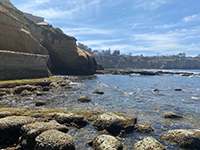
Fig. 49. Deeper pool near the mouth of the sea cave at end of moss-covered walkway. |
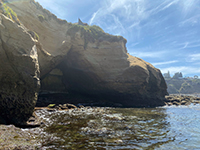
Fig. 50. A cement wall has been added to seal off and add roof support to a sea cave. |
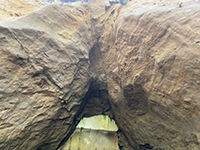
Fig. 51. Small fault fractures in sandstone exposed in roof of the sealed sea cave.
|
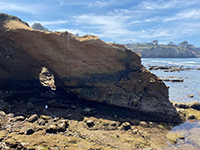
Fig. 52. A small sea arch through a narrow headland on the La Jolla Bay sea cliffs.
|
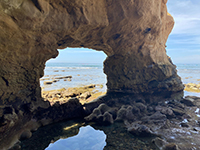
Fig. 53. A layer of sandstone concretions crops out near the base of the sea arch window. |
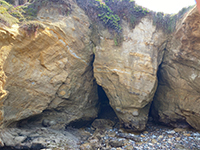
Fig. 54. Dual entrances to a small sea cave formed along a fracture and a small fault.
|
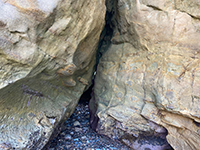
Fig. 55. A small fault is associated with a narrow sea cave entrance.
|

Fig. 56. Boulder-covered beach platform with sea caves with faults and fractures. |

Fig. 57. Boulder-covered beach platform with sea arch on an unstable headland. |
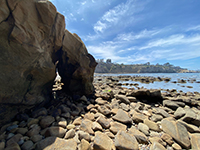
Fig. 58. Unstable arch with La Jolla Point - Nestor marine terrace visible in distance. |
|

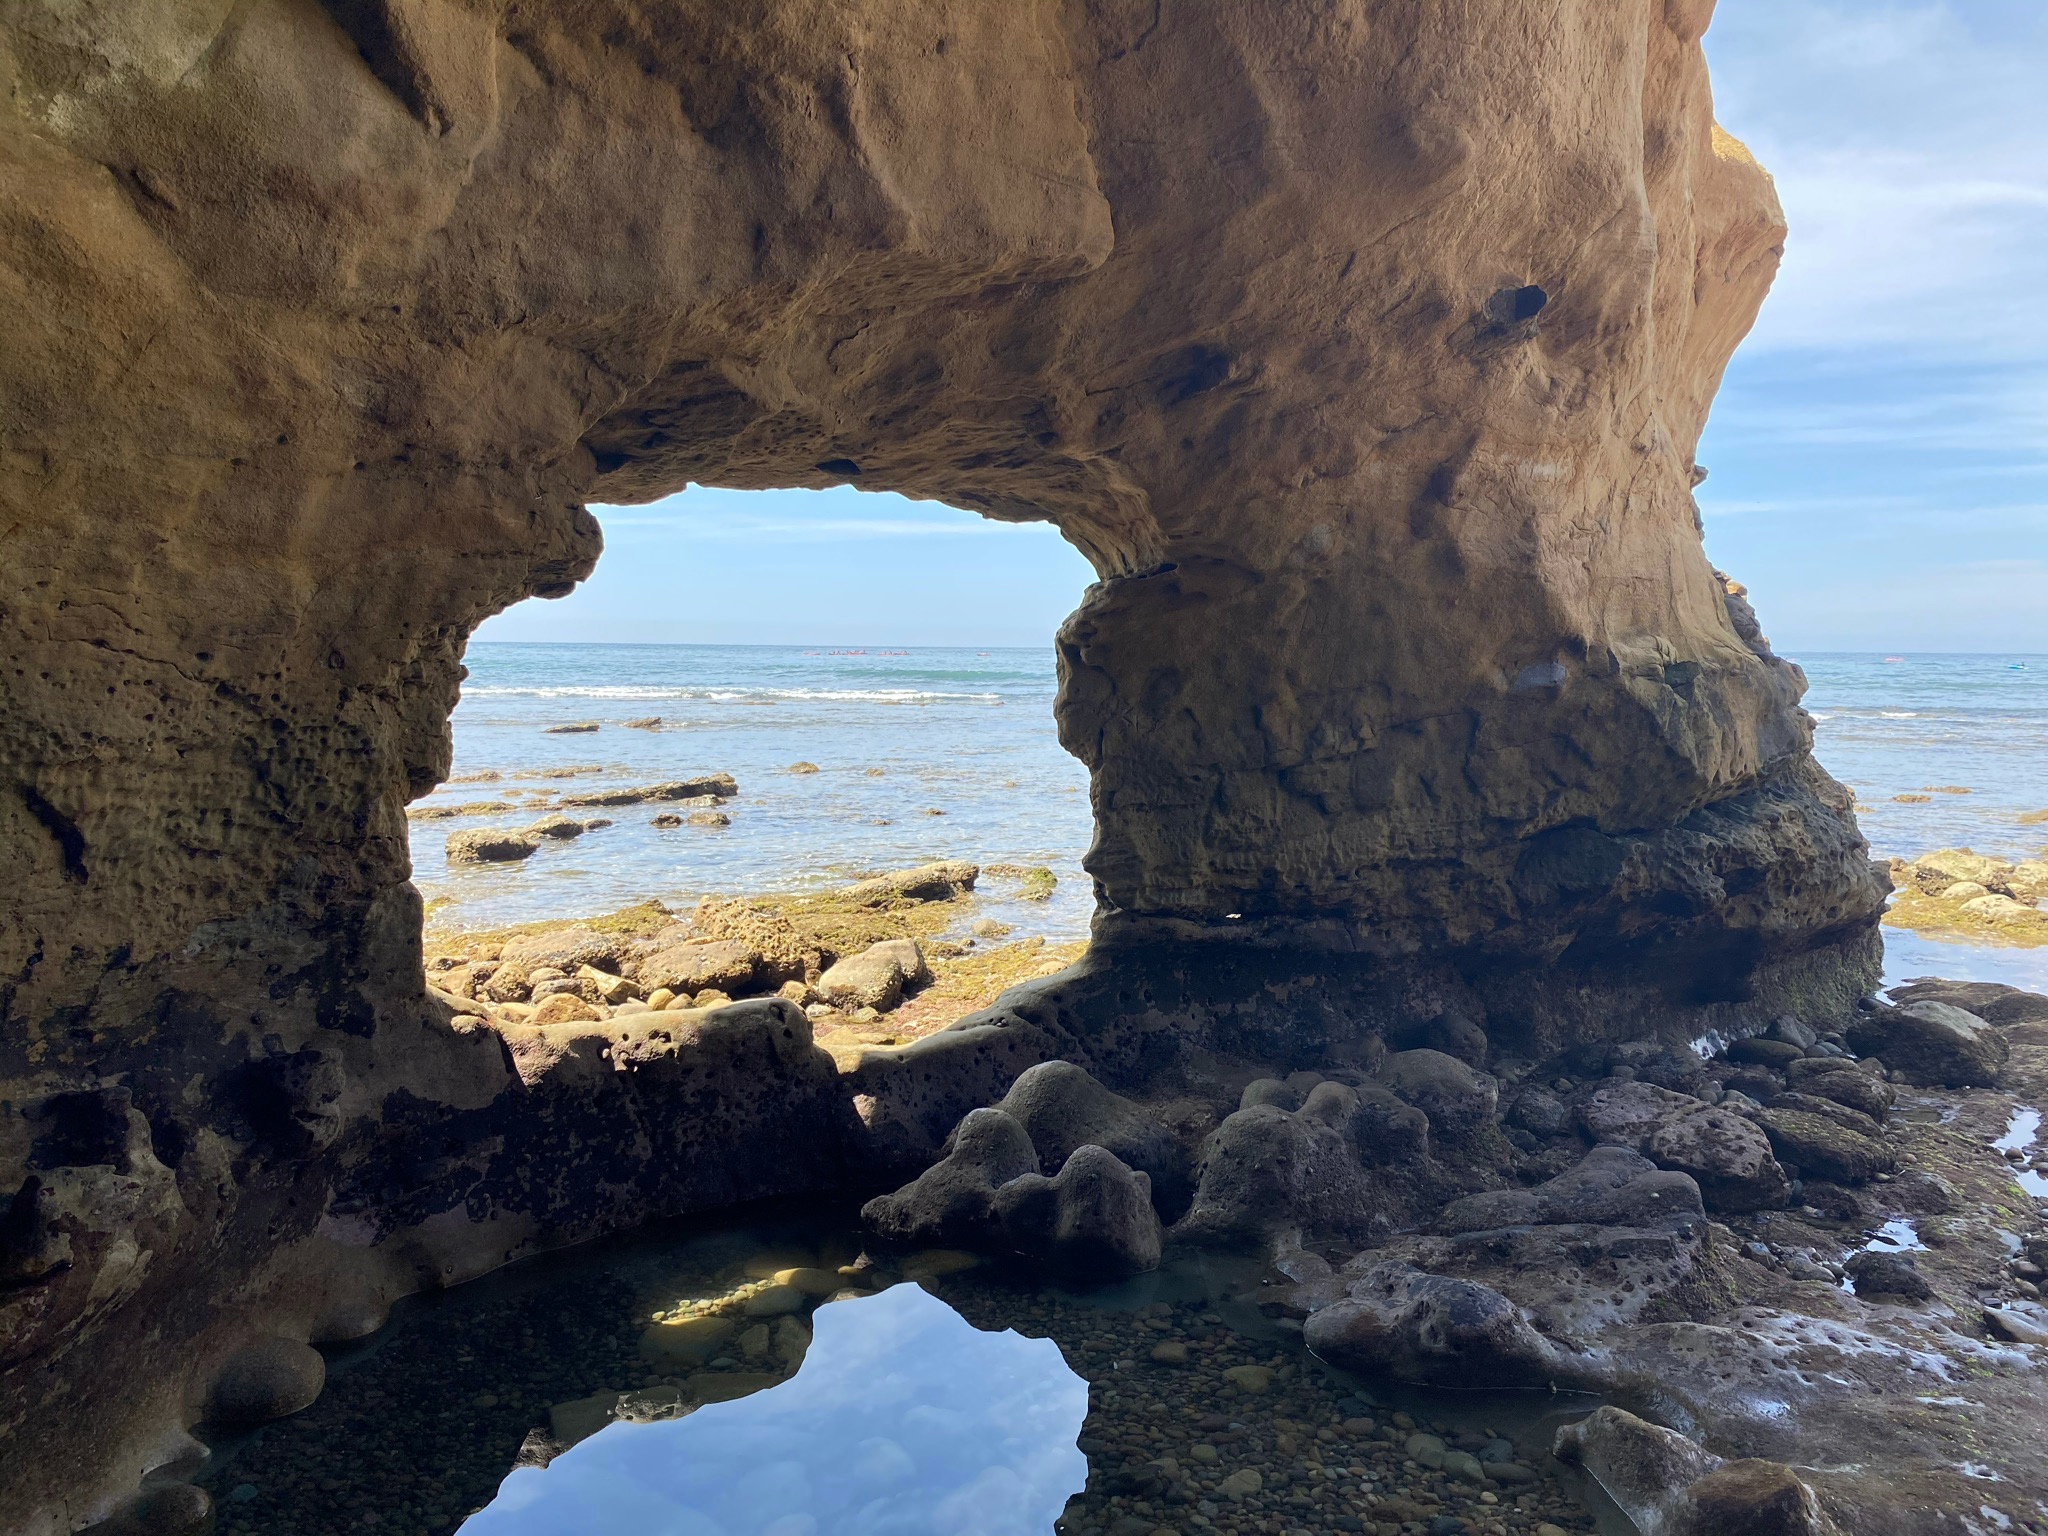
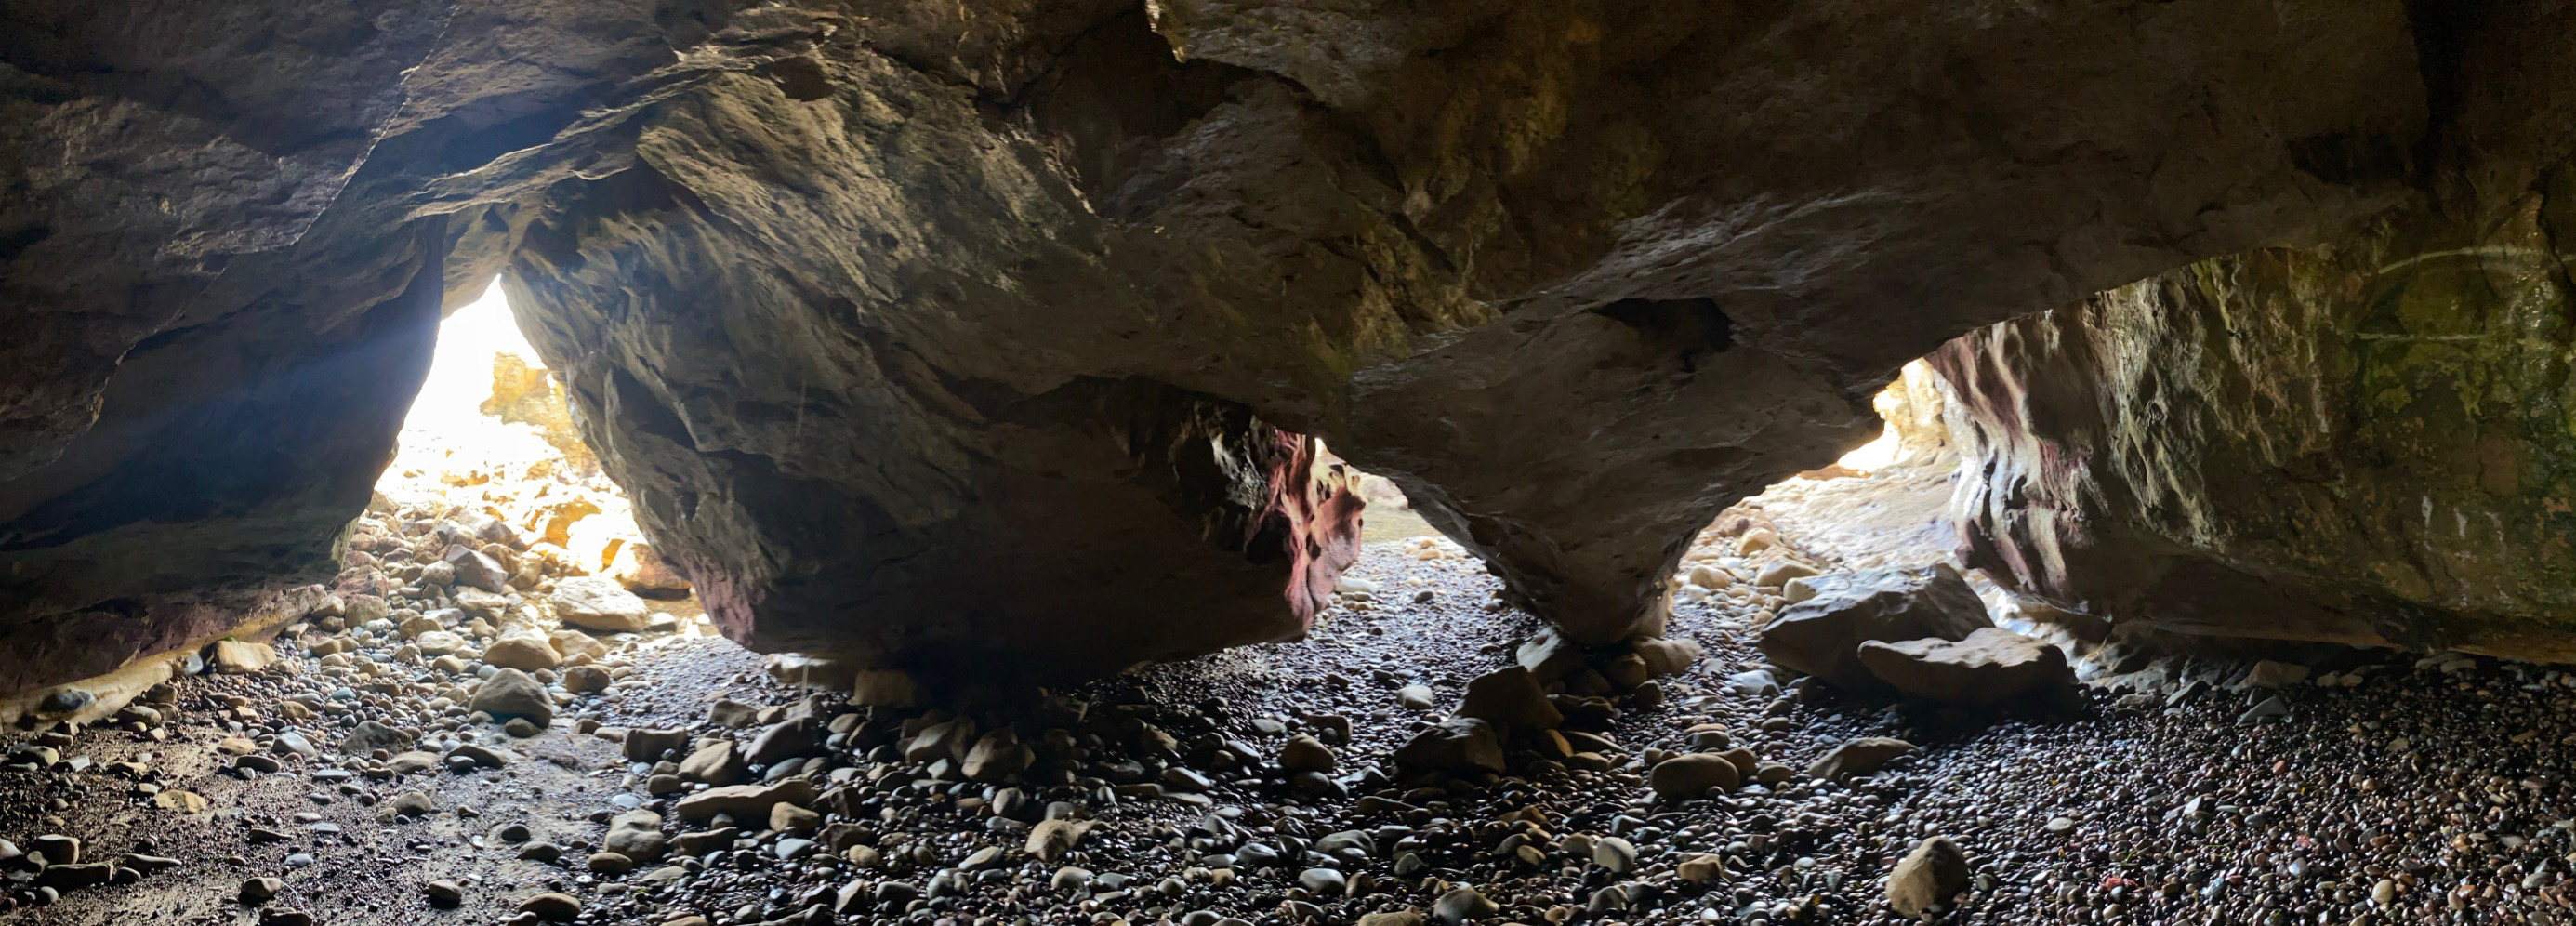
| Fig. 59. Panoramic view from inside a small sea cave in the cliffs along La Jolla Bay showing three separate entrances to an underground chamber. The outside entrances of the sea cave are shown in Figures 54 to56. This panorama is about a 180 degree view. |
A11
Tectonic Folding In the Fault Zone
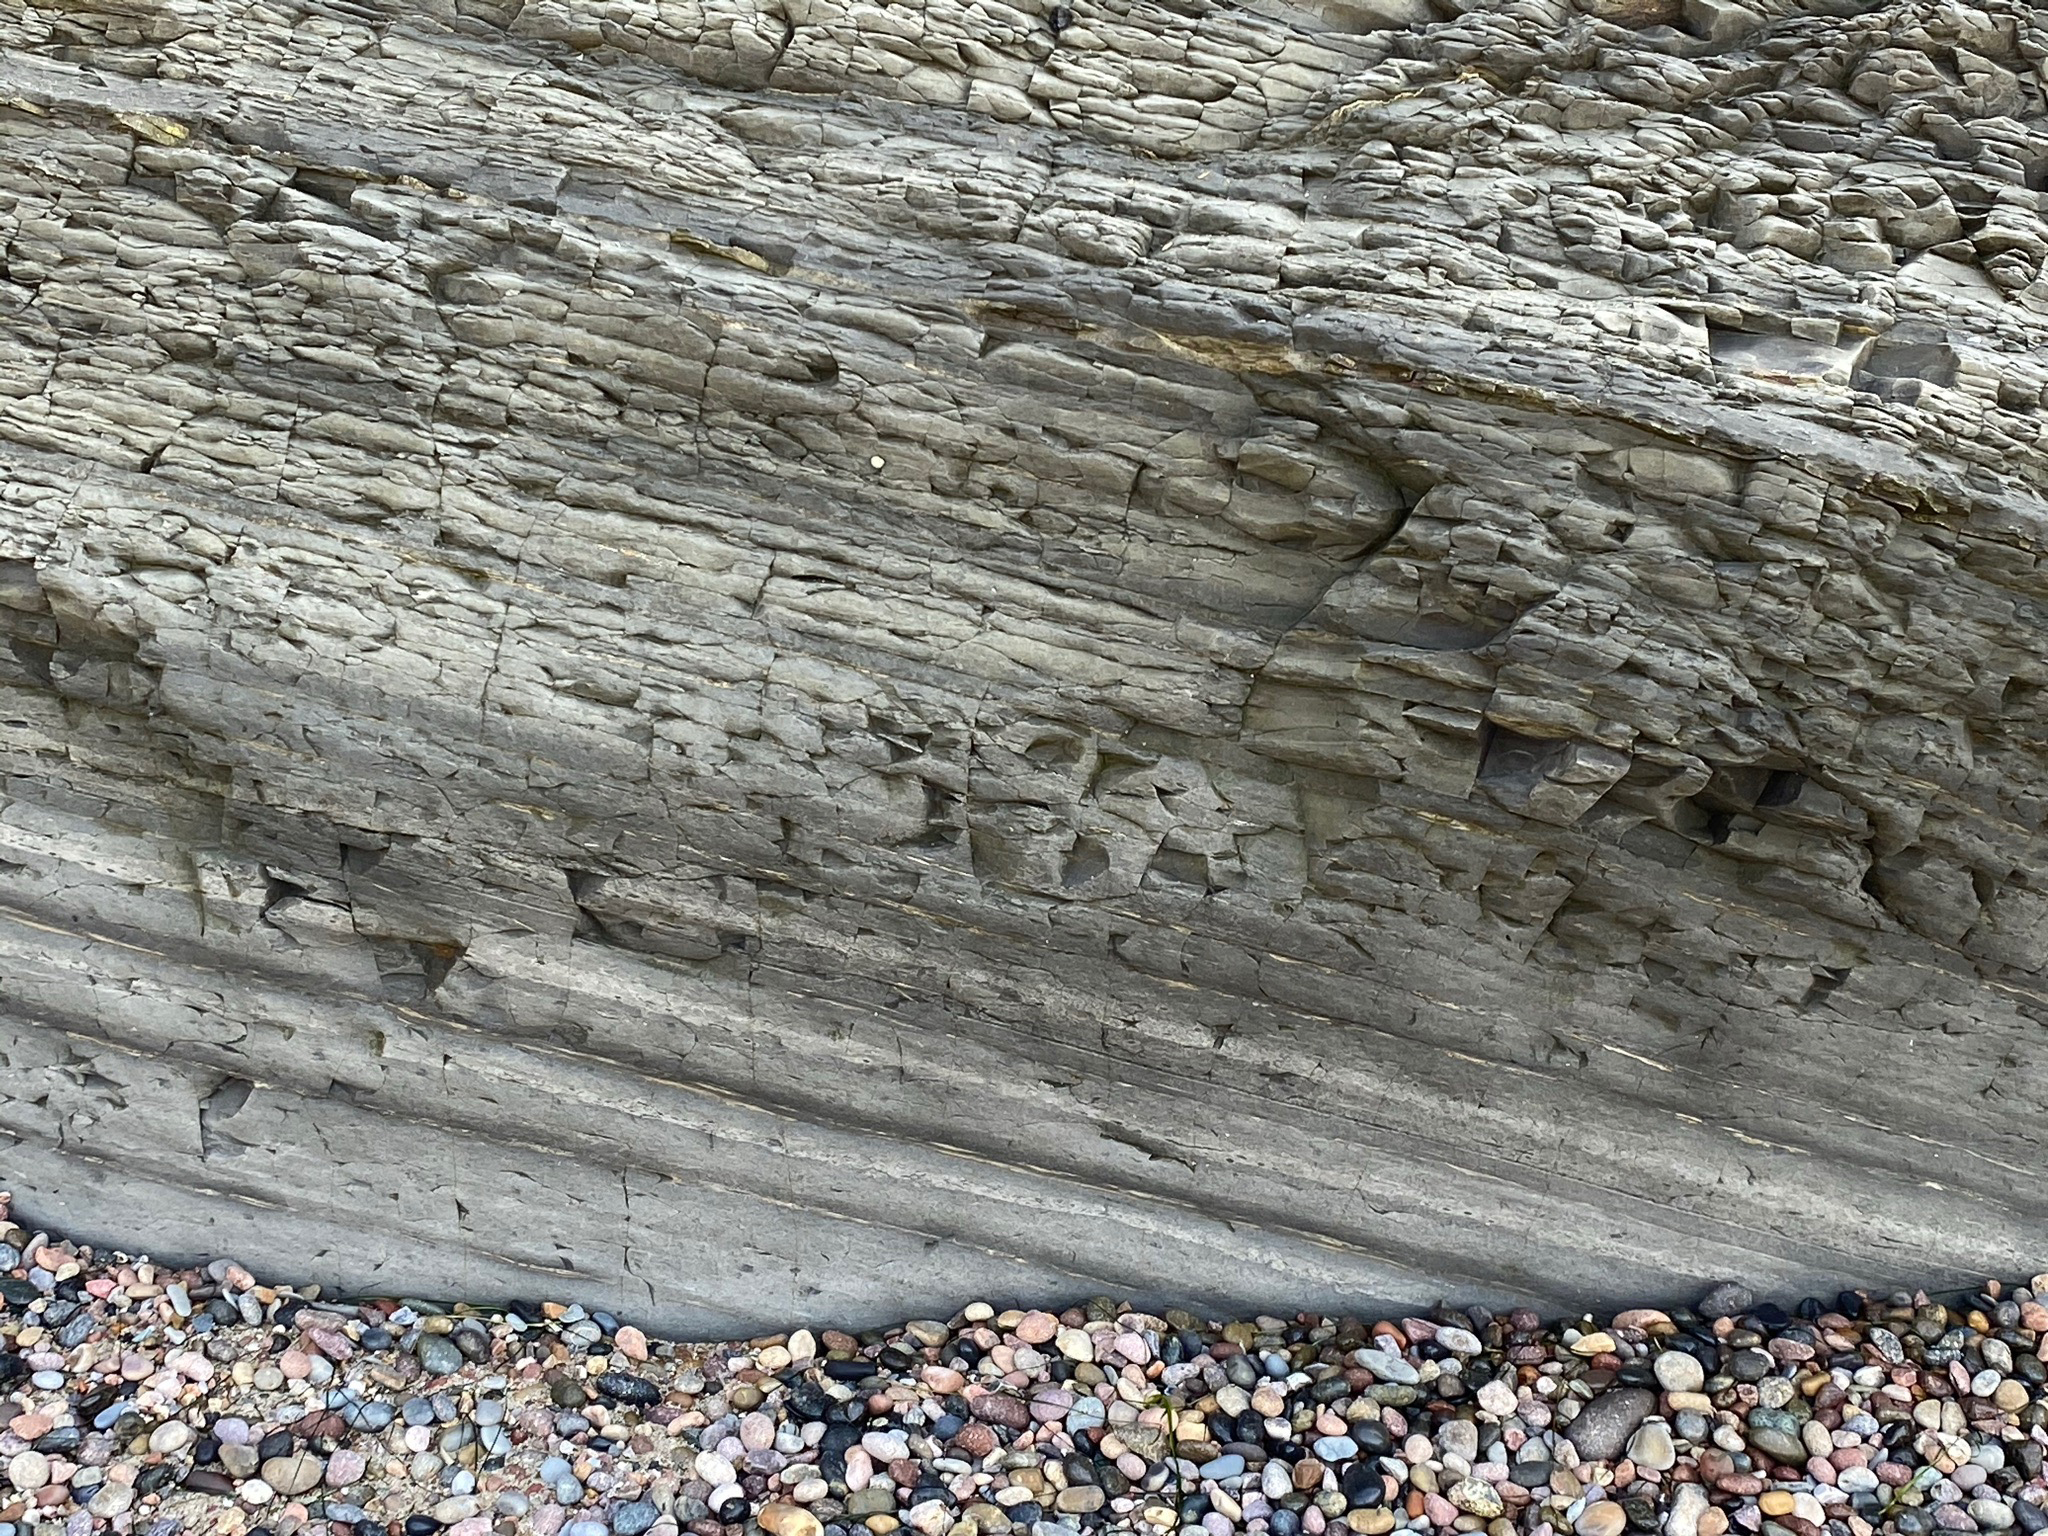
Figures 60 to 67 shows various views of the steeply dipping strata of the Point Loma Formation exposed in the sea cliffs and on the wave-cut platform. There is little or no sand in the beach zone, only boulders, cobbles, and gravel because of the strong waves and currents that move along the coast here at high tide and high wave action. The Rose Canyon Fault Zone is a great shear zone where the sedimentary rock formations are folded near the fault zone. The softer shale beds tend to flow or fold before they fracture. The steepest-dipping layers are near the fault in the Corner area. Along the margins of the fault zone, the strata south of Point La Jolla are relative gently dipping to flat-lying. To the north, strata is not exposed in the La Jolla Shore beach area, but they are relatively gently dipping to flat lying in the sea cliffs north of Scripps Pier and northward along the coast. (See images of the sea cliffs north of Scripps Pier, including Dike Rock and Blacks Beach on the Torrey Pines website.) |
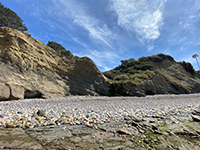
Fig. 60. Cobble-covered beach platform; sea cliff with steeply south-dipping strata.
|

Fig. 61. Steeply south-dipping sandstone and shale beds (turbidites) in the sea cliff.
|

Fig. 62. Interbedded sandstone and shale beds display small faults and fractures.
|
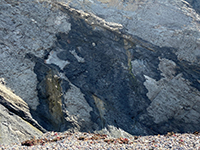
Fig. 63. Water seeps onto the sea cliff from fractures in siltstone and shale beds. |

Fig. 64. Step-like layers of resistant sandstone and softer shale bed of submarine fan deposits (turbidites). |
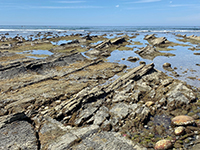
Fig. 65. Steeply south-dipping strata exposed on the wave-cut platform exposed at low tide.
|
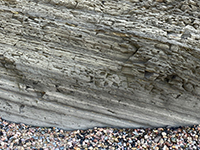
Fig. 66. South-dipping shale beds and well sorted beach pebbles at the base of the sea cliff. |
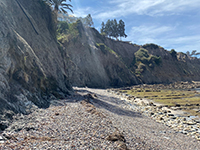
Fig. 67. Pebble-covered beach berm. Shaft of light points to Rose Canyon Fault in the vicinity of the Devil's Slide. |
|
A12
Rose Canyon Fault In The Devil's Slide Area
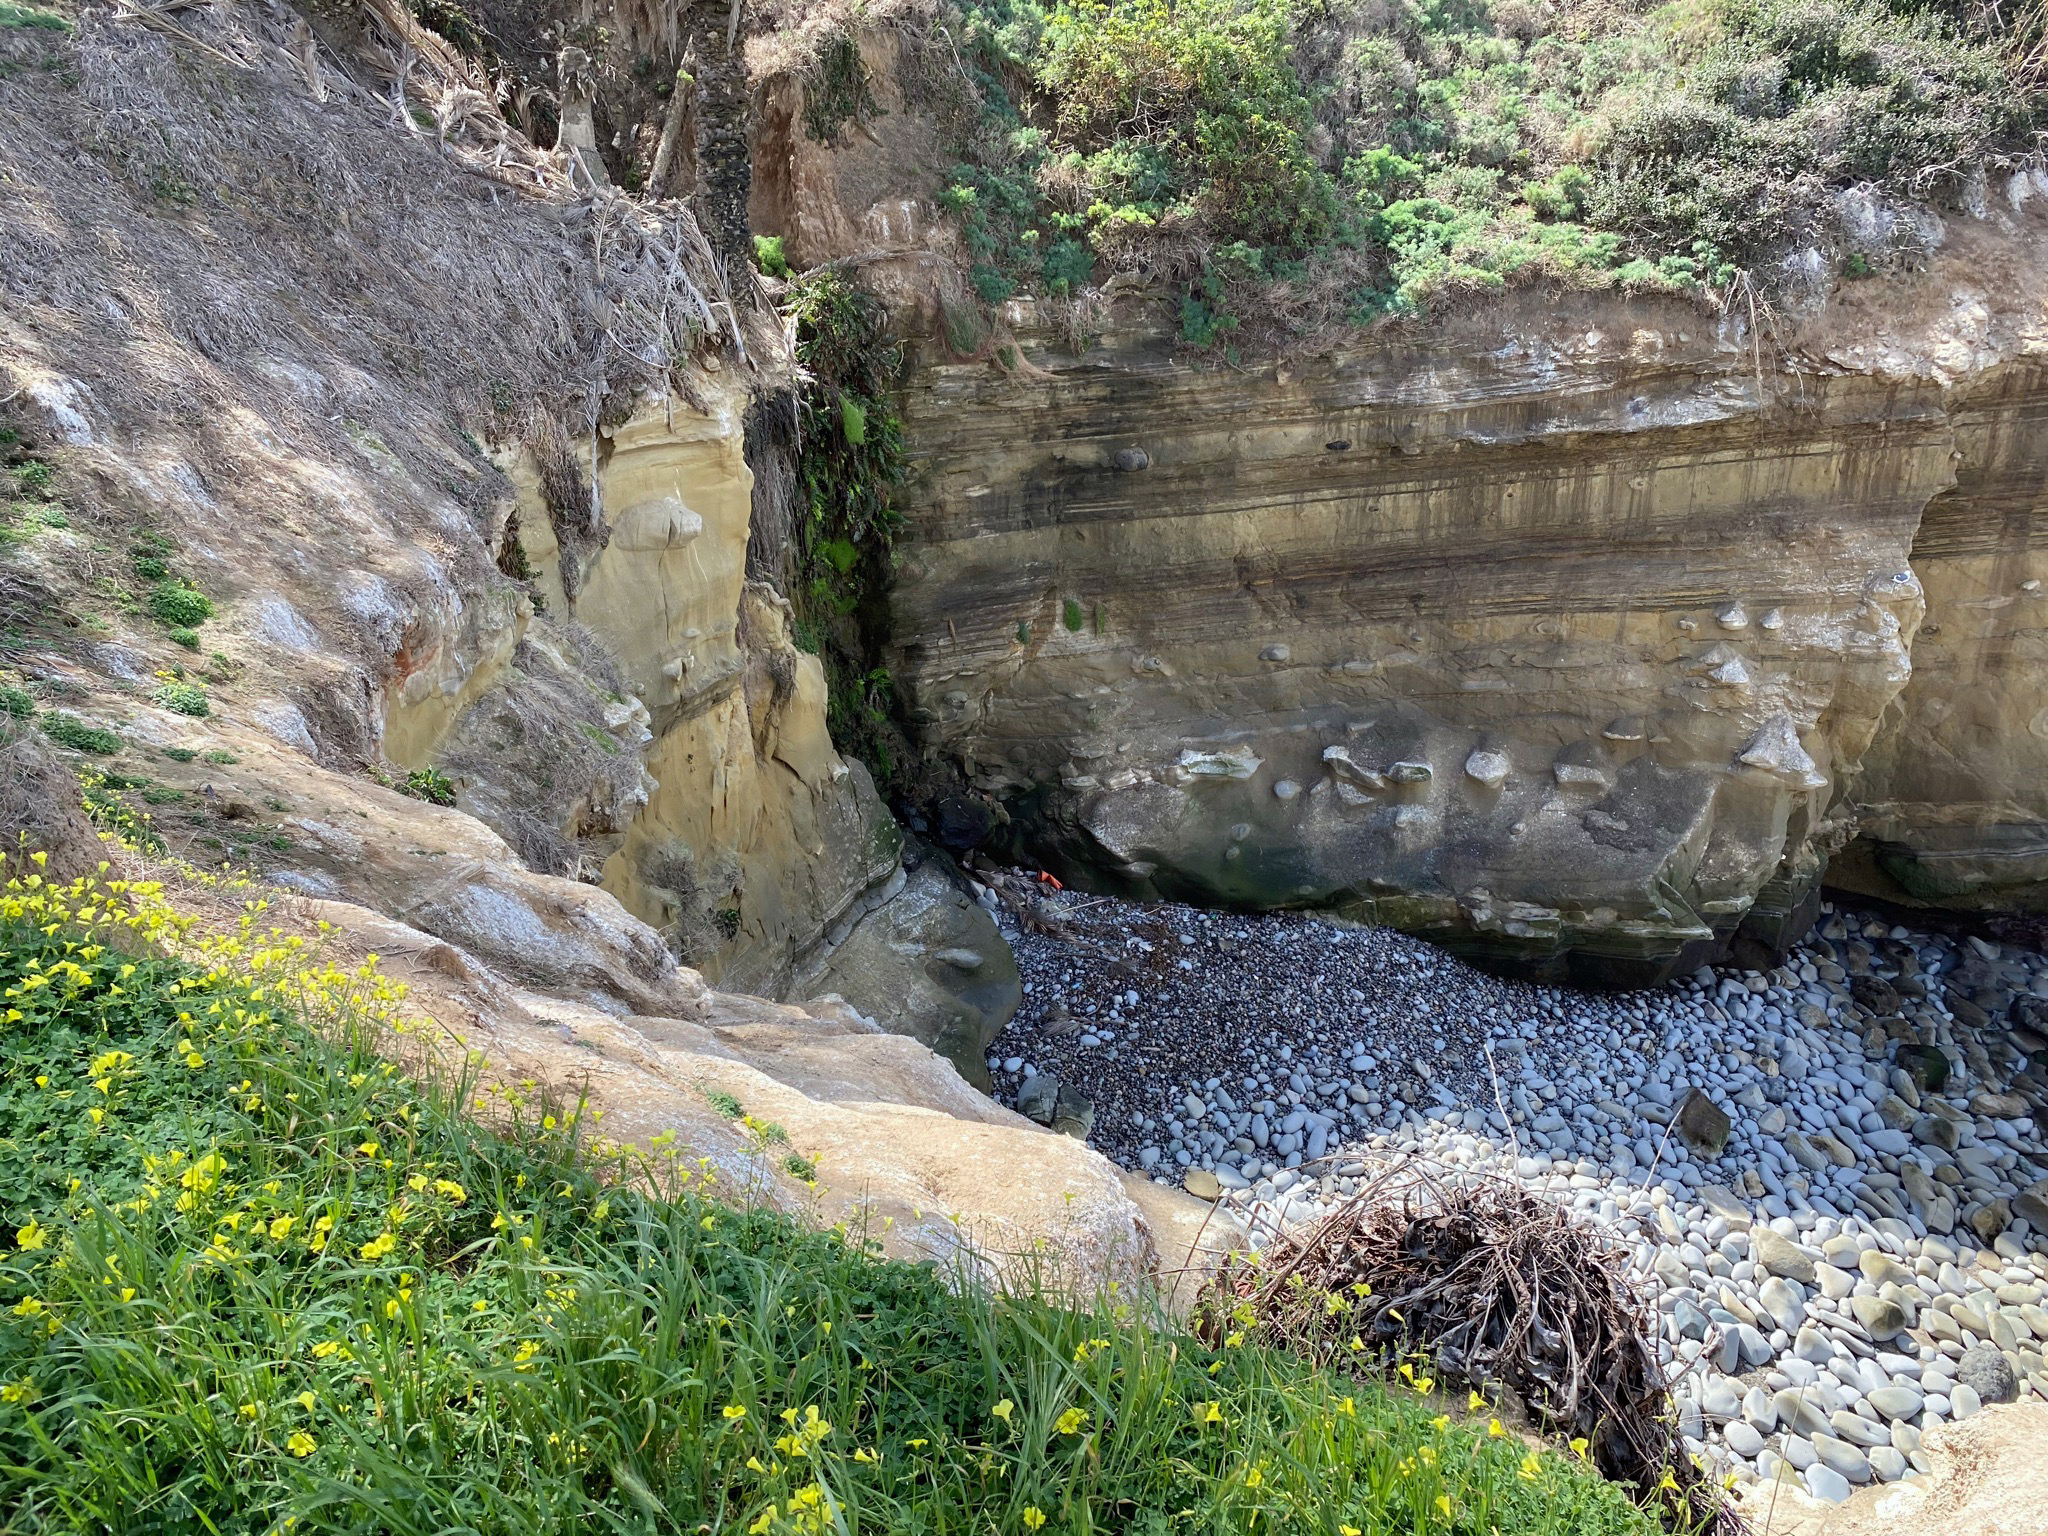
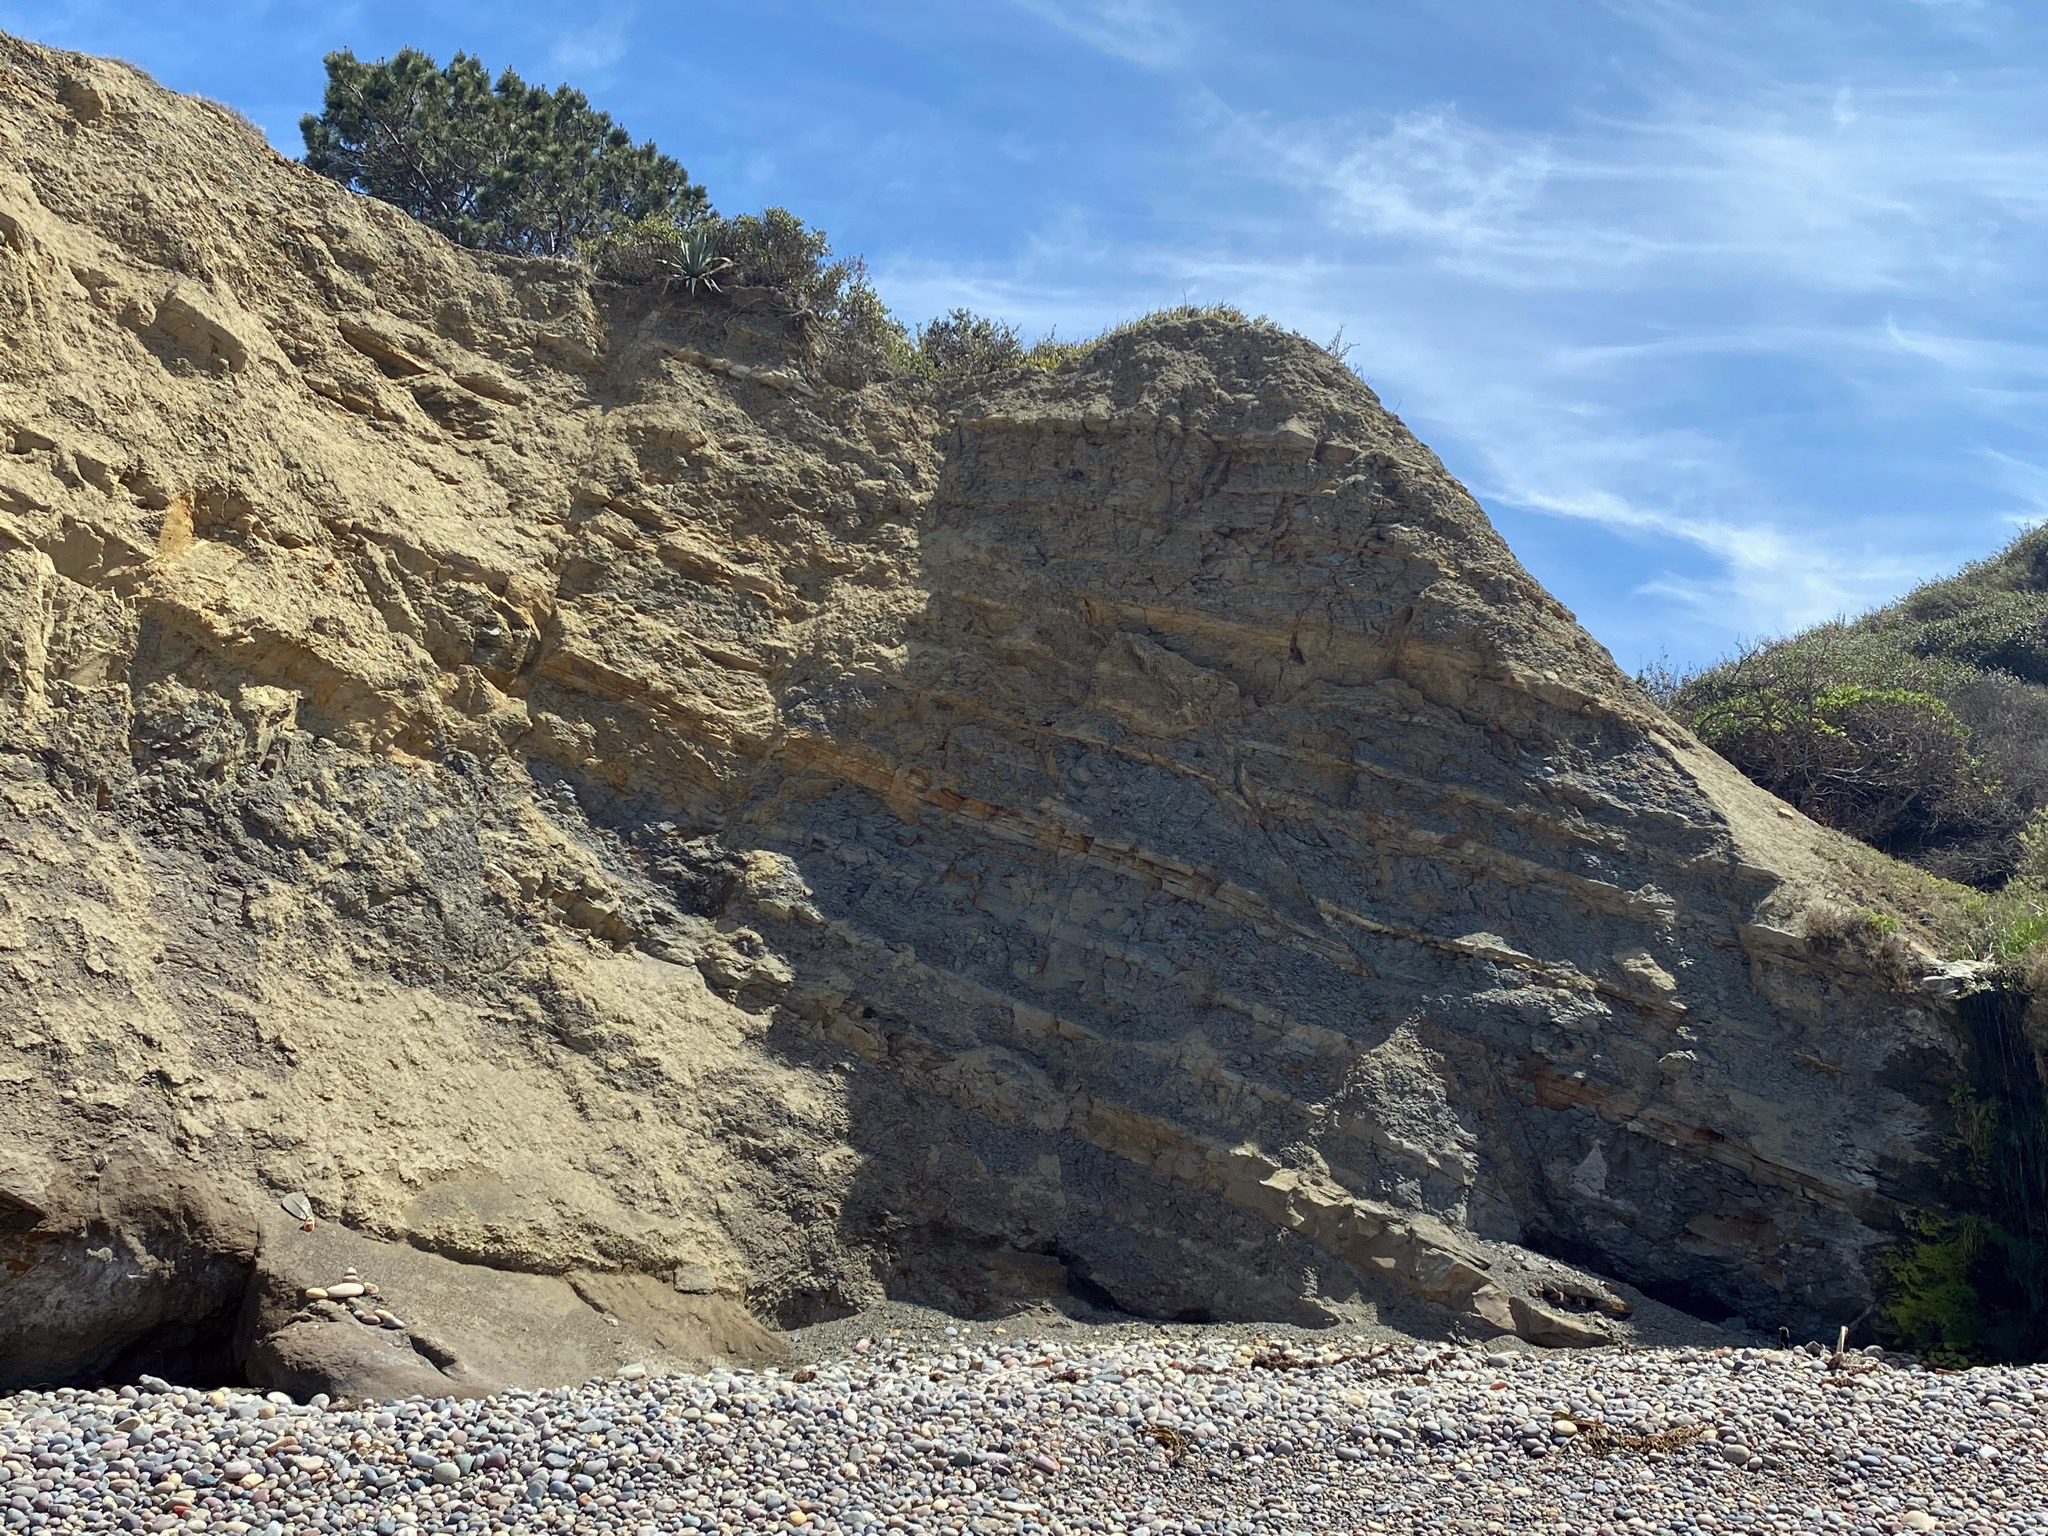
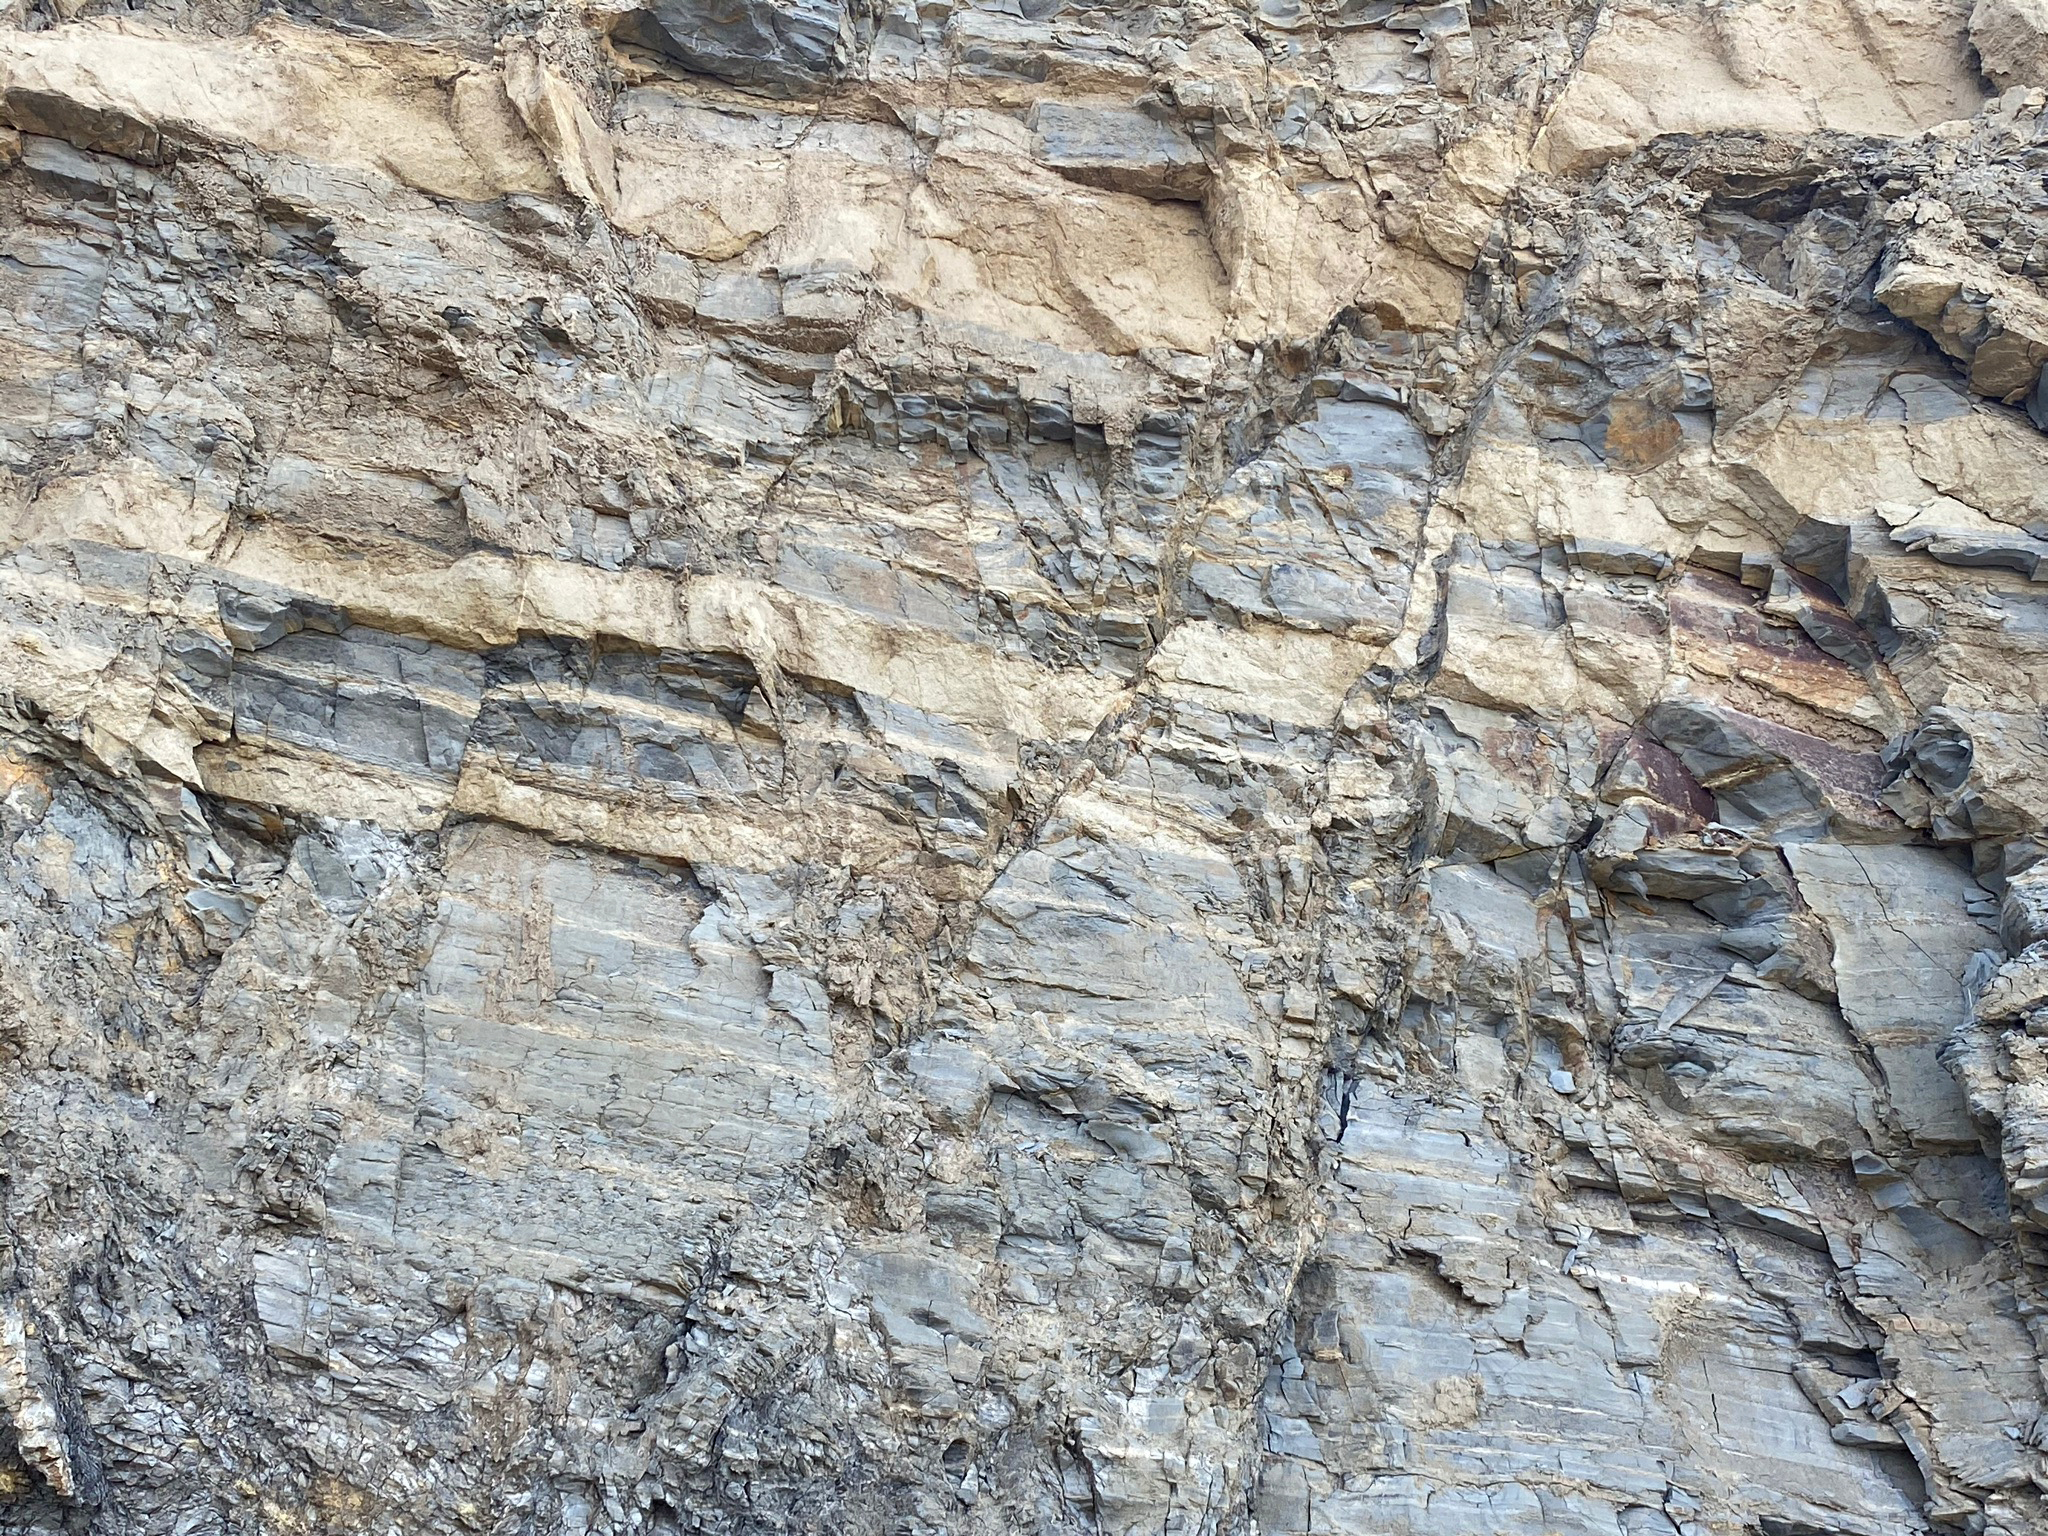
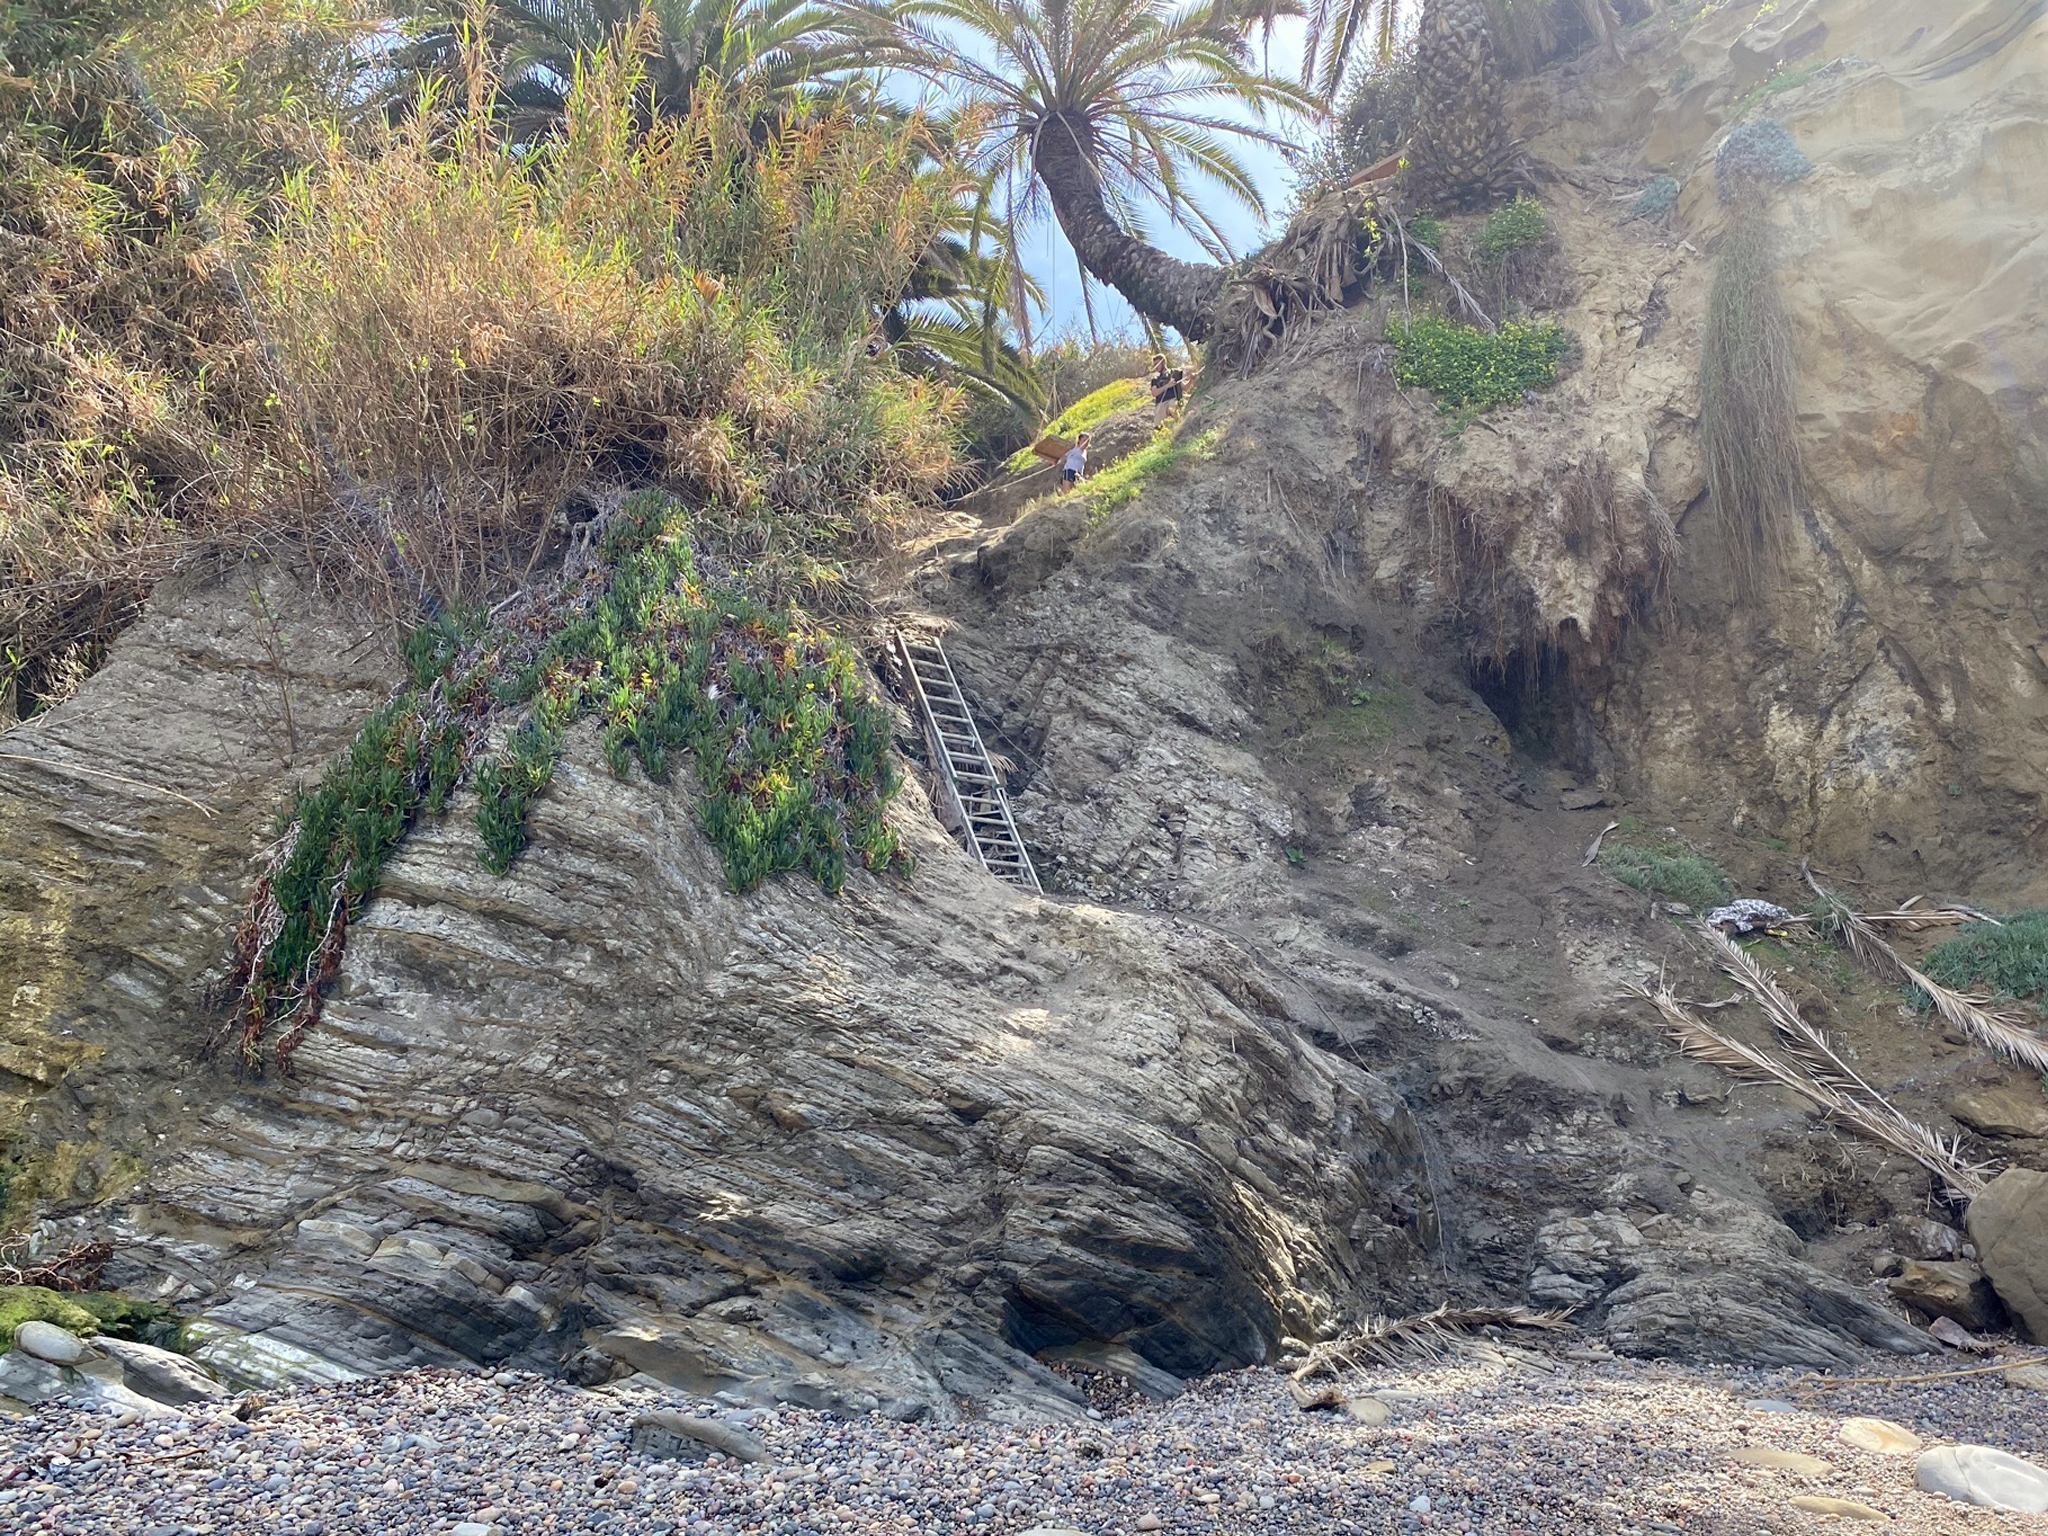
The largest fault with the most significant visible offset is located in the sea cliffs in the Corner of La Jolla Bay at the location known as The Devil's Slide (Figures 68 to 71). The Devil's Slide name is appropriate because the shore access trail here is covered with s;ippery mud eroding from the fault zone that adds to the dangers of climbing up or down the route (involving muddy, knotted ropes and a ladder). It is in this area that the deformation of the rocks exposed in the sea cliffs is most intense. Also the contrast of sedimentary beds on opposite sides of the faulted area about 50 feet wide are most obvious. It is why this area is called the Rose Canyon Fault, whereas the actual Rose Canyon Fault Zone is distributed across a much wider area (thousands of feet), and some fault zone features are not exposed at the surface.
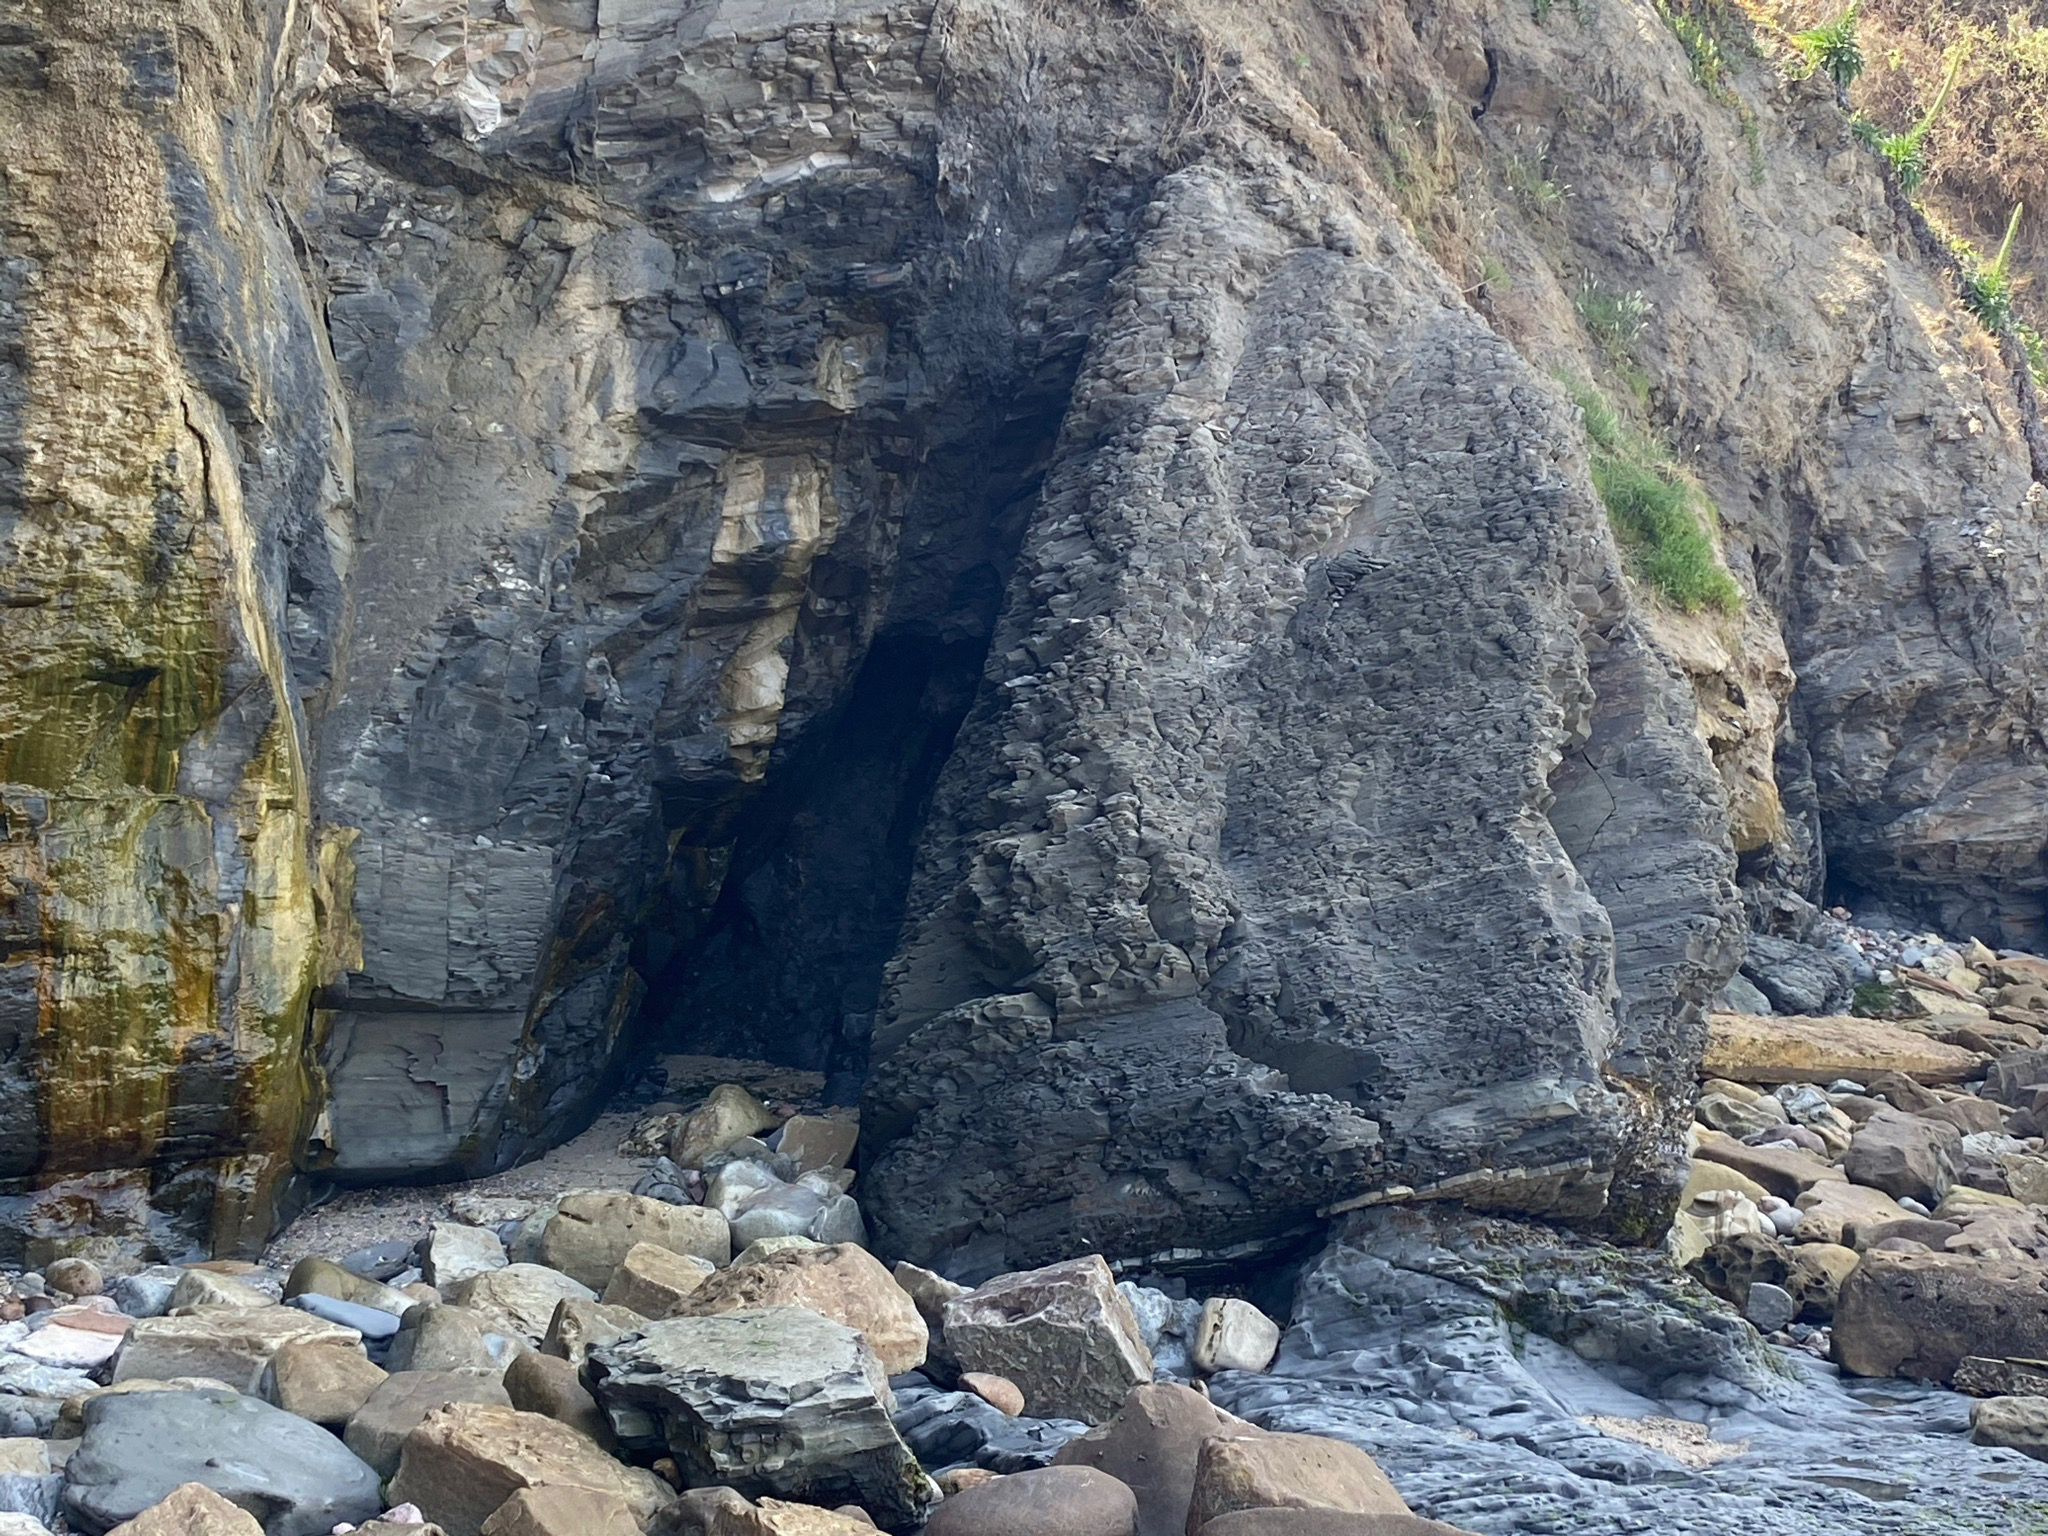
Figure 72 shows the mouth of two small sea caves near the Devil's Slide known as 1st and 2nd Corner Caves. The 2nd Corner Cave (on the right) has a sinuous appearance carved by flowing water in a open fault fractures and displays some flowstone deposits. Figure 73 shows the sea cliff extending from the Corner to Goldfish Point where the many other La Jolla Sea Caves are located. Figure 74 and 75 show the relatively flat-lying to gently dipping strata exposed in that section of the sea cliff. Figure 76 shows a panoramic view of the Corner with the Devil's Slide. |

Fig. 68. View of the corner in the sea cliff where rock formations are different on opposite sides of the fault. |
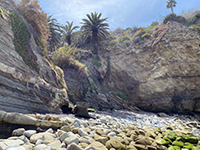
Fig. 69. View that shows the difference in the rock layers exposed on opposite sides of the fault in the Devil's Slide. |

Fig. 70. The Devil's Slide is a muddy route up the sea cliff along the fault using a ladder and muddy, knotted ropes. |

Fig. 71. The Rose Canyon Fault displaying offset strata of different character exposed in the corner of La Jolla Bay. |
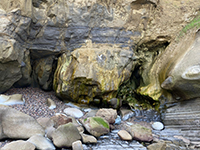
Fig. 72. A cavernous passage with spring deposits with the Rose Canyon Fault Zone on the rocky beach. |
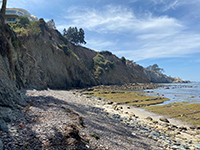
Fig. 73. Corner of the sea cliffs along La Jolla Bay where the Rose Canyon Fault runs out to sea.. |
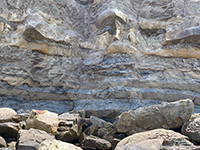
Fig. 74. Sandstone and shale beds of the Point Loma Formation in the sea cliff west of the Rose Canyon Fault. |
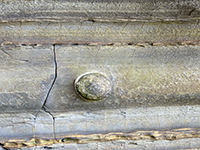 Fig. 75. A concretion weathering from a shale bed in the Point Loma Formation exposed in the sea cliff. Fig. 75. A concretion weathering from a shale bed in the Point Loma Formation exposed in the sea cliff. |
|
| Fig. 76. Panoramic view looking north across the Rose Canyon Fault with strata Cretaceous-age Point Loma Formation of different character exposed on opposite sides of the Devil's Slide. The Devil's Slide is near the palm trees at center of the image where a ladder and a muddy knotted rope are located). |
A13
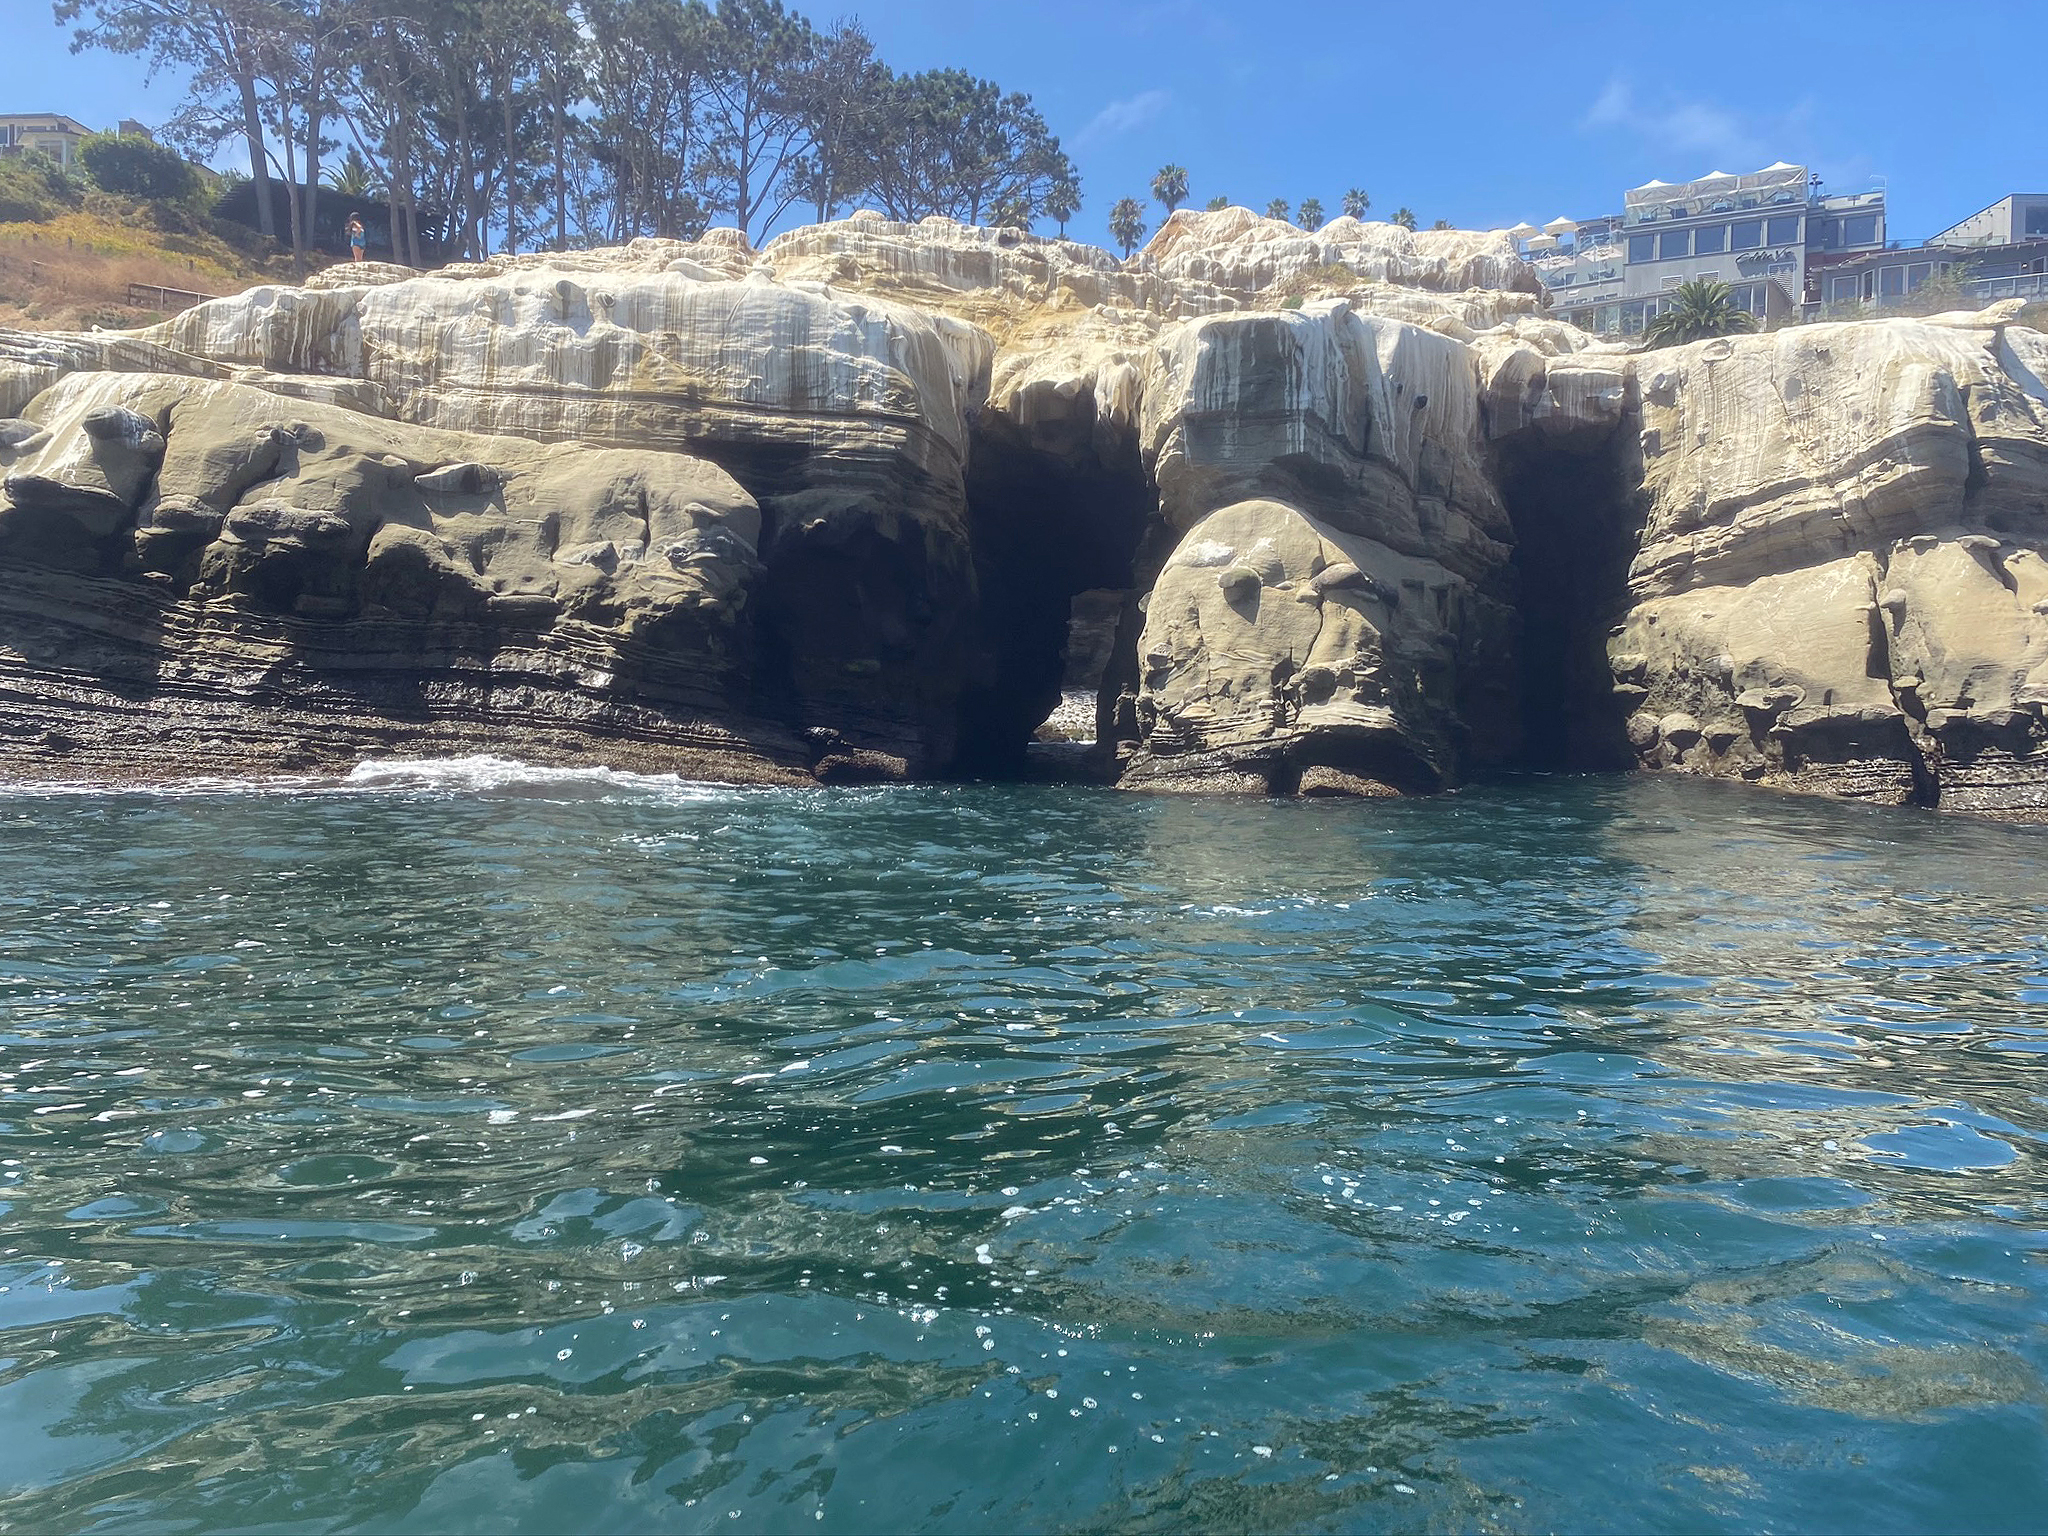
Snorkel or Kayak To See The La Jolla Sea Caves
A number of companies offer guided kayak and snorkeling trips to the sea caves along La Jolla Bay. However, you can go on your own accord but must abide by the rules of the San Diego-La Jolla Underwater Park & Ecological Reserve. The number of kayakers attempting to visit the caves can be pretty high, particularly on weekends during warm weather. The work of getting through the breaking waves to get to the more stable ocean beyond is not recommended for everyone, especially when waves are high.
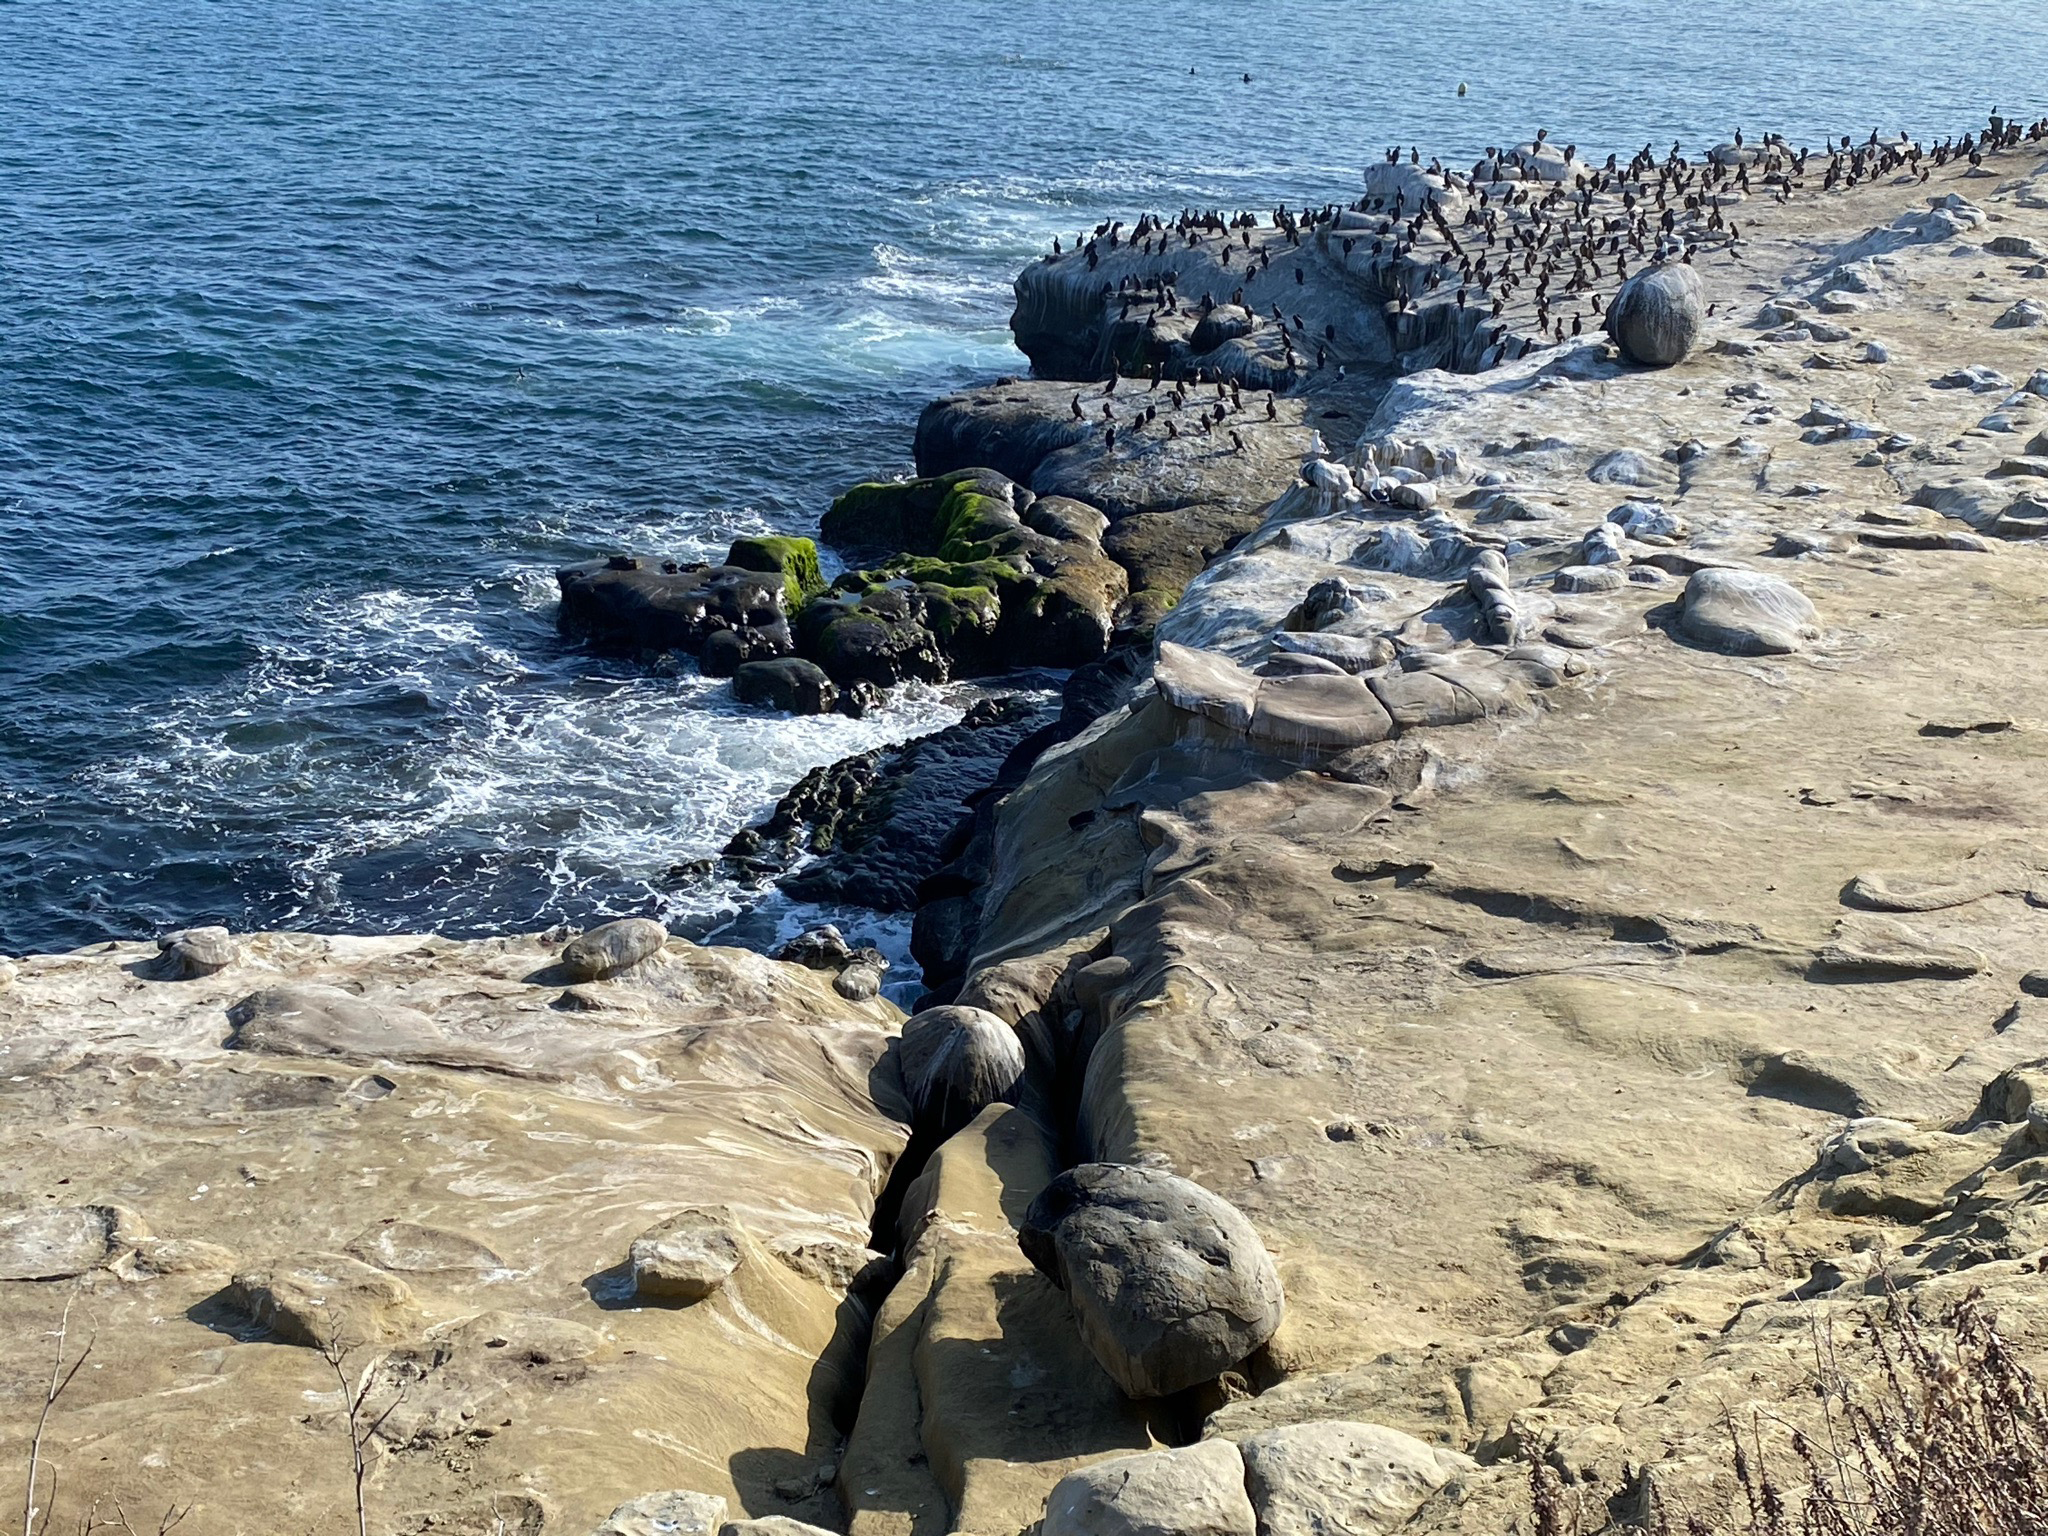
The Underwater Park spans the area from La Jolla Point to roughly midway down La Jolla Shores Beach and includes the rocky shores and sea caves in between. The majority of the snorkeling, diving, kayaking, and general enjoyment of the underwater park happens across these 533 acres. Buoys outline the park/reserve perimeter. The Ecological Reserve includes the rocky shore and sea caves south of La Jolla Shores Community Beach.
Recommended gear for swimmers include a life vest, fins, snorkel and mask, wet suit, gloves and helmet. Bring a light source if you intend to swim and explore inside the sea caves. Be sure to check sea and weather conditions before attempting to go. Be extremely cautious if attempting to swim and enter the sea caves. Note that sea lions may have taken residence inside some of the caves.
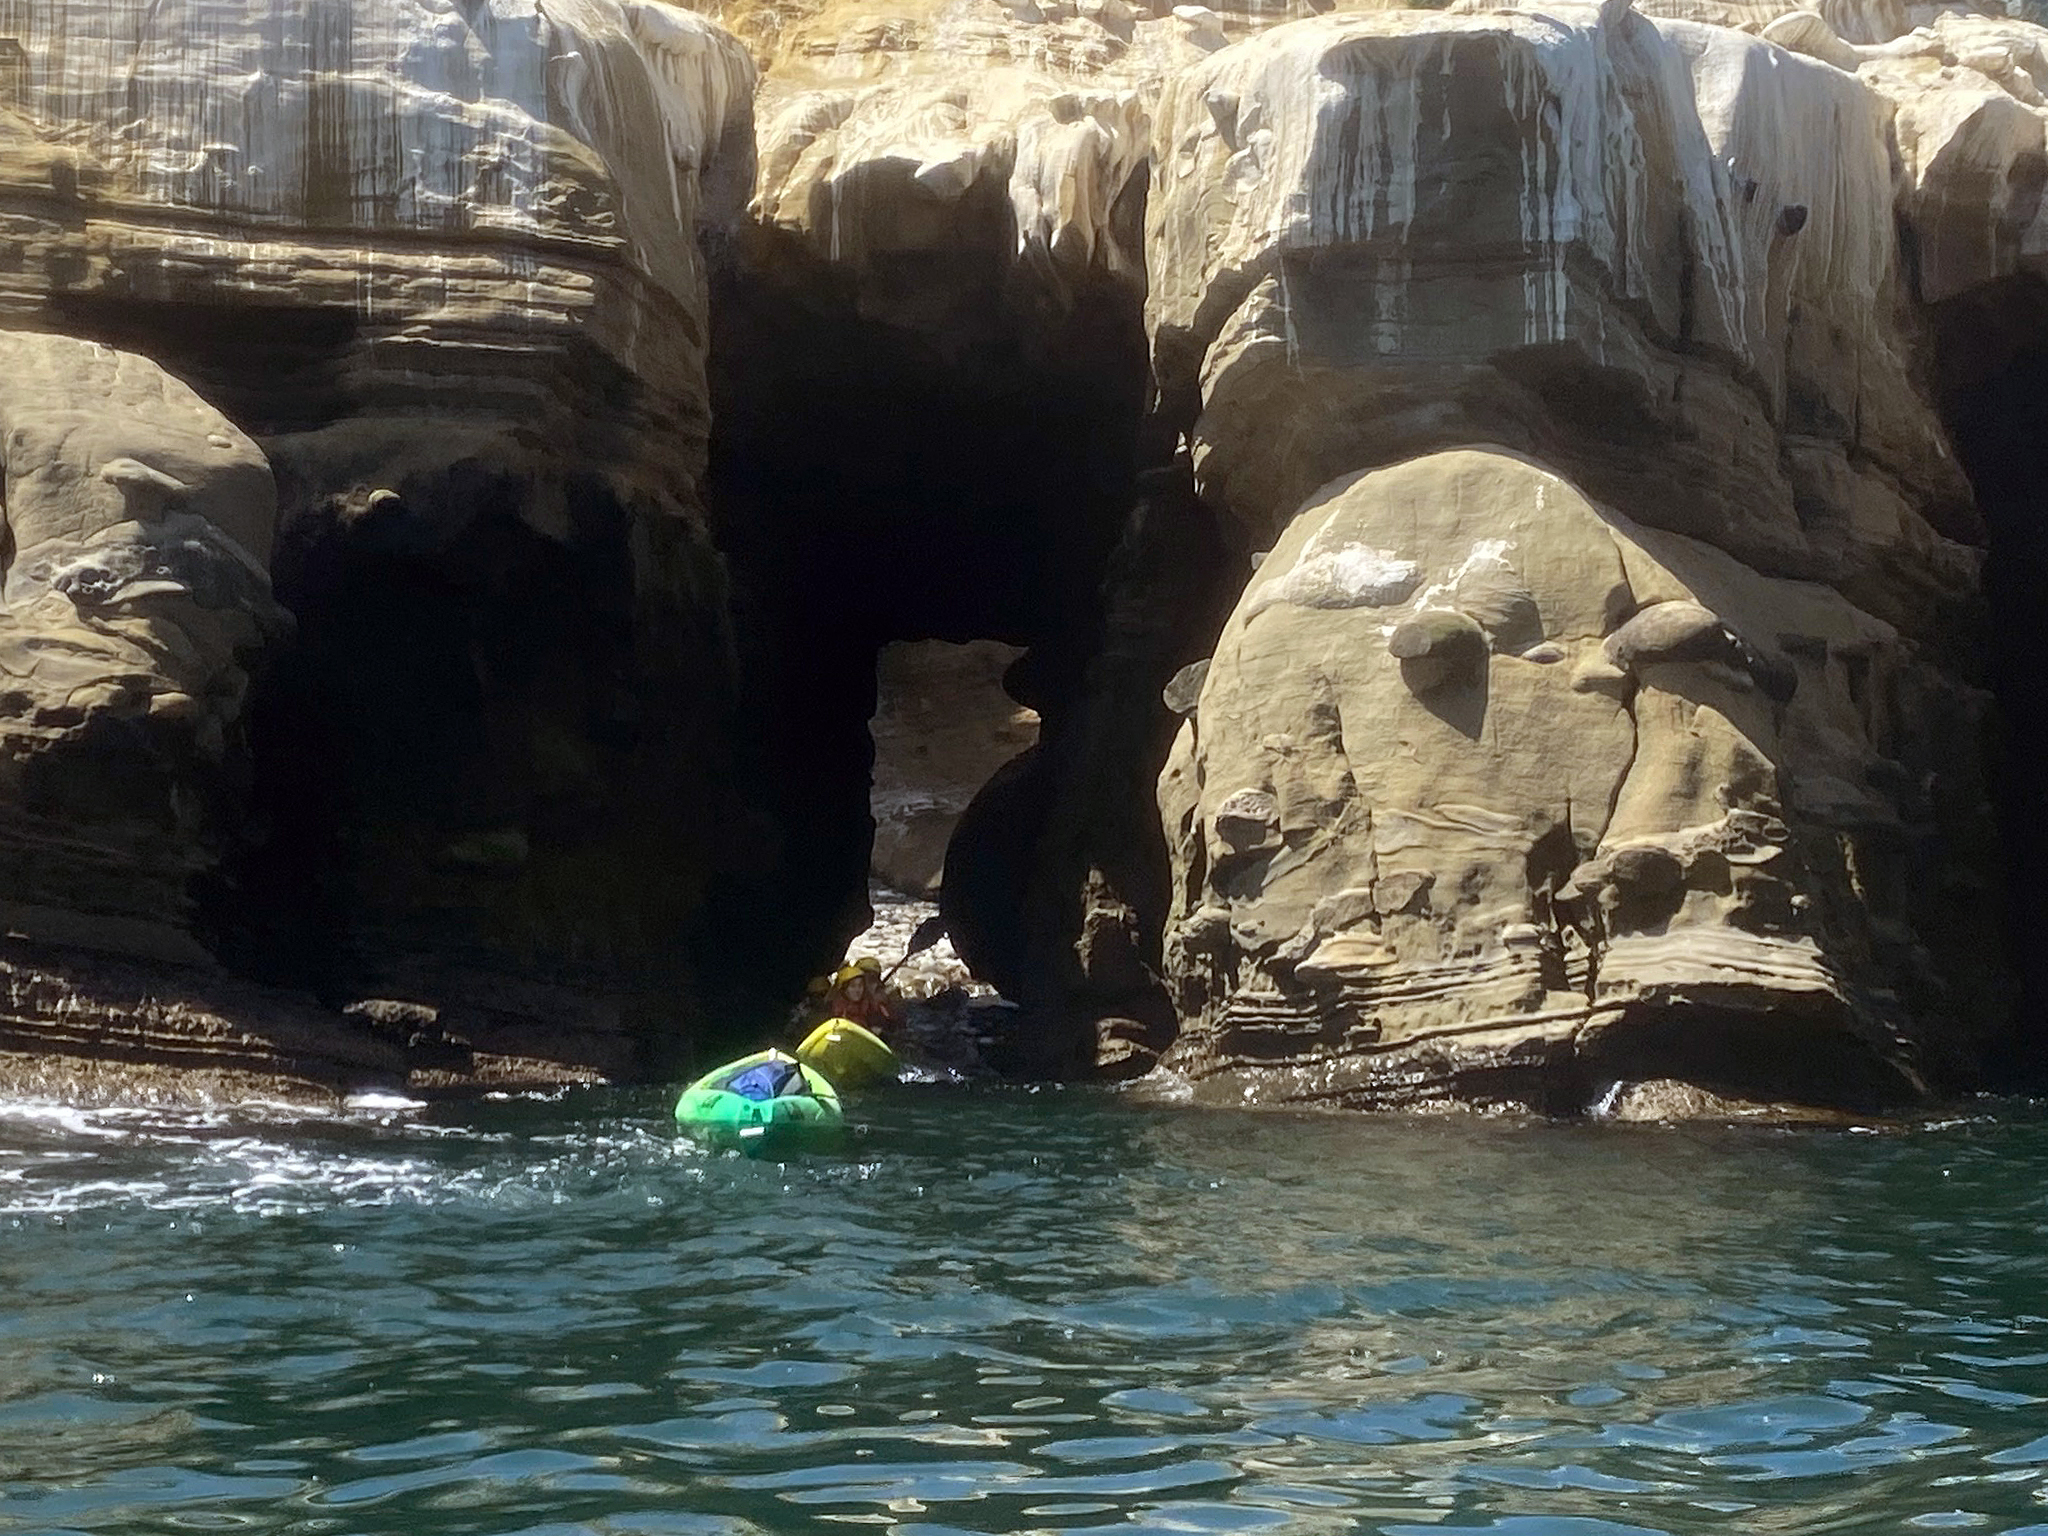
When conditions are right, the outside entrances of the caves can only be explored by kayak. Clam's cave goes through Goldfish Point and is the only sea cave you can paddle through (Figure 77 and 78).
Goldfish Point is named after Garibaldi, a large orange fish native to SoCal coastal marine waters. Weather permitting, you can pass by the other caves quite closely to see inside (Figure 79).
|
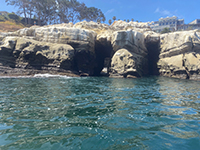
Fig. 77. View of kayakers paddling through Clam's Cave into a sunlit bay on the opposite side of Goldfish Point.
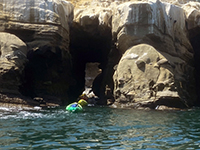
Fig. 78. Kayakers paddling through Clam's Cave. |
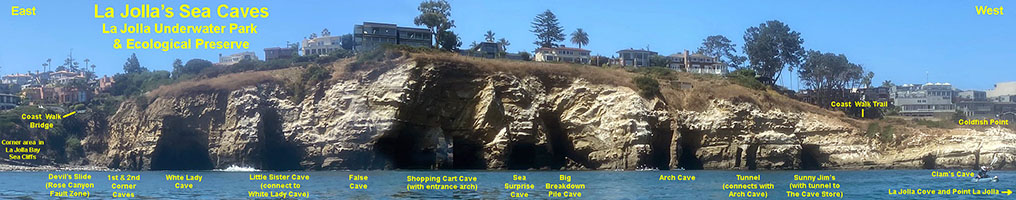
| Fig. 79. Sea Caves in the La Jolla seacliffs west of the corner in La Jolla Bay to Goldfish Point. Names of the seacaves are shown. The Coast Walk Trail follows the top of these sea cliffs. |
A14
The Rose Canyon Fault Zone Features: Mount Soledad to Old Town
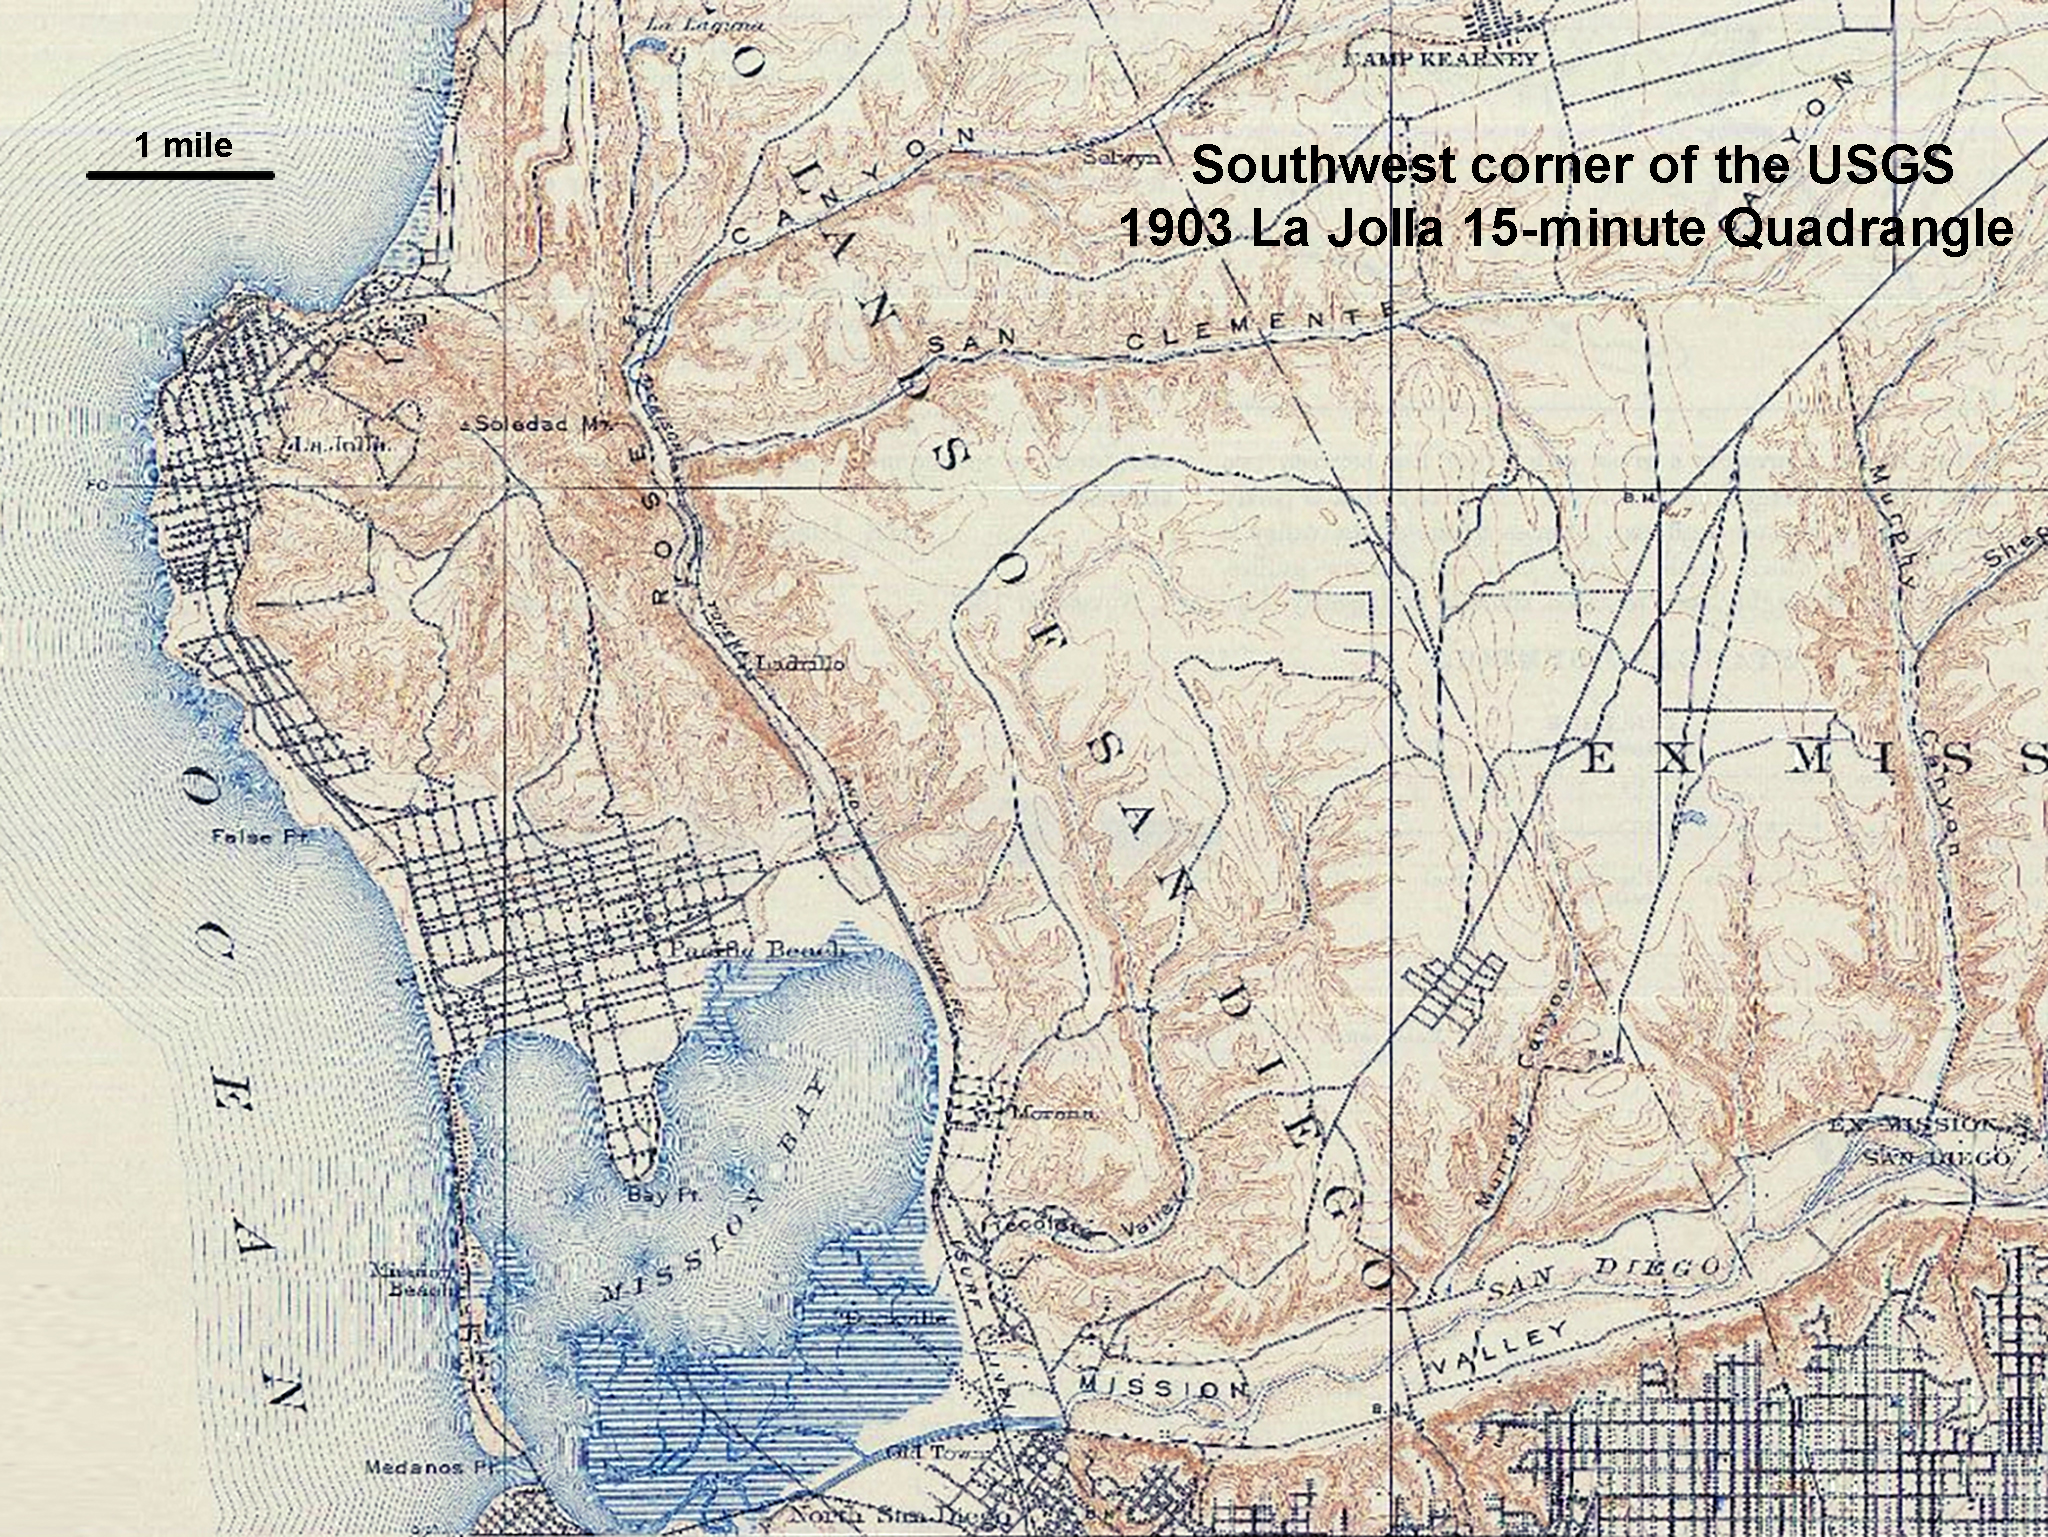
The Rose Canyon Fault is part of the larger tectonic story of the area. Whereas the La Jolla "peninsula" is an upwarp (large pressure ridge), Mission Bay is a downwarp (or structural basin or graben). Figure 80 is part of the the USGS 1903 La Jolla topographic map. The map shows the rural nature of most of the landscape, and Mission Bay before any significant development (Figure 81). Note that what is now Crown Point on the north side Mission Bay was originally named Bay Point. The south side of the bay was mostly tidal wetlands at the mouth of the San Diego River. The region east of the Rose Canyon and Mission Bay (where the Rose Canyon Fault line follows) is a level mesa (or erosionally dissected plateau). The Lindavista Formation forms a caprock across most of the mesas region. |

Fig. 80. The southwest portion of the USGS 1903 La Jolla 15-minute Quadrangle. |
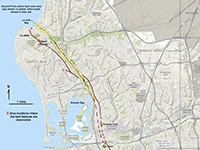
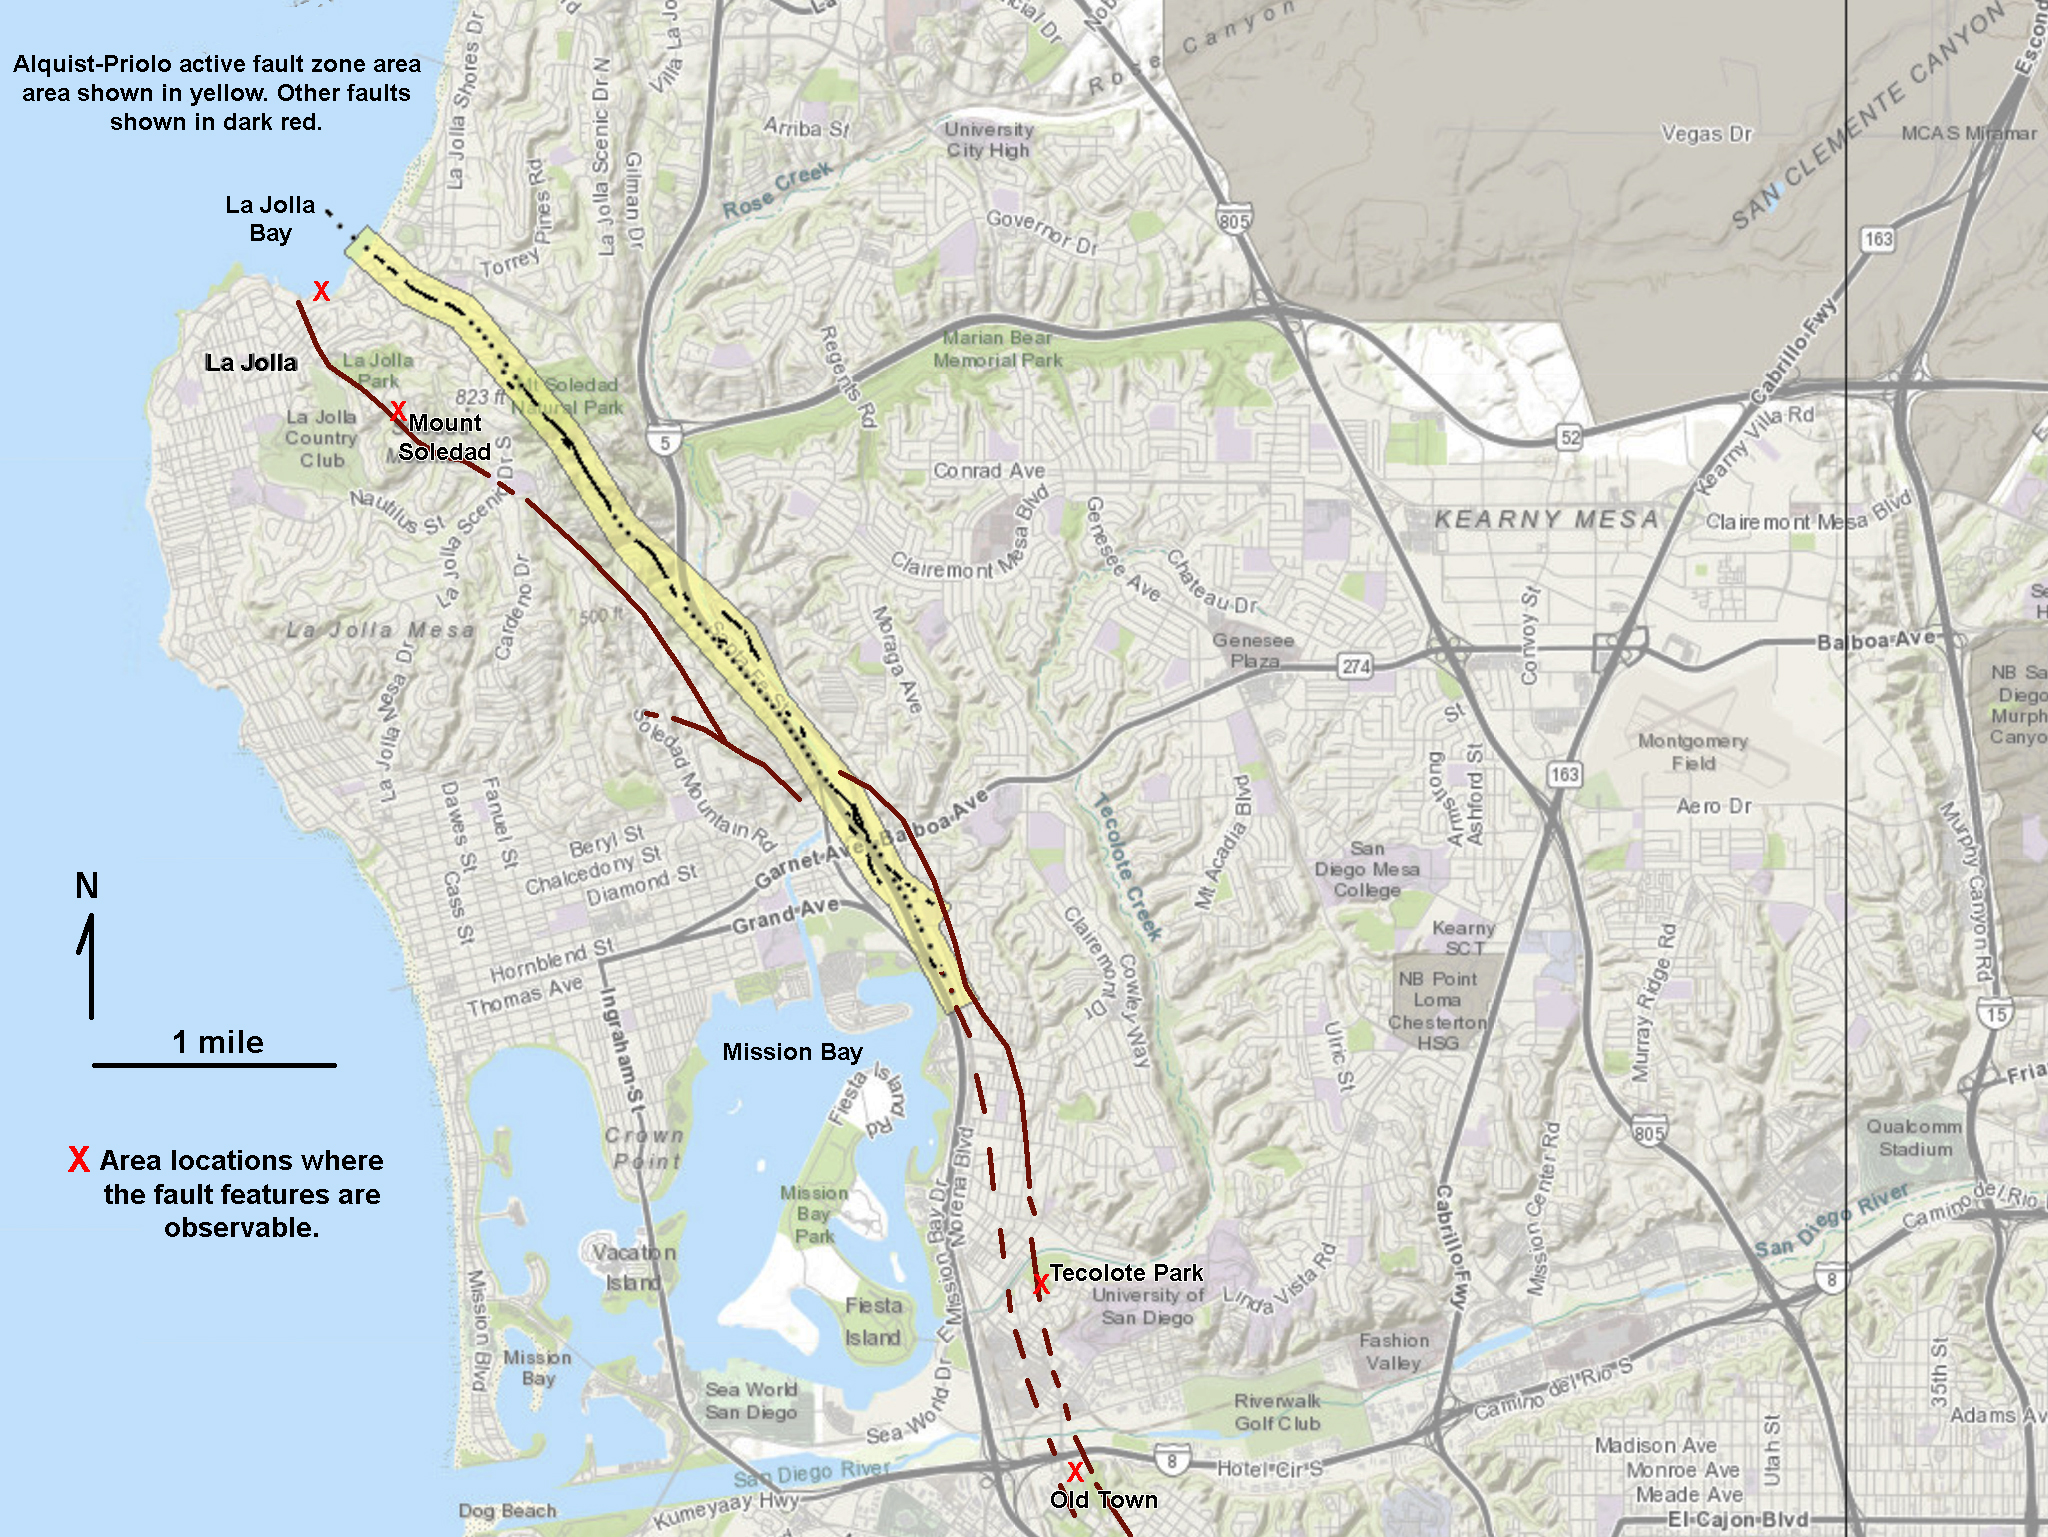
Fig. 81. Map showing the location of faults between La Jolla and Mission Bay. |
A15
Mount Soledad (La Jolla, CA)
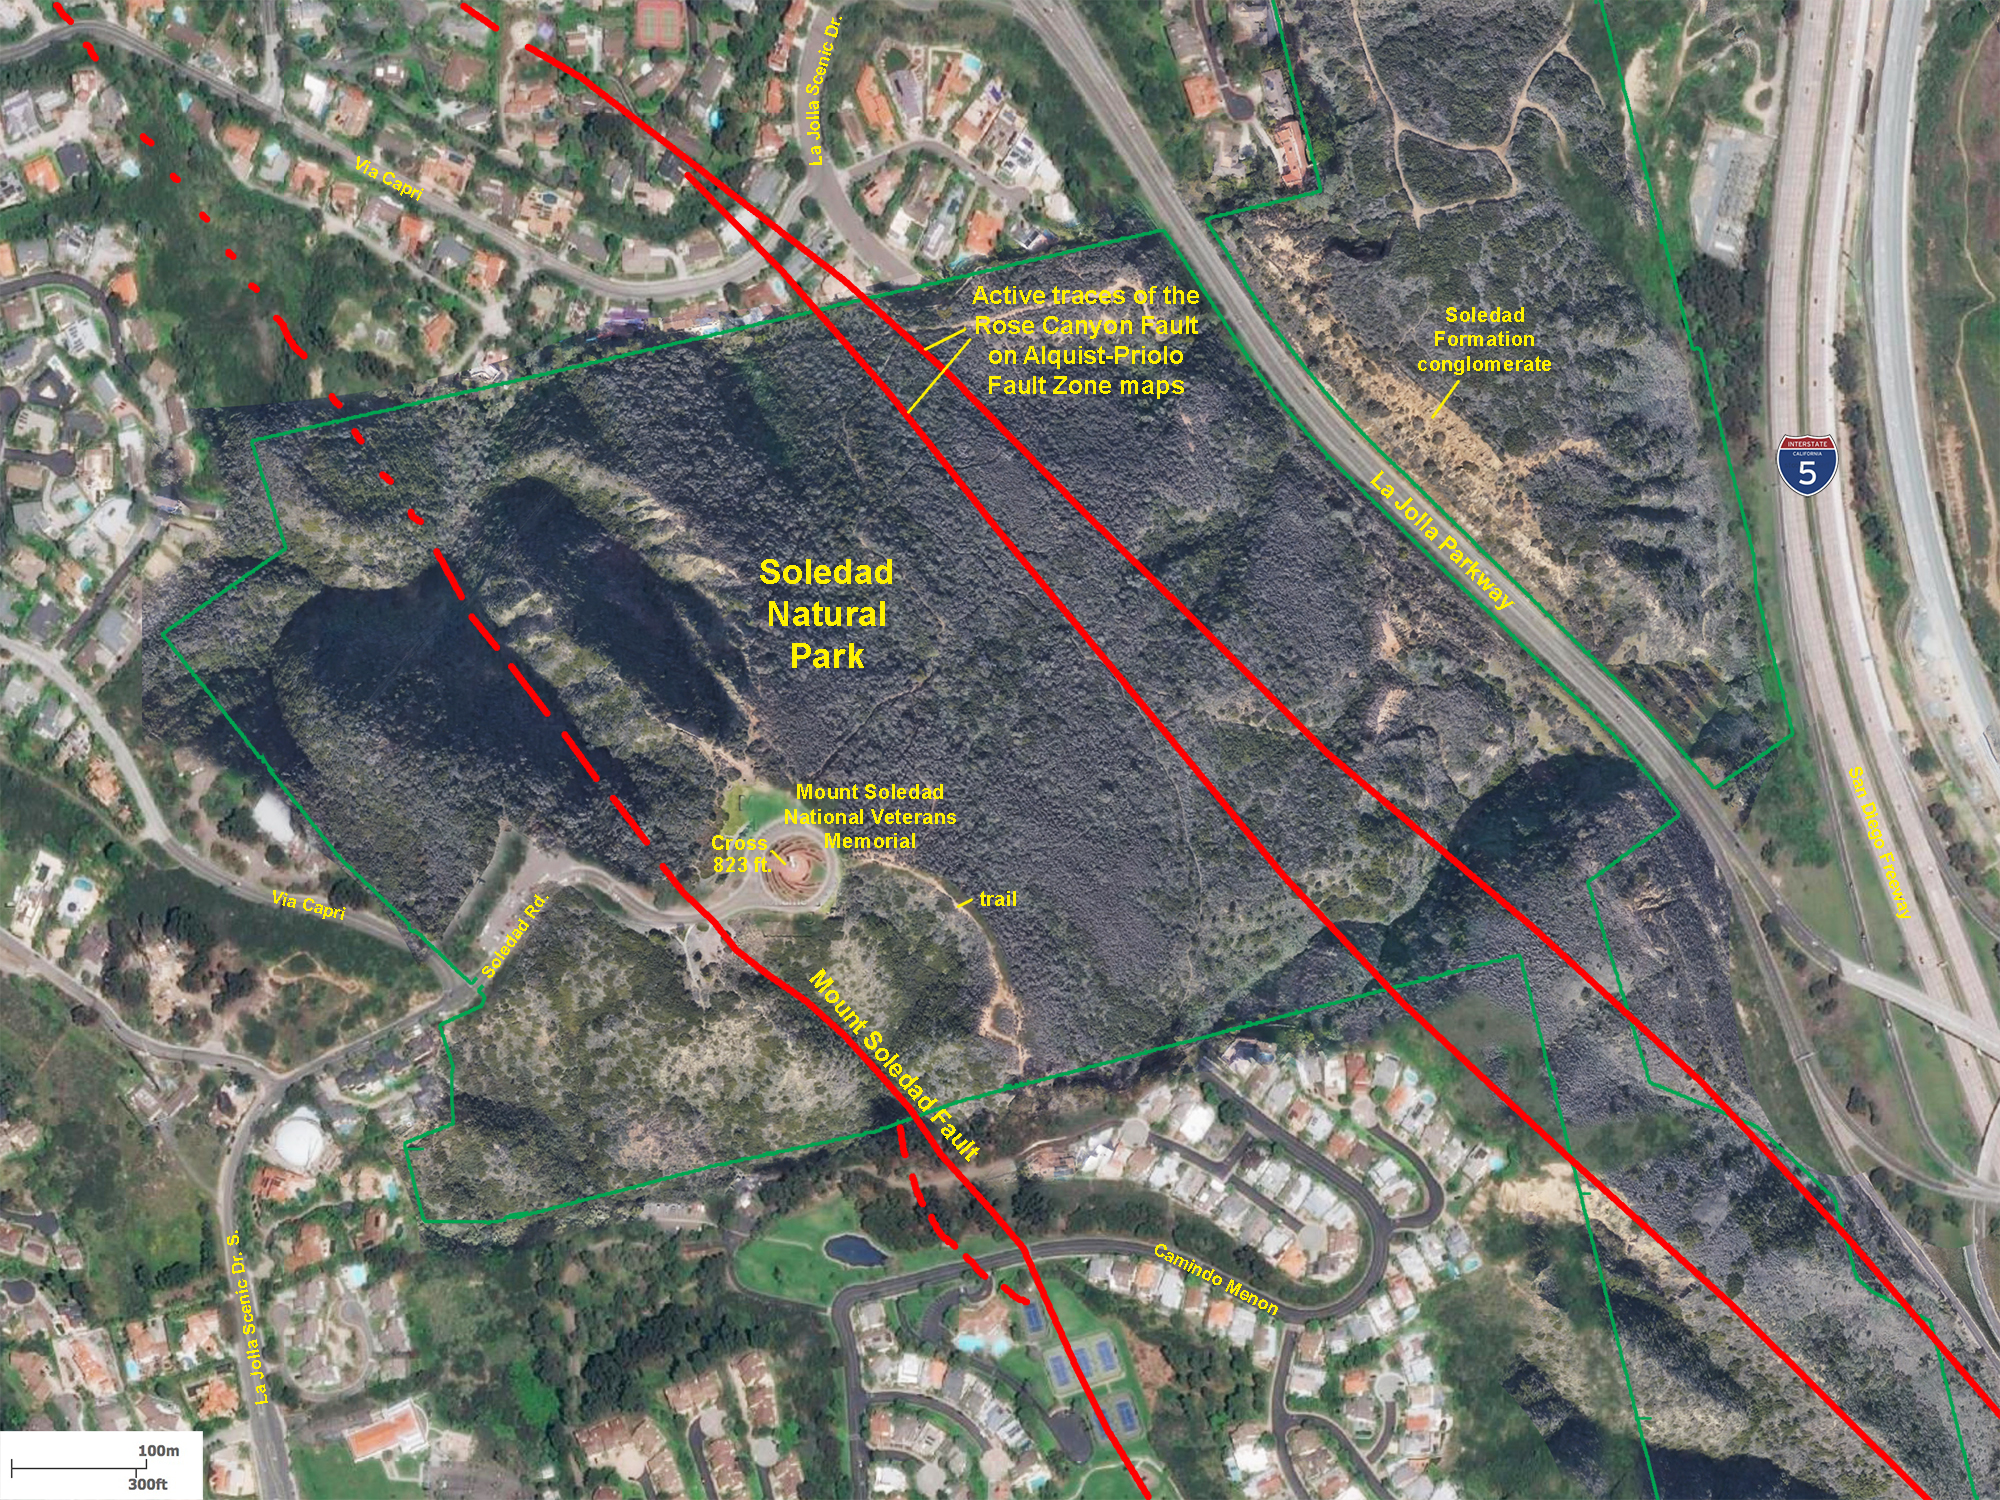
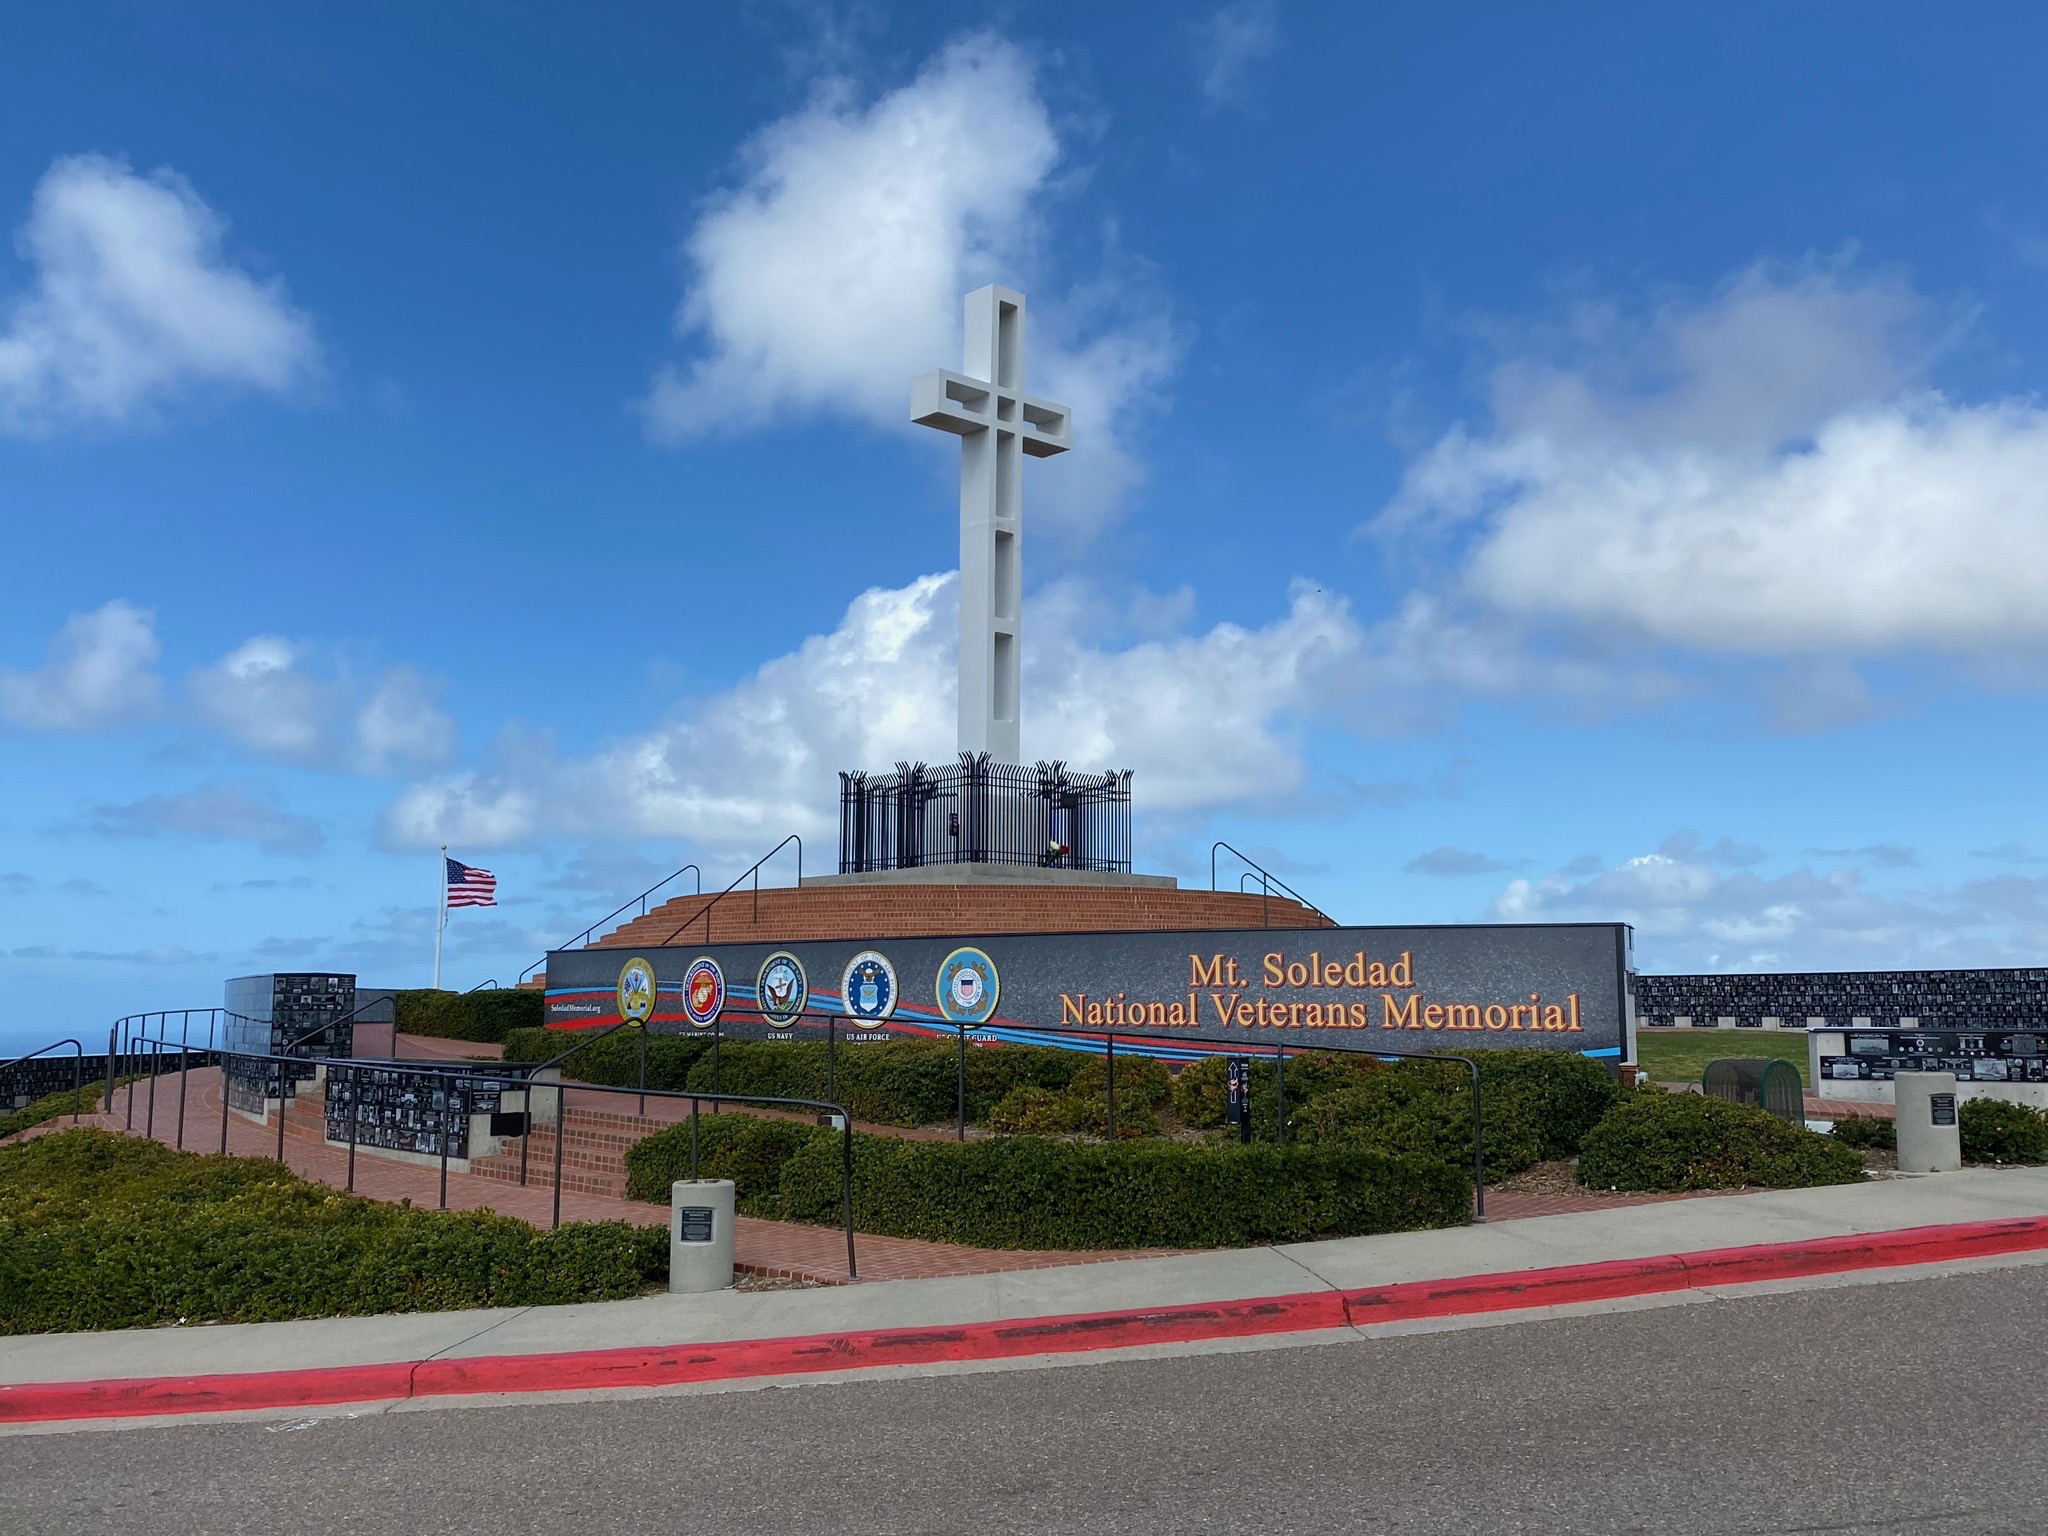
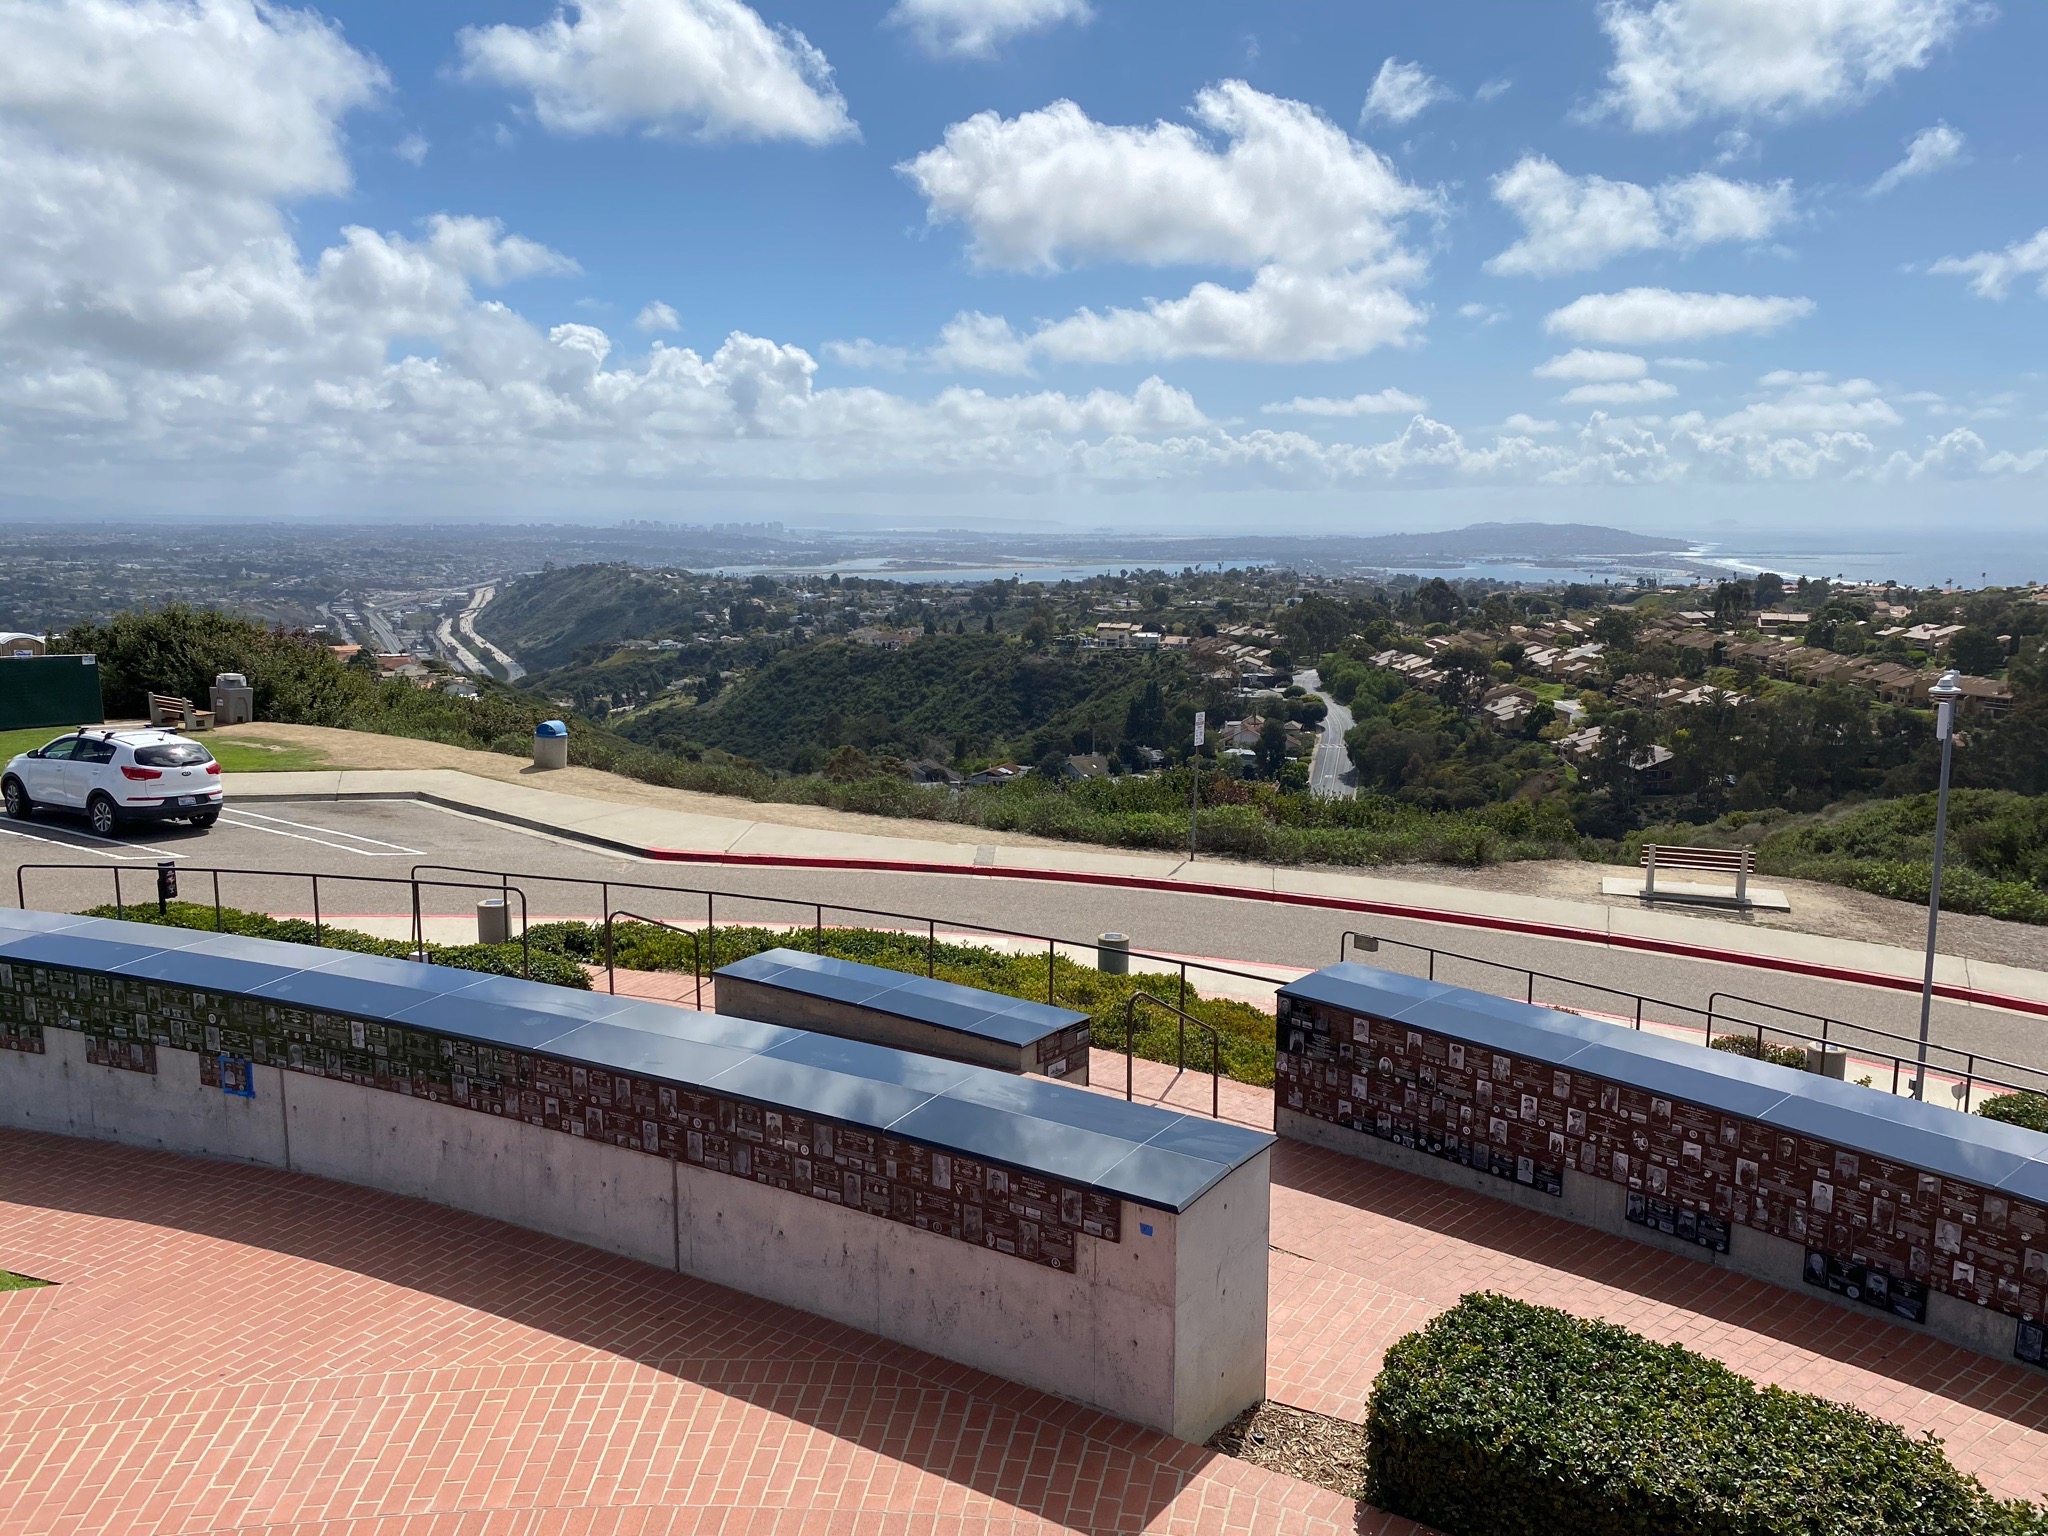
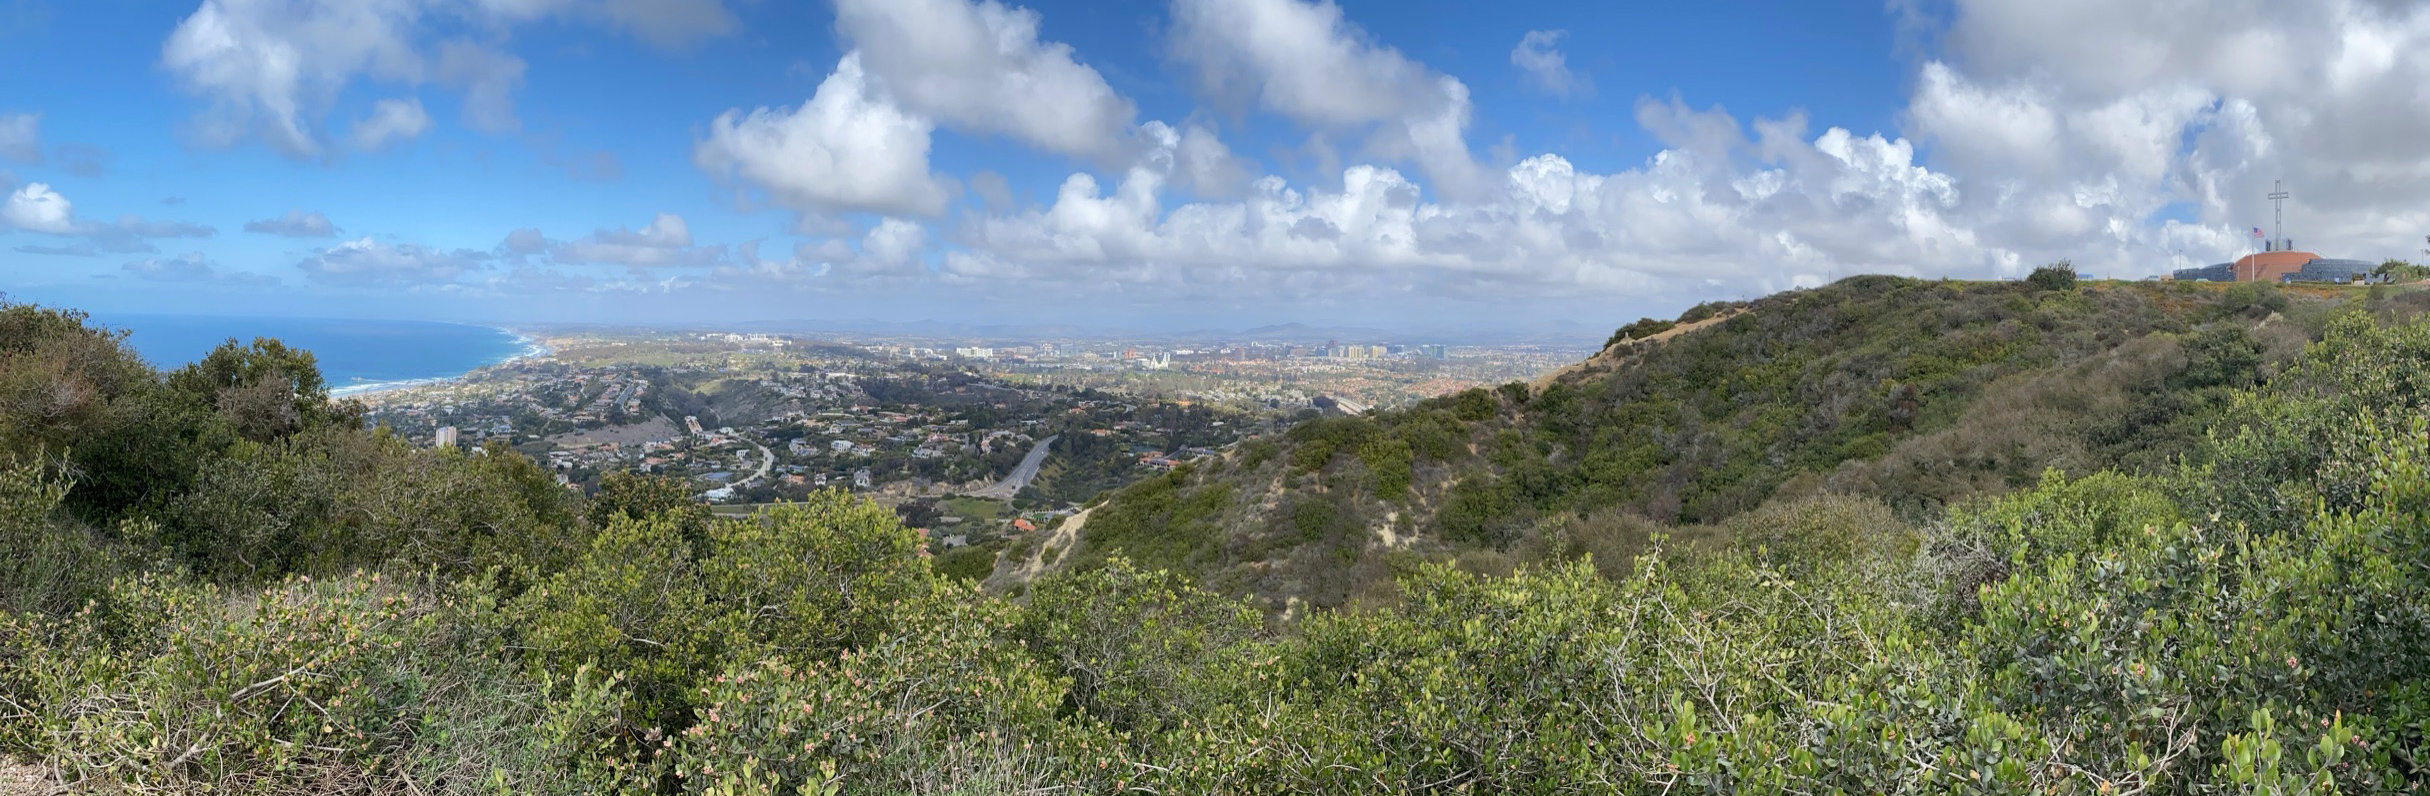
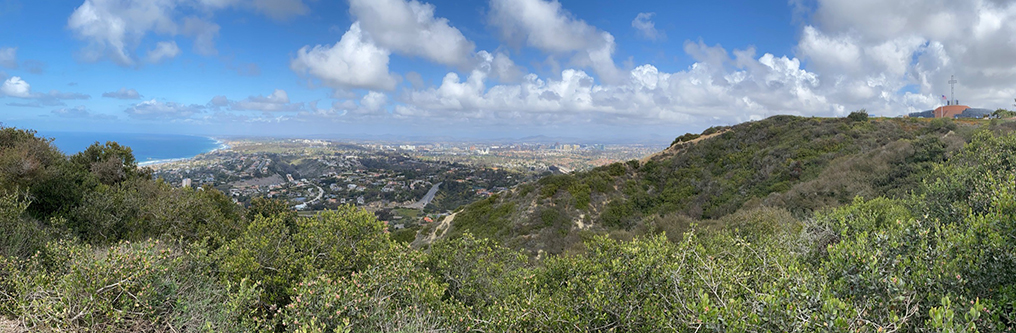
A visit to the top of Mount Soledad is an ideal place to get a view of the regional geology of the Rose Canyon Fault (Figure 82). Mount Soledad's high point 823 feet in elevation; 801 feet at the Easter Cross on top of the Mount Soledad National Veterans Memorial (Figure 83). The memorial is located at 6905 La Jolla Scenic Dr S, La Jolla, CA 92037.
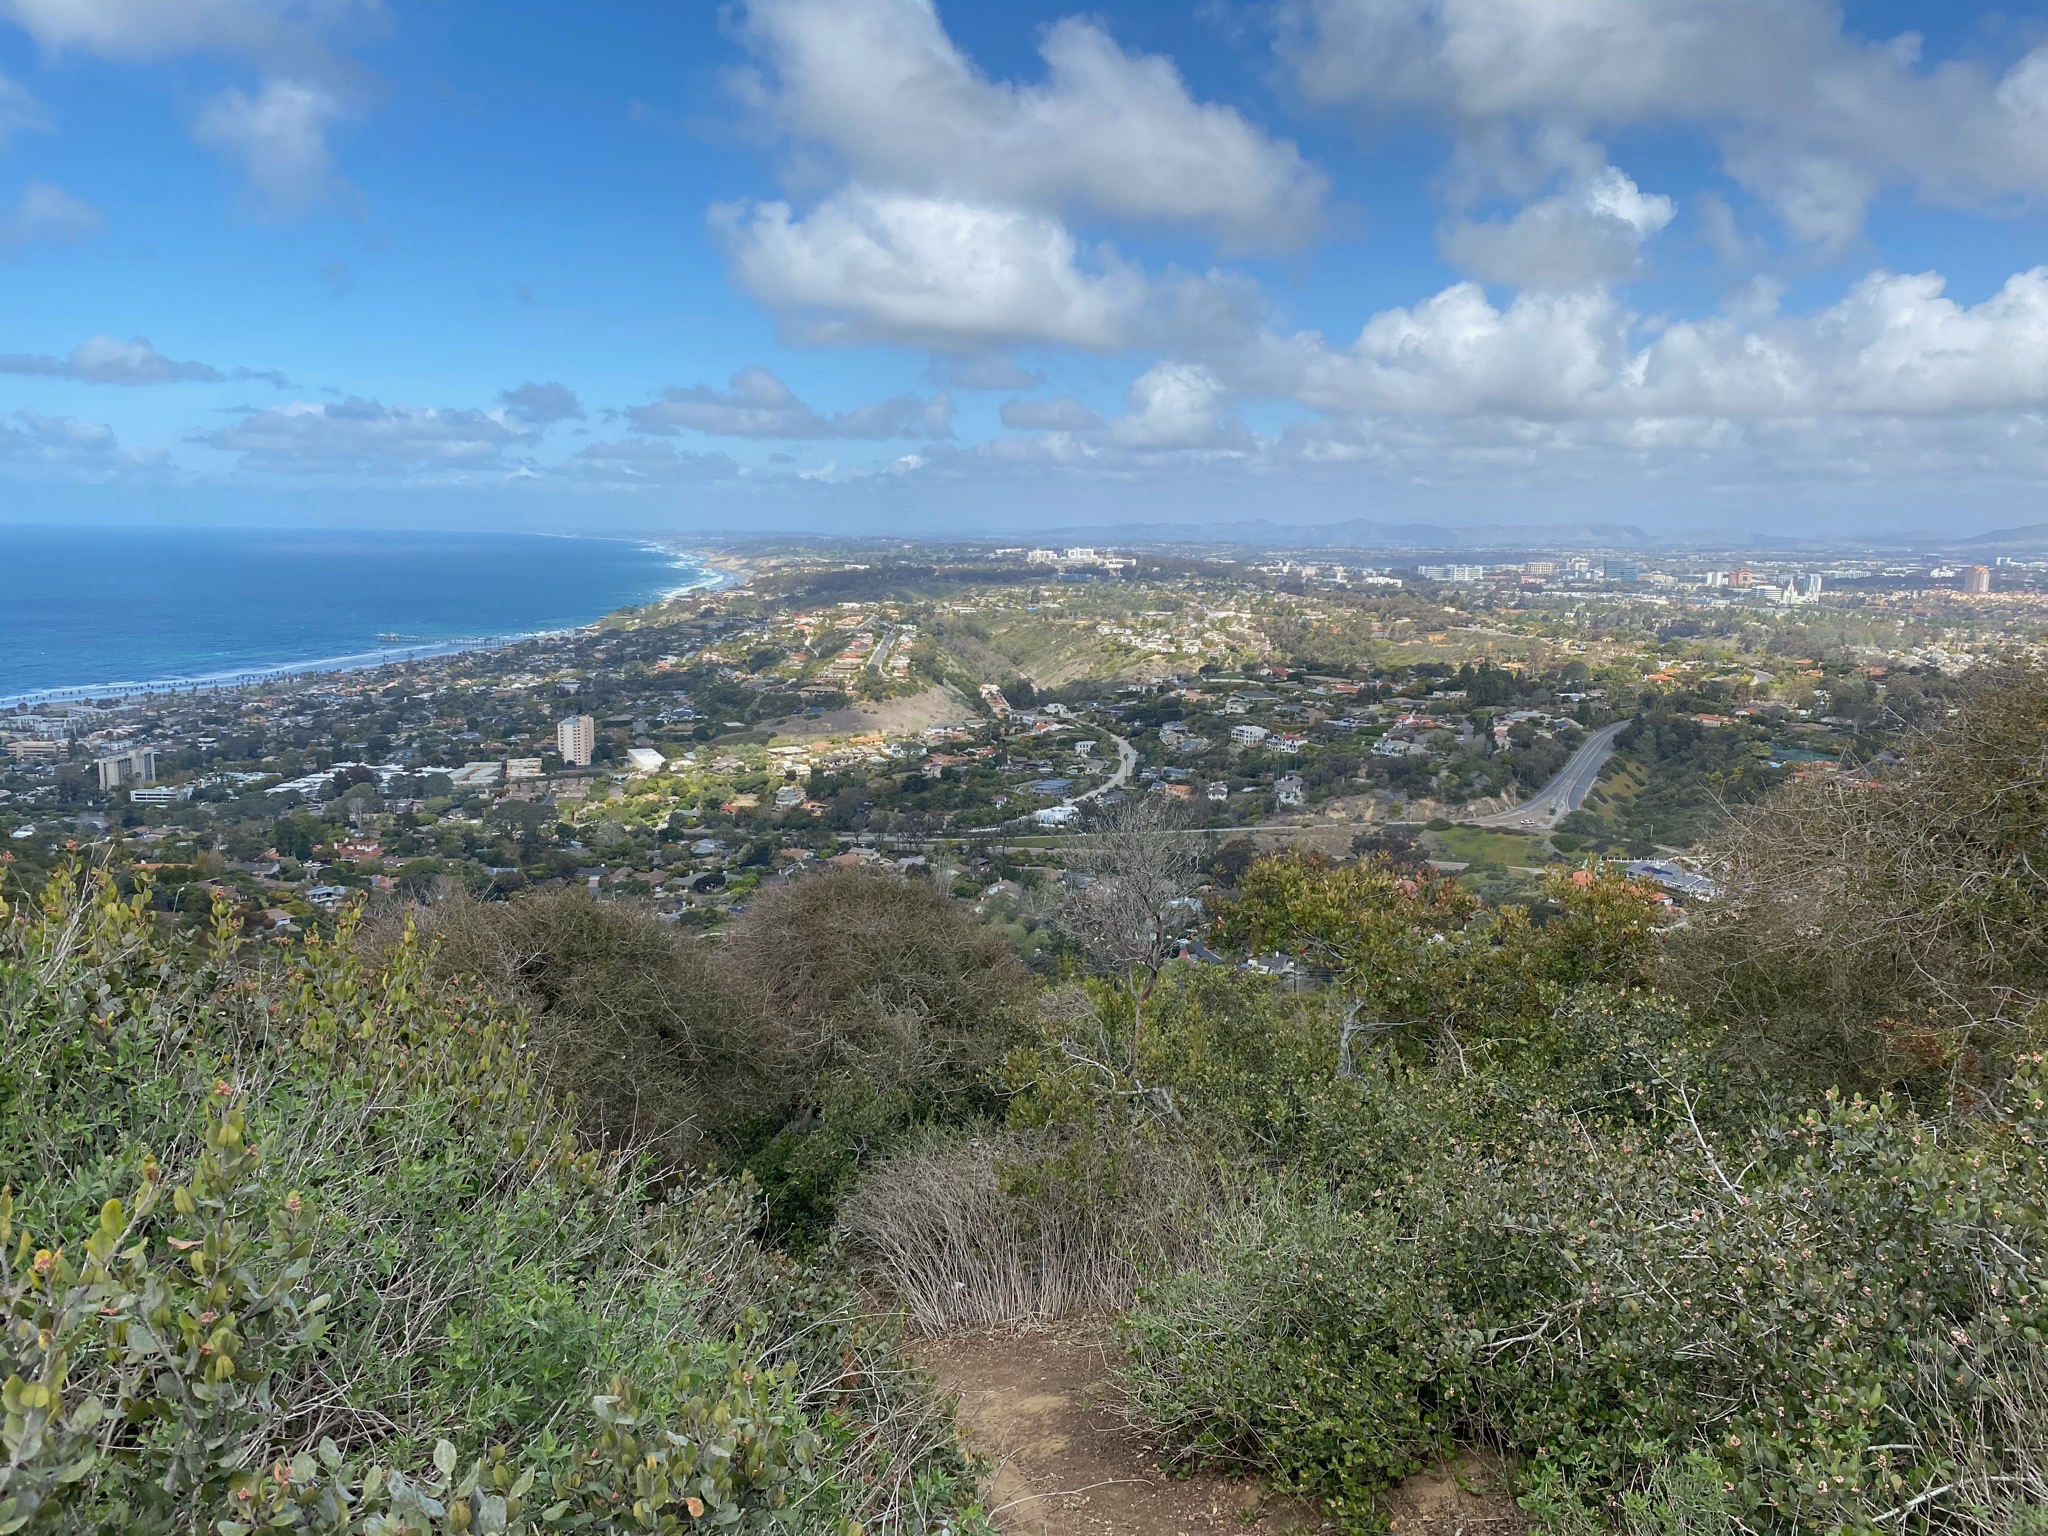
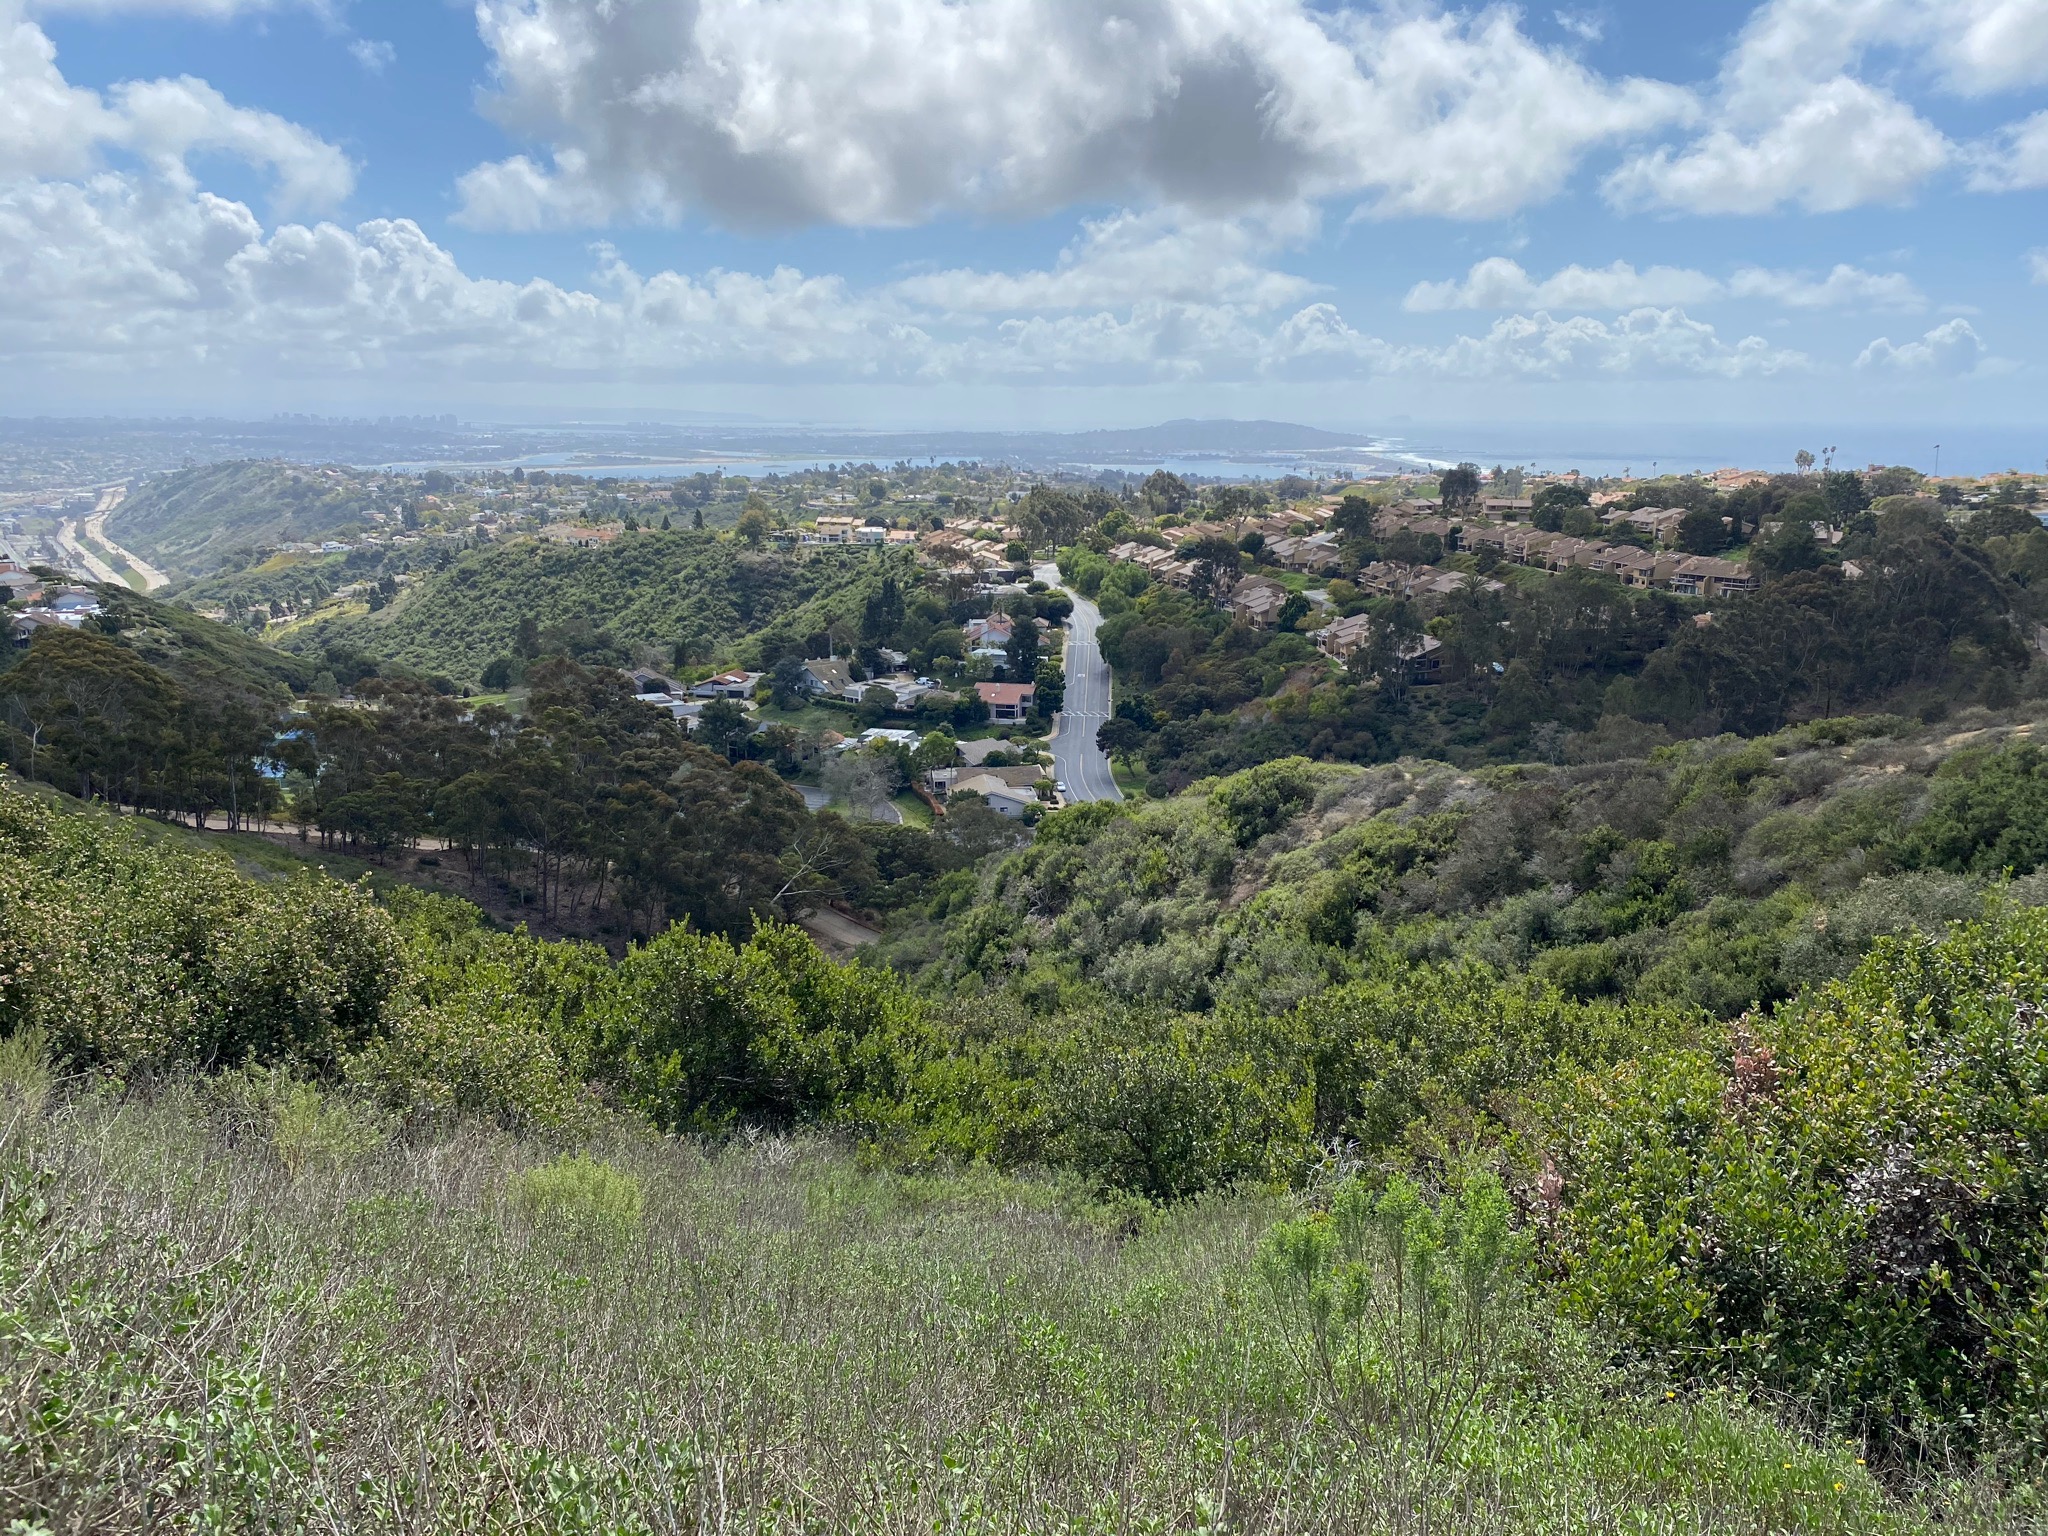
The summit of Mount Soledad is nearly 400 feet higher than the mesa surfaces to the north and east that are capped by early Late Pleistocene marine terrace deposits (the Lindavista Formation, see a description on the Torrey Pines website). Many of the landforms associated with the fault zone are visible from the summit area (Figures 84 to 100). Features include pressure ridges, linear valleys and ridges, and offset drainage channels. Some have been modified by human activity. |

Fig. 82. Map of faults in the Mount Soledad Area. |
Mount Soledad itself owes its origin to uplift along the Rose Canyon Fault. Mount Soledad is interpreted as a massive pressure ridge where the Rose Canyon Fault make a bend to the left (when looking northward). This gentle bend in the fault plane at depth has caused compressional uplift of the crustal block on the west side of the fault as it has moved northward. Likewise, tectonic down-warping has resulted in the basin flooded by Mission Bay. The linear valley of the Rose Canyon Fault Zone from Mount Soledad south to Mission Bay suggests that the Mount Soledad strand of the fault is most active (Lindvall and Rockwell, 1995).
The Mount Soledad Formation is exposed on the flanks of the mountain. The formation is lowermost part of La Jolla Group (Kennedy and Moore, 1971). . The formation consists predominantly of cobble conglomerate which is interbedded with medium-grained sandstone in the upper part. Is 70 meters thick at type section. The Mount Soledad Formation unconformably overlies the Cabrillo Formation, and conformably underlies Ardath Shale of La Jolla Group. Age is considered early and middle Eocene (roughly 45 million years) based on stratigraphic relationship with Ardath Shale (Kennedy and Moore, 1971, Frederiksen, 1991; see a description of the Ardath Shale on the Torrey Pines website).
|

Fig. 83. The Mount Soledad National Veterans Memorial on the peak's summit.
|
Fig. 84. Landslide scarp in the Mount Soledad Fault Zone on west side of the summit. |
Fig. 85. View of La Jolla Bay from where the Mount Soledad Fault crosses the park road. |
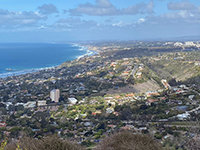
Fig. 86. Zoom view looking north along the Torrey Pines coast and beyond. |

Fig. 87. View to north showing the Torrey Pines Mesa, and upwarp relative to the mesas region to the east.
|
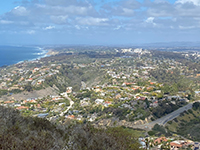
Fig. 88. Zoom view looking northward shows the Torrey Pines (mesa) upwarp with UC San Diego buildings. |

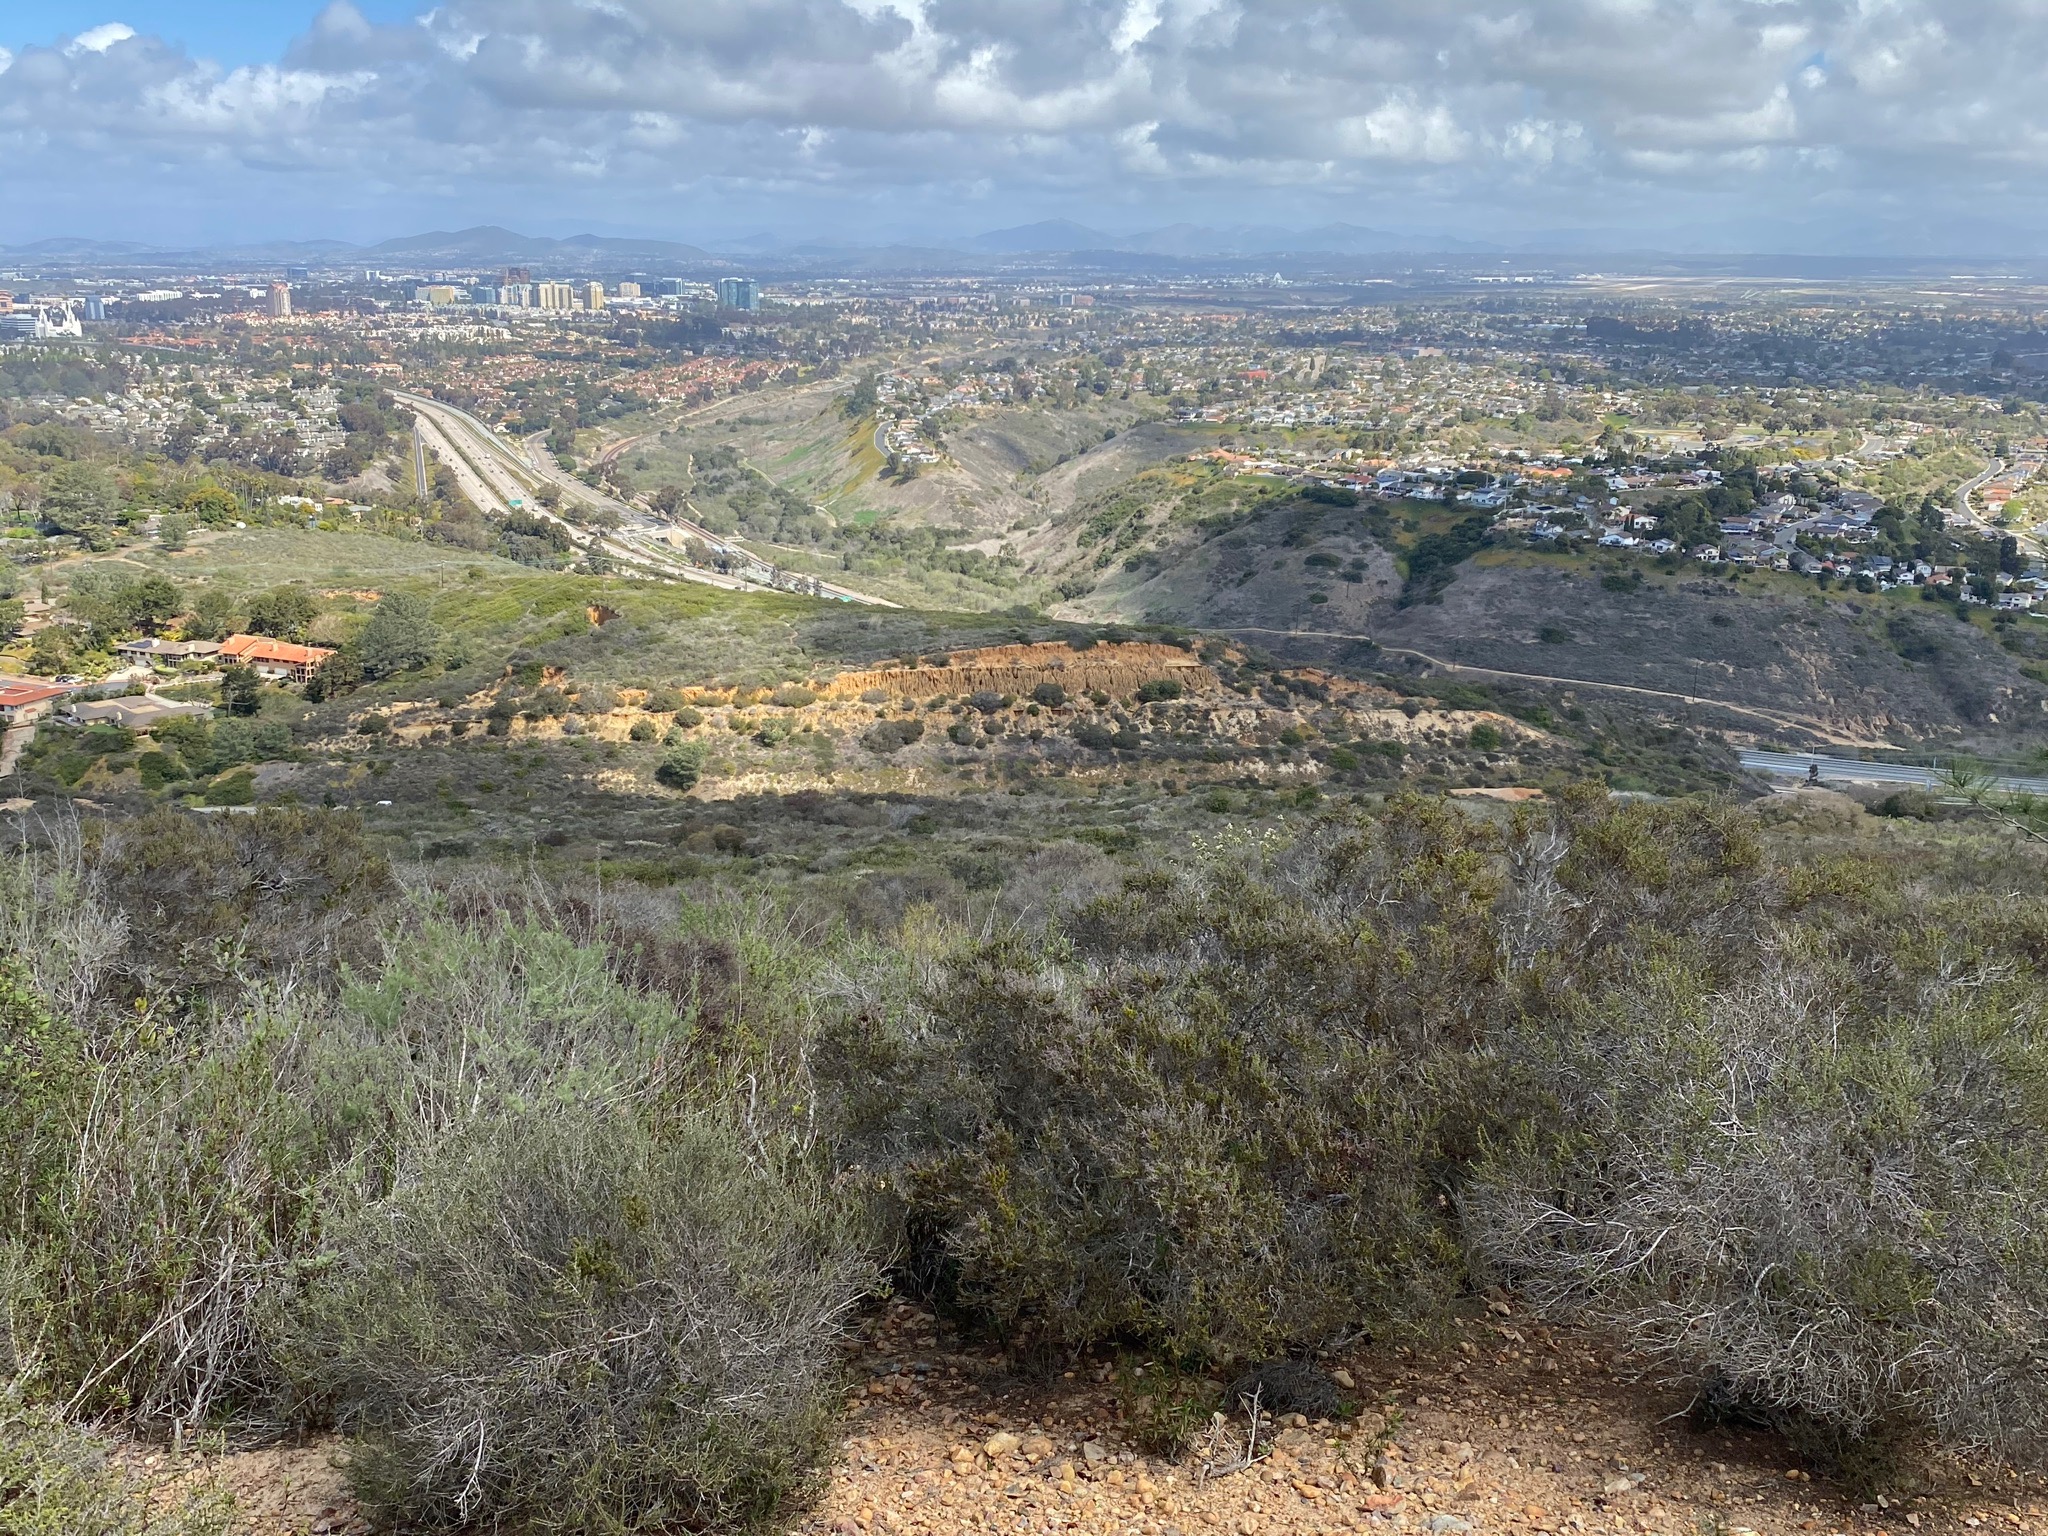
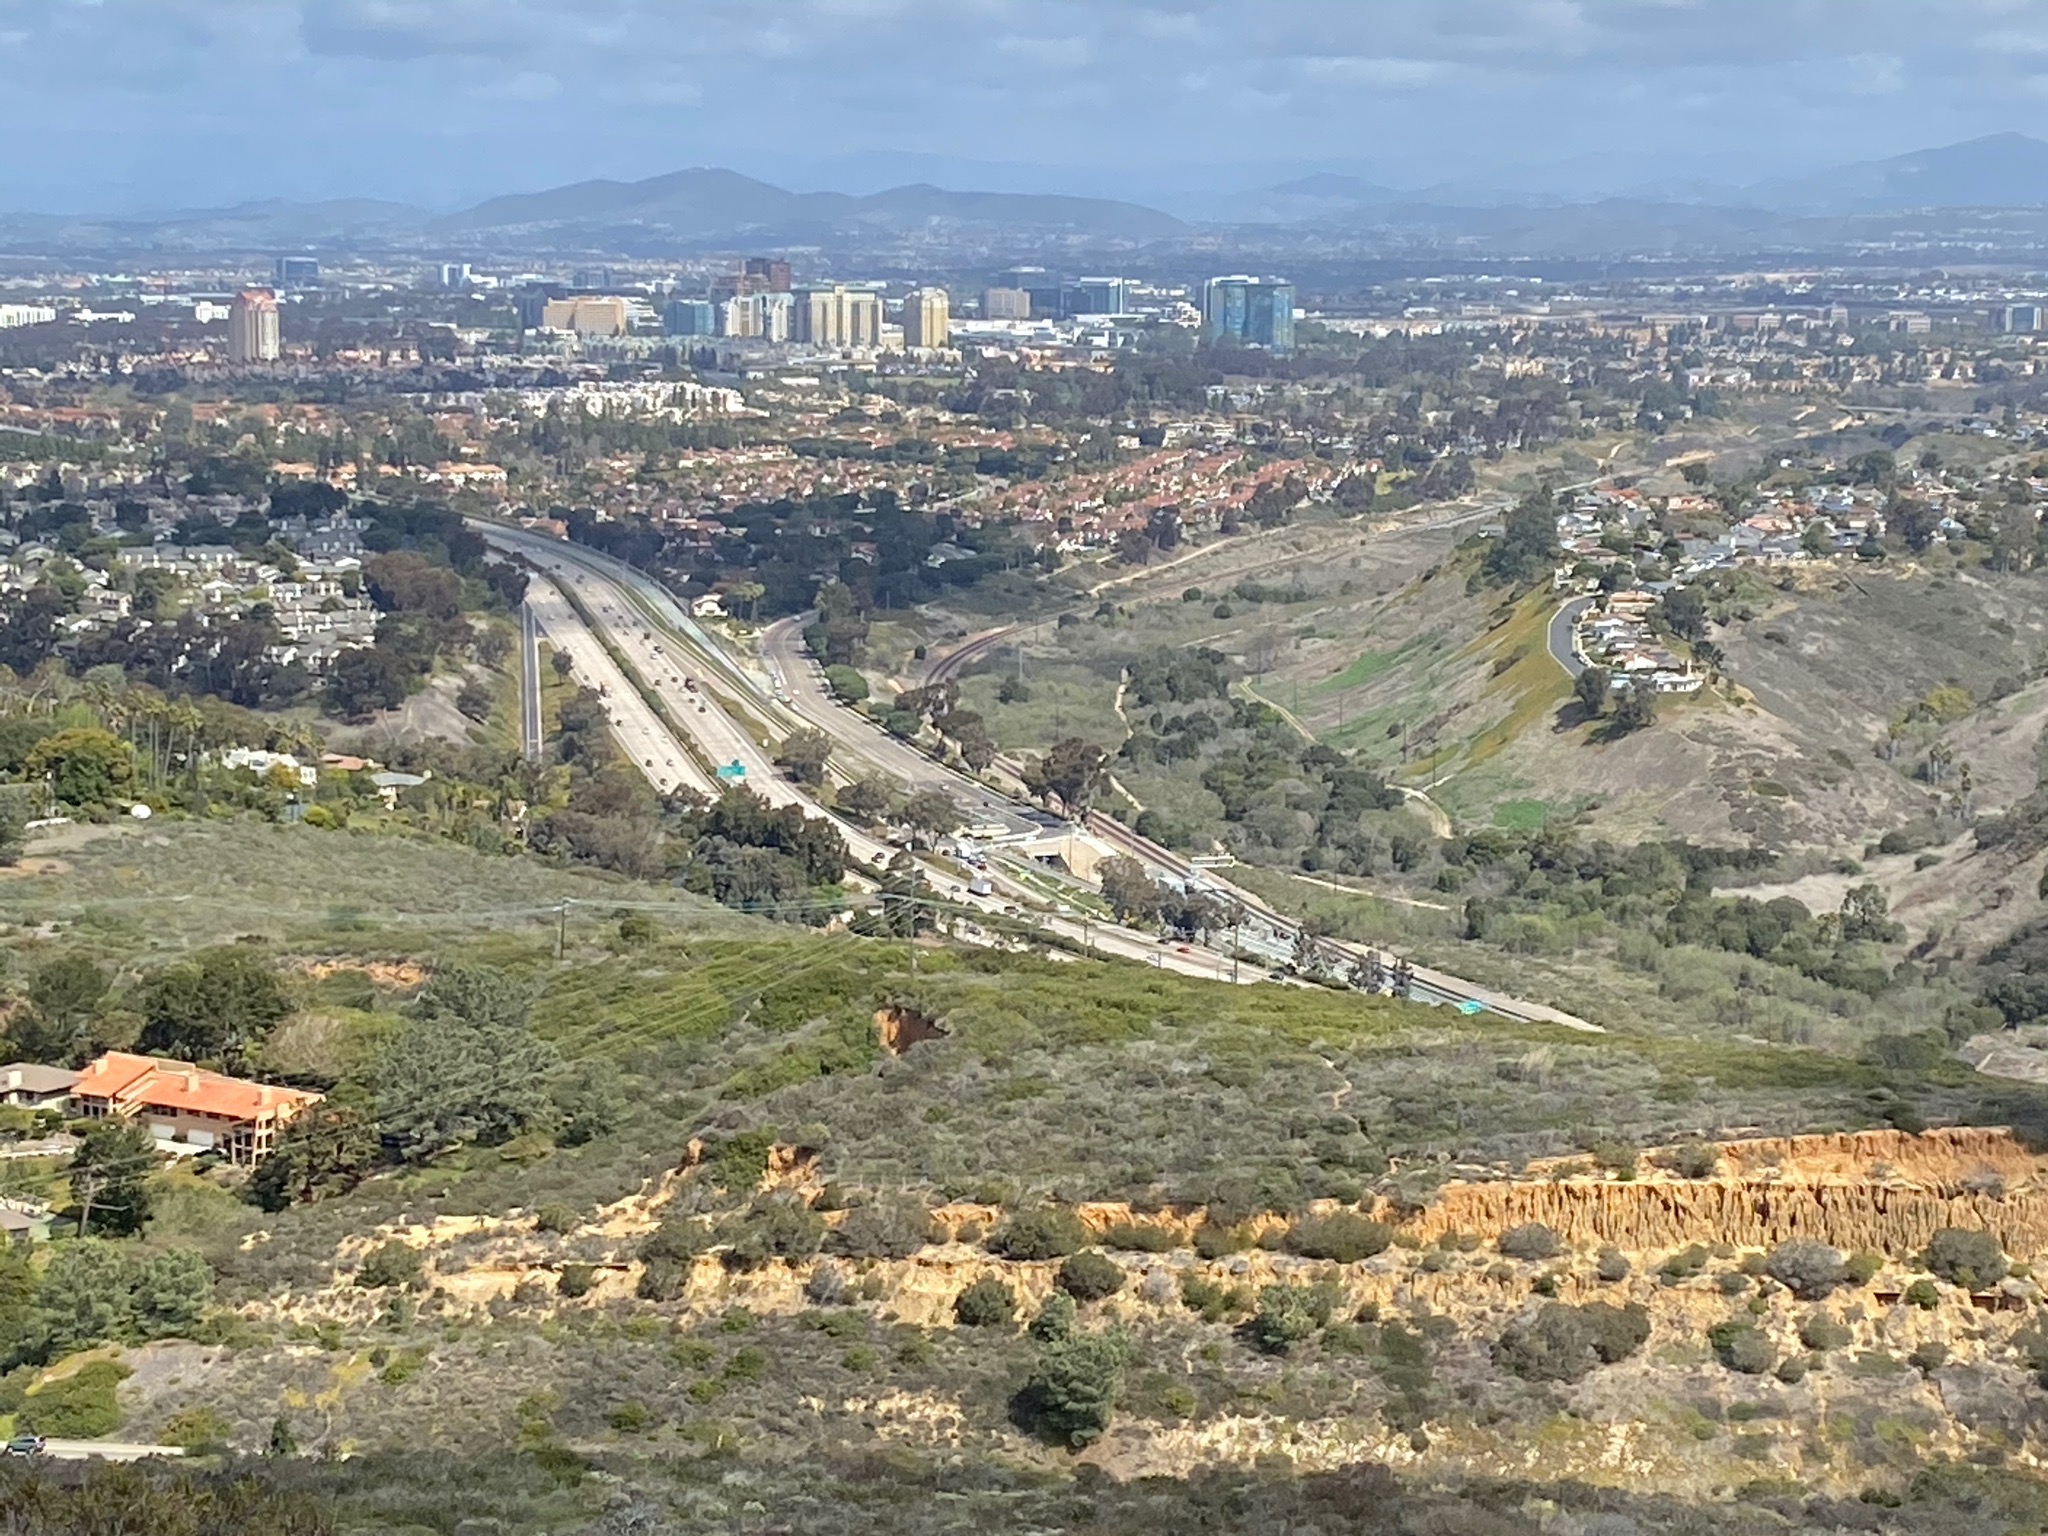
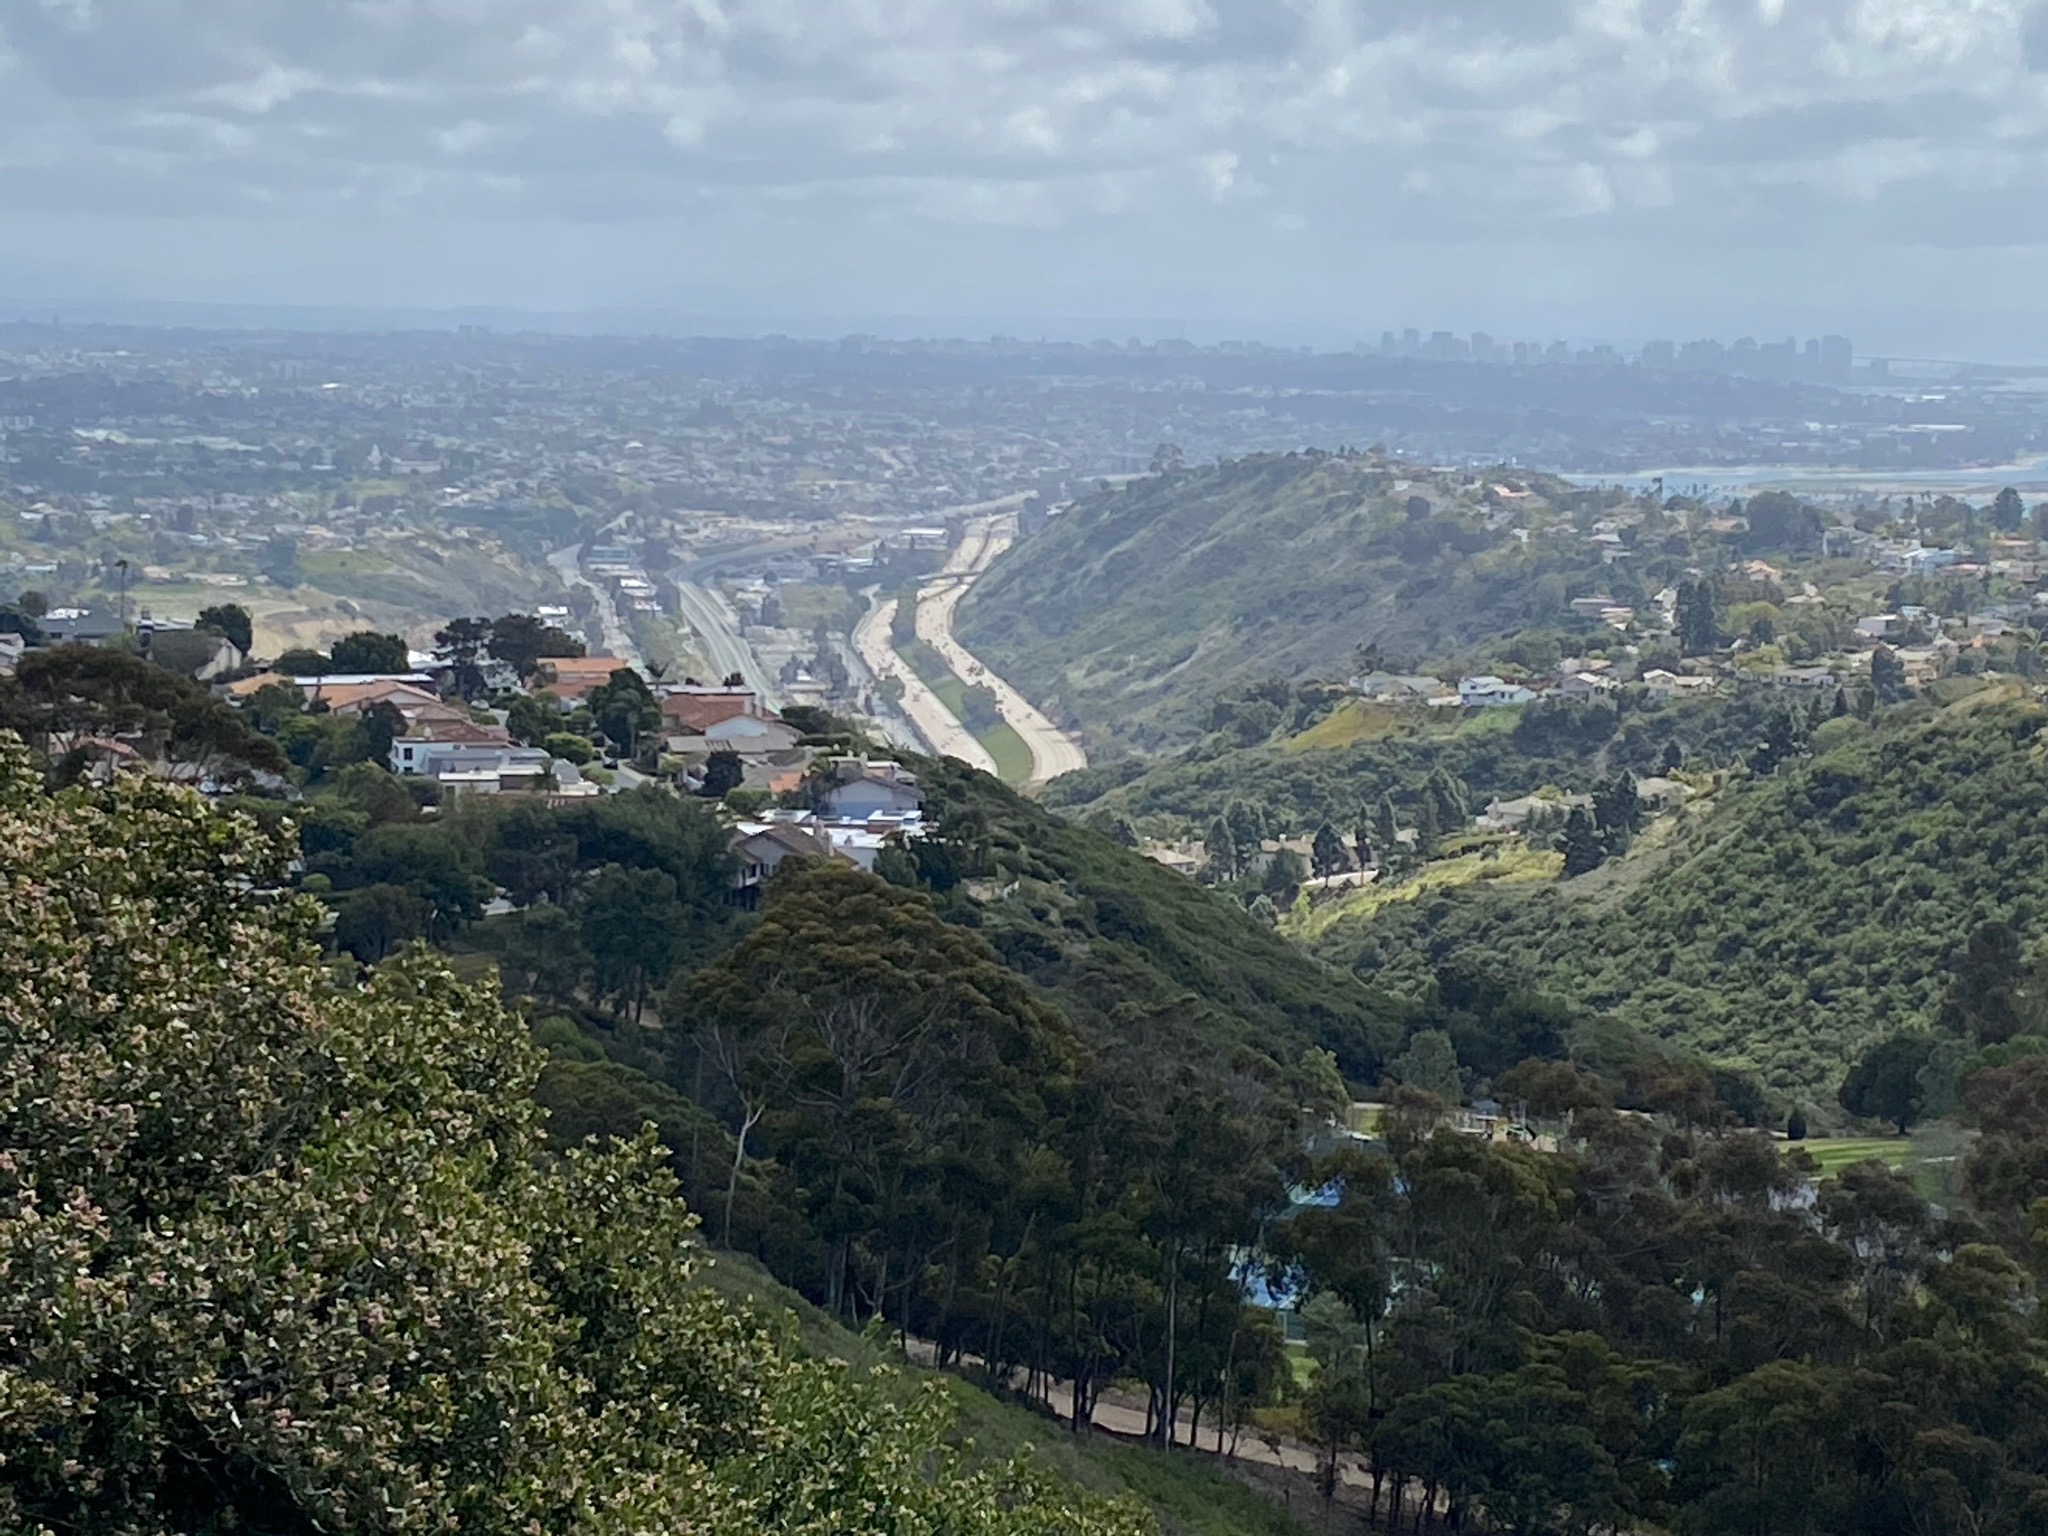
Fig. 89. View of I-5 entering Rose Canyon on the northeast side of Mount Soledad where it enters Rose Canyon.
|
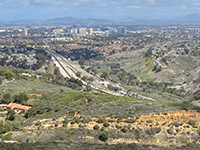
Fig. 90. Zoom view of I-5 entering Rose Canyon with La Jolla Parkway cut in Mount Soledad Fm. in foreground. |
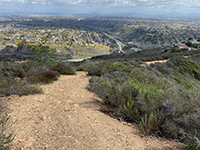
Fig. 91. View along trail on southeast side of the Memorial with Rose Canyon in distance.
|
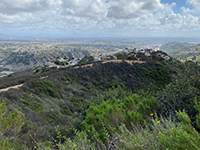
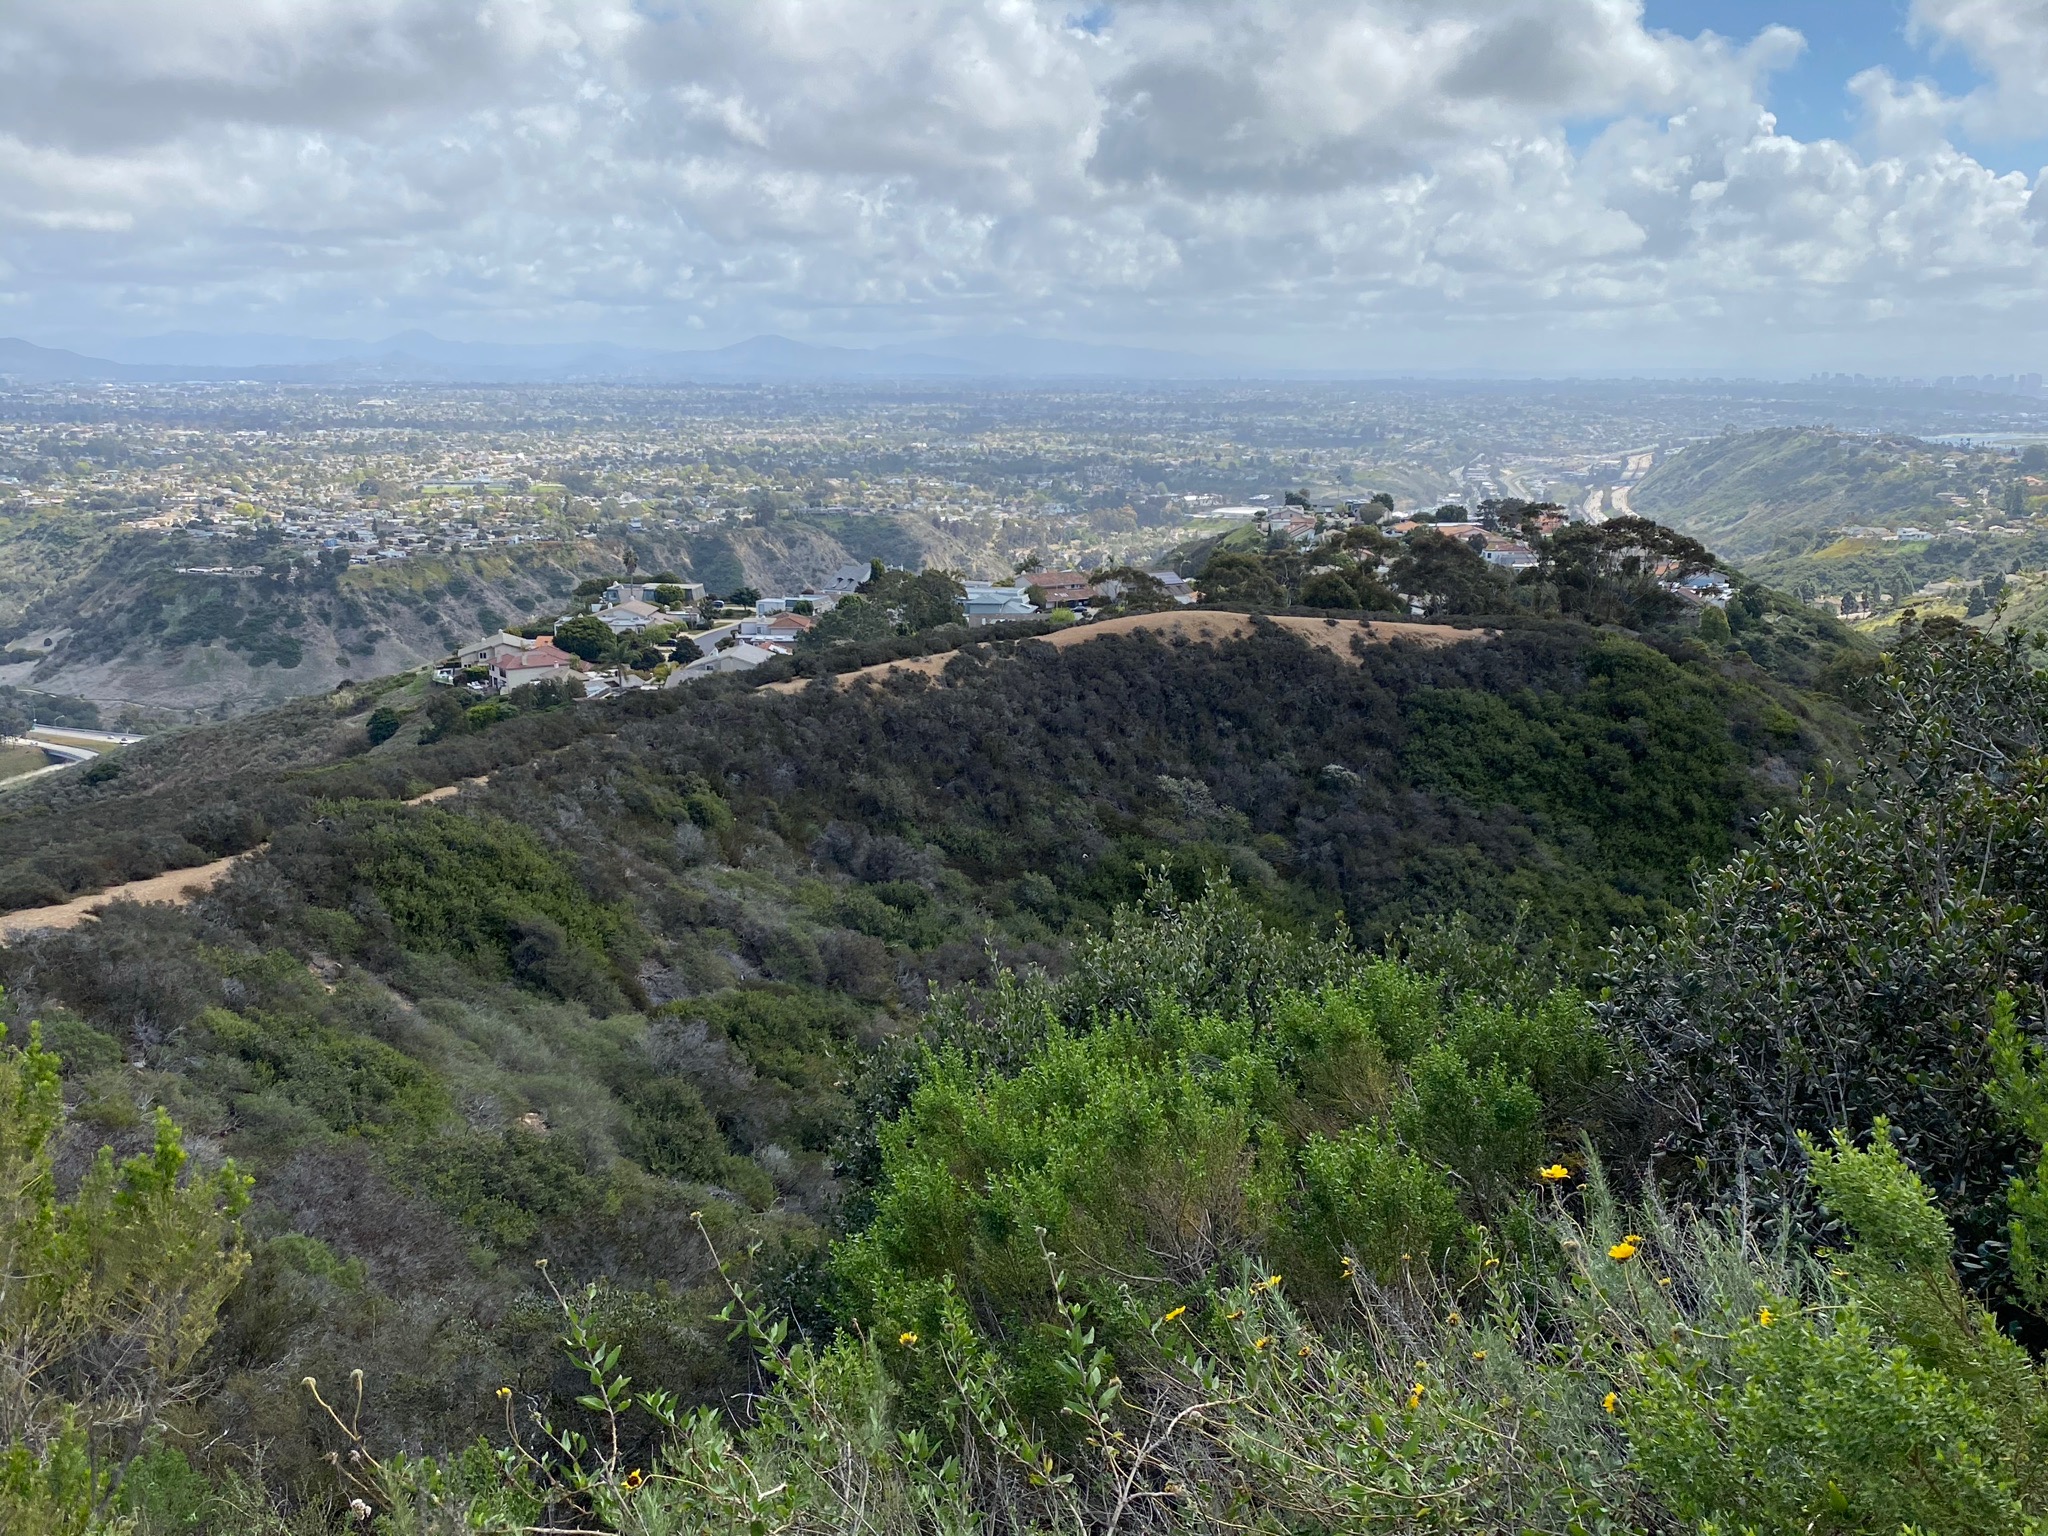
Fig. 92. A fault-bounded ridgeline on the south side of Mount Soledad. |

Fig. 93. Outcrop of Ardath Shale at the top of the trail on east side of the Memorial. |
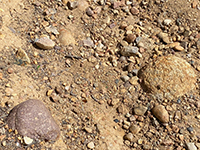
Fig. 94. Poway clasts in the Mount Soledad Fm. exposed in the trail near the summit. |
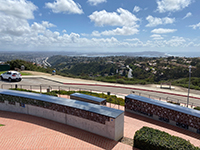
Fig. 95. View looking south toward Mission Bay from the National Veterans Memorial. |

Fig. 96. Zoom view looking down Mount Soledad Fault where it enters Rose Canyon. |

Fig. 97. Canyon associated with the Mount Soledad Fault on south side of summit. |
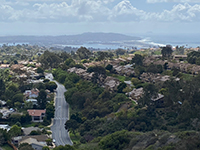
Fig. 98. Zoom view across Mouth Soledad, Mission Bay, and Point Loma highlands. |
|
| Fig. 99. Panoramic view looking north across the canyon where the Mount Soledad fault line ascends the north flank of the mountain and crosses the Mount Soledad National Veterans Memorial access road. The Mount Soledad National Veterans Memorial is at the summit on the right. |
| Fig. 100. Panoramic view looking south along a ravine along the Mount Soledad Fault toward Interstate 5 running along lower Rose Canyon . From there the fault goes along the east side of the interstate and Mission Bay into the Old Town area. The pathway on the right goes around the memorial at the summit of Mount Soledad. The upwarp of Point Loma Peninsula is near the center of the image in the distance. |
A16
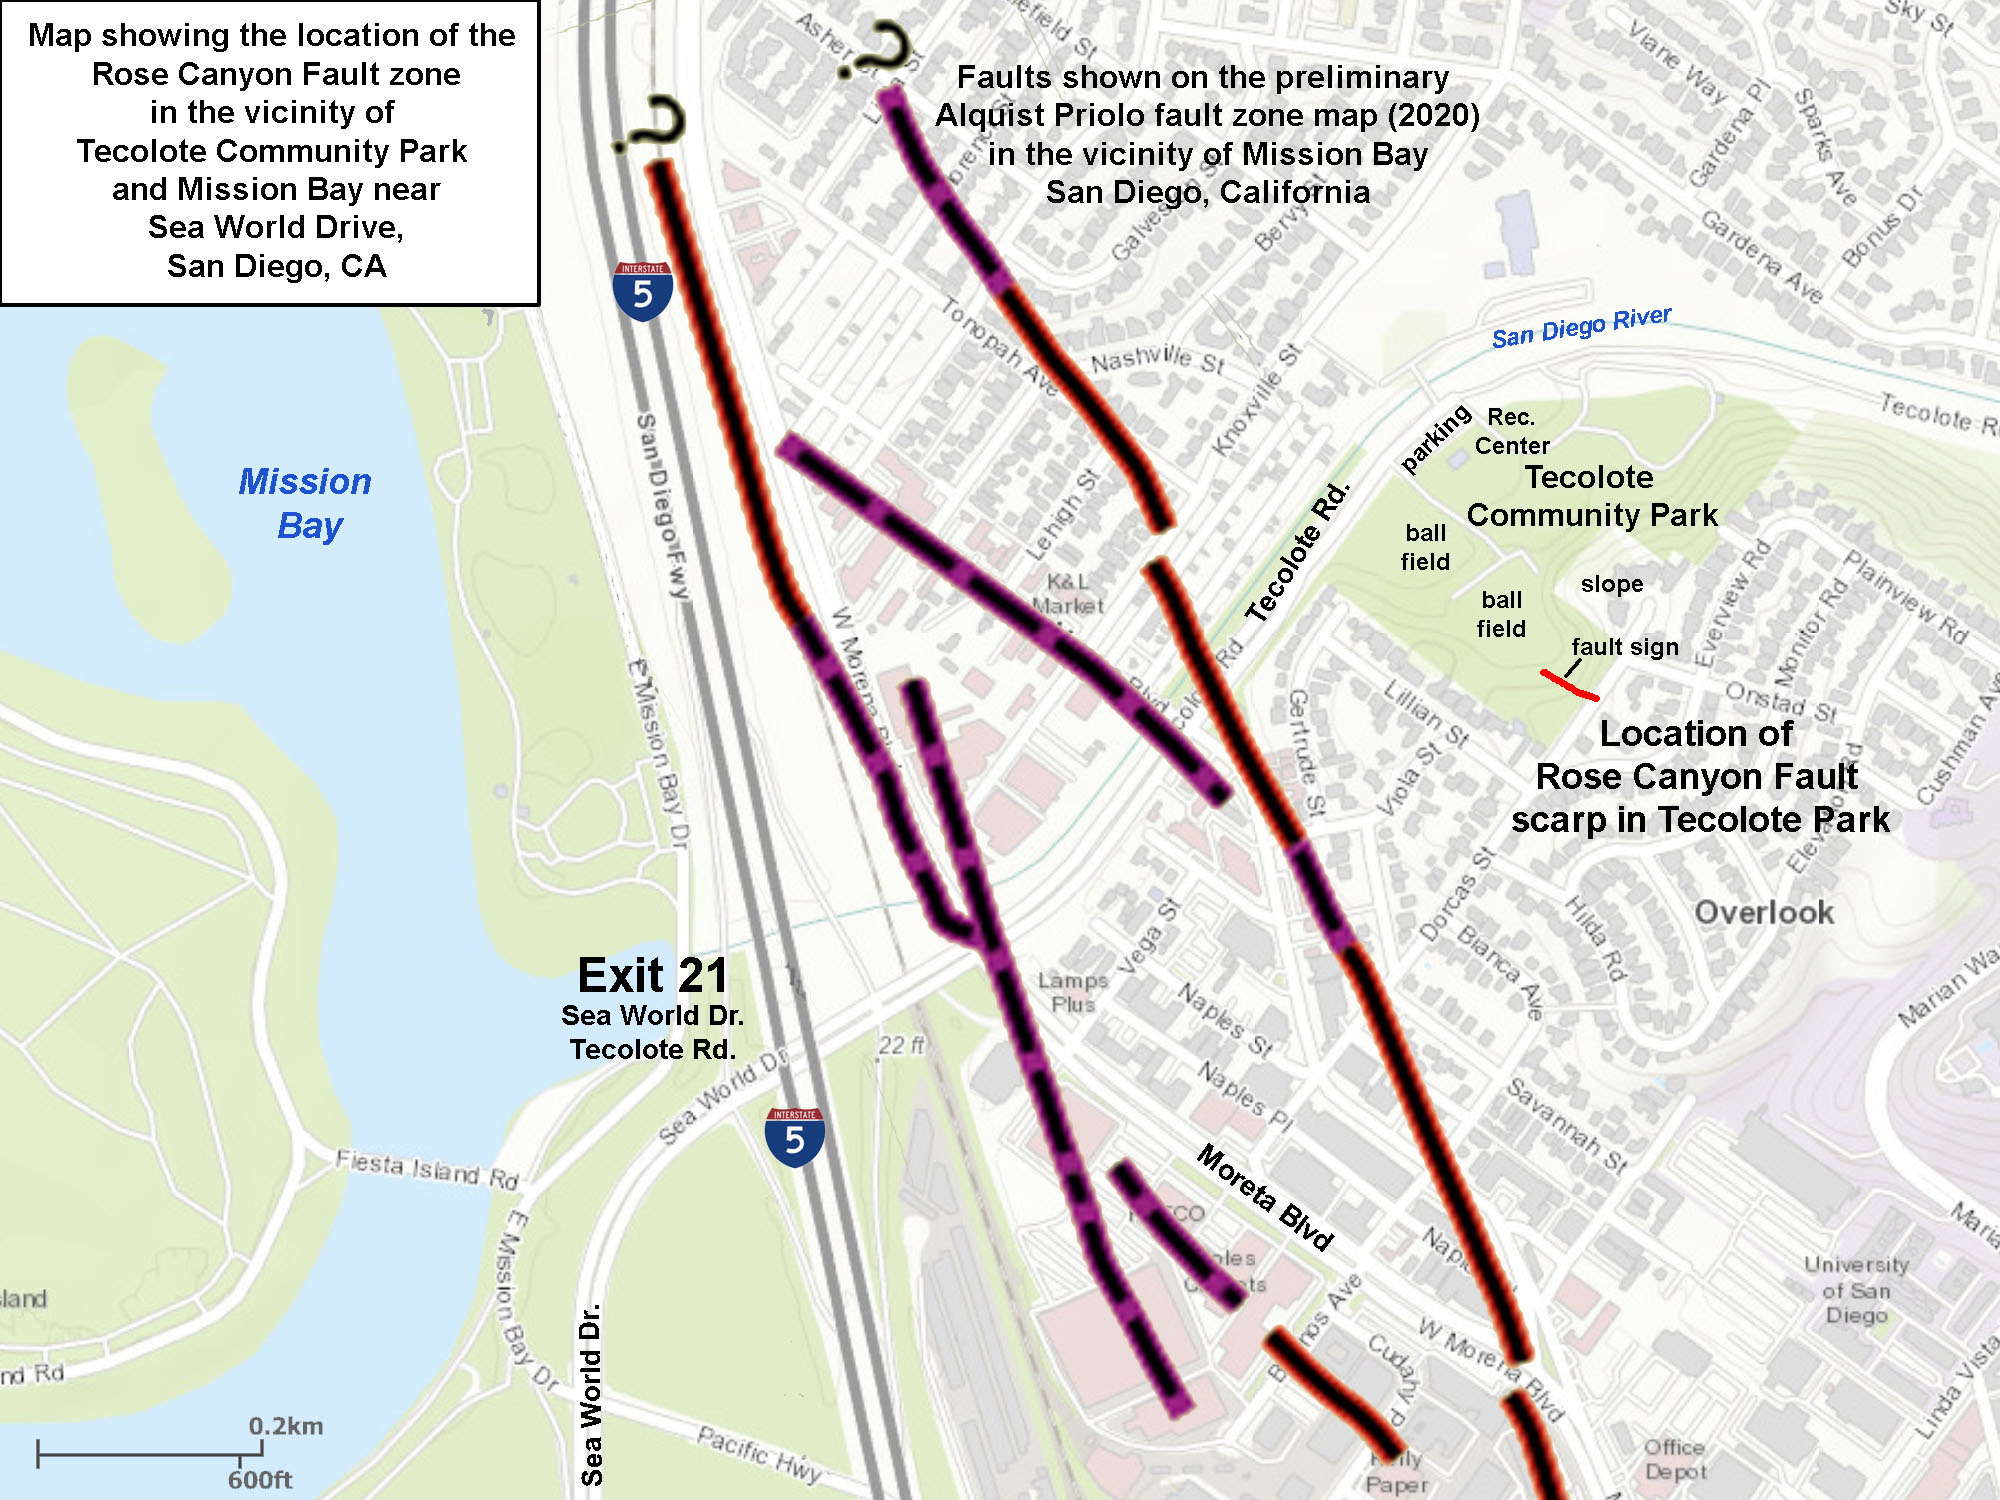
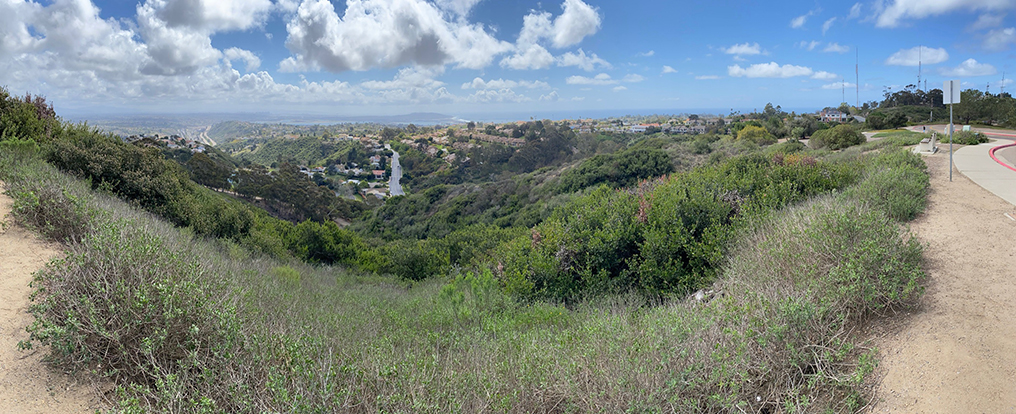
Rose Canyon Fault at Tecolote Community Park
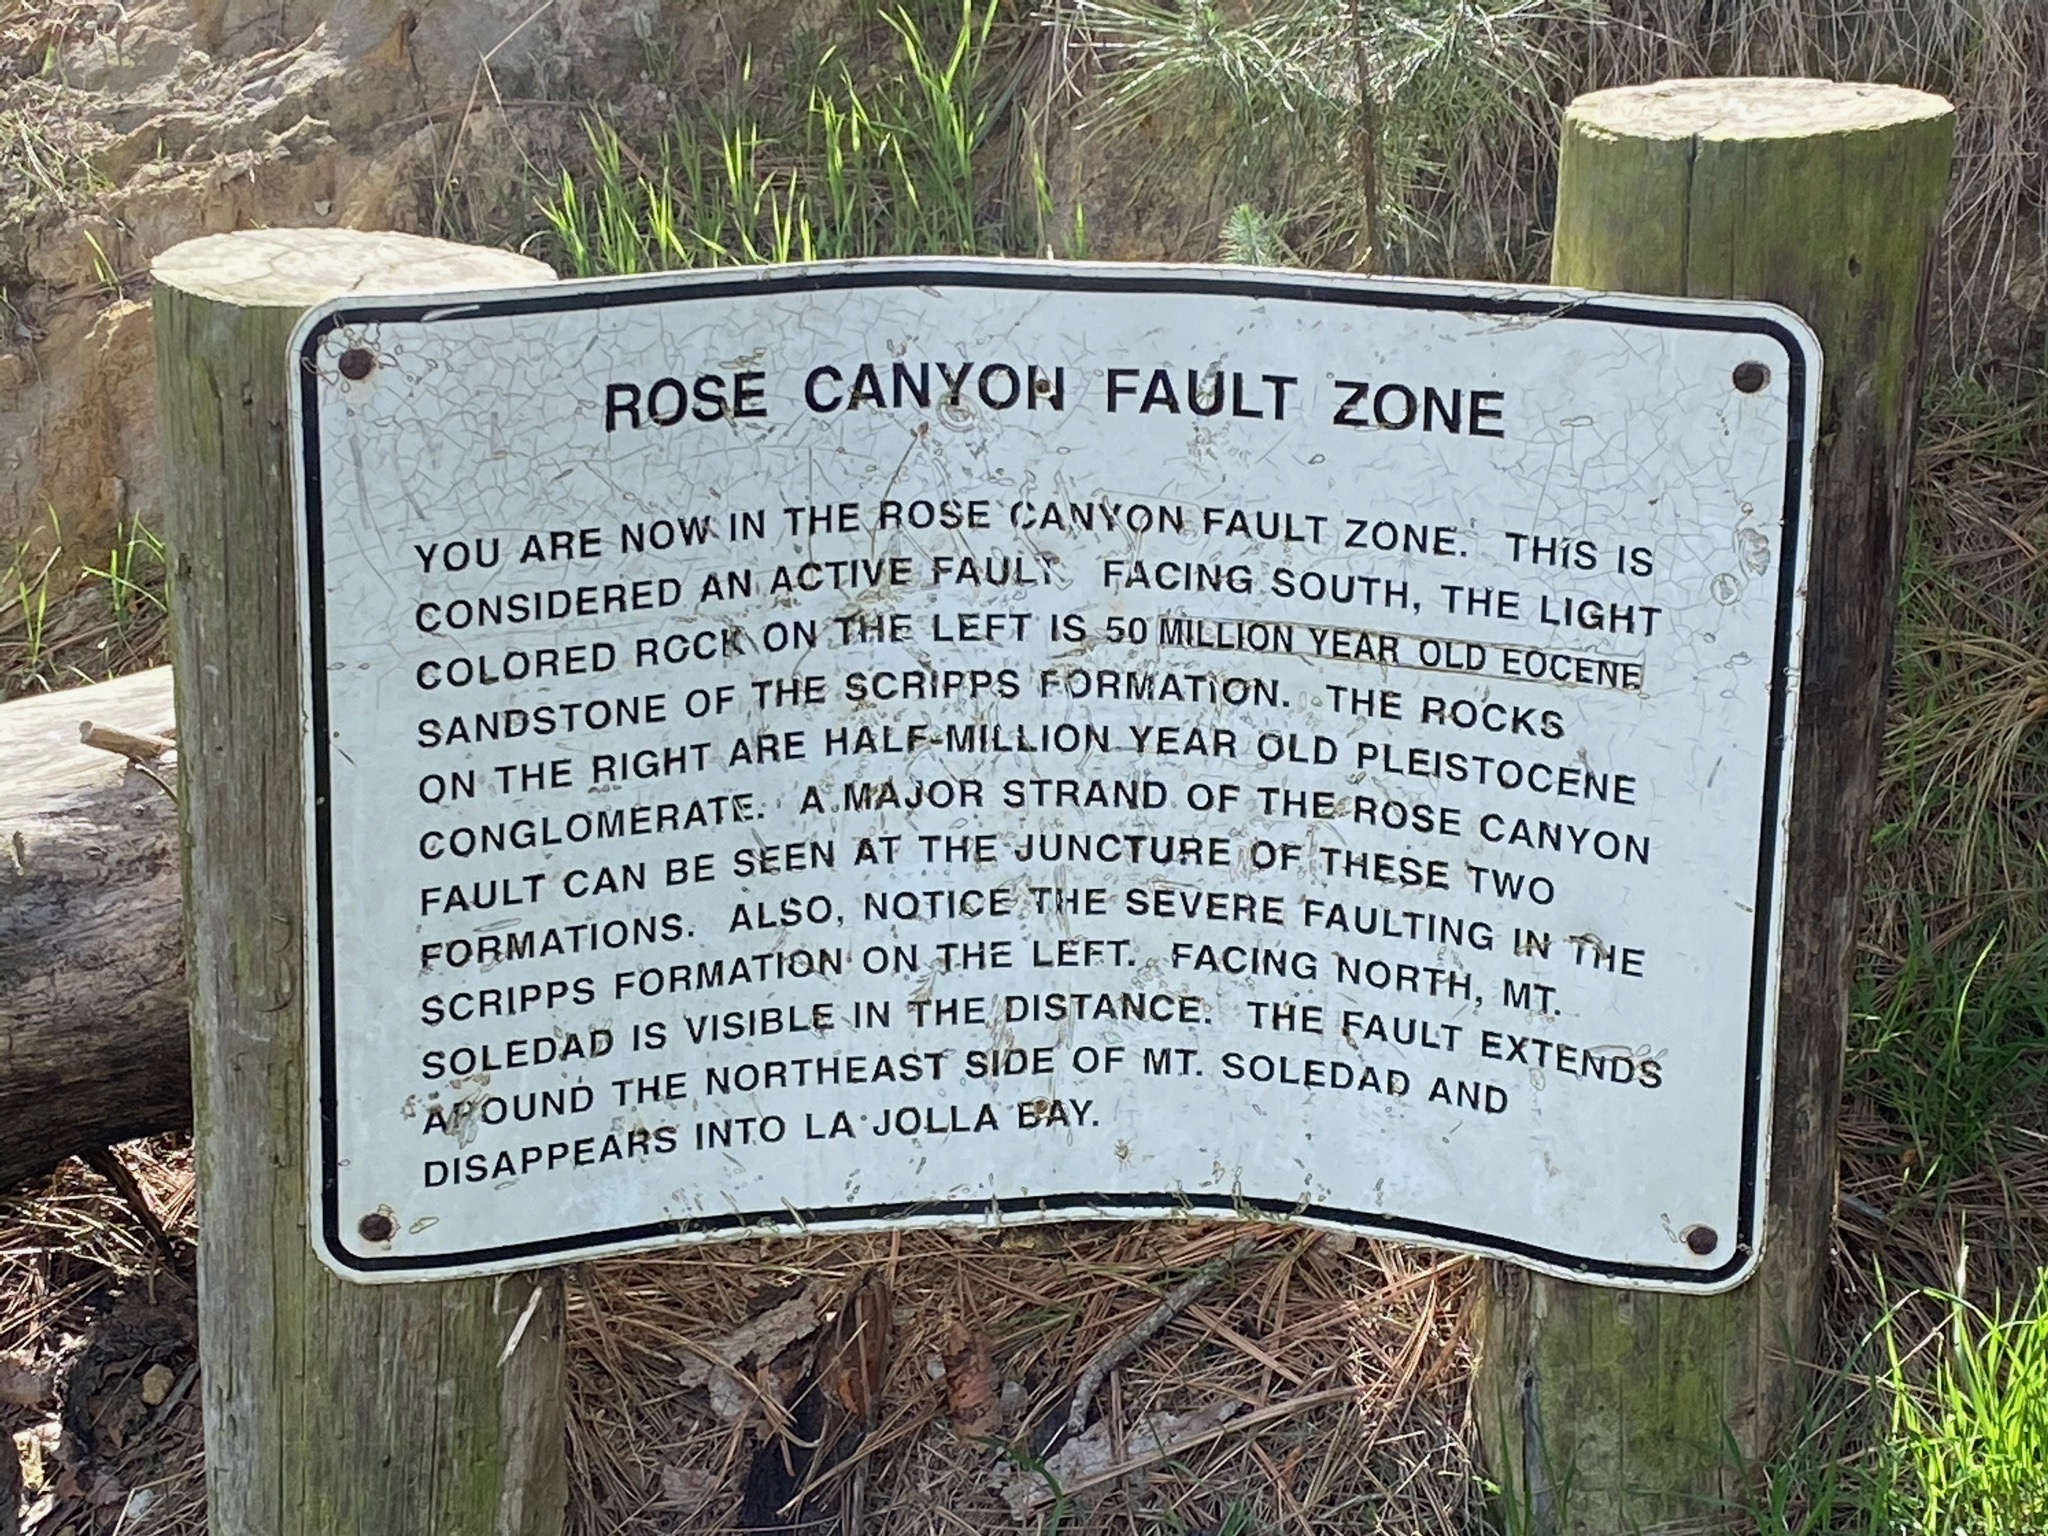
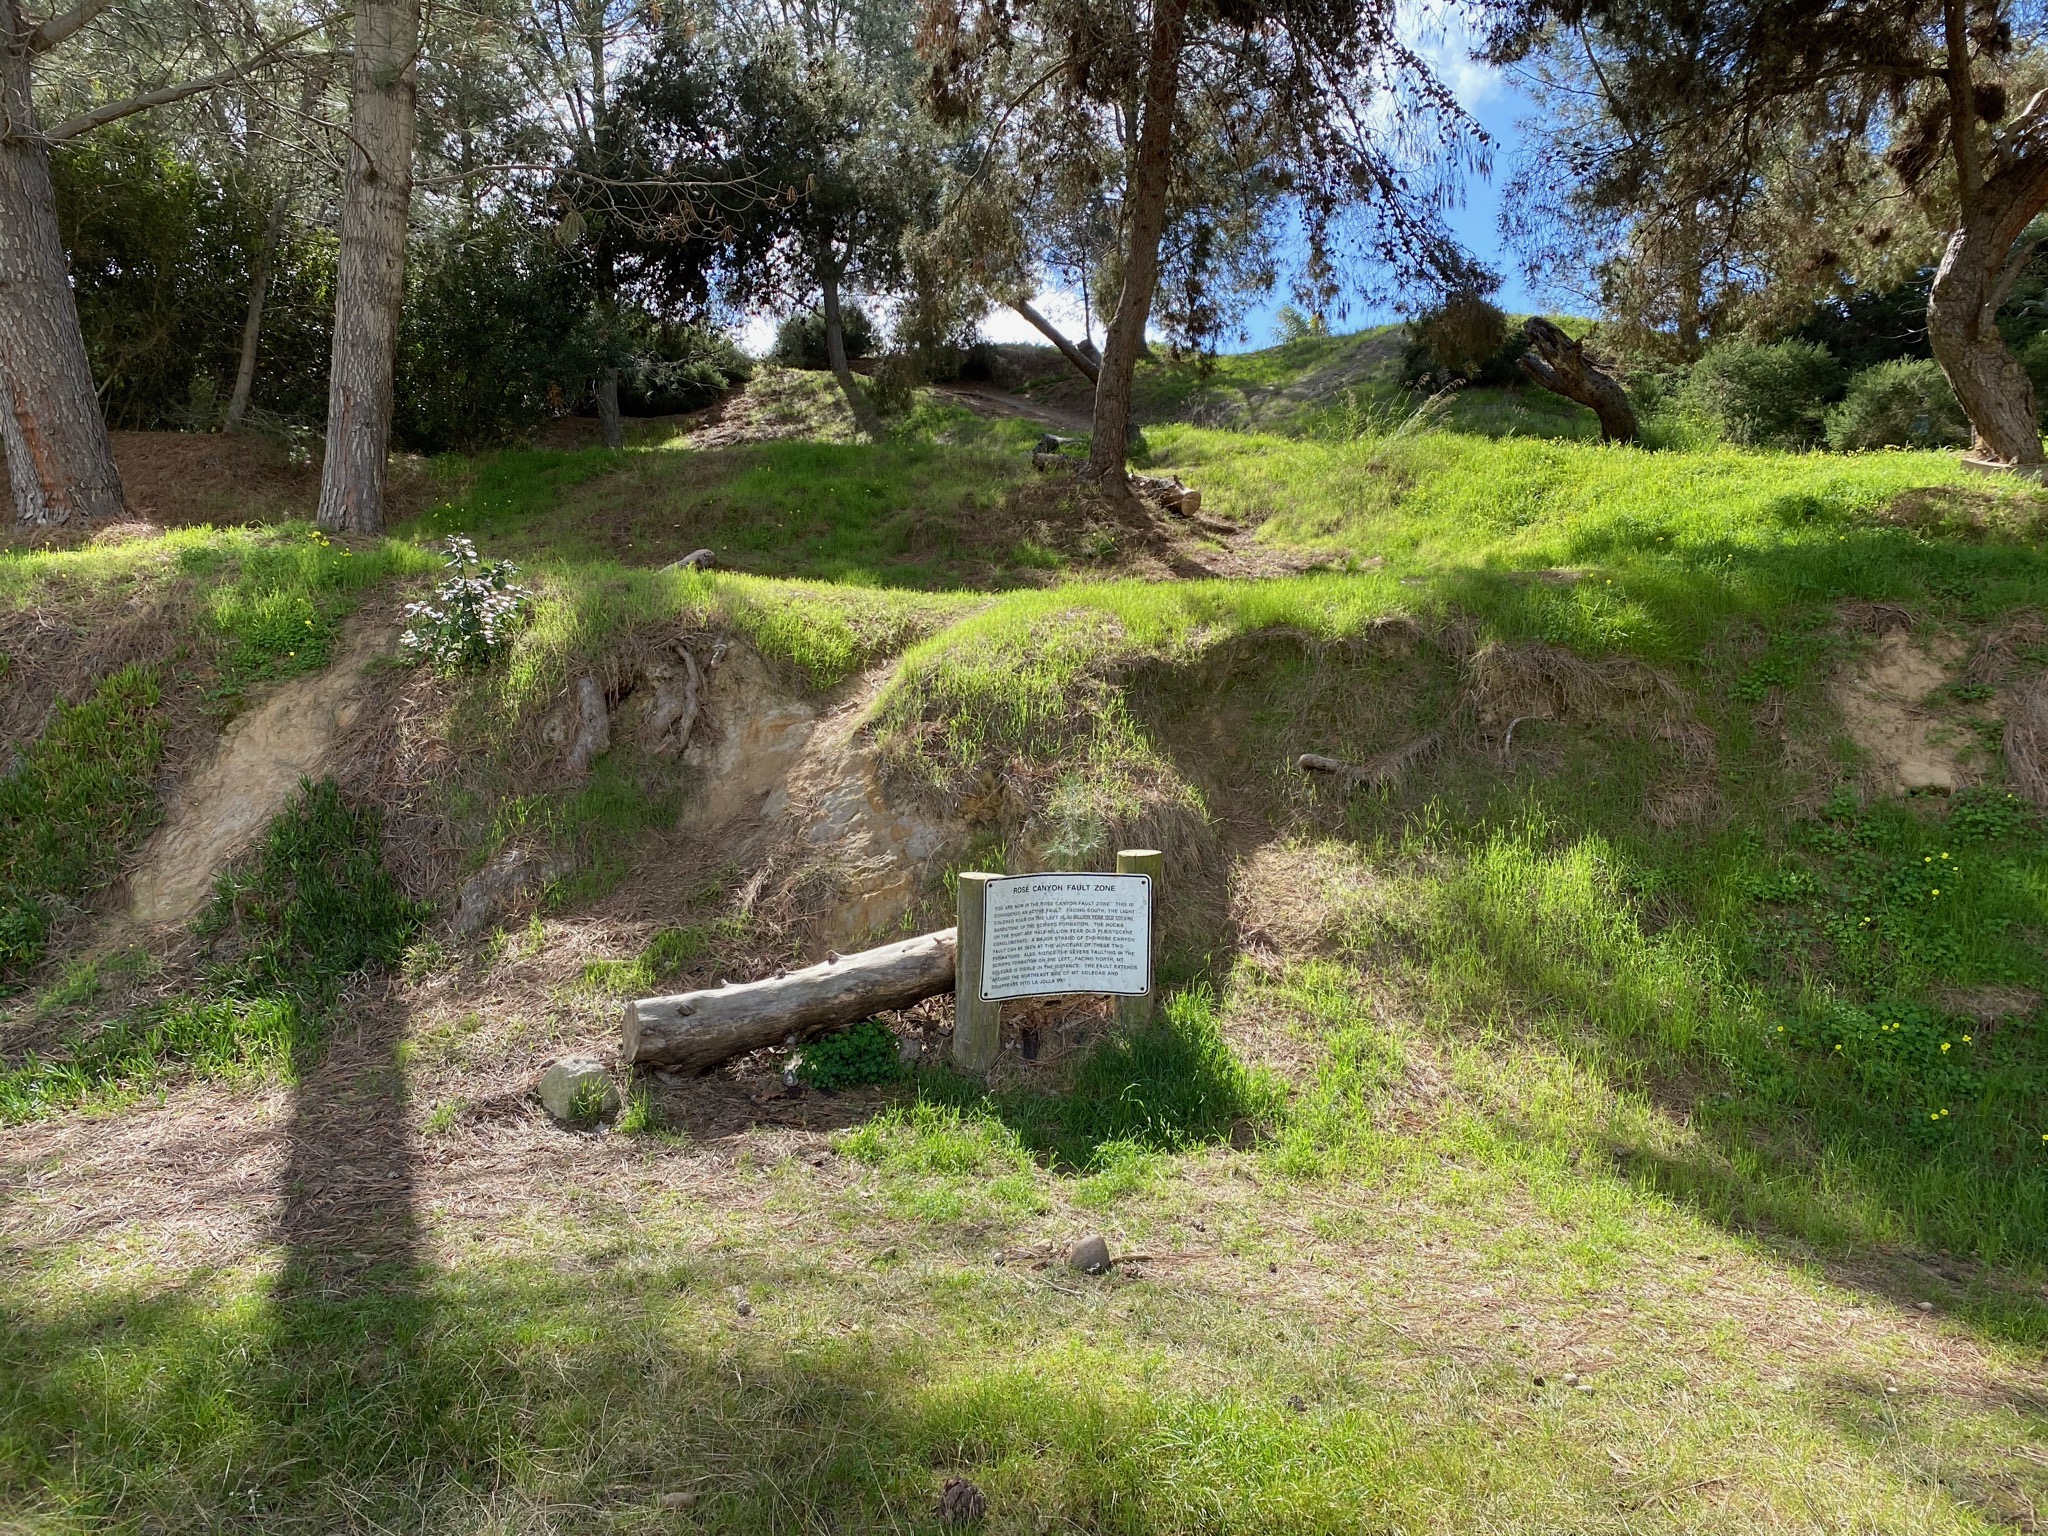
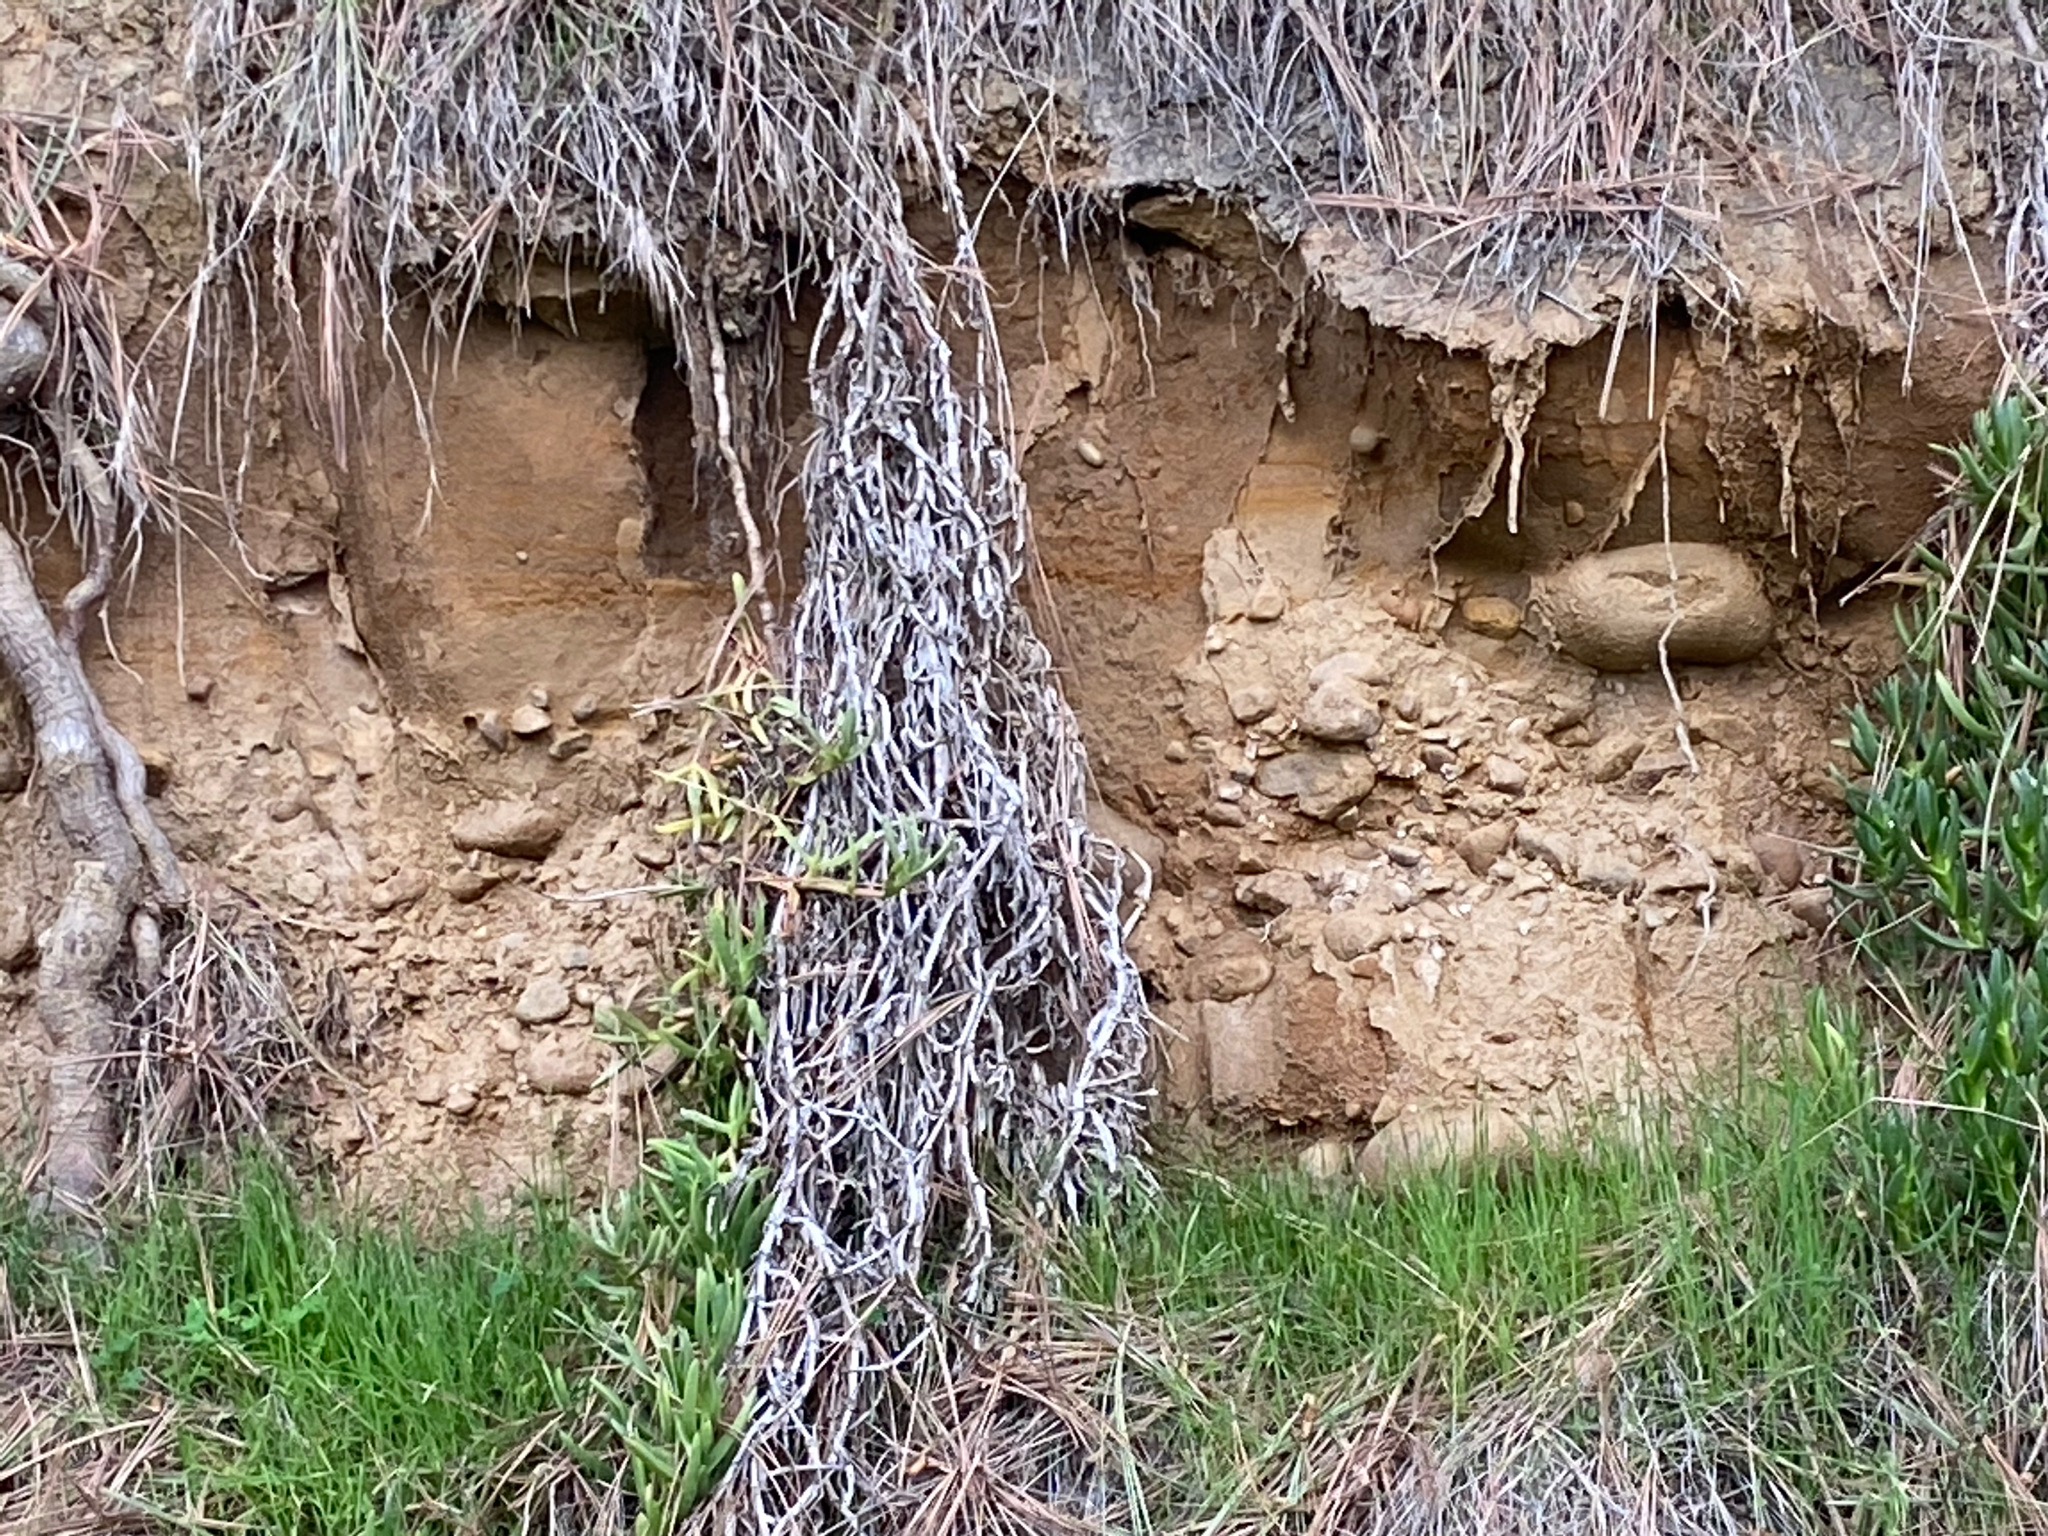
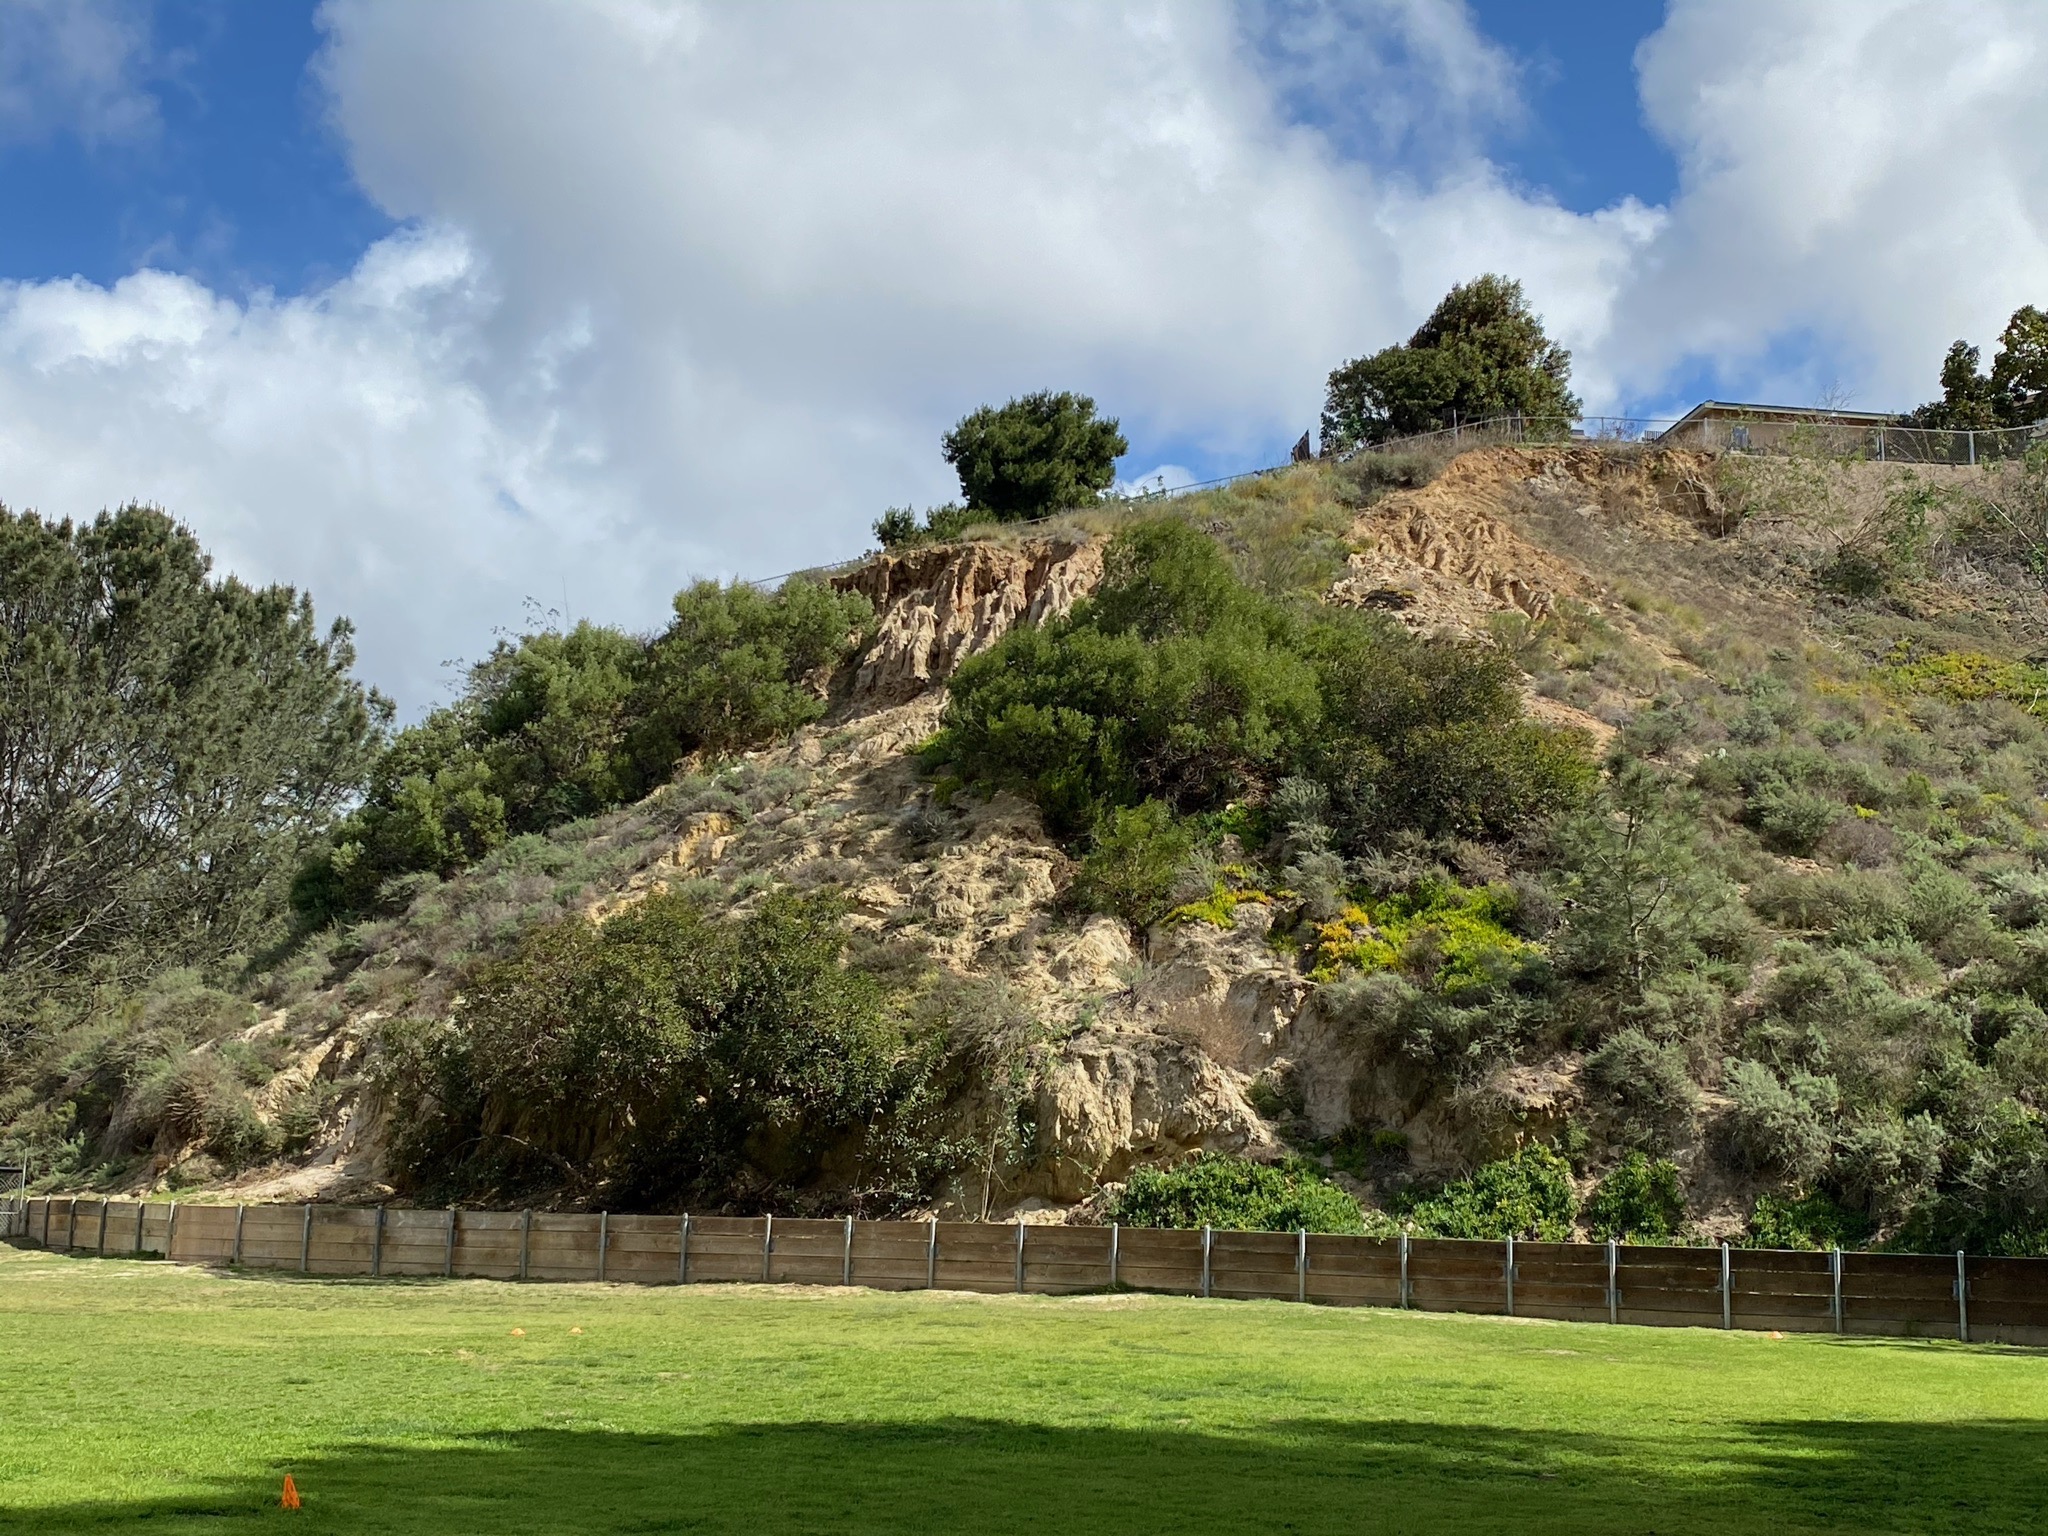
Tecolote Community Park is located on the east side of Interstate 5 at the Sea World Drive/Tecolote Road Exit (Figure 101). An exposure of a strand the Rose Canyon Fault Zone is located behind the southern-most baseball field, behind the fence near the 3rd base outfield. The sign put there in the park reads (Figures 102 and 103):
"ROSE CANYON FAULT ZONE"
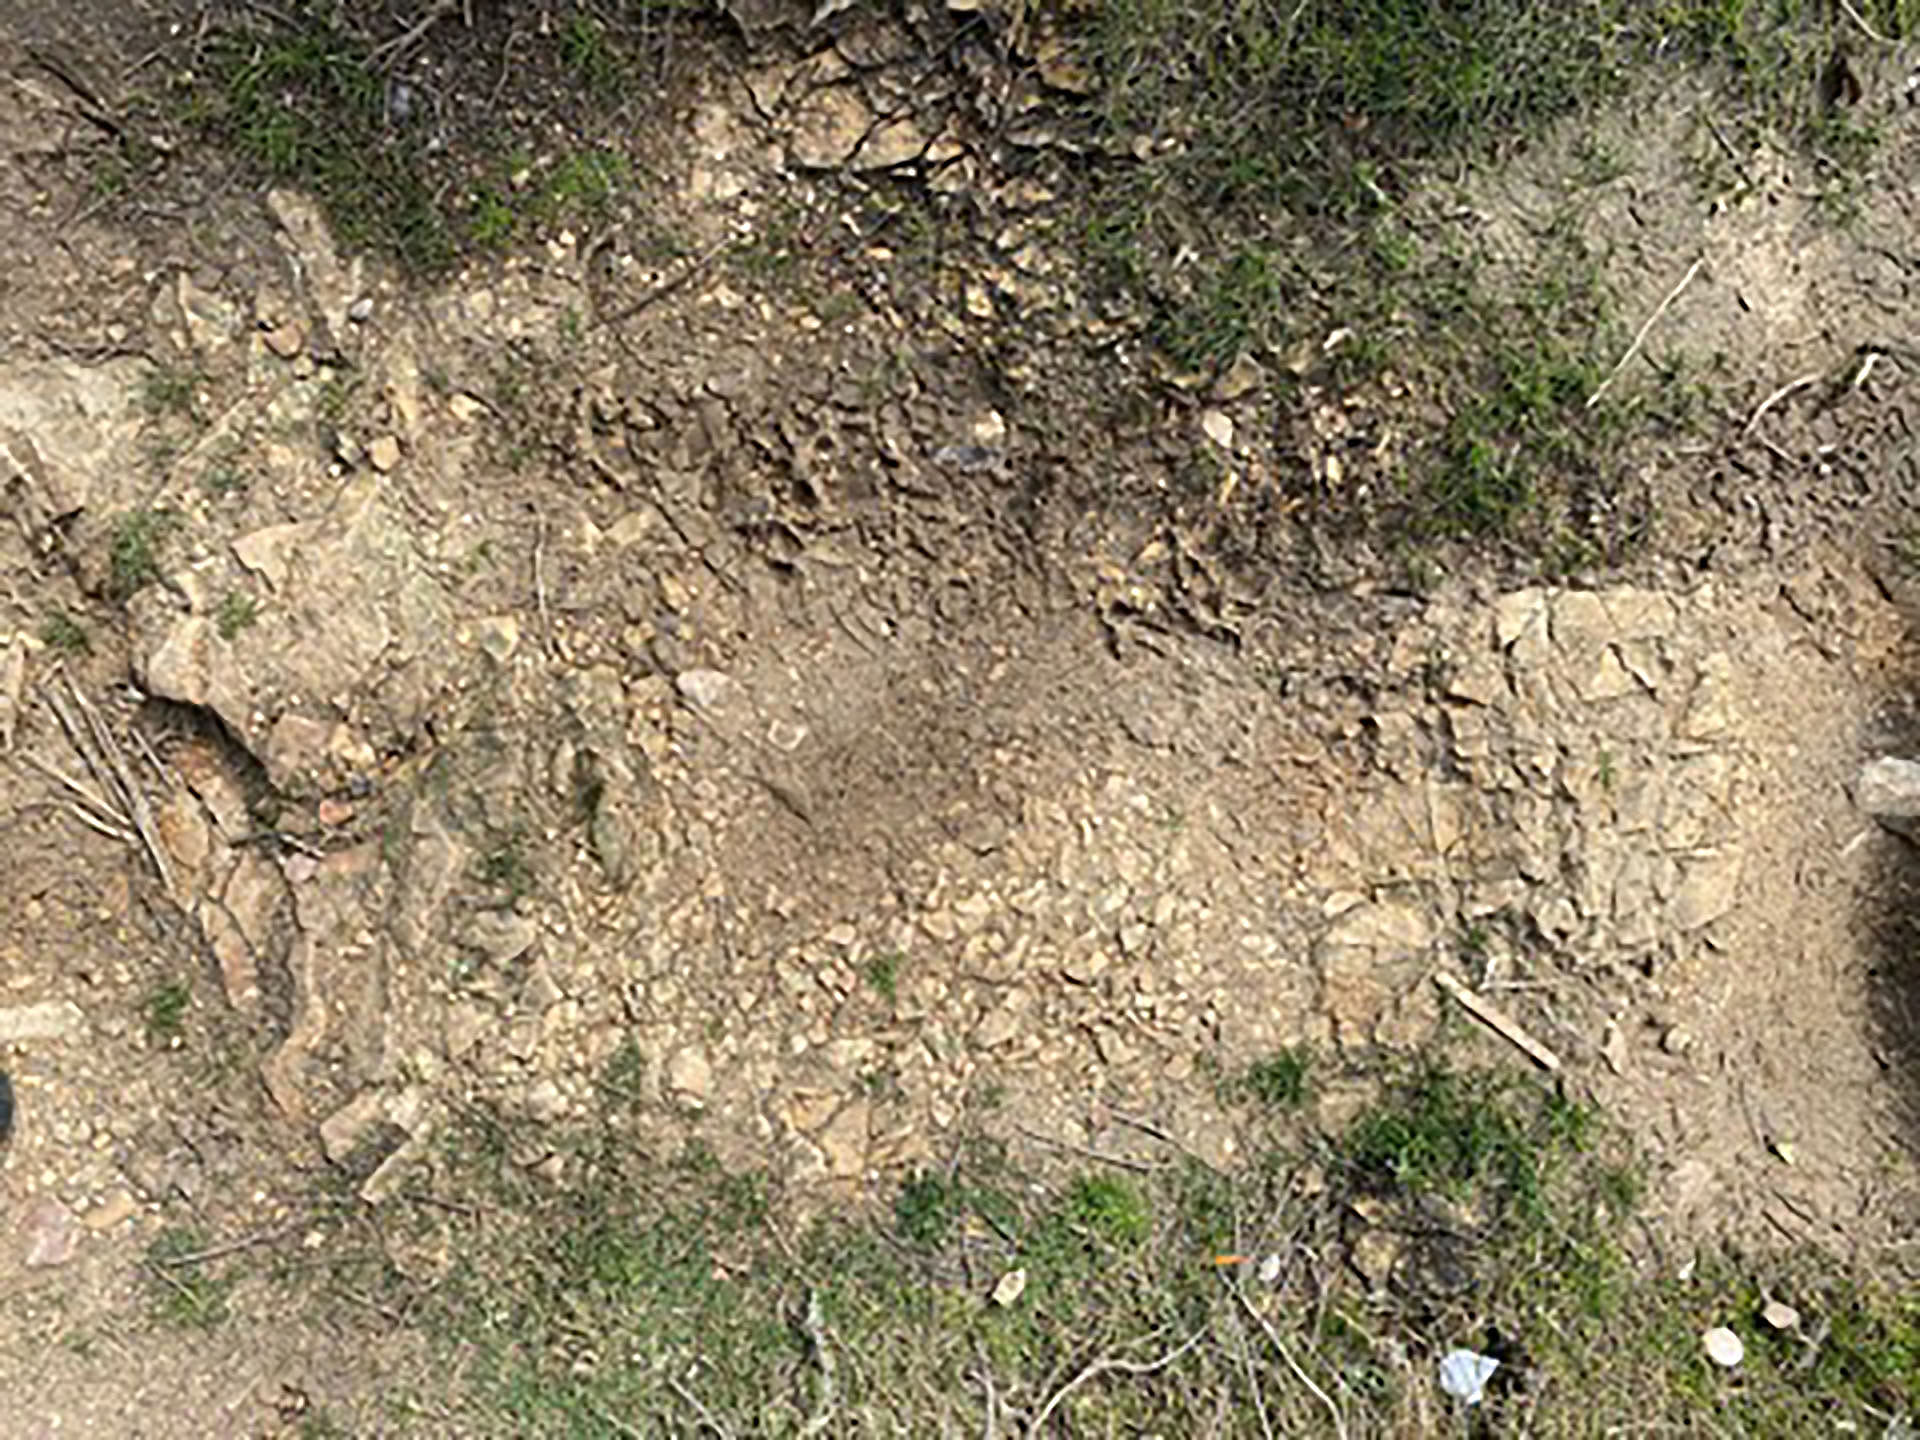
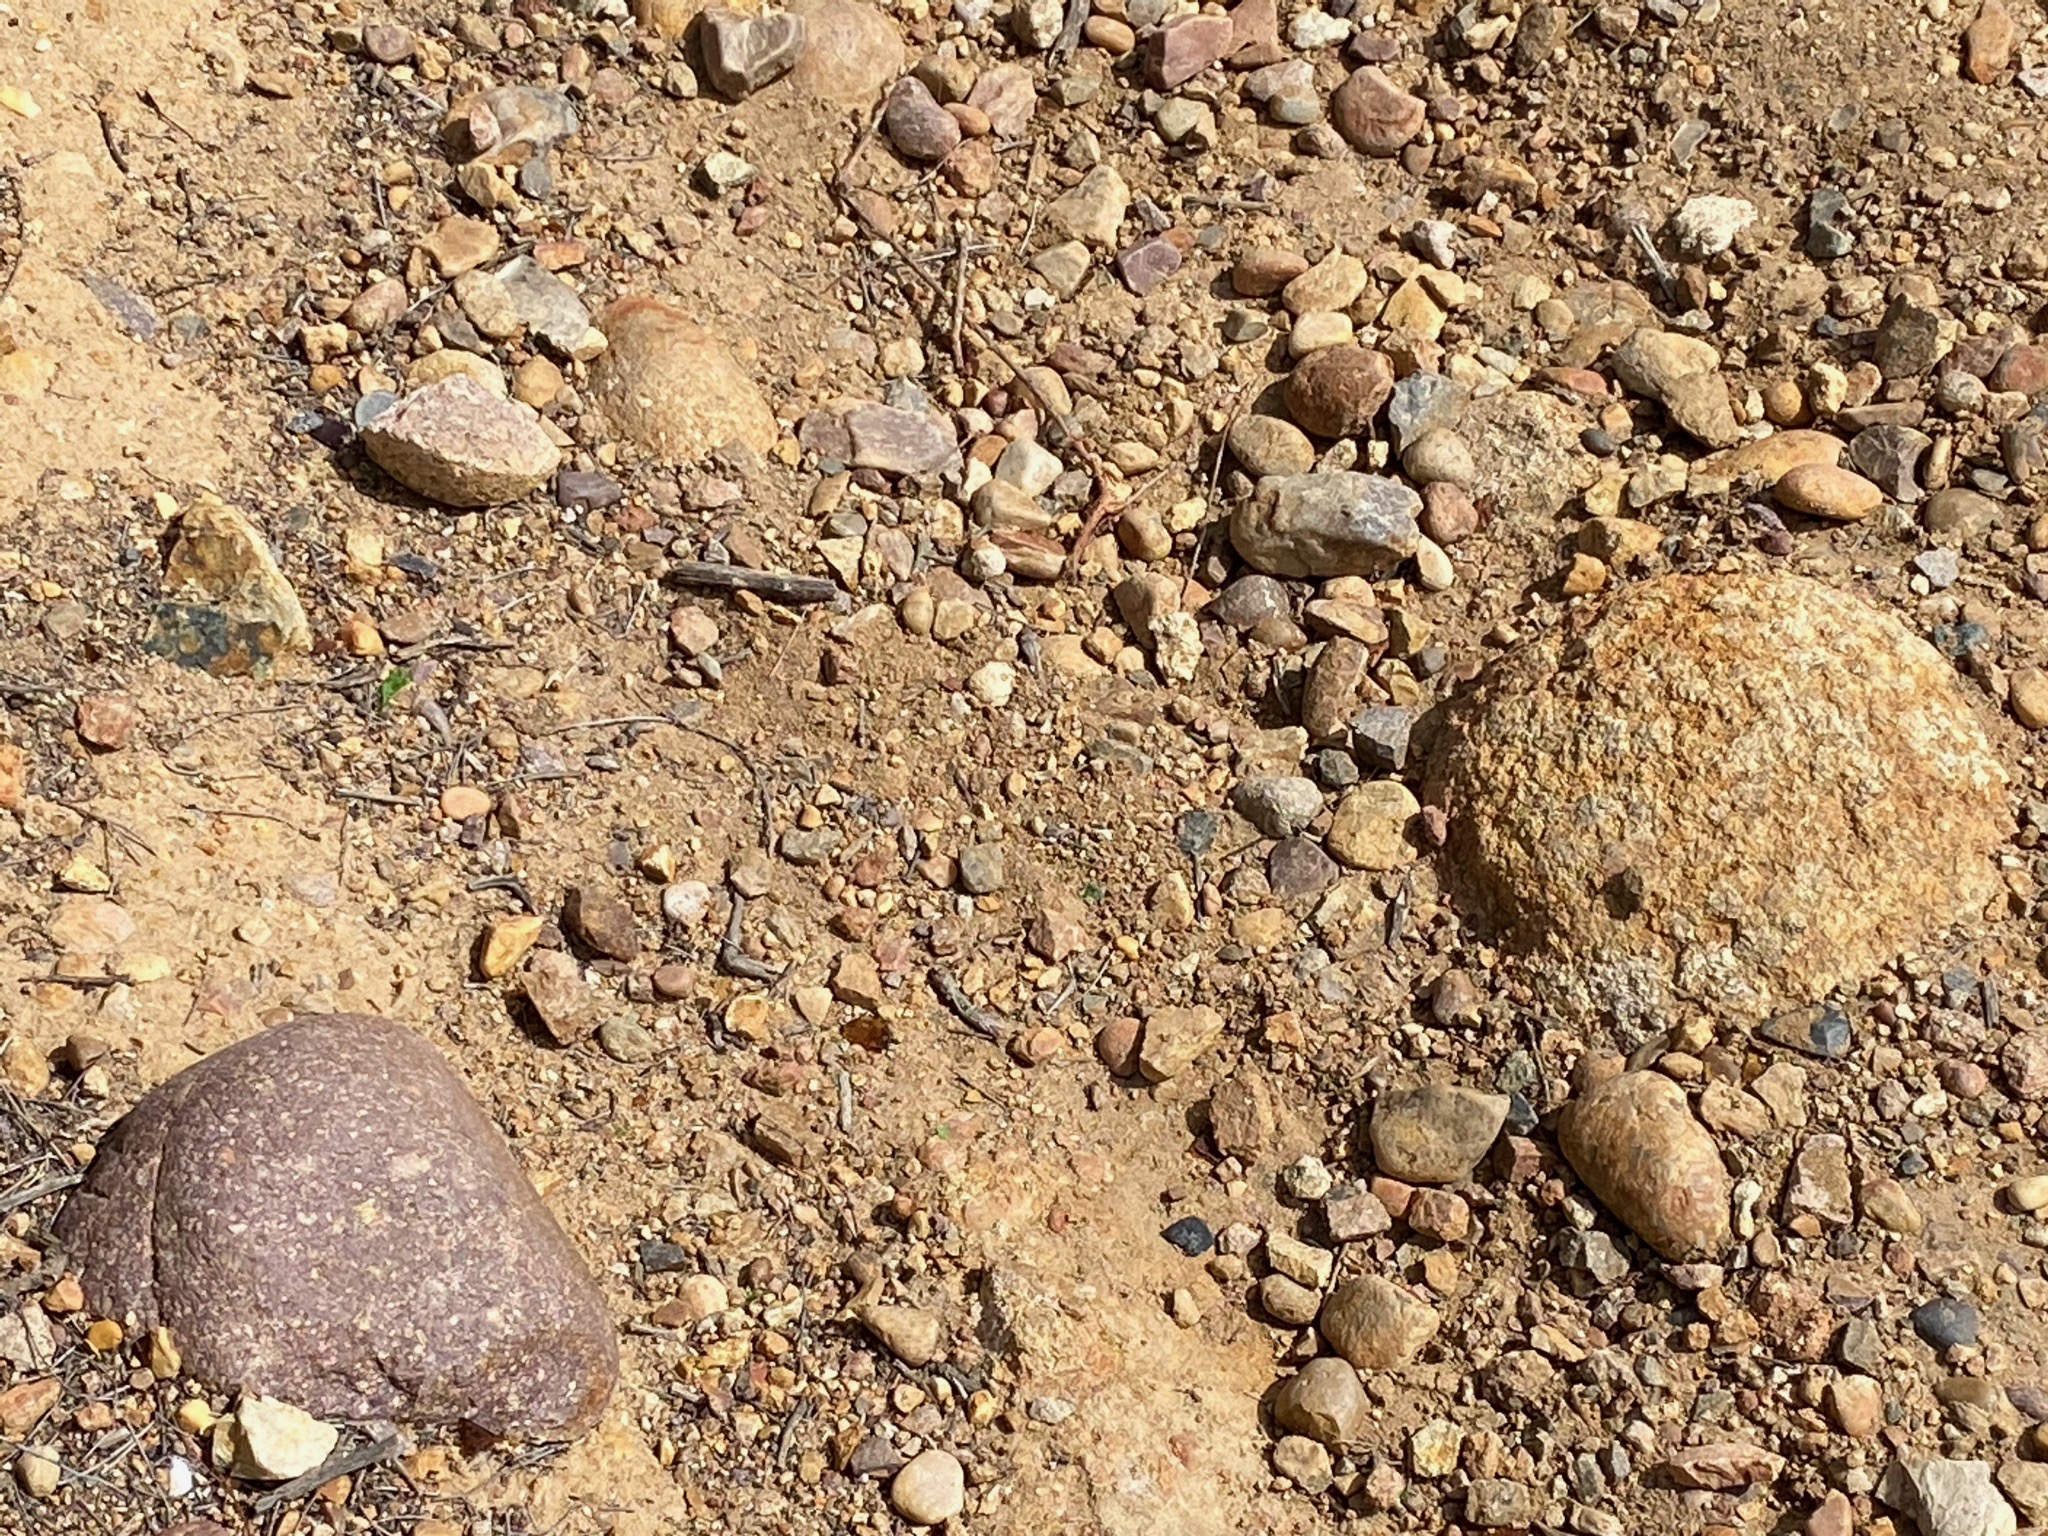
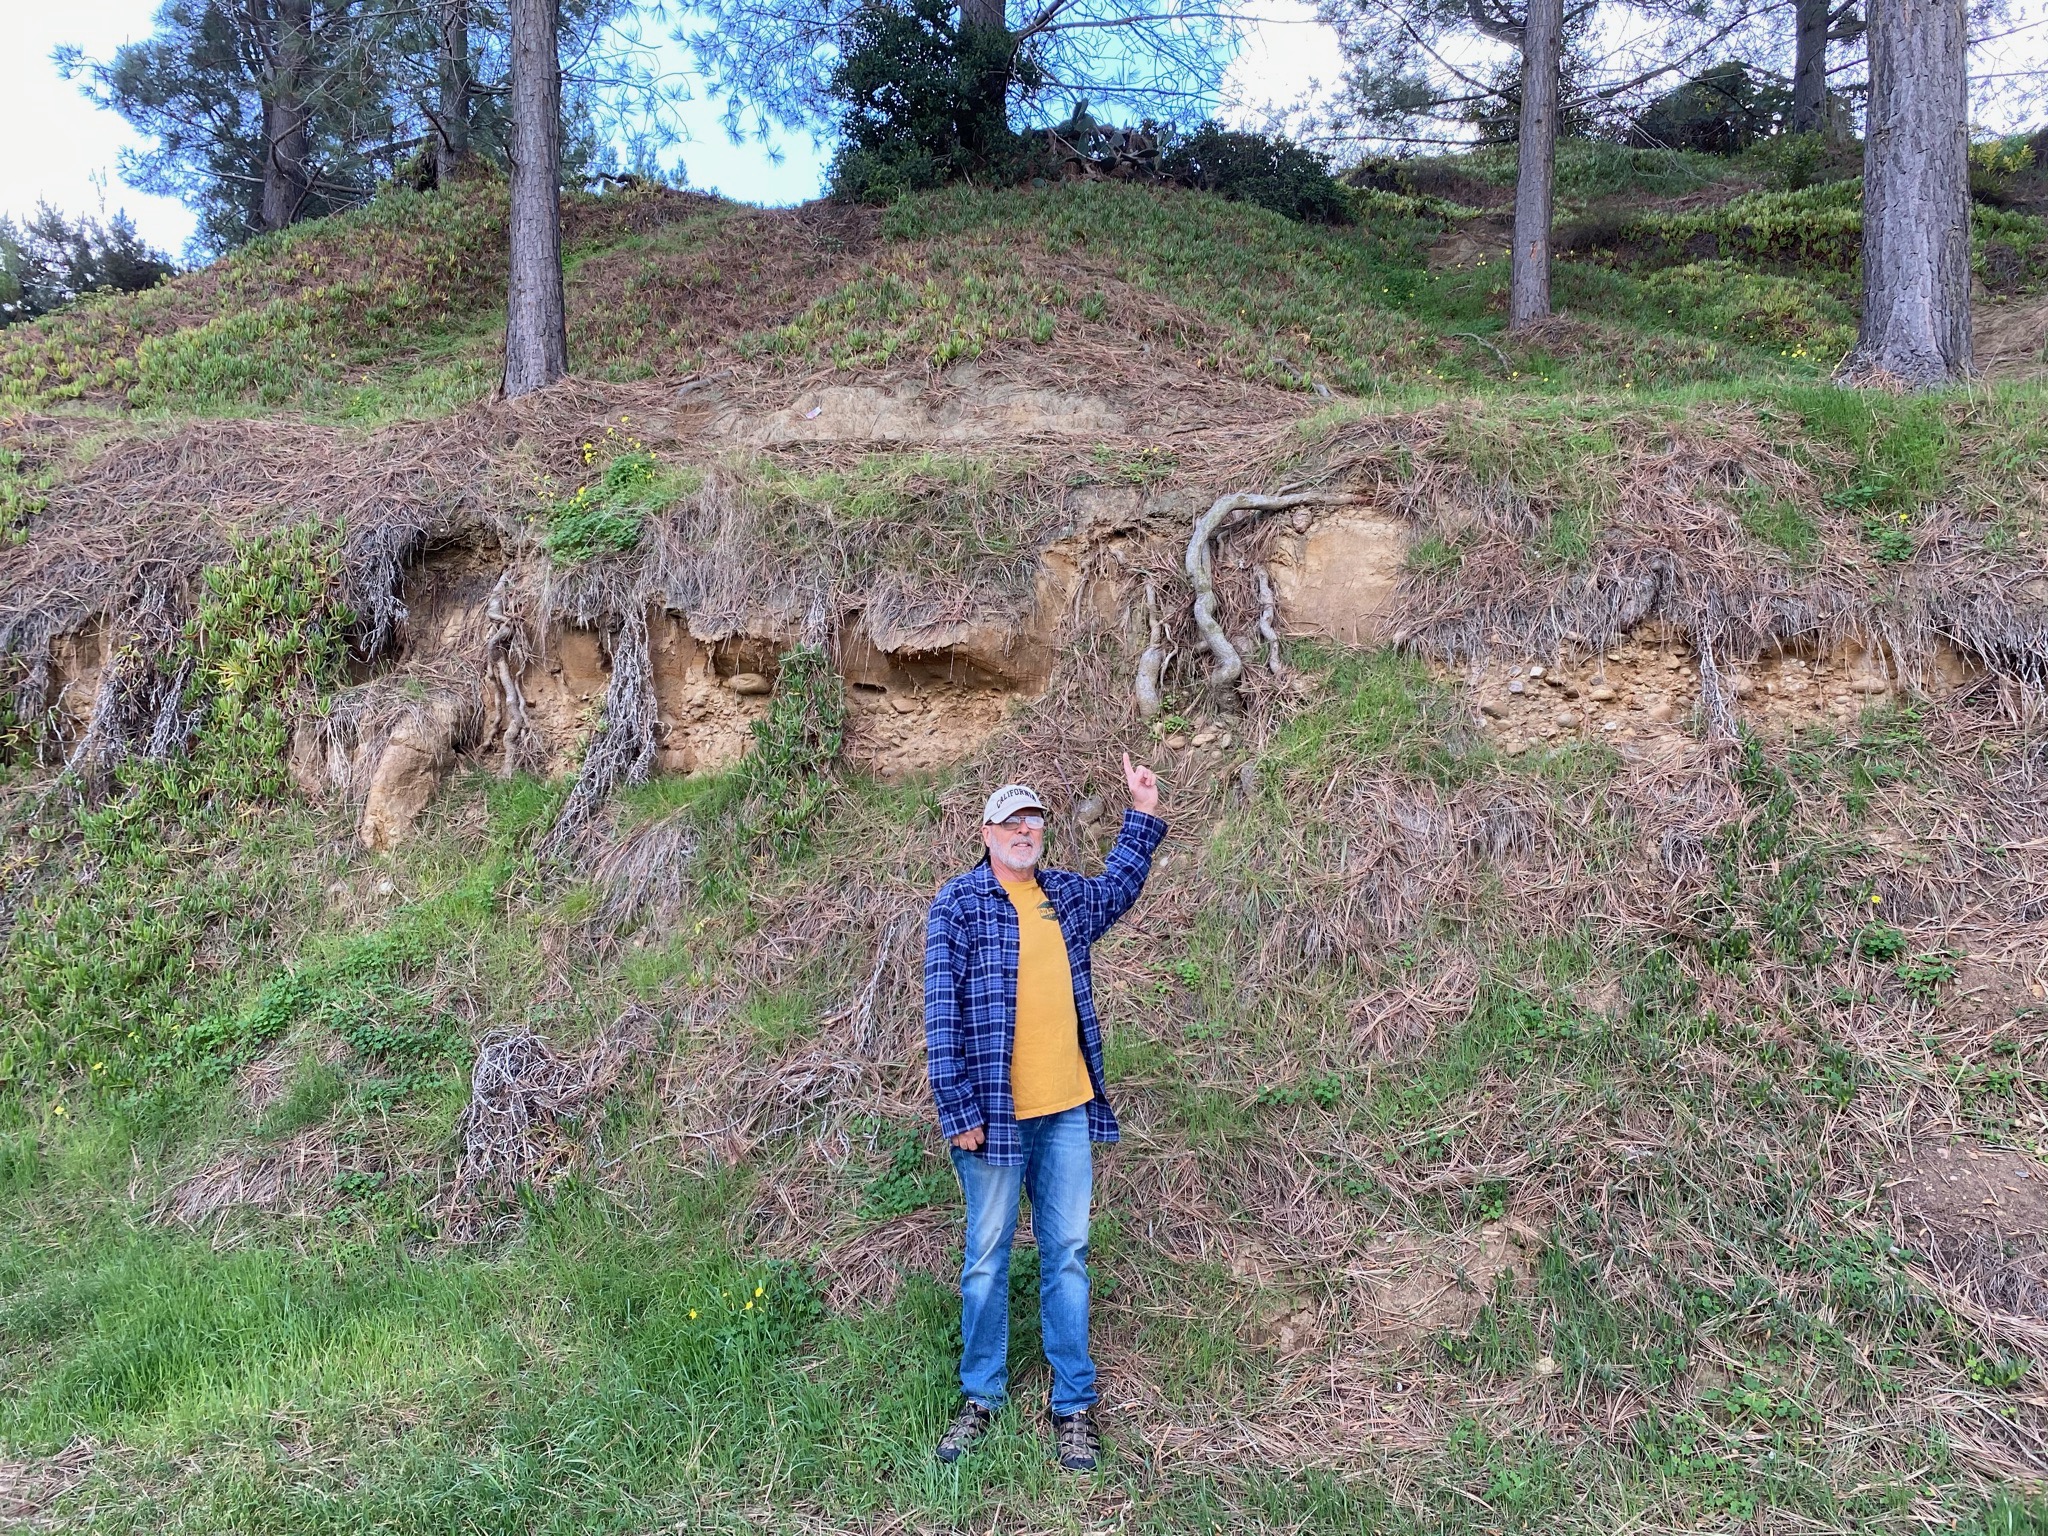
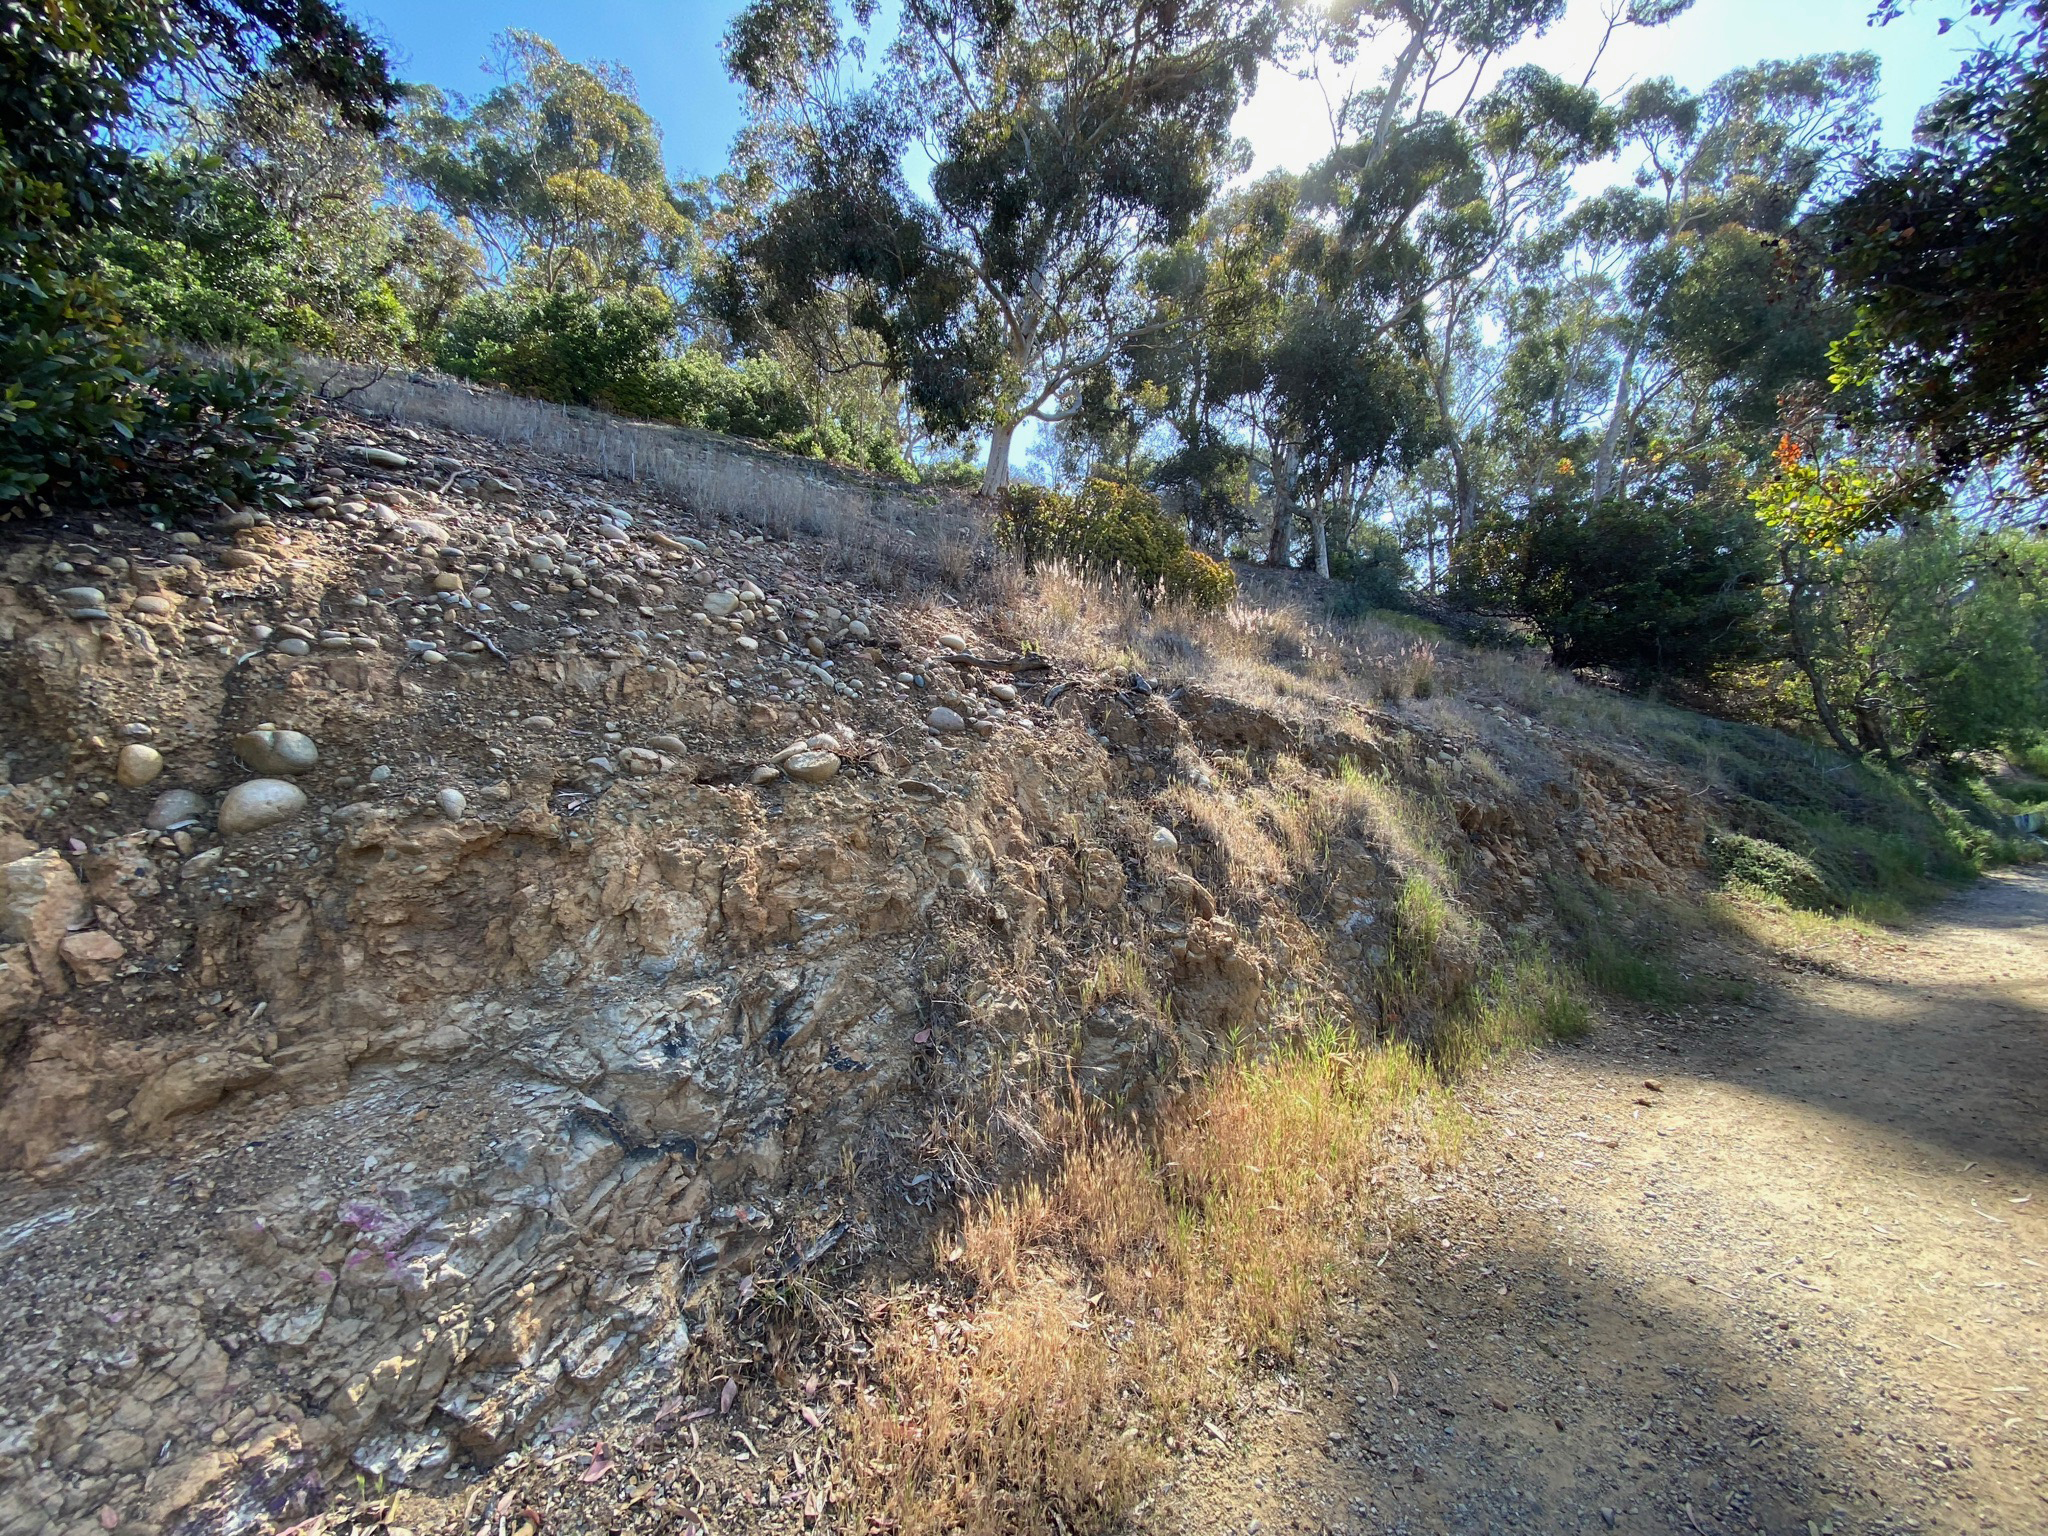
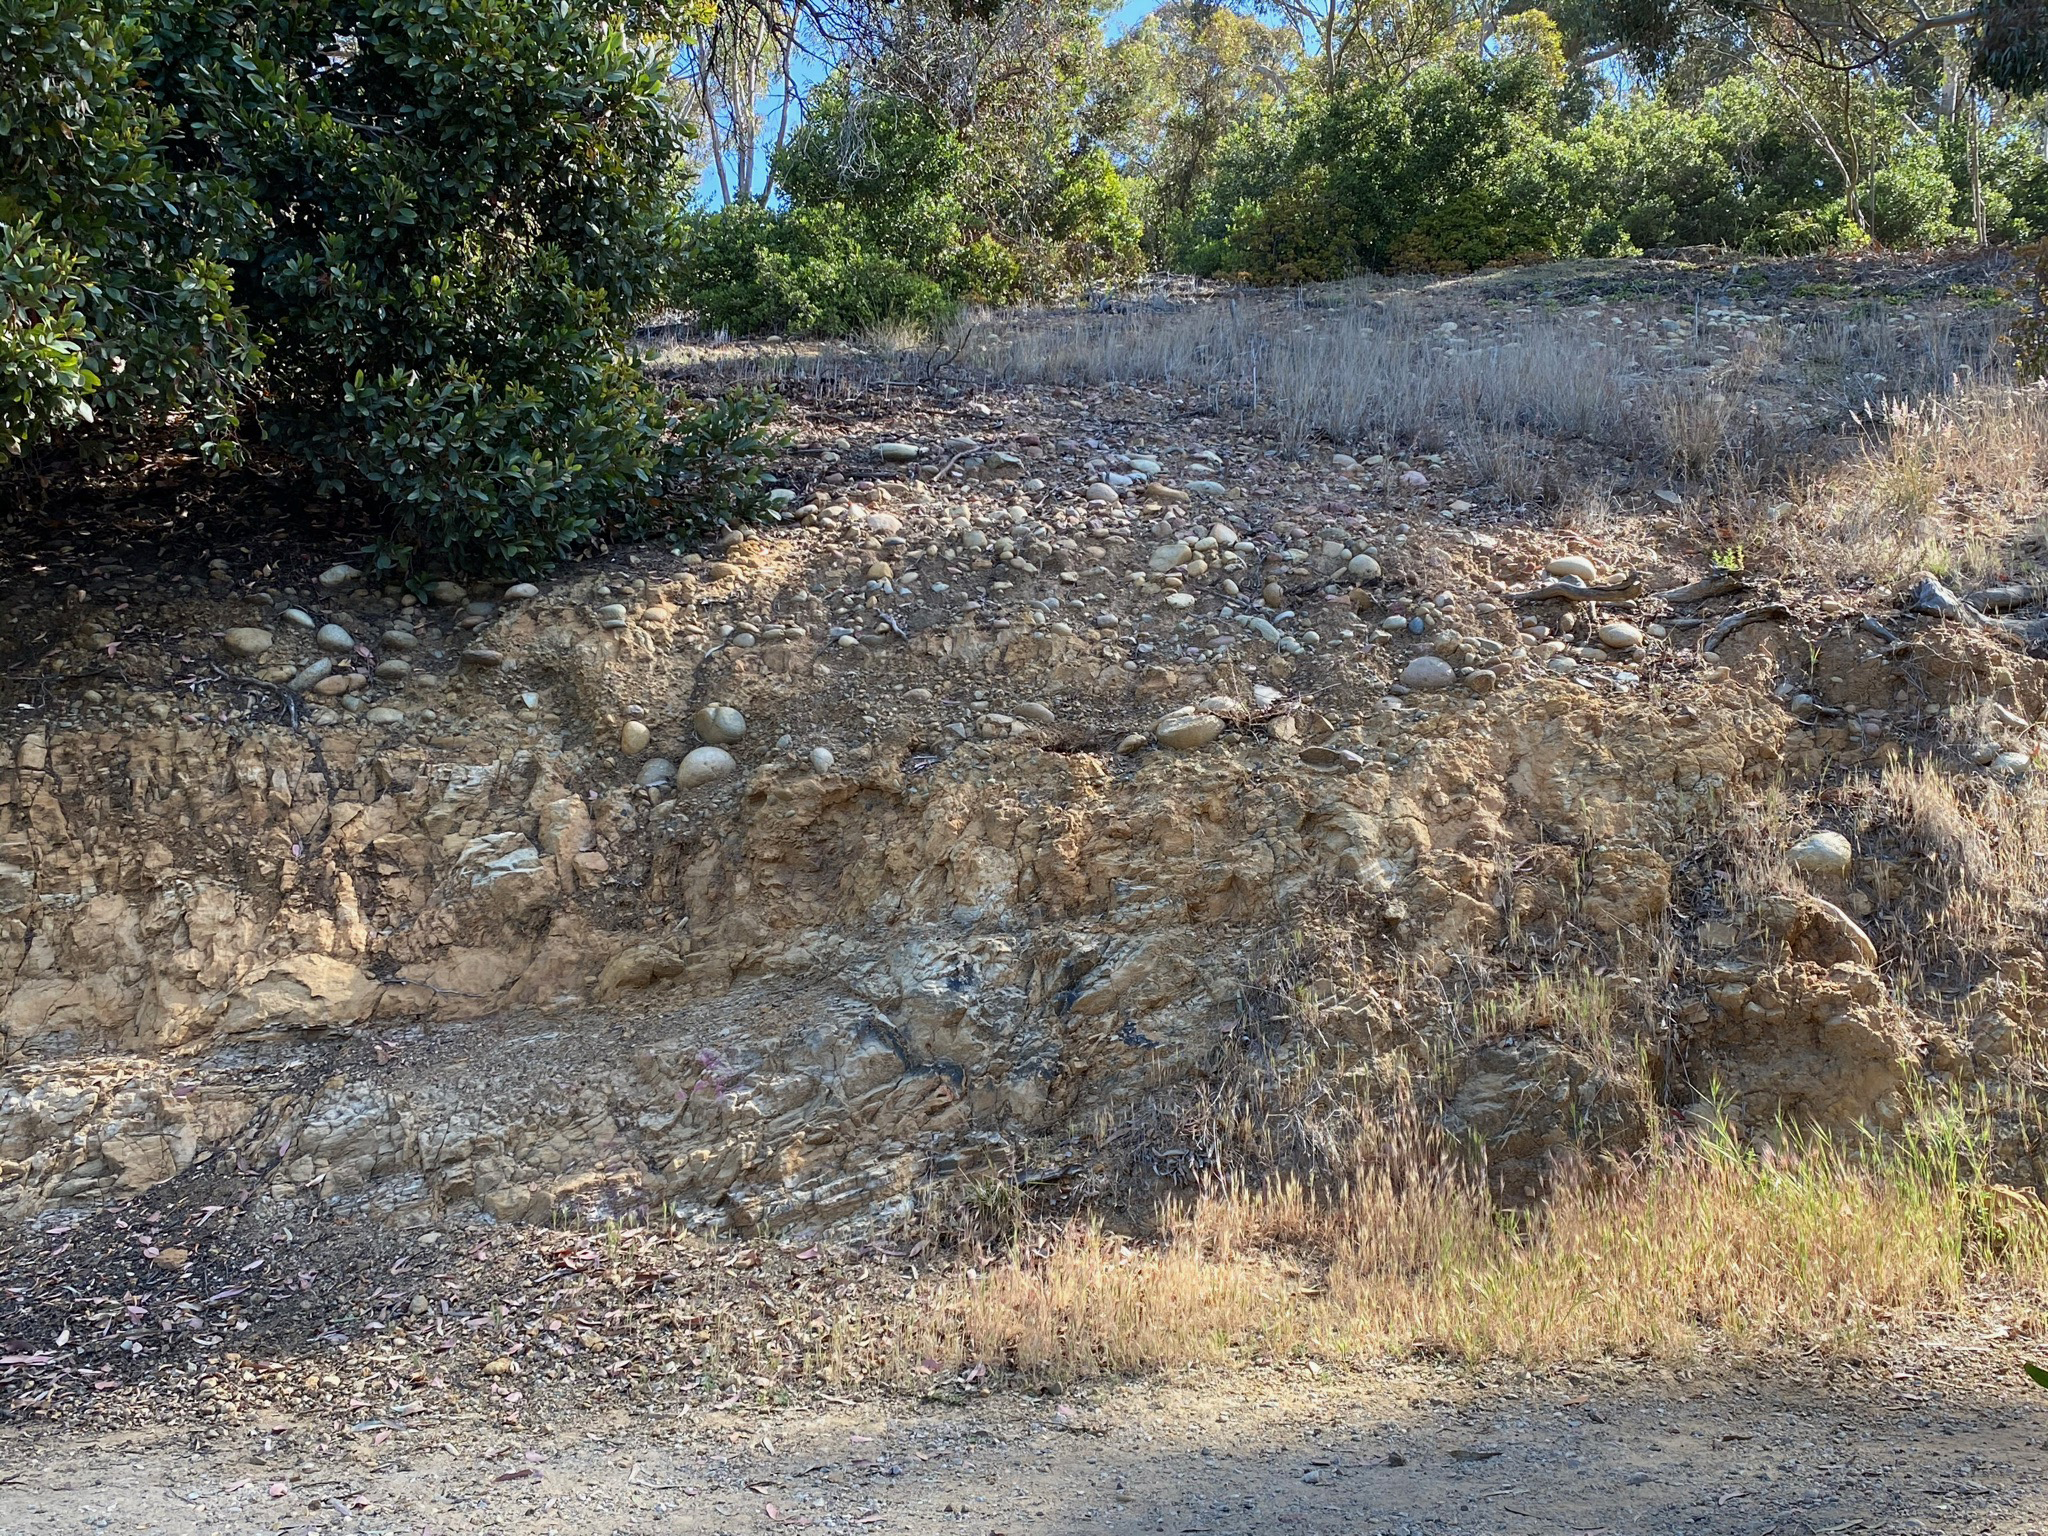
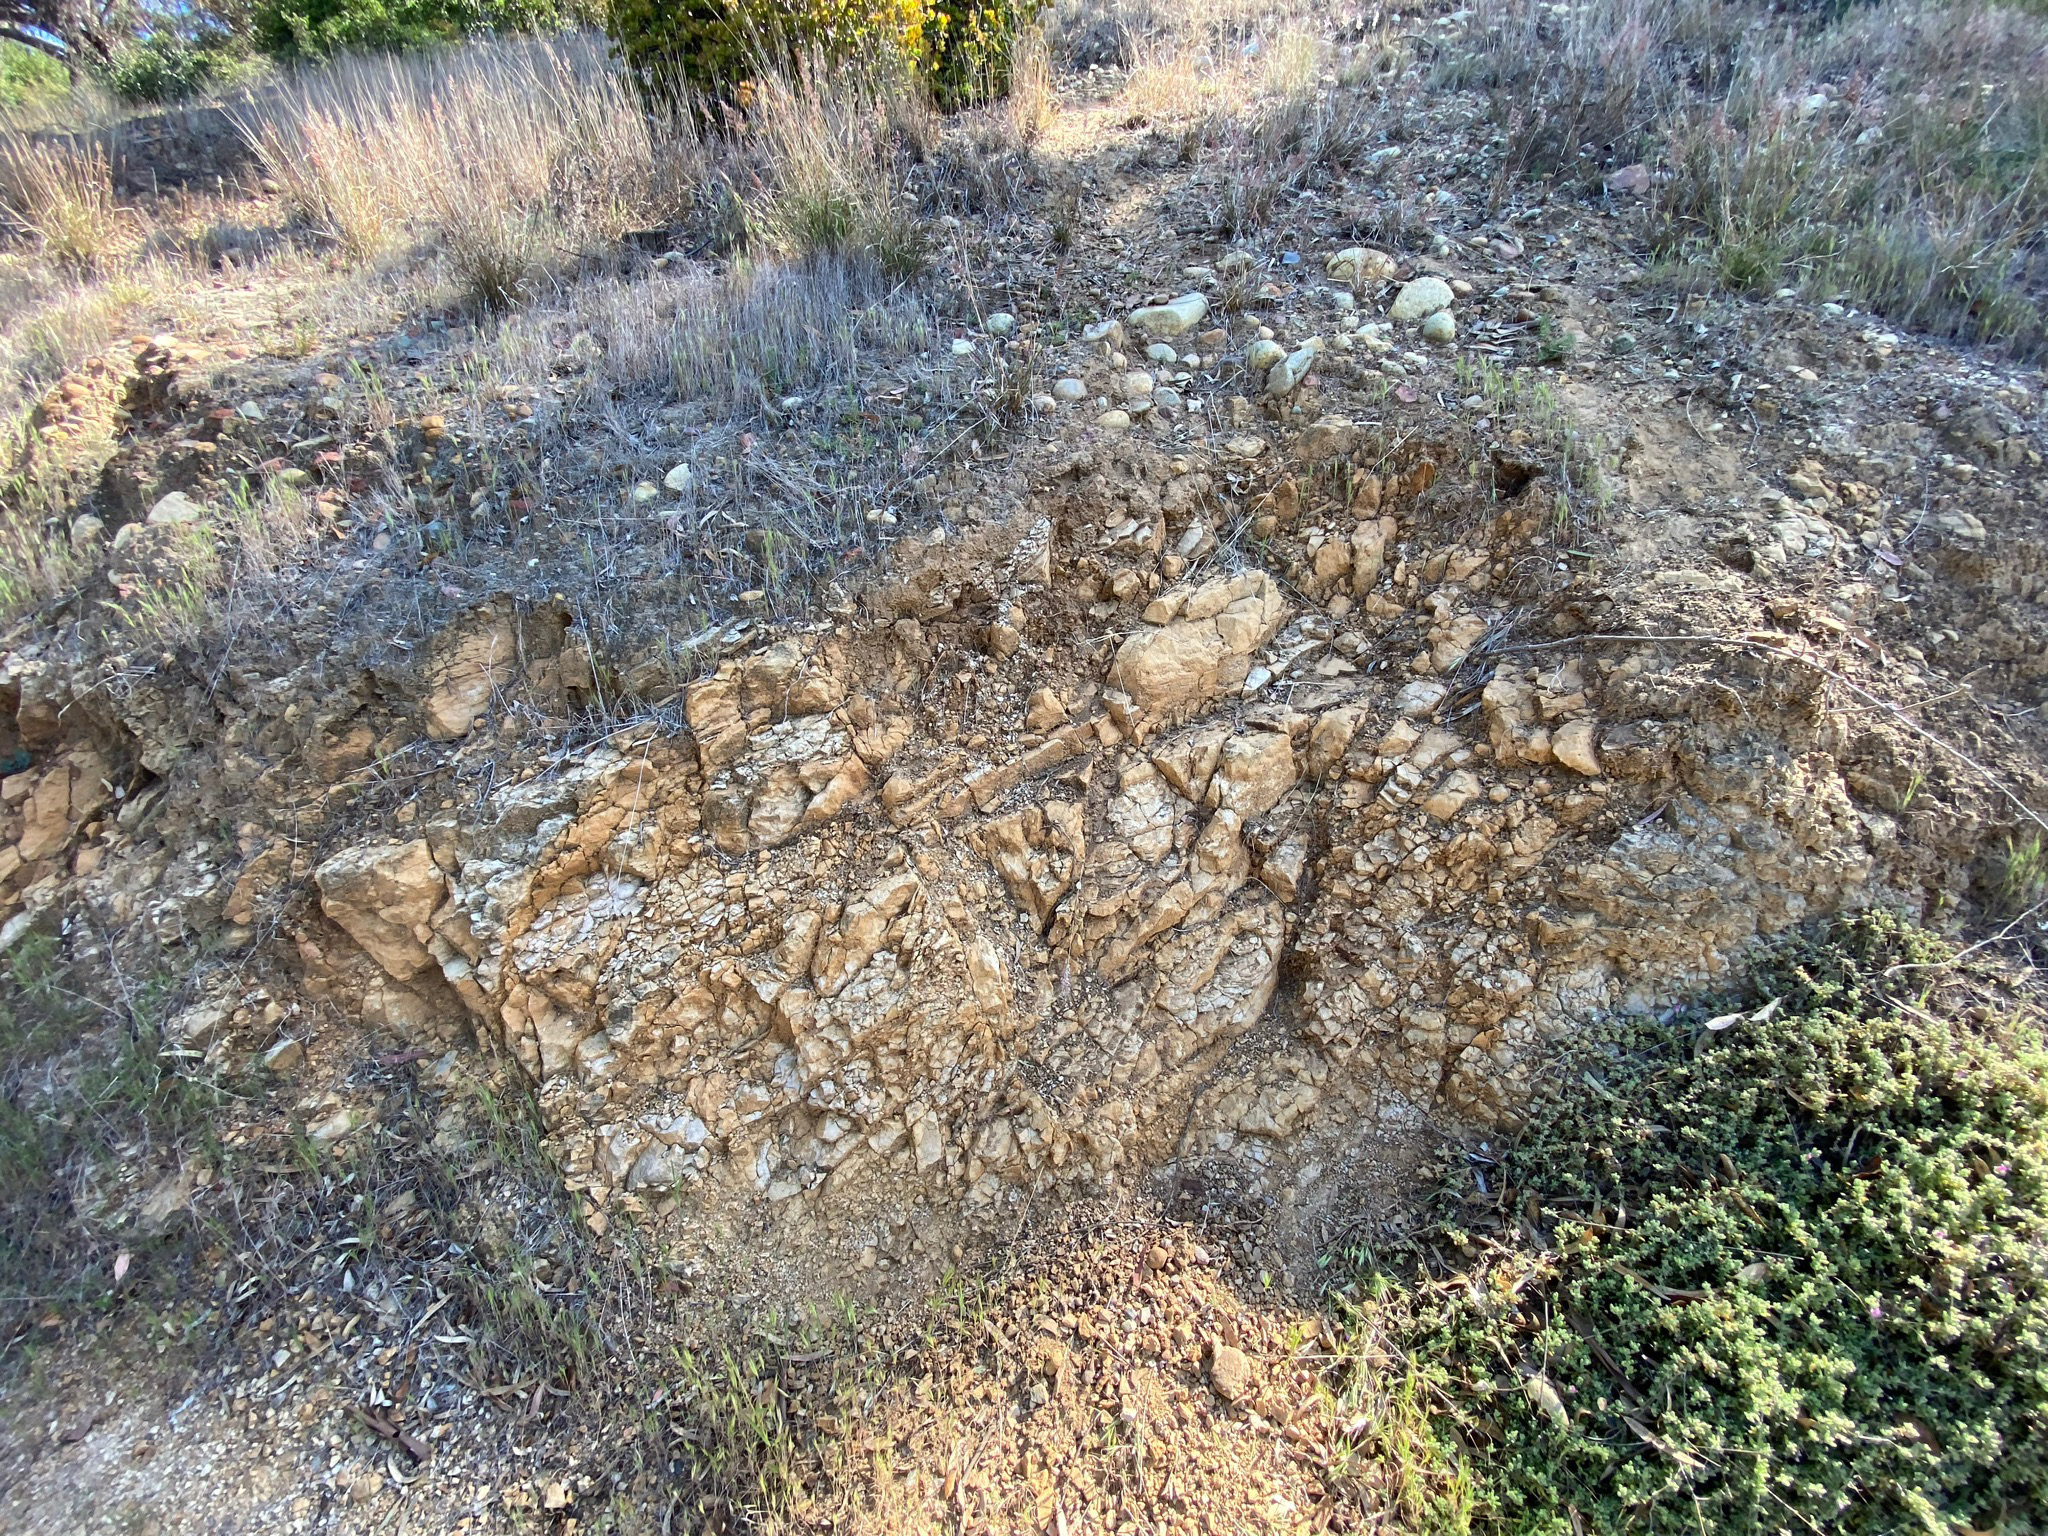
"You are now in the Rose Canyon Fault Zone. This is considered an active fault. Facing south, the light colored rock on the left is 50 million year old Eocene sandstone of the Scripps Formation [Figures 104 and 105]. The rocks on the right are half-million year old Pleistocene conglomerate [Figures 106 to 108]. A major strand of the Rose Canyon Fault can be seen at the juncture of these two formations. Also, notice the severe faulting in the Scripps Formation on the left. Facing north, Mt. Soledad is visible in the distance [Figure 109]. The fault extends around the northeast side of Mt. Soledad and disappears into La Jolla Bay."
|
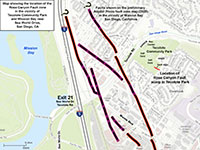
Fig. 101. Location of a visible active fault strand within the Rose Canyon Fault Zone in Tecolote Community Park, San Diego.
|
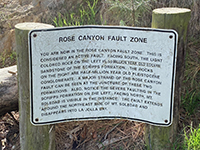
Fig. 102. The sign describing the Rose Canyon Fault in Tecolote Community Park.
|
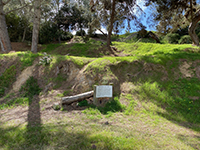
Fig. 103. A park sign show the location of the Rose Canyon Fault Zone at this location. |
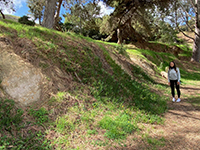
Fig. 104. Sandstone of the Eocene Scripps Fm. exposed in a cut near the fault zone. |
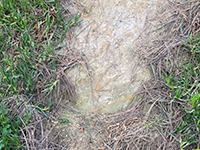
Fig. 105. Dipping and fractured sandstone of the Eocene Scripps Formation. |
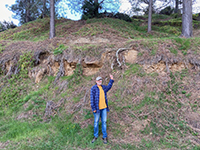
Fig. 106. Half-million year old Pleistocene-age conglomerate (river gravels and sand).
|
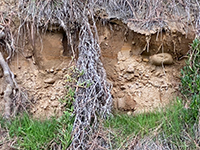
Fig. 107. Close-up view of the poorly consolidated conglomerate. |

Fig. 108. Hillside exposures of conglomerate (river gravels) next to the ball field. |
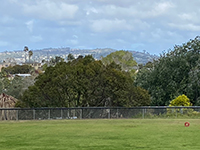
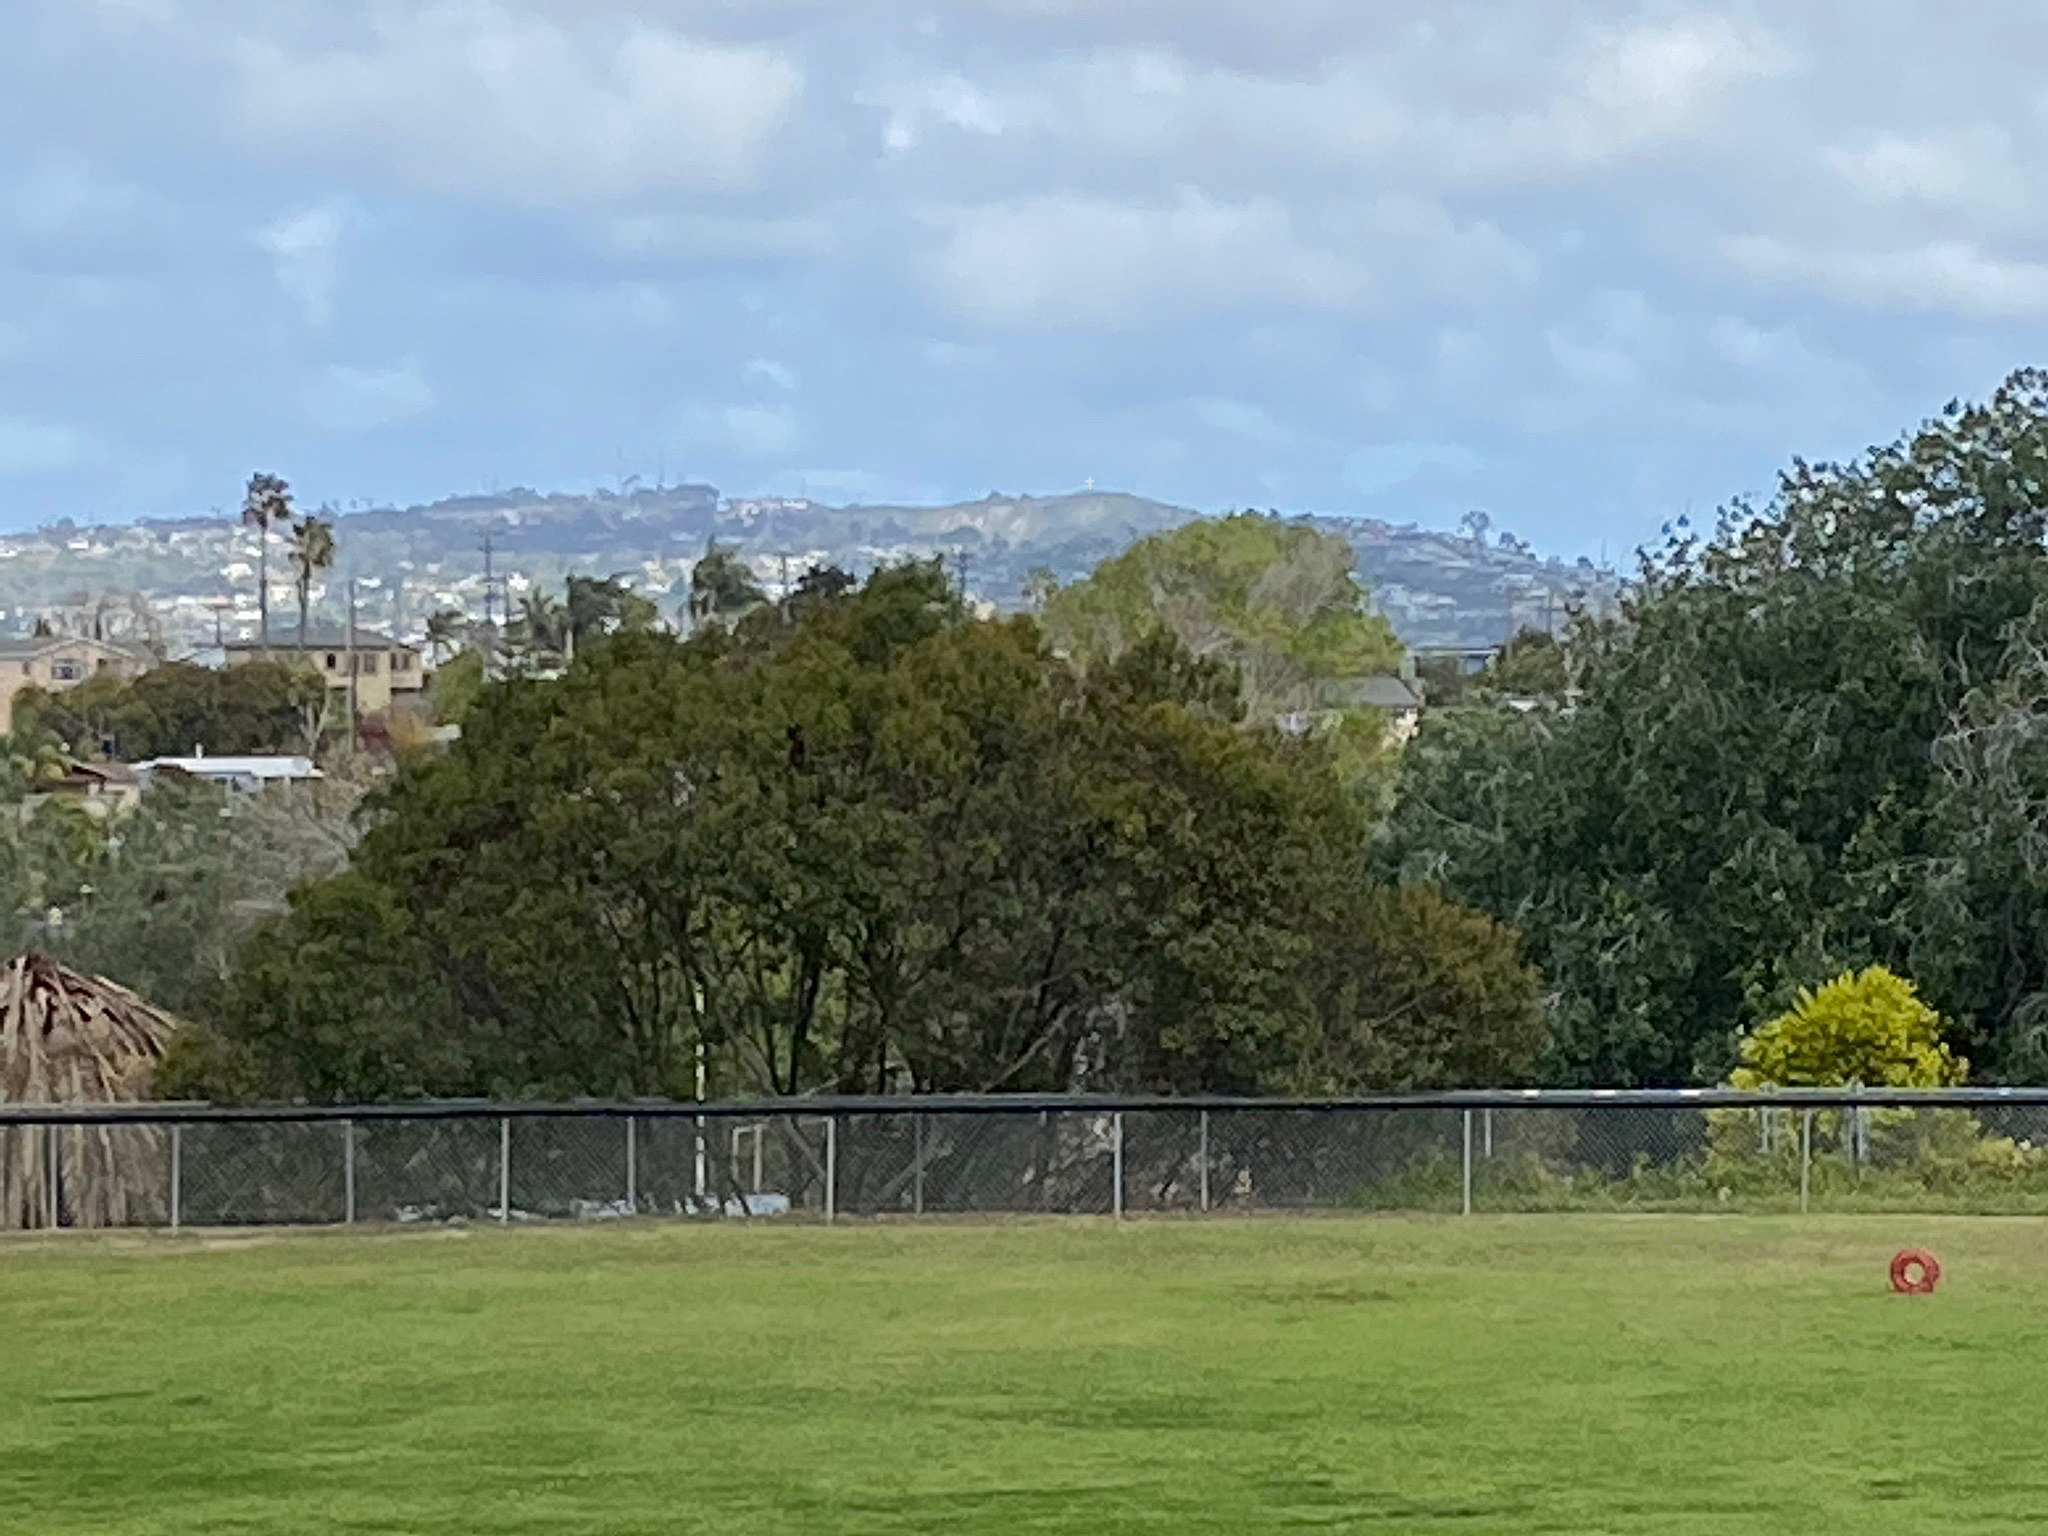
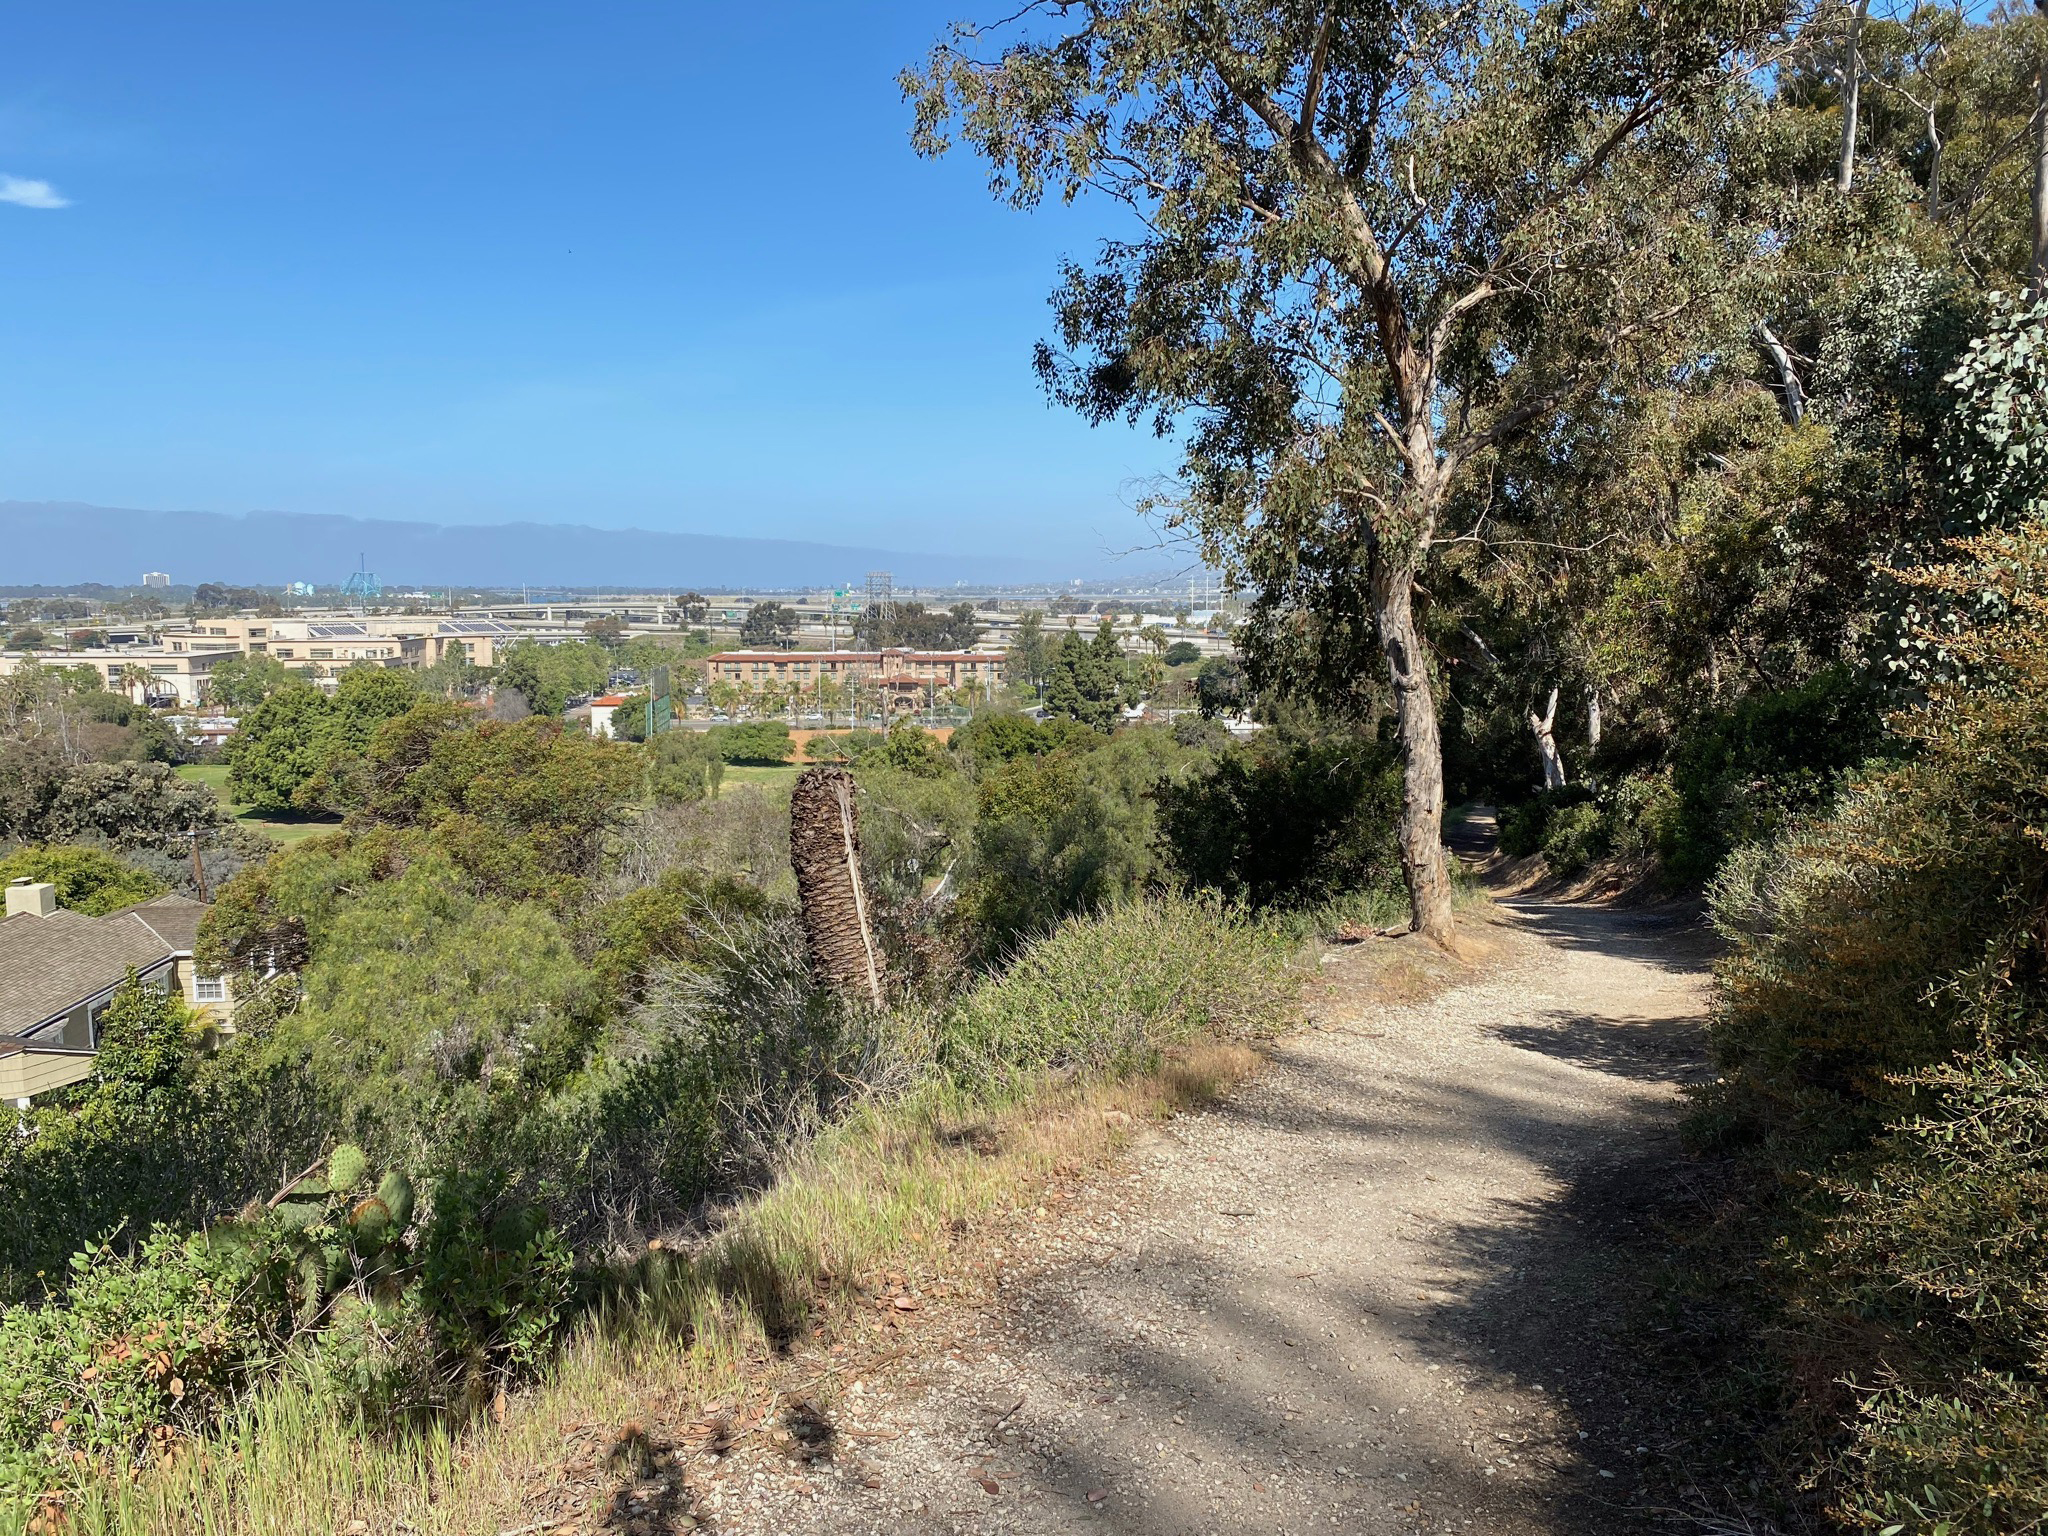
Fig. 109. View looking north from Tecolote Park baseball field toward Mount Soledad. |
|
A17
Rose Canyon Fault in the Old Town Area
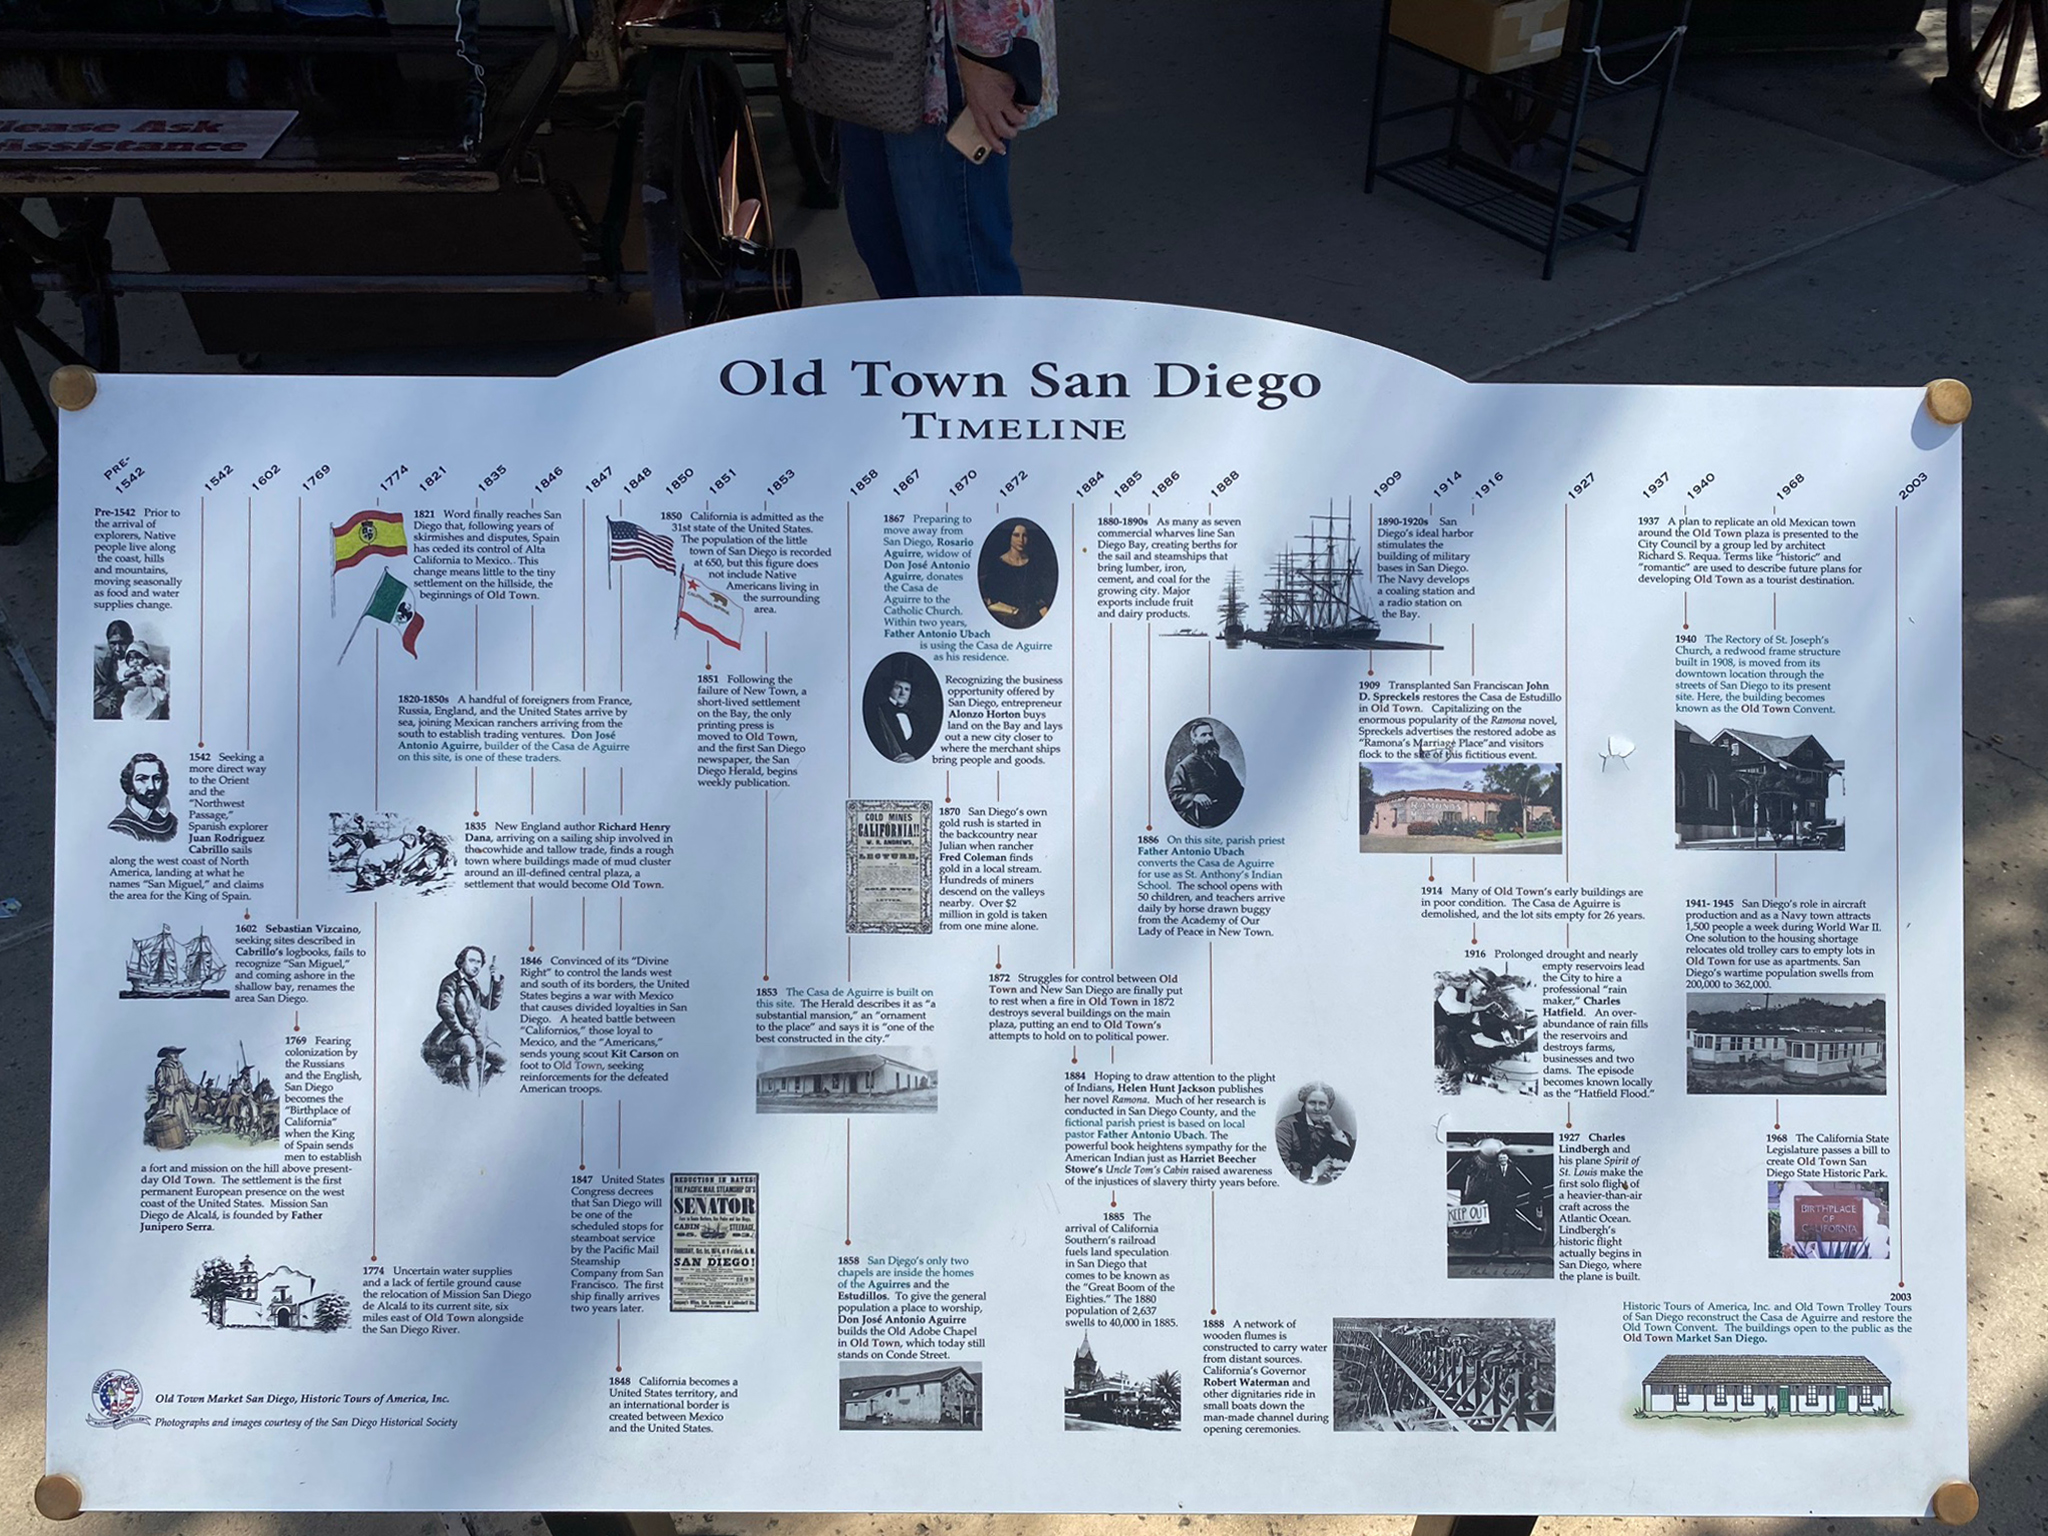
Old Town State Historic Park is a major tourist destination in San Diego. The historic park preserves the historic legacy of the Mexican and early American periods of 1821 to 1872. However, it is important to add that ancestral peoples inhabited this area for many thousands of years before the Spanish arrived. Spanish settlers moved in and built a mission and fort (presidio) on the nearby hilltop starting in 1769. The ruins mark the site of the first European settlement on the West Coast north of Mexico. Figure 110 is a park display with a historic timeline for the Old Town area.
Figure 111 is a map that shows the trace of the fault that runs along the east side of Old Town.
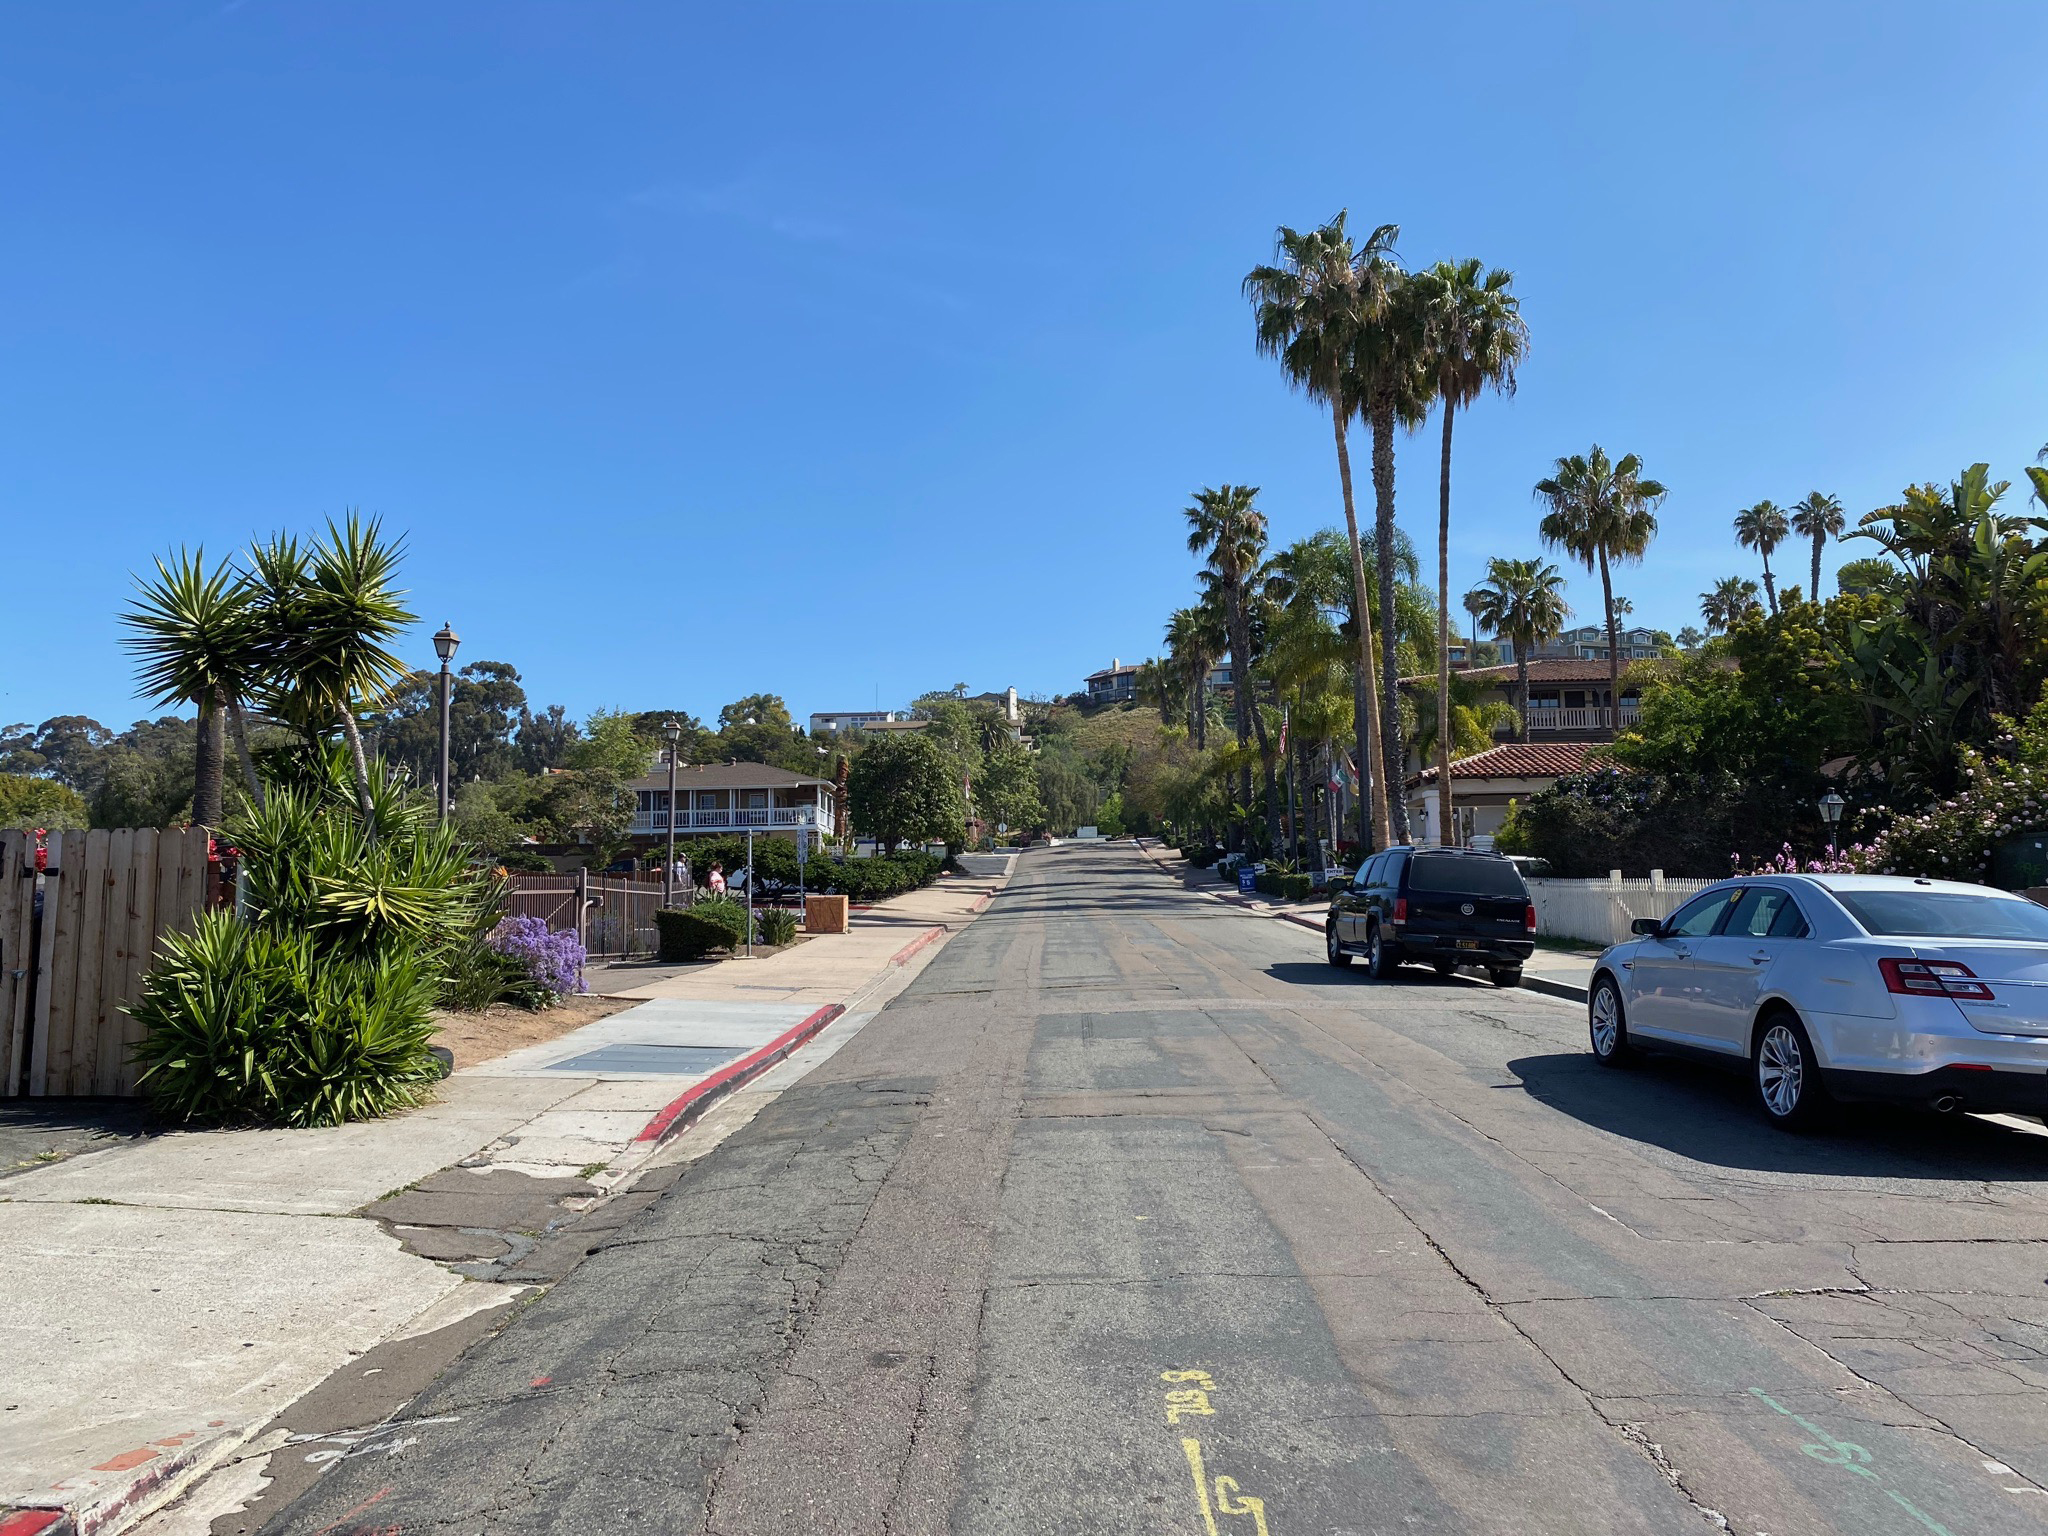
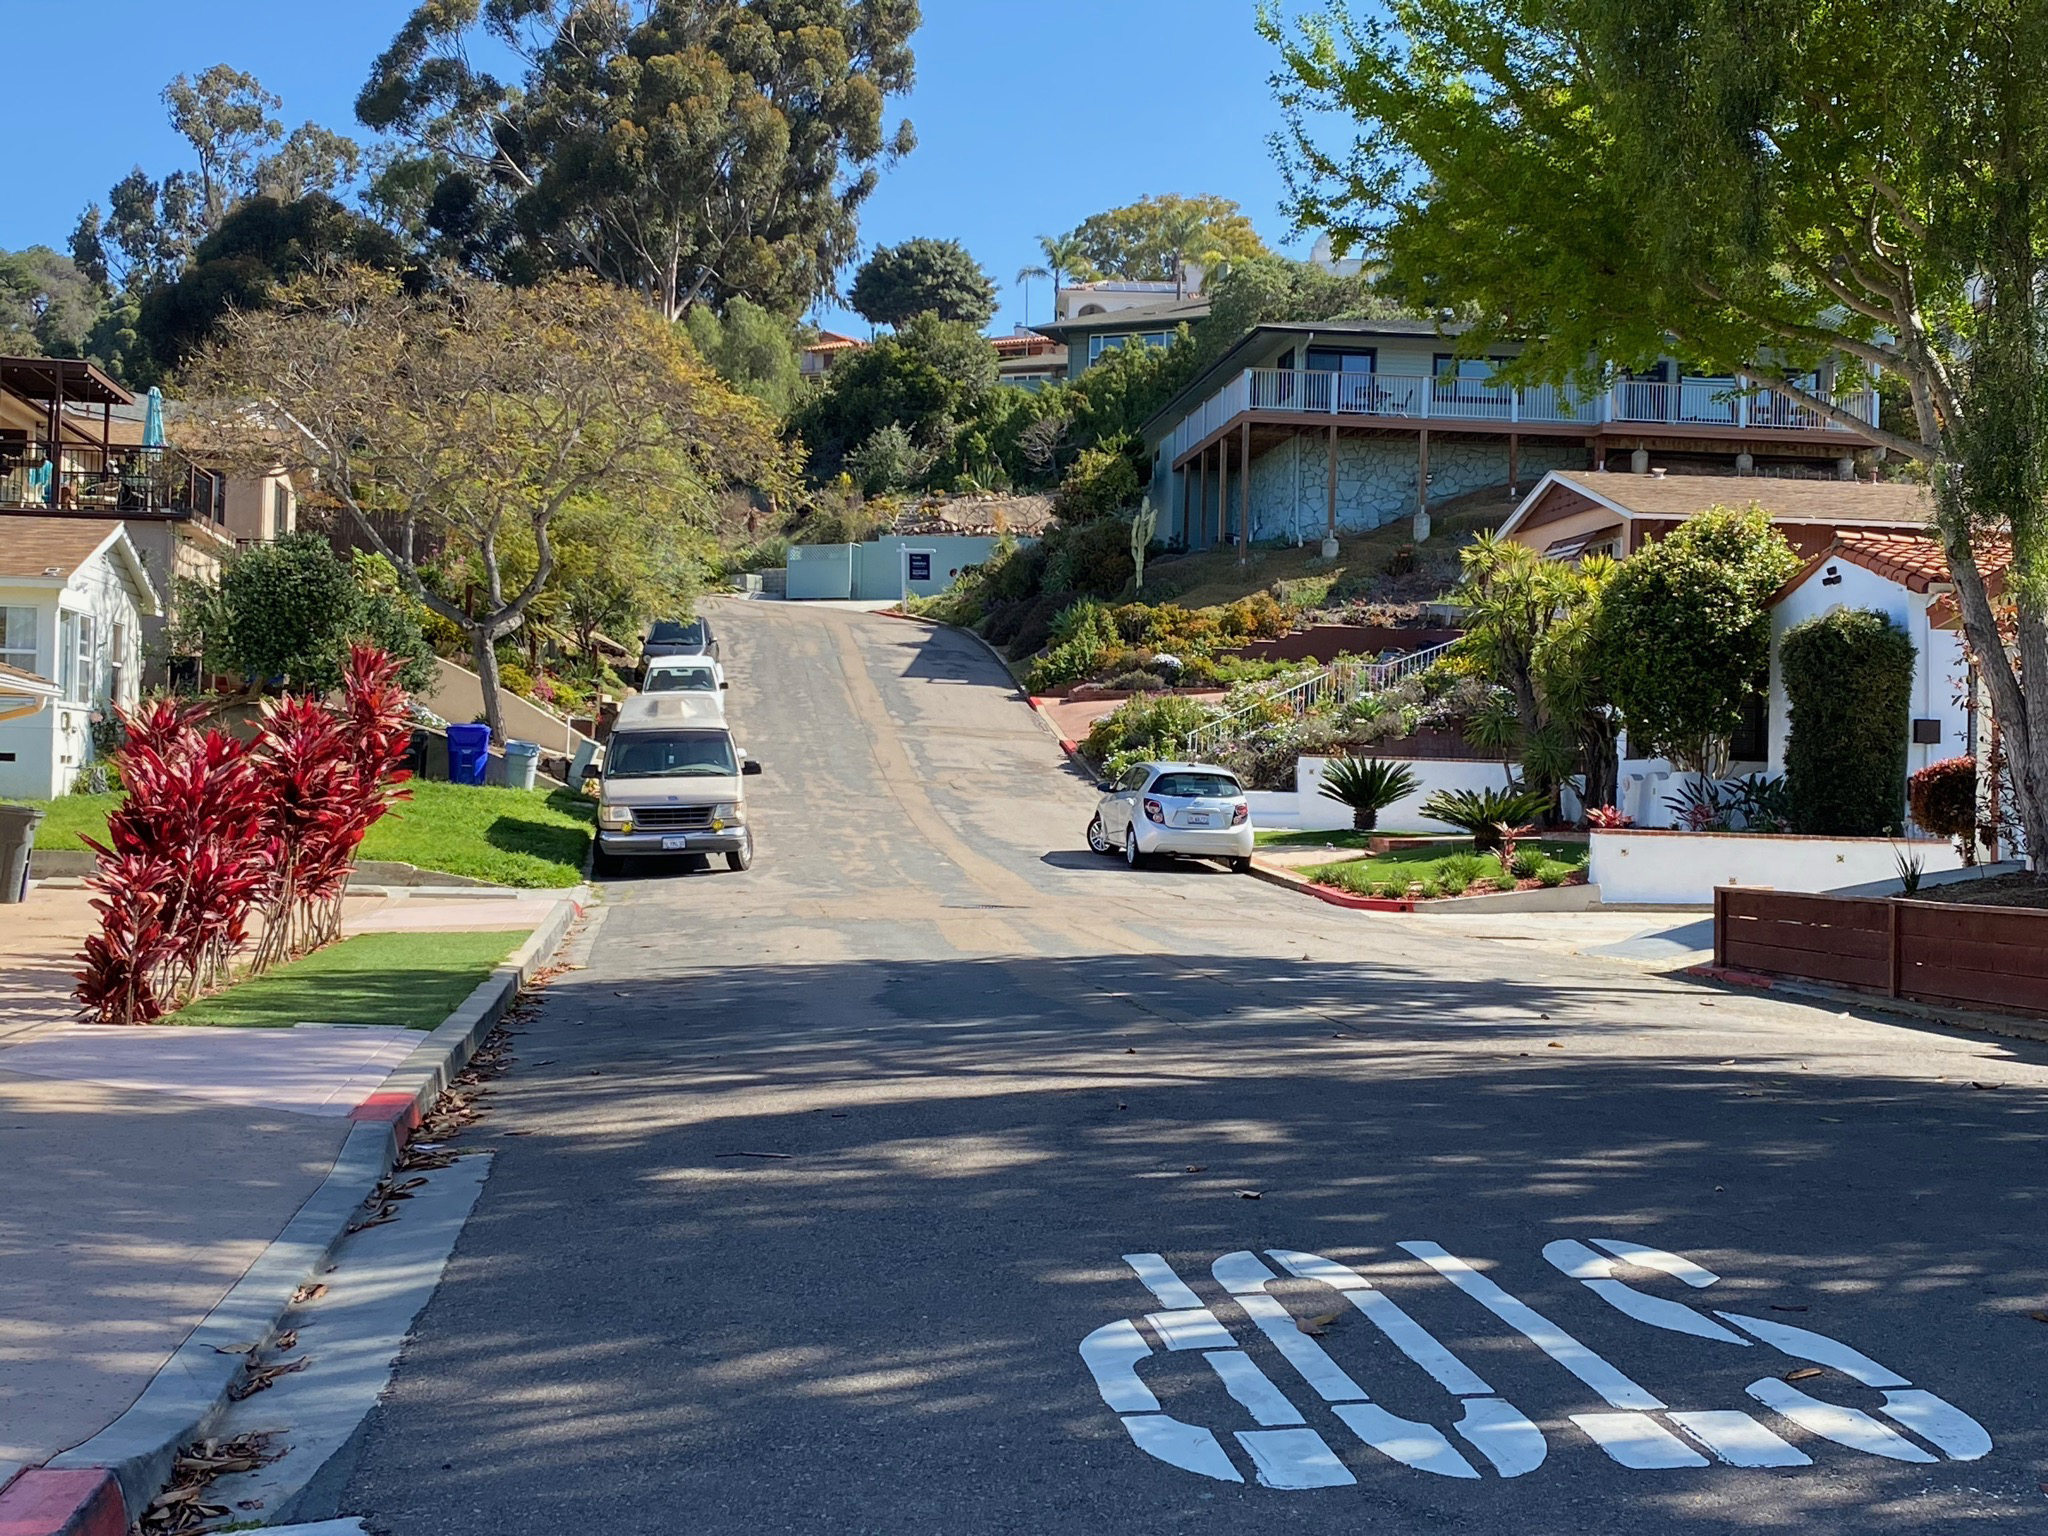
The Old Town community was constructed on the relatively level surface of the Nestor marine terrace (Figurs 112). Right-lateral motion along the fault has has deflected streams that incise into this last interglacial marine terrace. The fault line roughly parallels the break in slope that was once a sea cliff rising to the higher marine terrace (Figure 113). It is on this higher terrace where the ruins of the 1st Spanish mission and fort are located in Presidio Park near the Junípero Serra Museum.
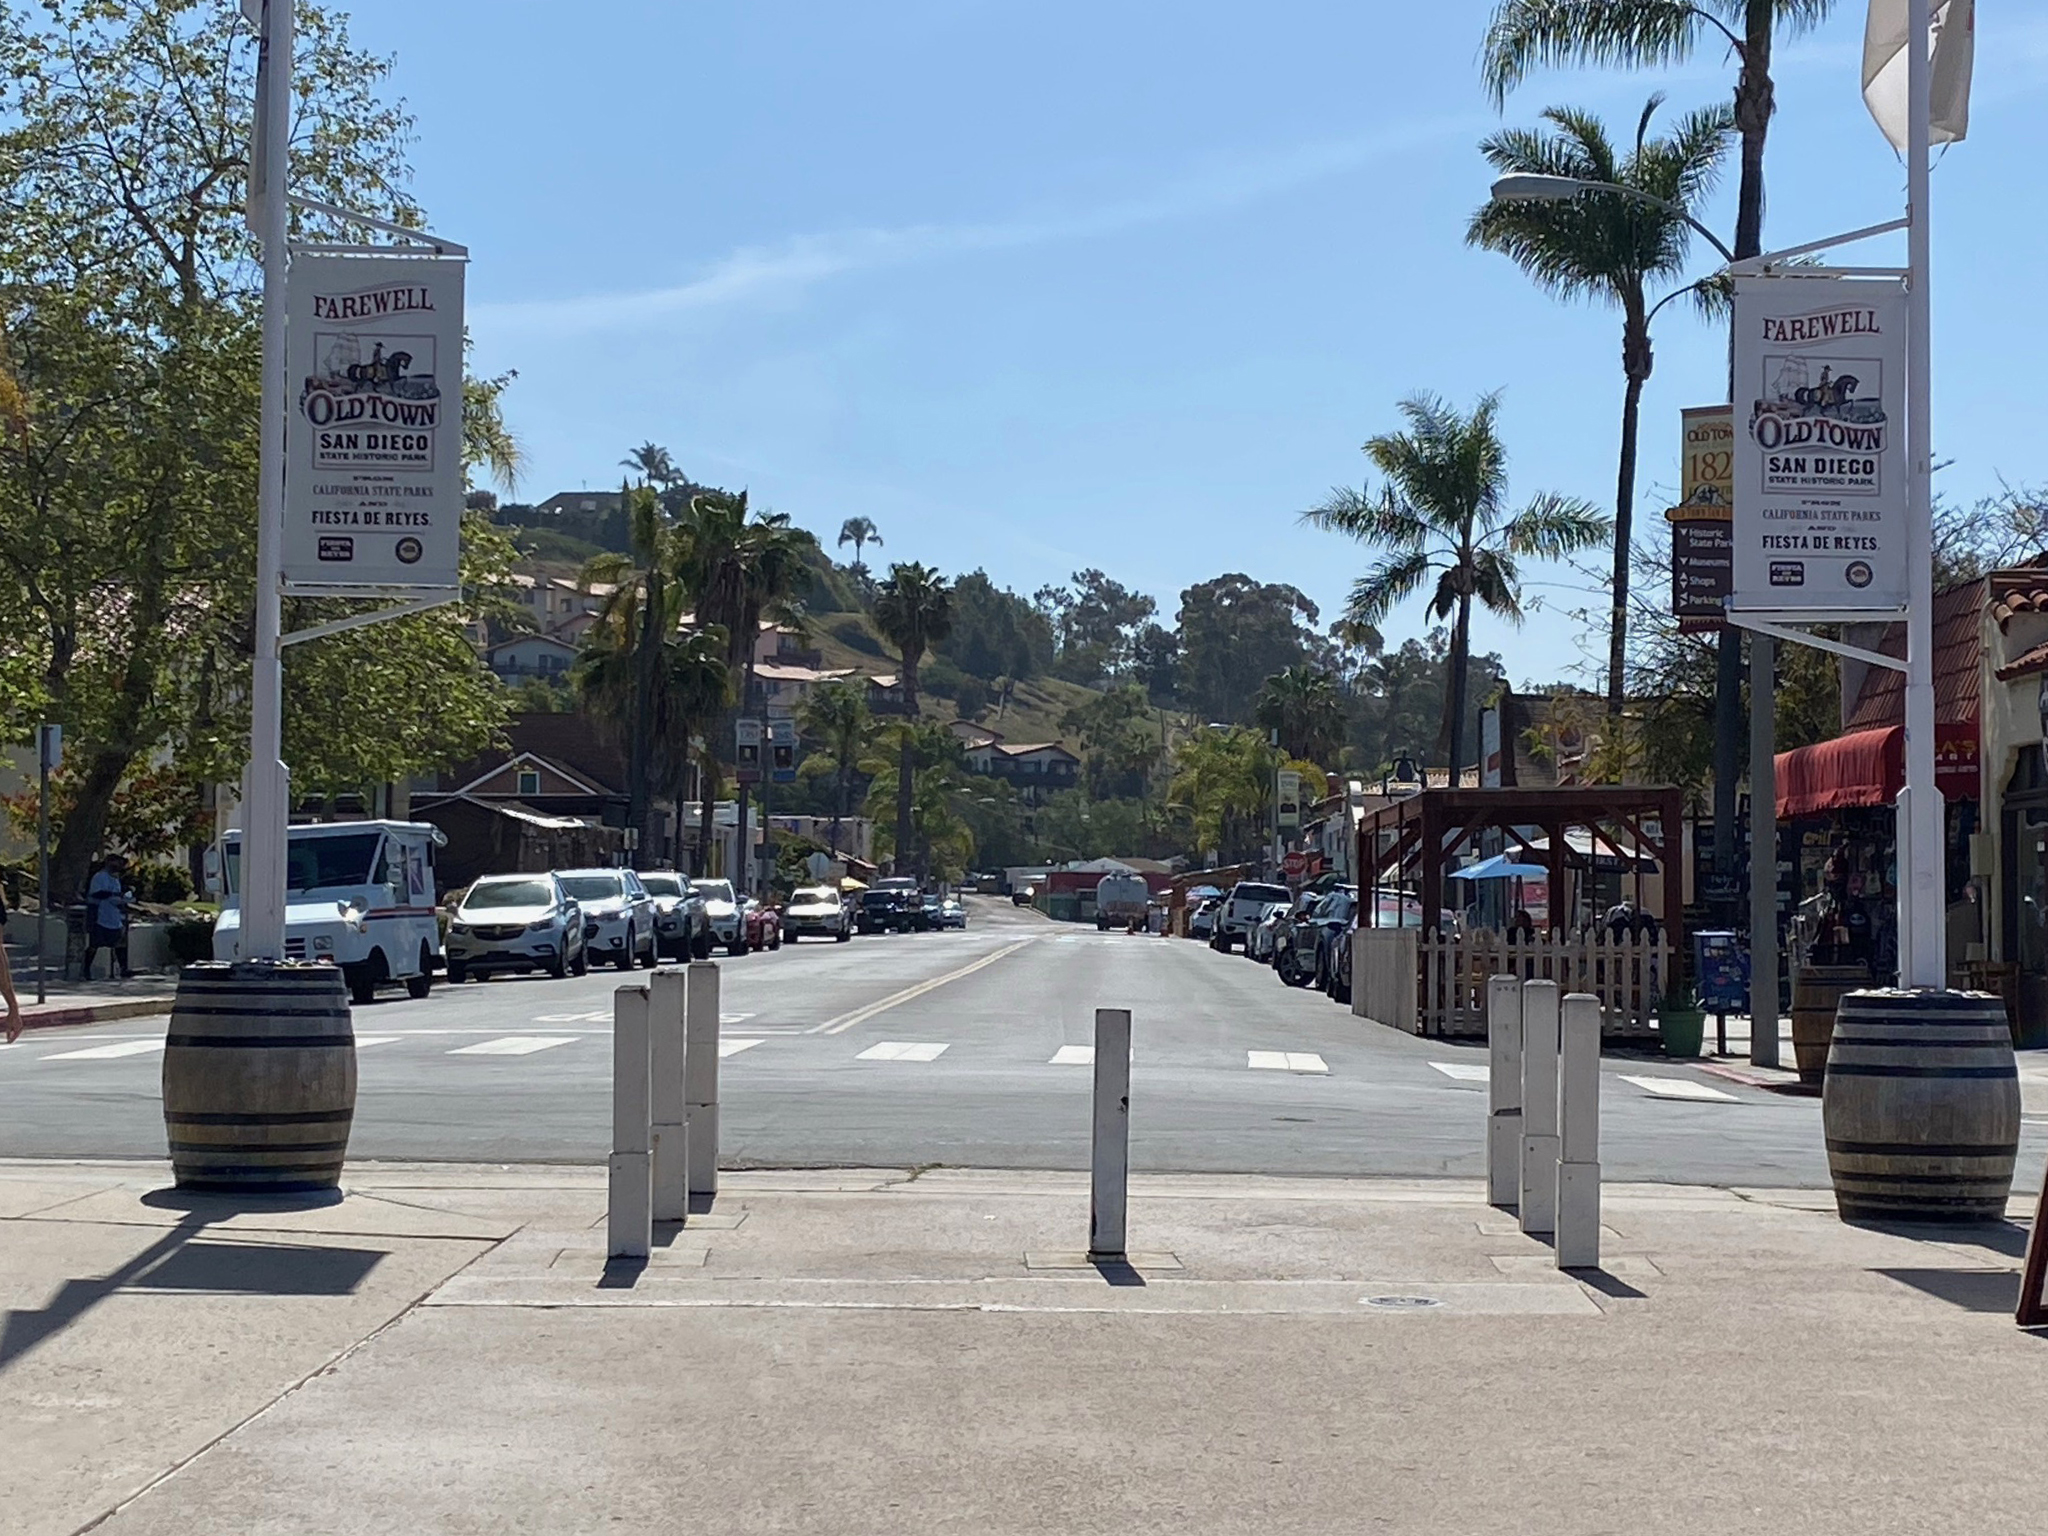
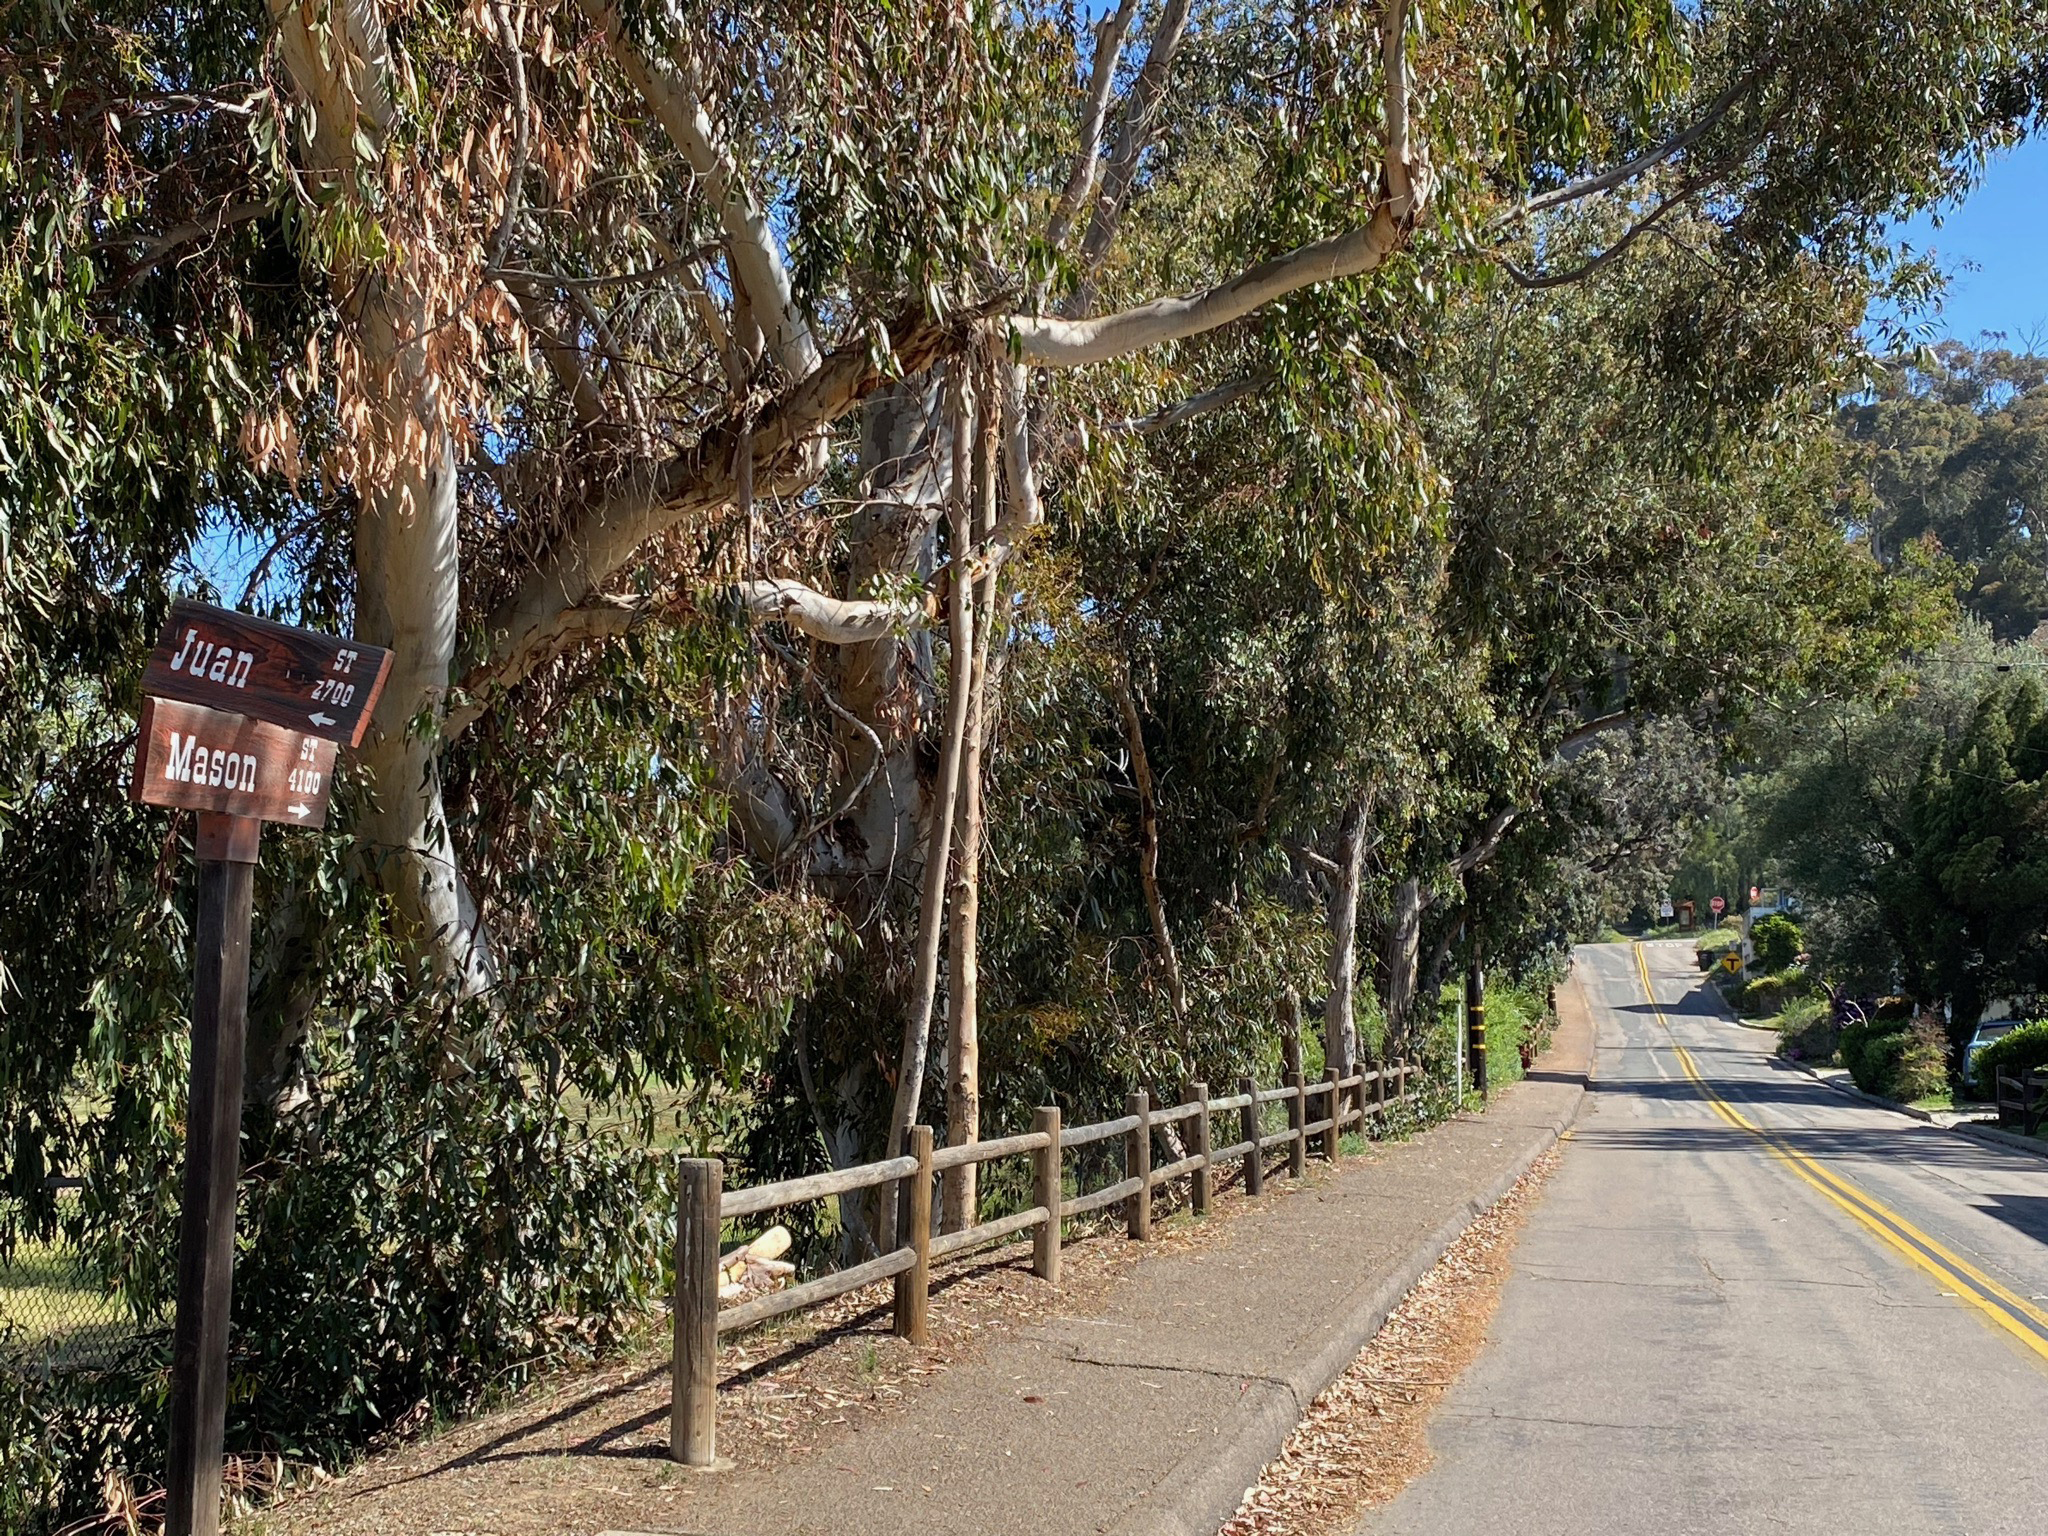
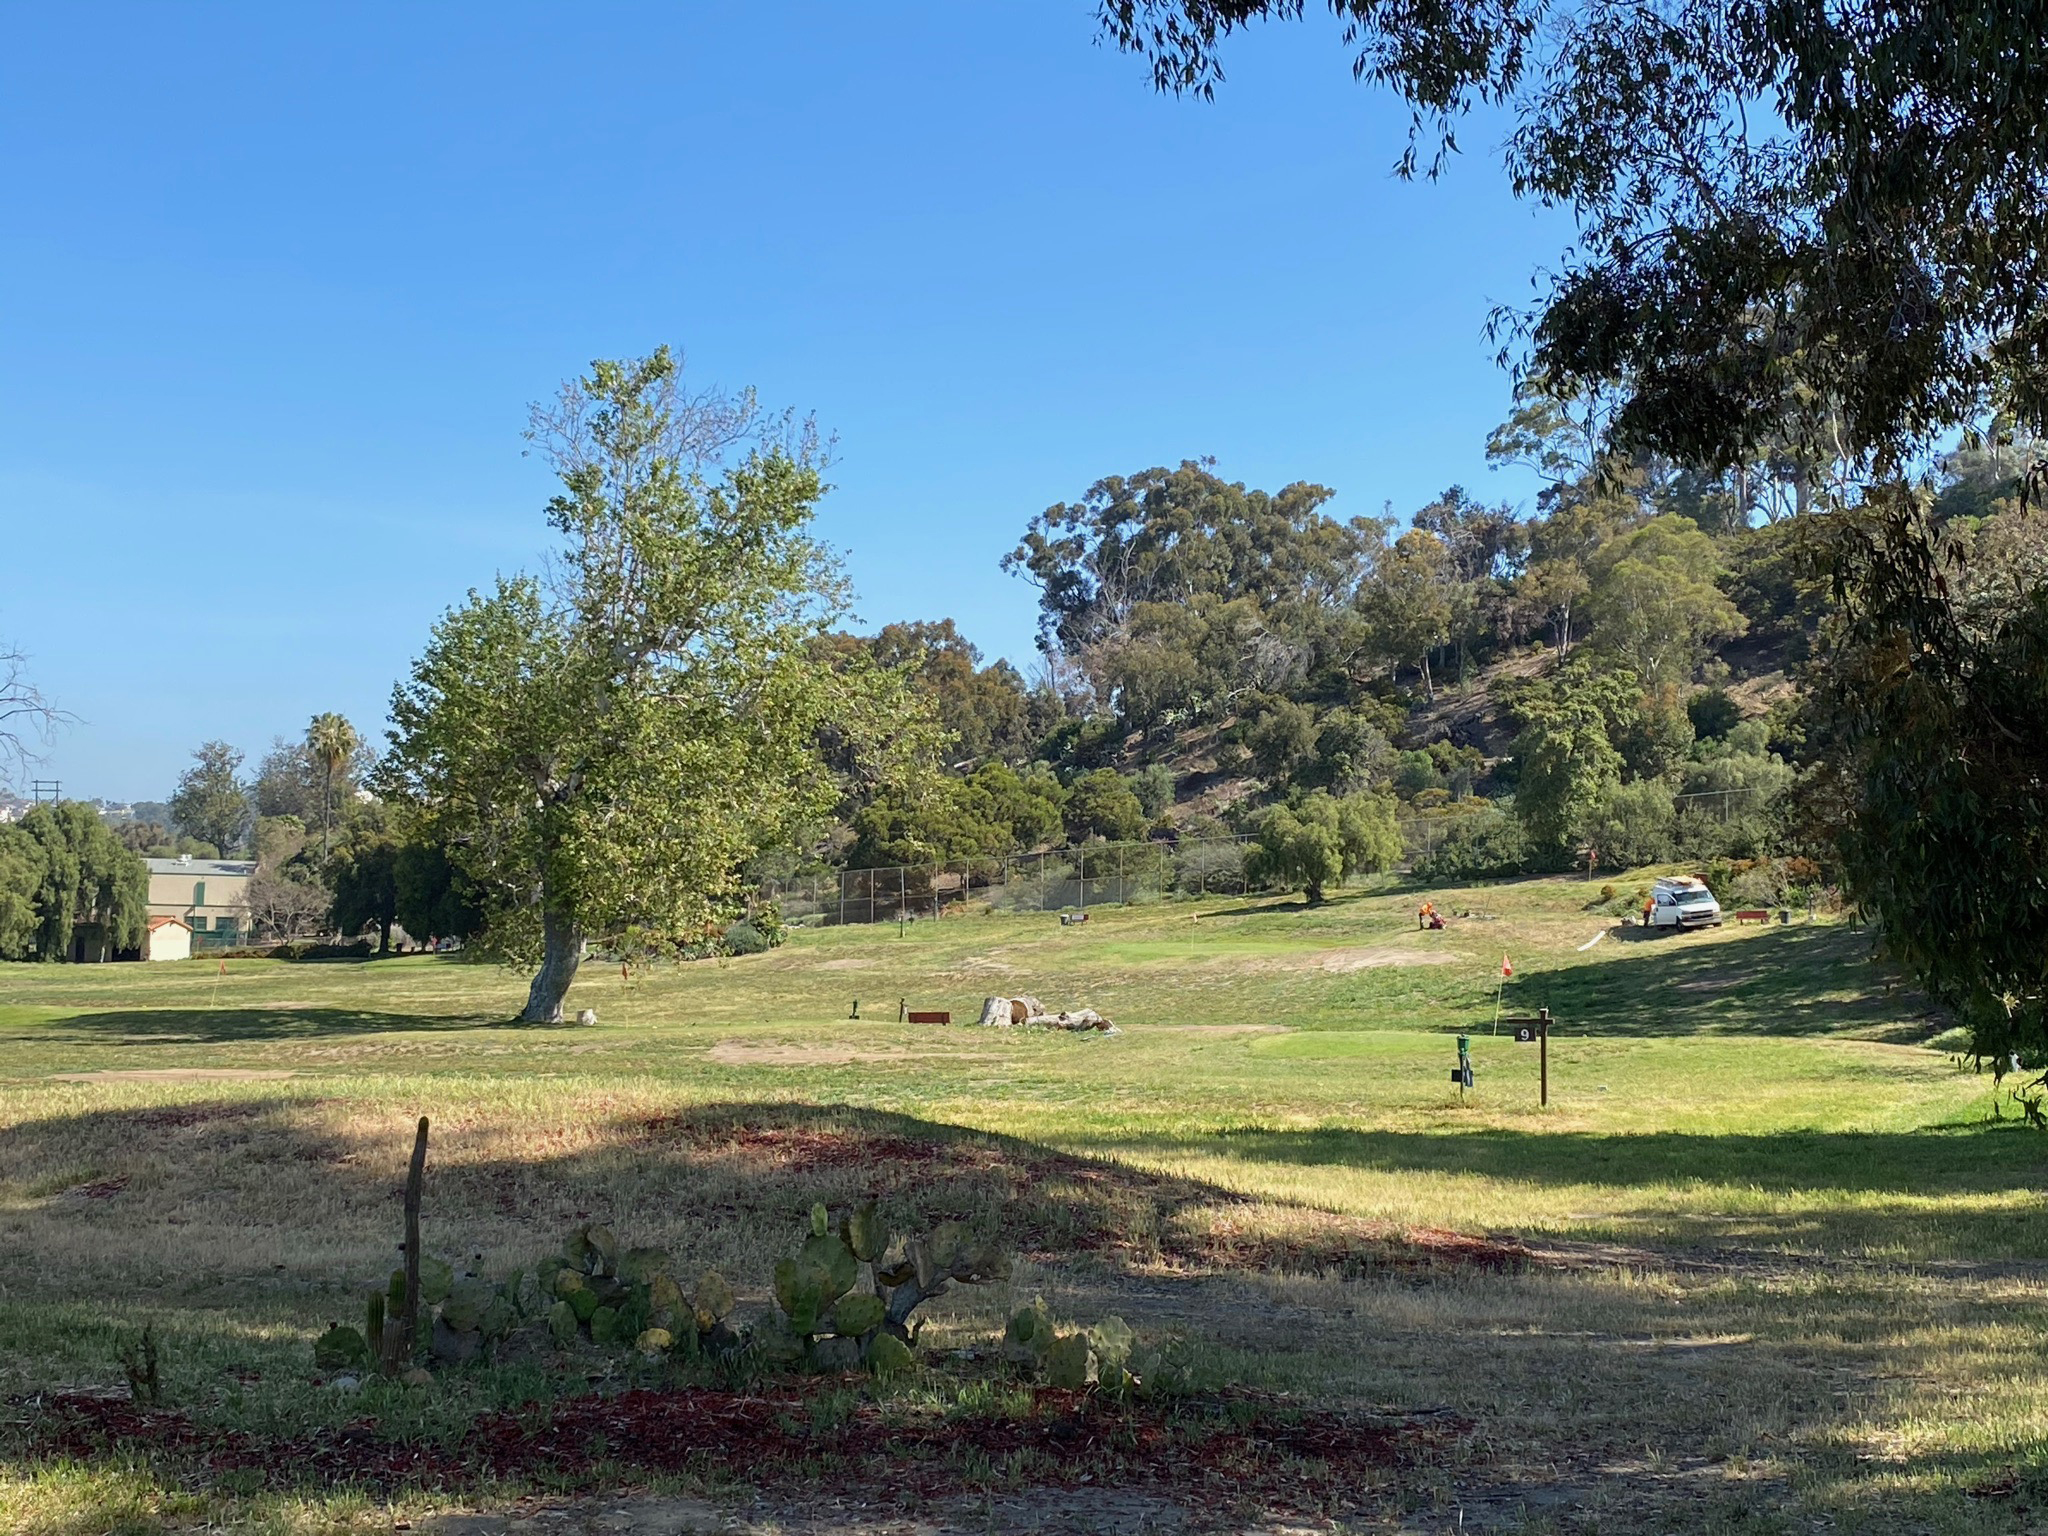
A walk through Old Town to explore the trace of the Rose Canyon Fault is a good way to see the area before enjoying a casual visit to the shops or a ejoy a meal in one of many local restaurants. The image tour below follows the fault northward starting near the intersection of Congress Street and San Diego Avenue (Figure 114). The fault line roughly parallels San Diego Avenue for several blocks before passing along the east side of the historic park area and crossing through the Presidio Hills Golf Course (Figures 115 to 121). You can roughly follow the fault scarp where it can be seen (inferred) as deflections in the slope of roads and sidewalks constructed over the fault line.
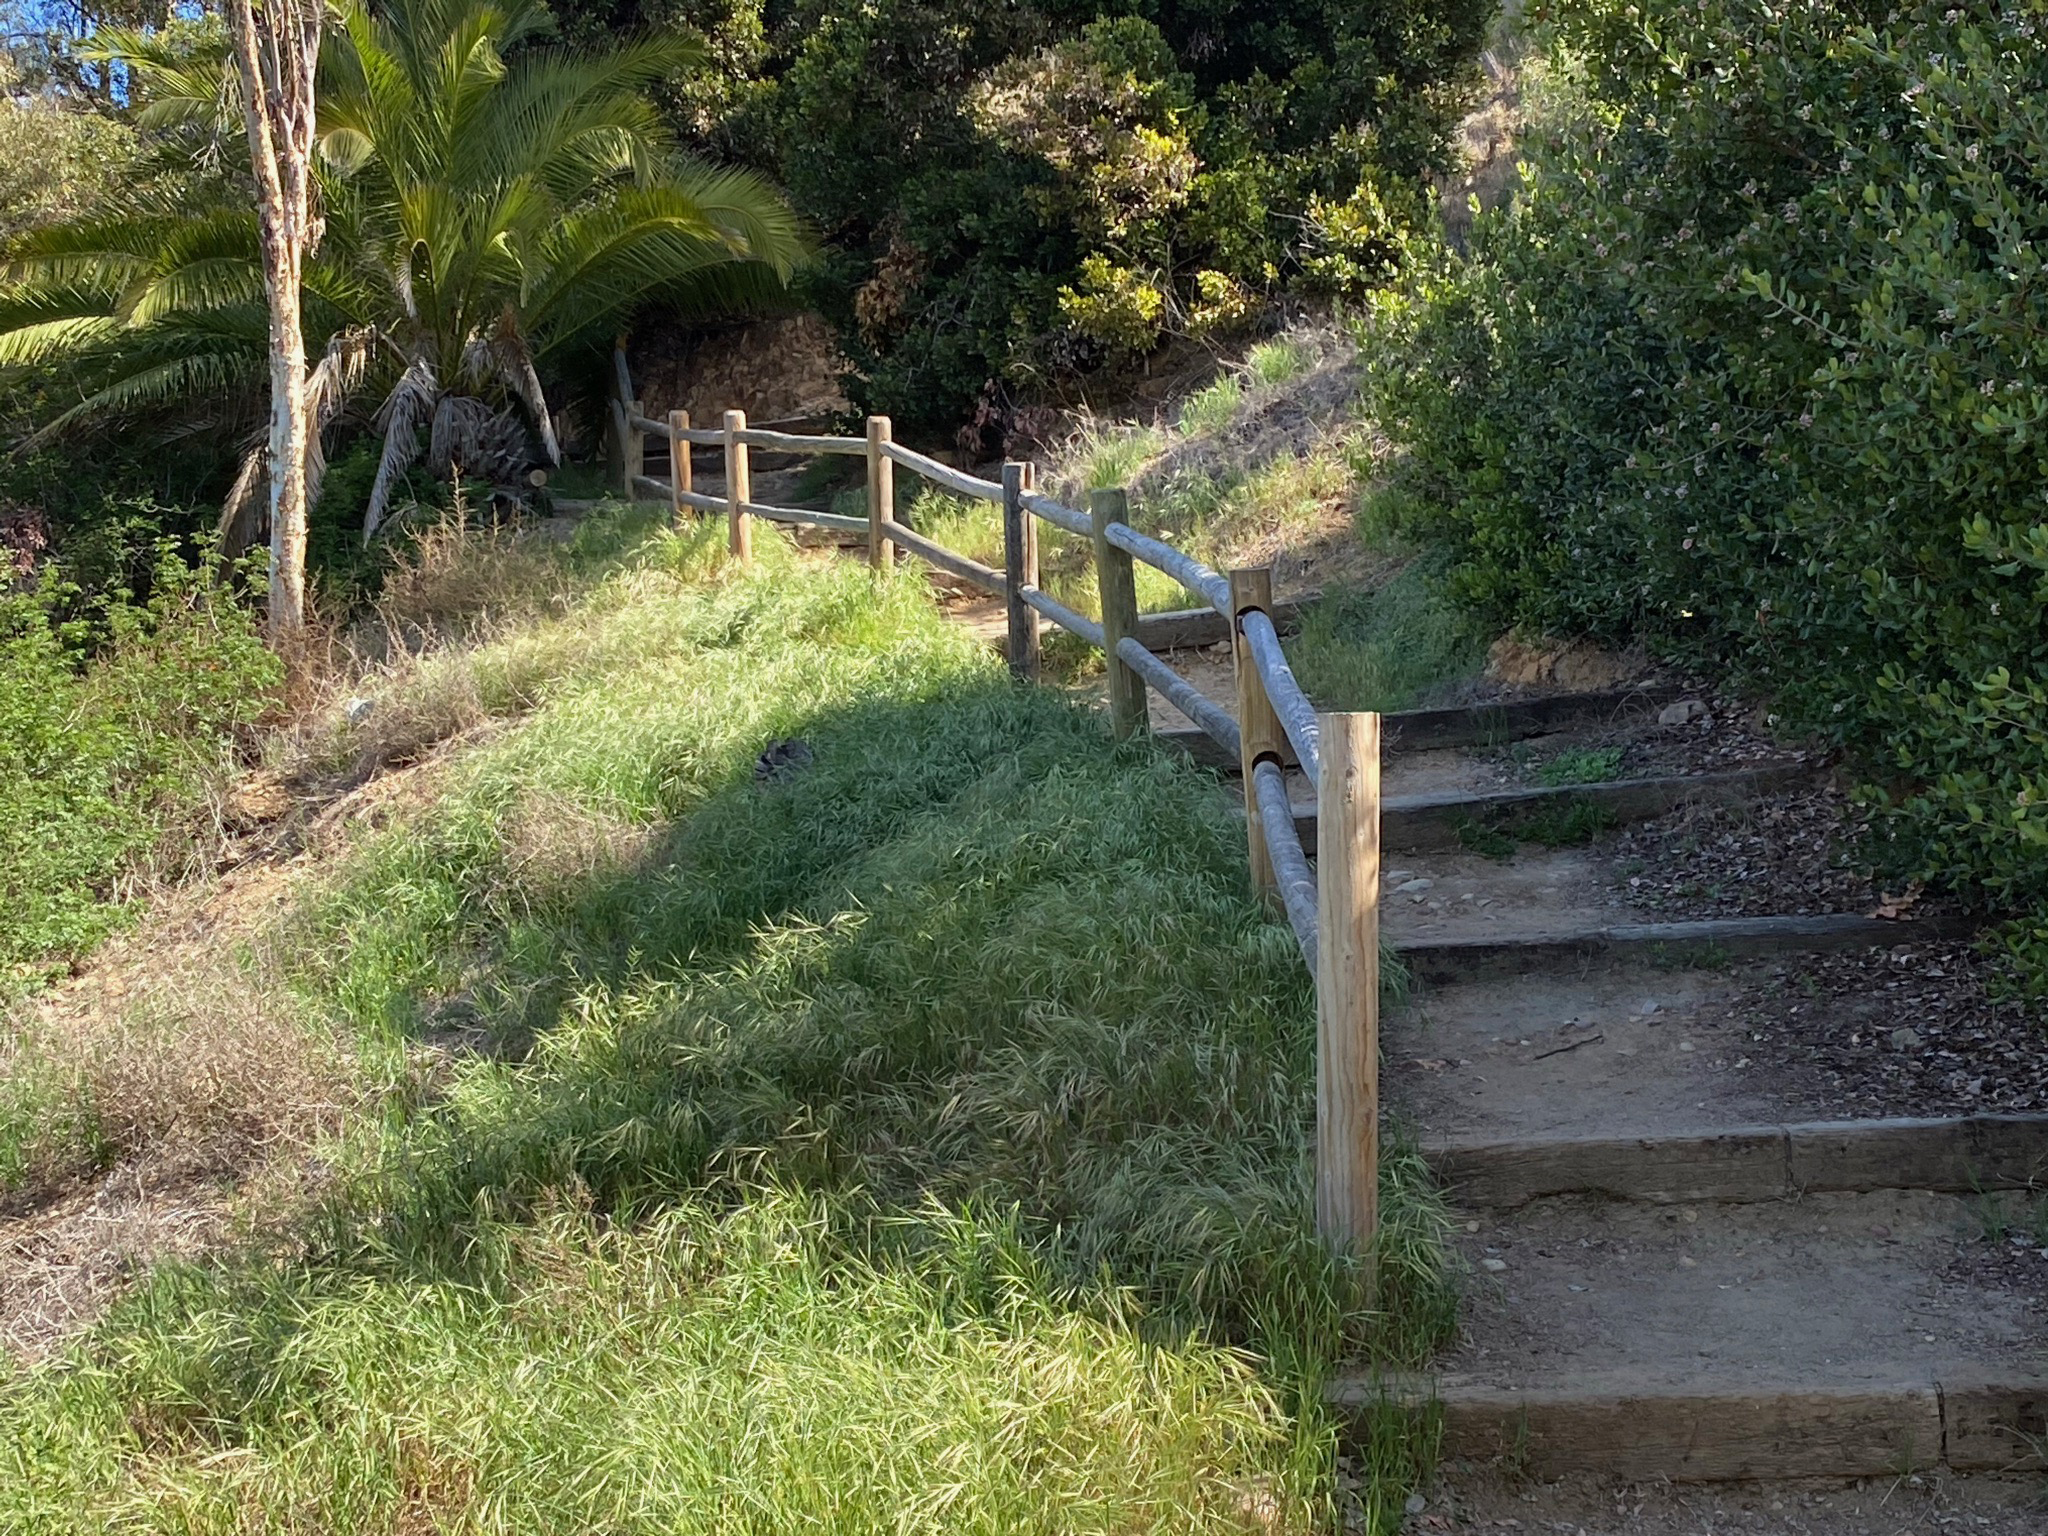
The hike up the Historic Old Presidio Trail crosses the fault on Mission Street east and then continues up the hillside to the top of Presidio Hill where the ruins of the old mission and fort are located. Along the trail you can see bedrock features exposed in cuts along the slope. Outcrops consist of heavily fractured and dipping Eocene-age sandstone beds unconformably overlain by Pleistocene conglomerate (poorly consolidated beds of gravel and sand)(Figures 123 to 125). The trail ends on the hilltop at the entrance to Presidio Park where views of the regional landscape can be appreciated (Figures 126 and 127).
According to a report by Singleton and other (2019), sediments studied in trenches across the fault have provided evidence that there has been four large surface-rupturing events and two smaller events during late Holocene time in the Old Town area. The youngest event that produced surface rupture probably occurred in association with the M 6 San Diego Earthquake of 1862. The larger events all occurred in the past 3300 years. Their results suggest that the late-Holocene earthquake recurrence interval of about 700 years.
|

Fig. 110. A display in the state park provides a timeline summarizing the history of Old Town in the San Diego area. (Zoom in to view content.)
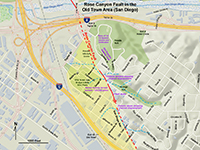
Fig. 111. Rose Canyon Fault in San Diego's Old Town area.
|
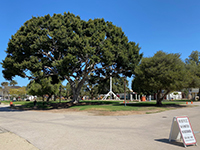
Fig. 112. The flat surface level of the Nestor marine terrace is preserved in the Old Town Historic District plaza. |

Fig. 113. View south along Jackson Street from Old Town Historic District with ancient elevated sea cliff (slope). |
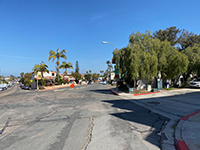
Fig. 114. View looking north along San Diego Street. Congress Street to left, Ampudia Street to right. |
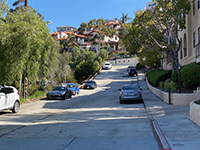
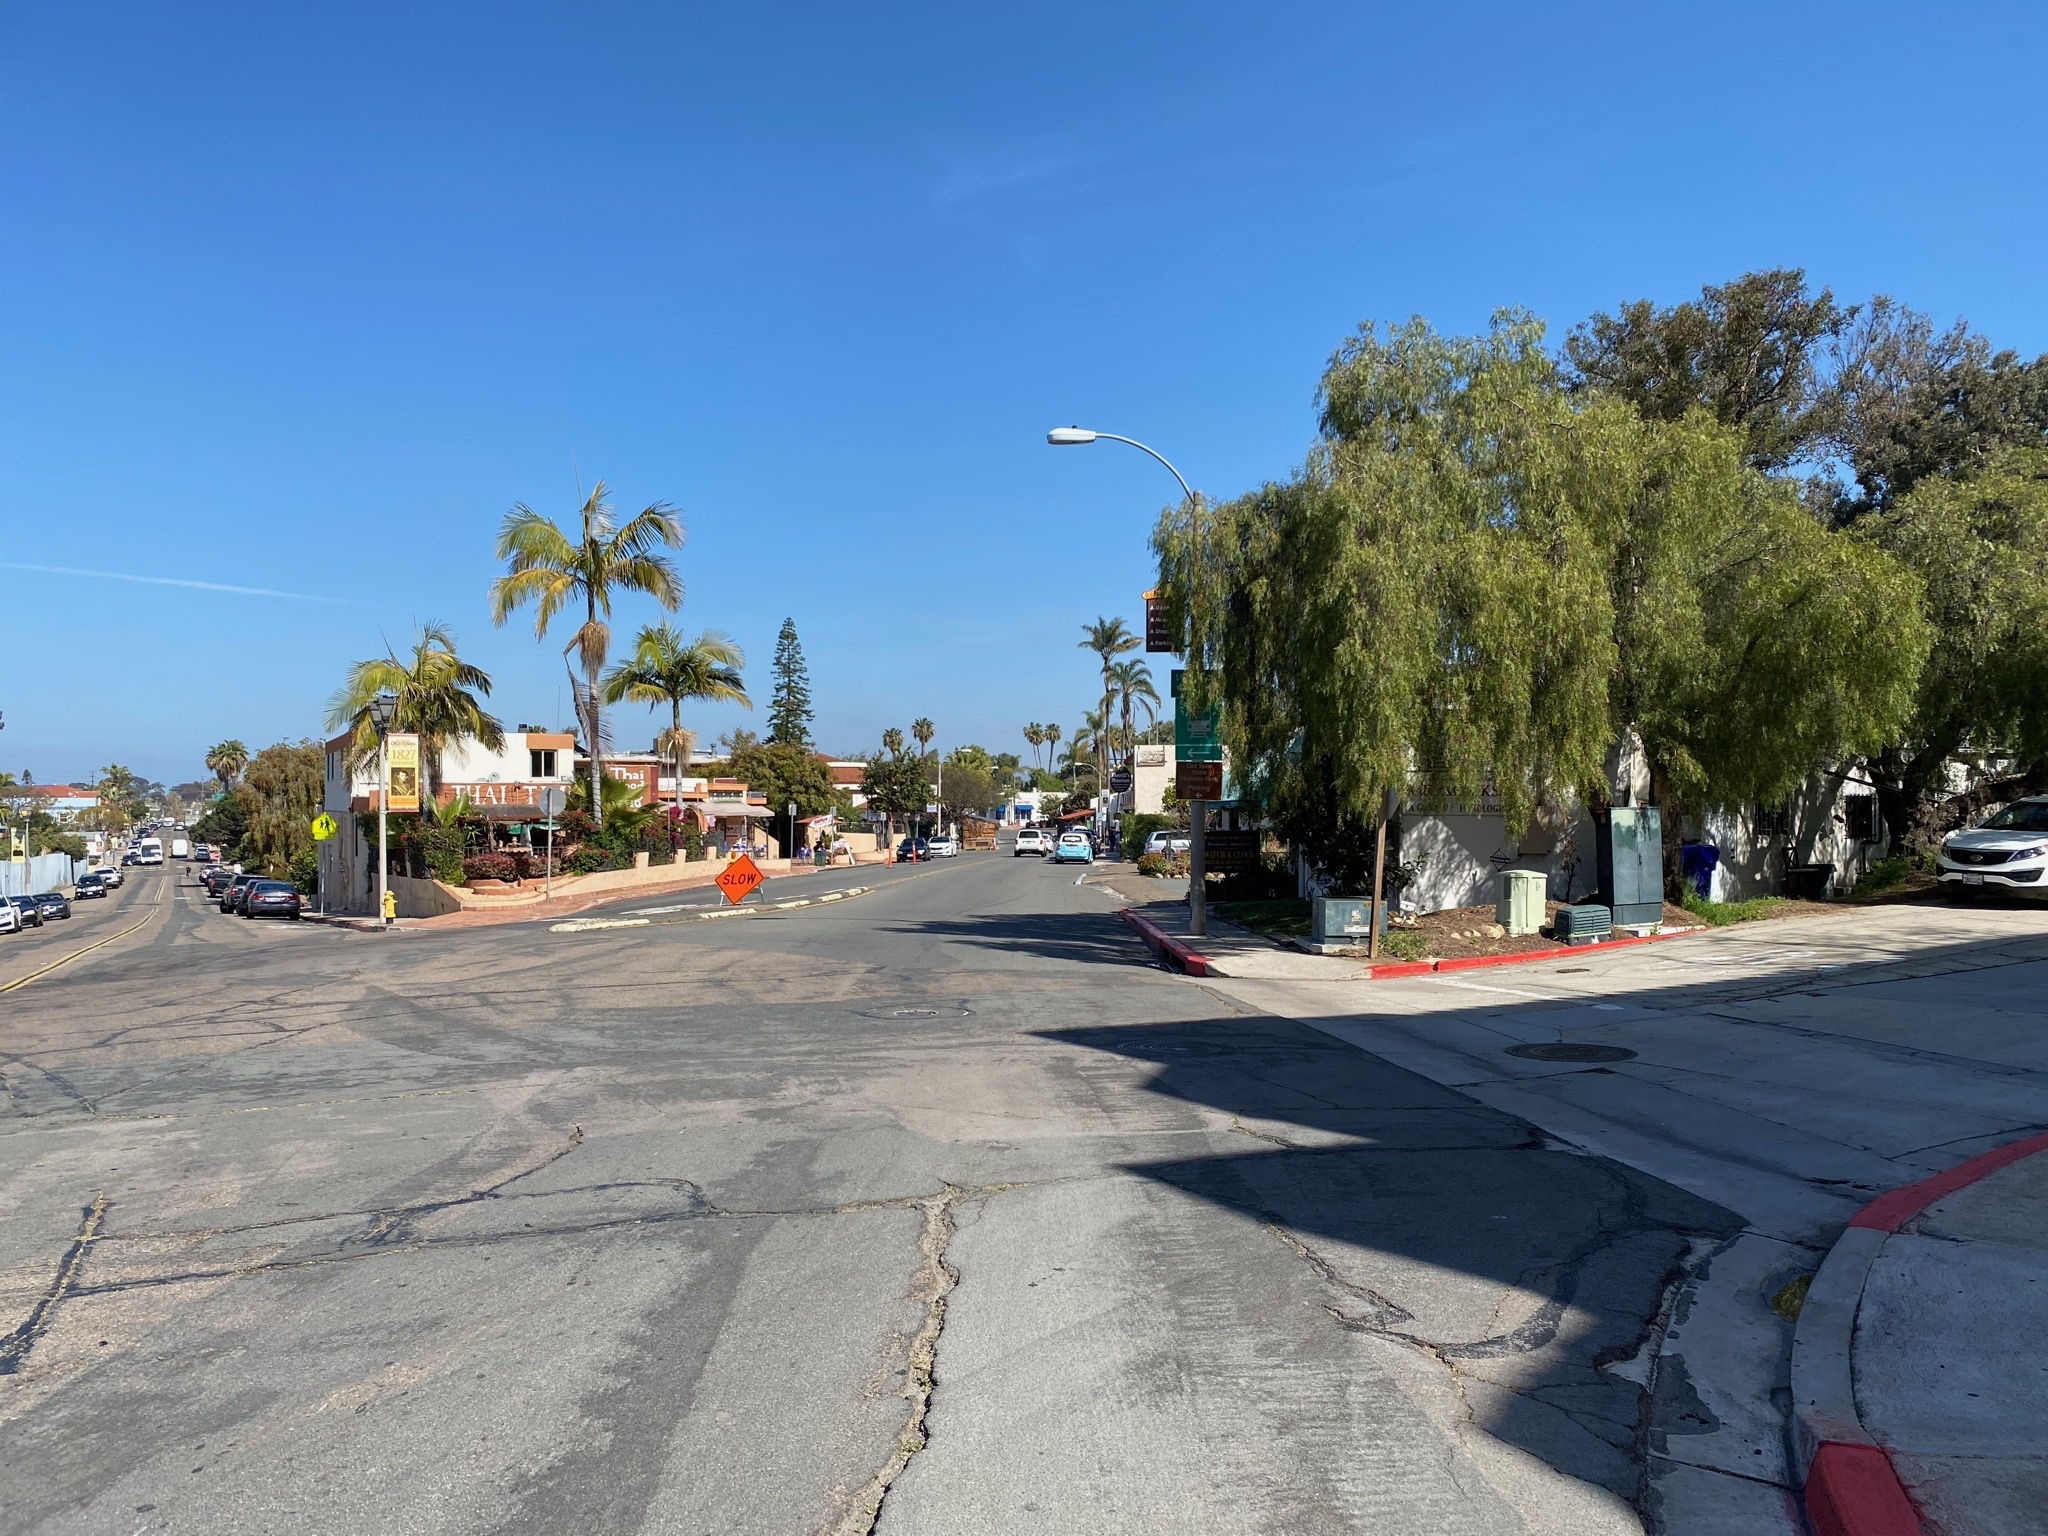
Fig. 115. The change to a sleeper slope on Ampudia Street reveals location of the fault line. |

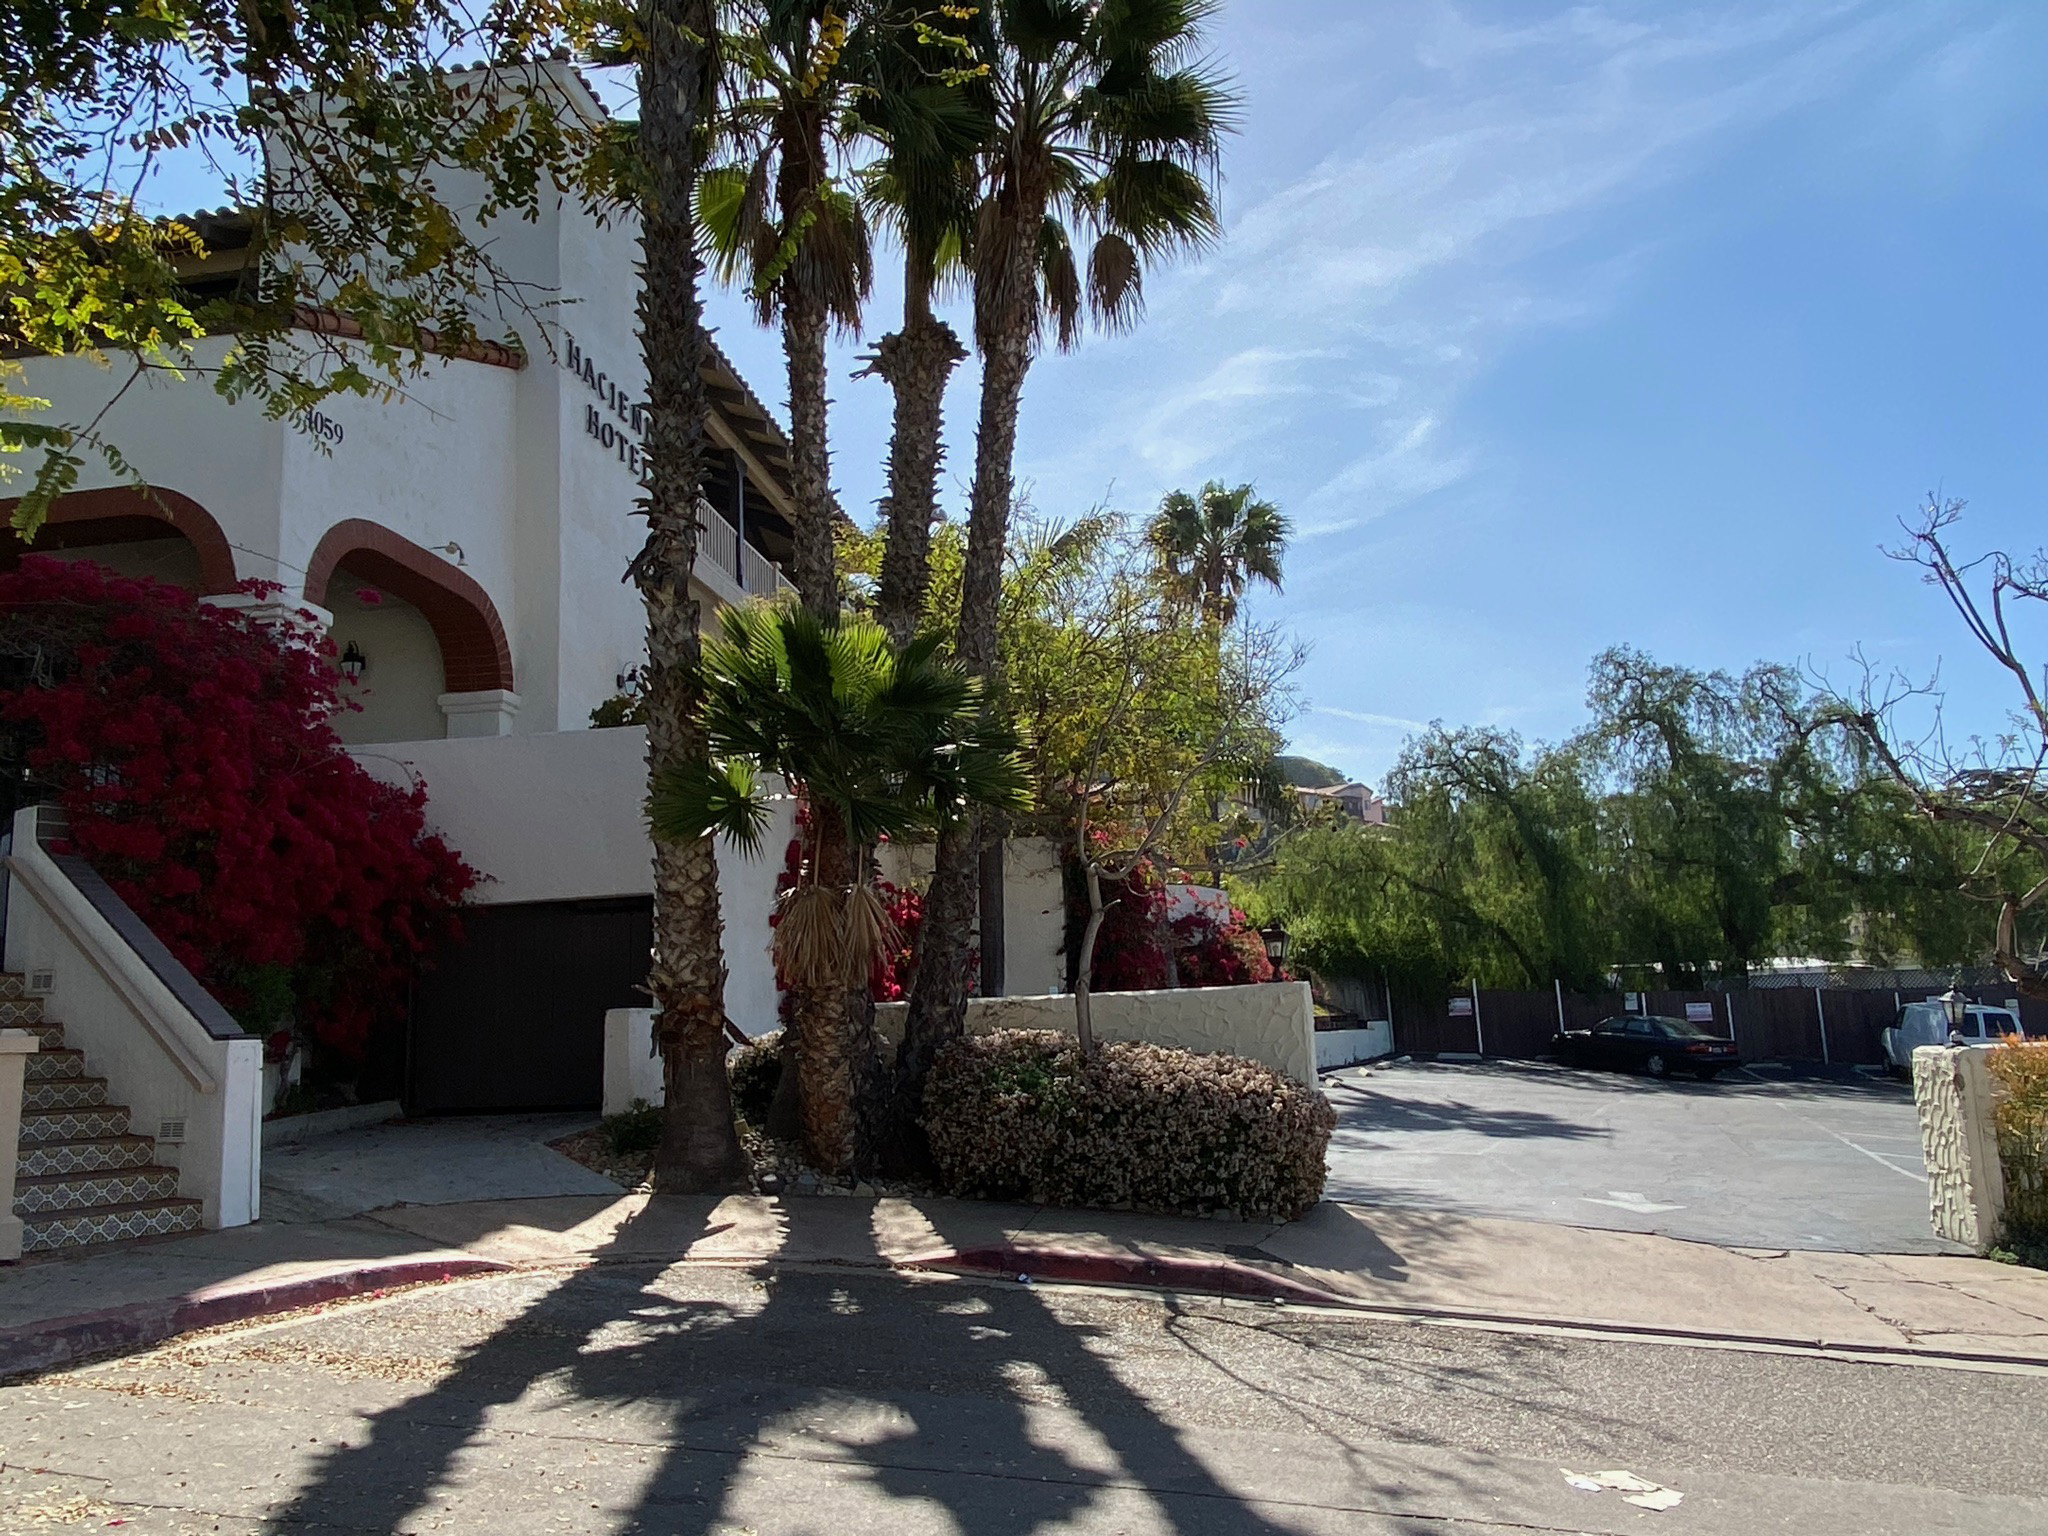
Fig. 116. The fault line passes through the parking lot in front of the Hacienda Hotel on Conde Street. |
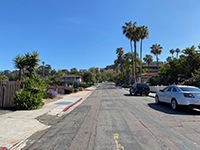
Fig. 117. The change to a steeper slope on Hamey Street near Juan Street shows the fault line location. |

Fig. 118. The change to a steeper slope on Twiggs Street near Juan Street shows the fault line location. |
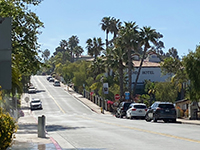
Fig. 119. The change on Juan Street shows the fault line location and slope rise to the next higher marine terrace. |
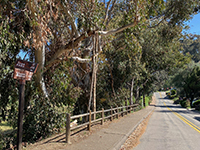
Fig. 120. The Historic Old Presidio Trail follows Mason Street across the fault line next to the golf course. |

Fig. 121. The fault line roughly follows the stream drainage northward across the Presidio Hills Golf Course. |
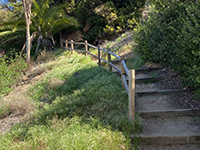
Fig. 122. The Historic Old Presidio Trail ascends the ancient sea cliff to the top of the next marine terrace. |
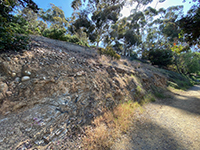
Fig. 123. View of Pleistocene gravels and Eocene sandstone outcrop along the Historic Old Presidio Trail. |

Fig. 124. Unconformity between north-dipping Eocene-age sandstone beds and Pleistocene gravels. |
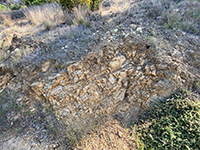
Fig. 125. Heavily fractured Eocene sandstone outcrop exposed along the Historic Old Presidio Trail. |
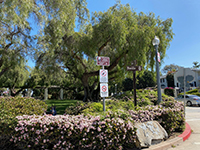
Fig. 126. Presidio Park with the Serra Museum is located on the top of the mesa east of Old Town.
|
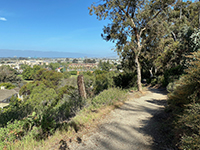
Fig. 127. View looking north from the Historic Old Presidio Trail with the Mount Soledad highlands in the distance. |
|
A18
The Rose Canyon Fault Zone in San Diego and Coronado Island
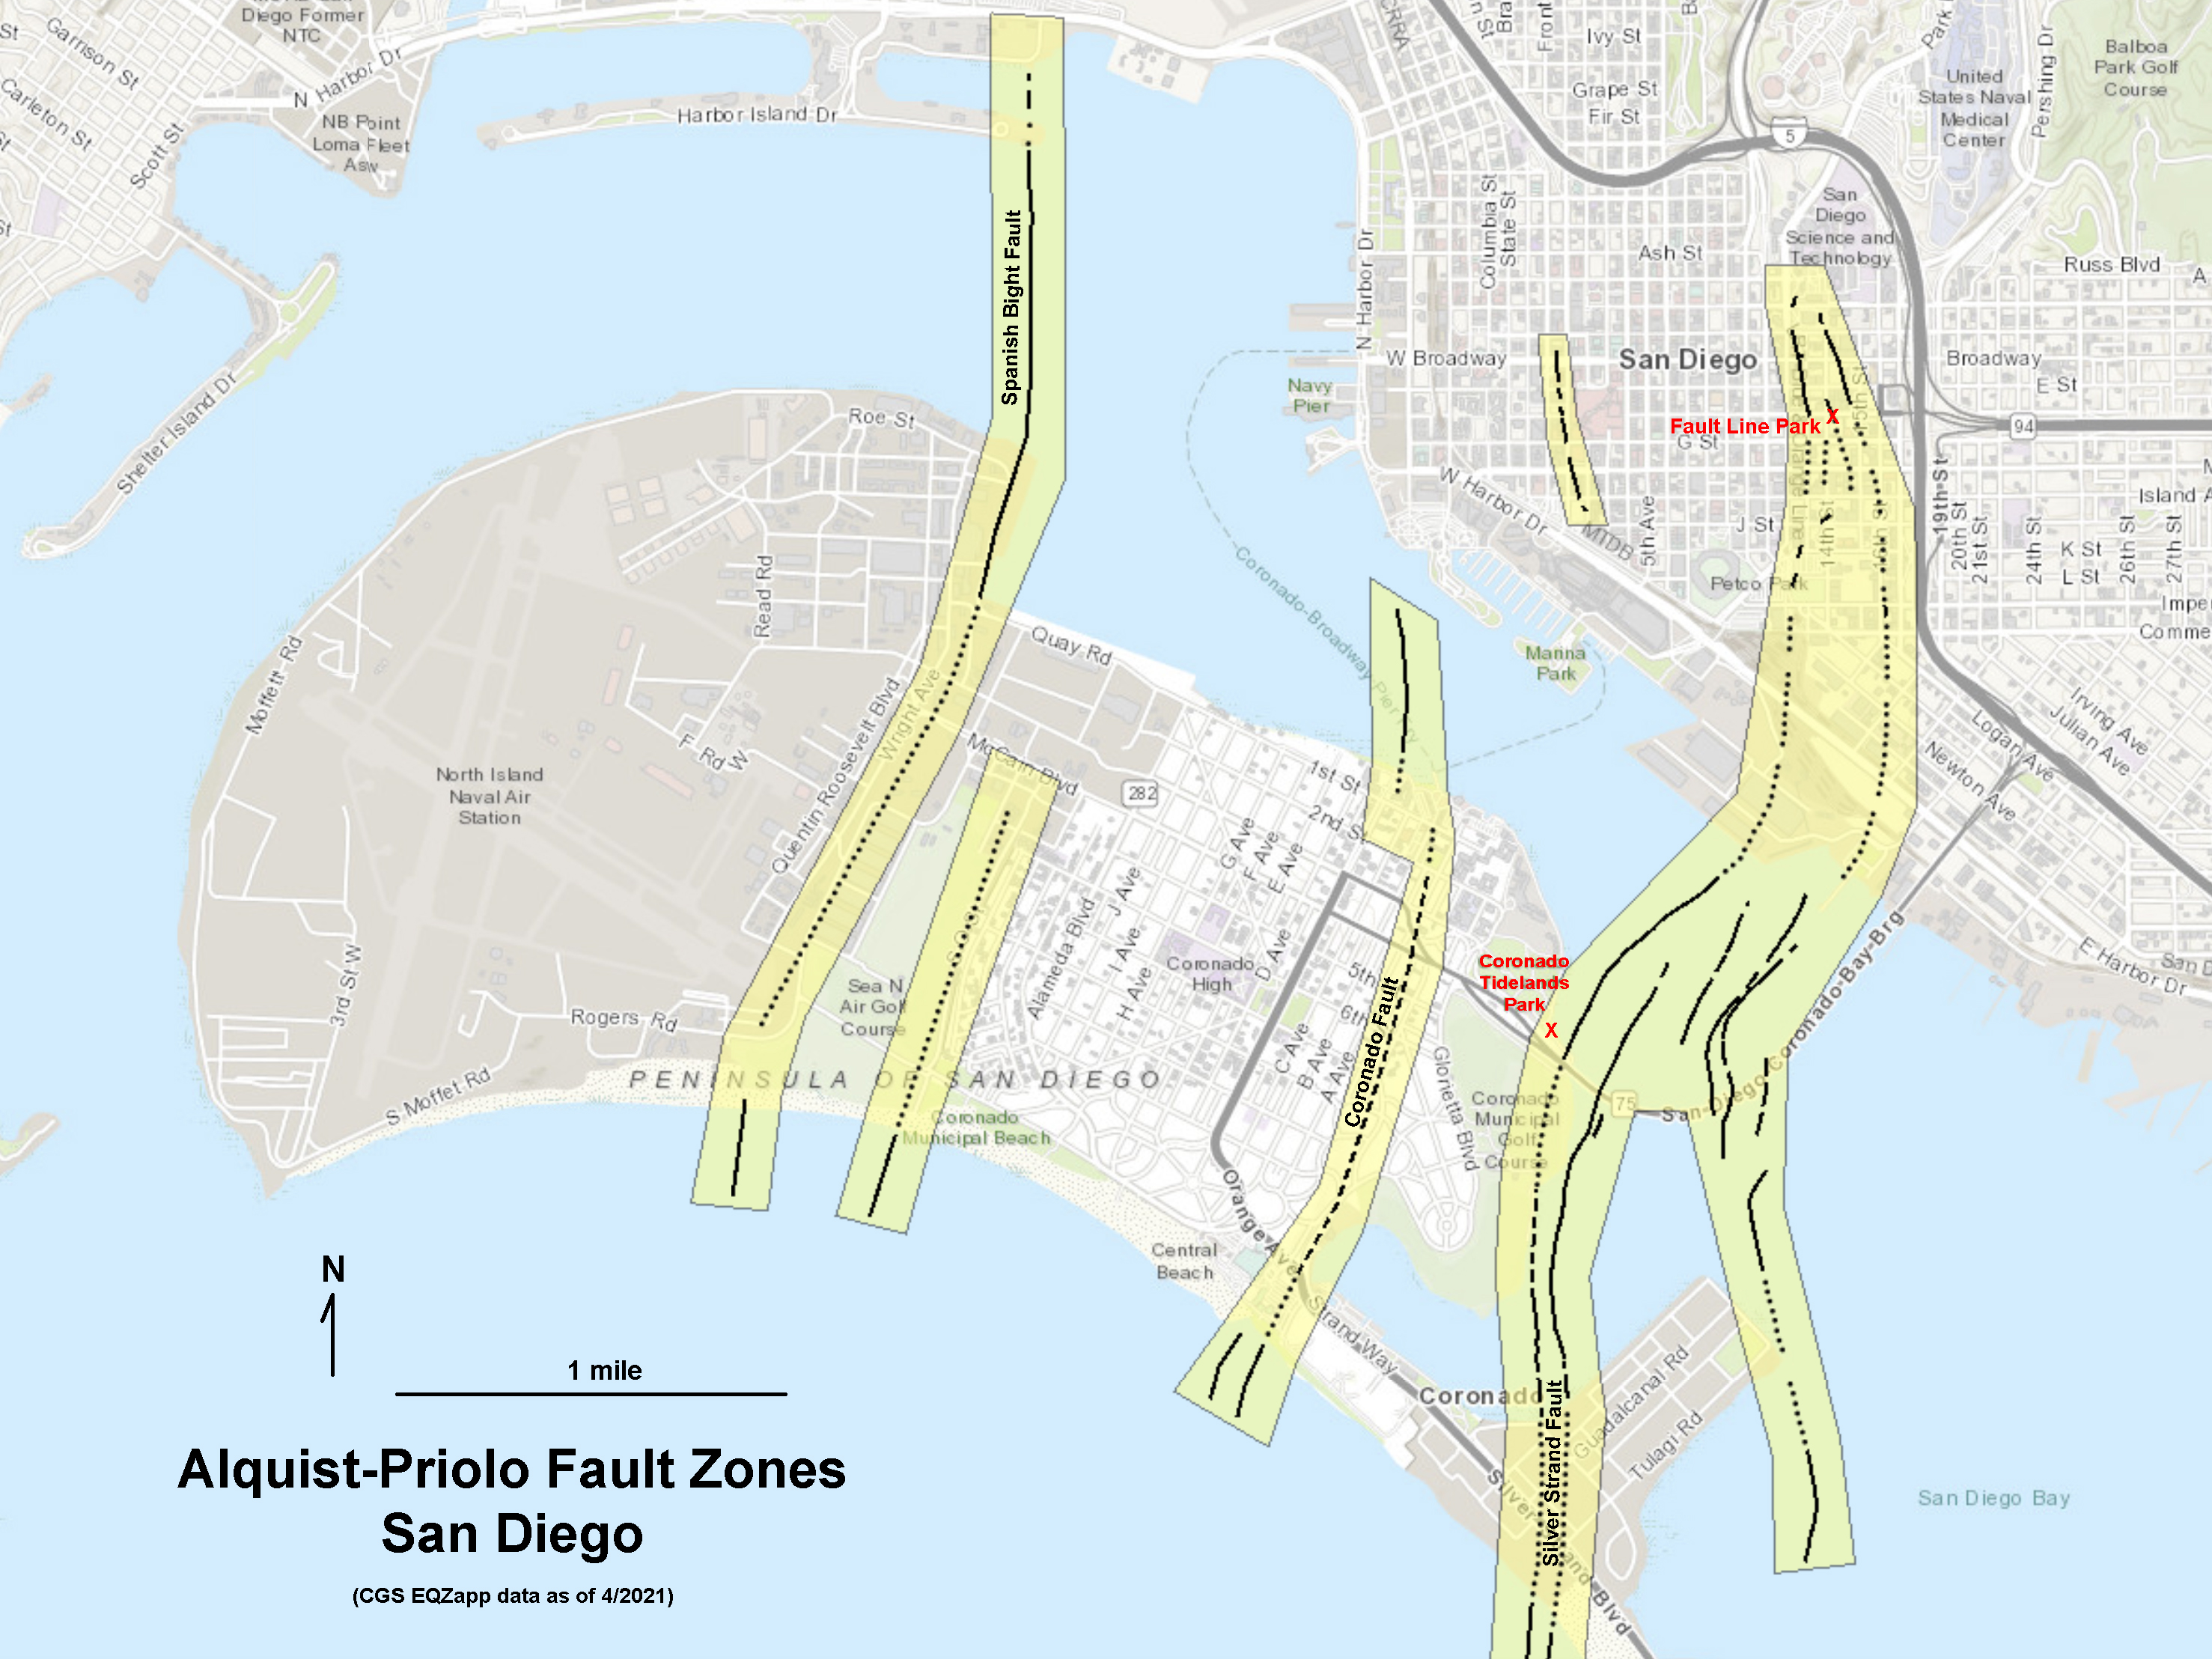
A series of north-south trending faults associated with the broad southern end of the Rose Canyon Fault Zone cuts through downtown San Diego, San Diego Bay, and Coronado island before descending offshore region of northern Baja California. These earthquake faults are shown on the 2020 Alquist-Priolo fault zones map for San Diego (Figure 128). Because of the long history of urban development in both downtown San Diego and on Coronado Island, there are few locations where undisturbed landscape features remain that show evidence of the faults. However, two locations are worthy of mentioning. Fault Line Park in downtown San Diego is dedicated to acknowledging the fault's presence. Also, the shoreline along Coronado Tidelands Park borders San Diego Bay where several fault strands pass under and near the Coronado Bridge and through the neighborhood nearby.
|
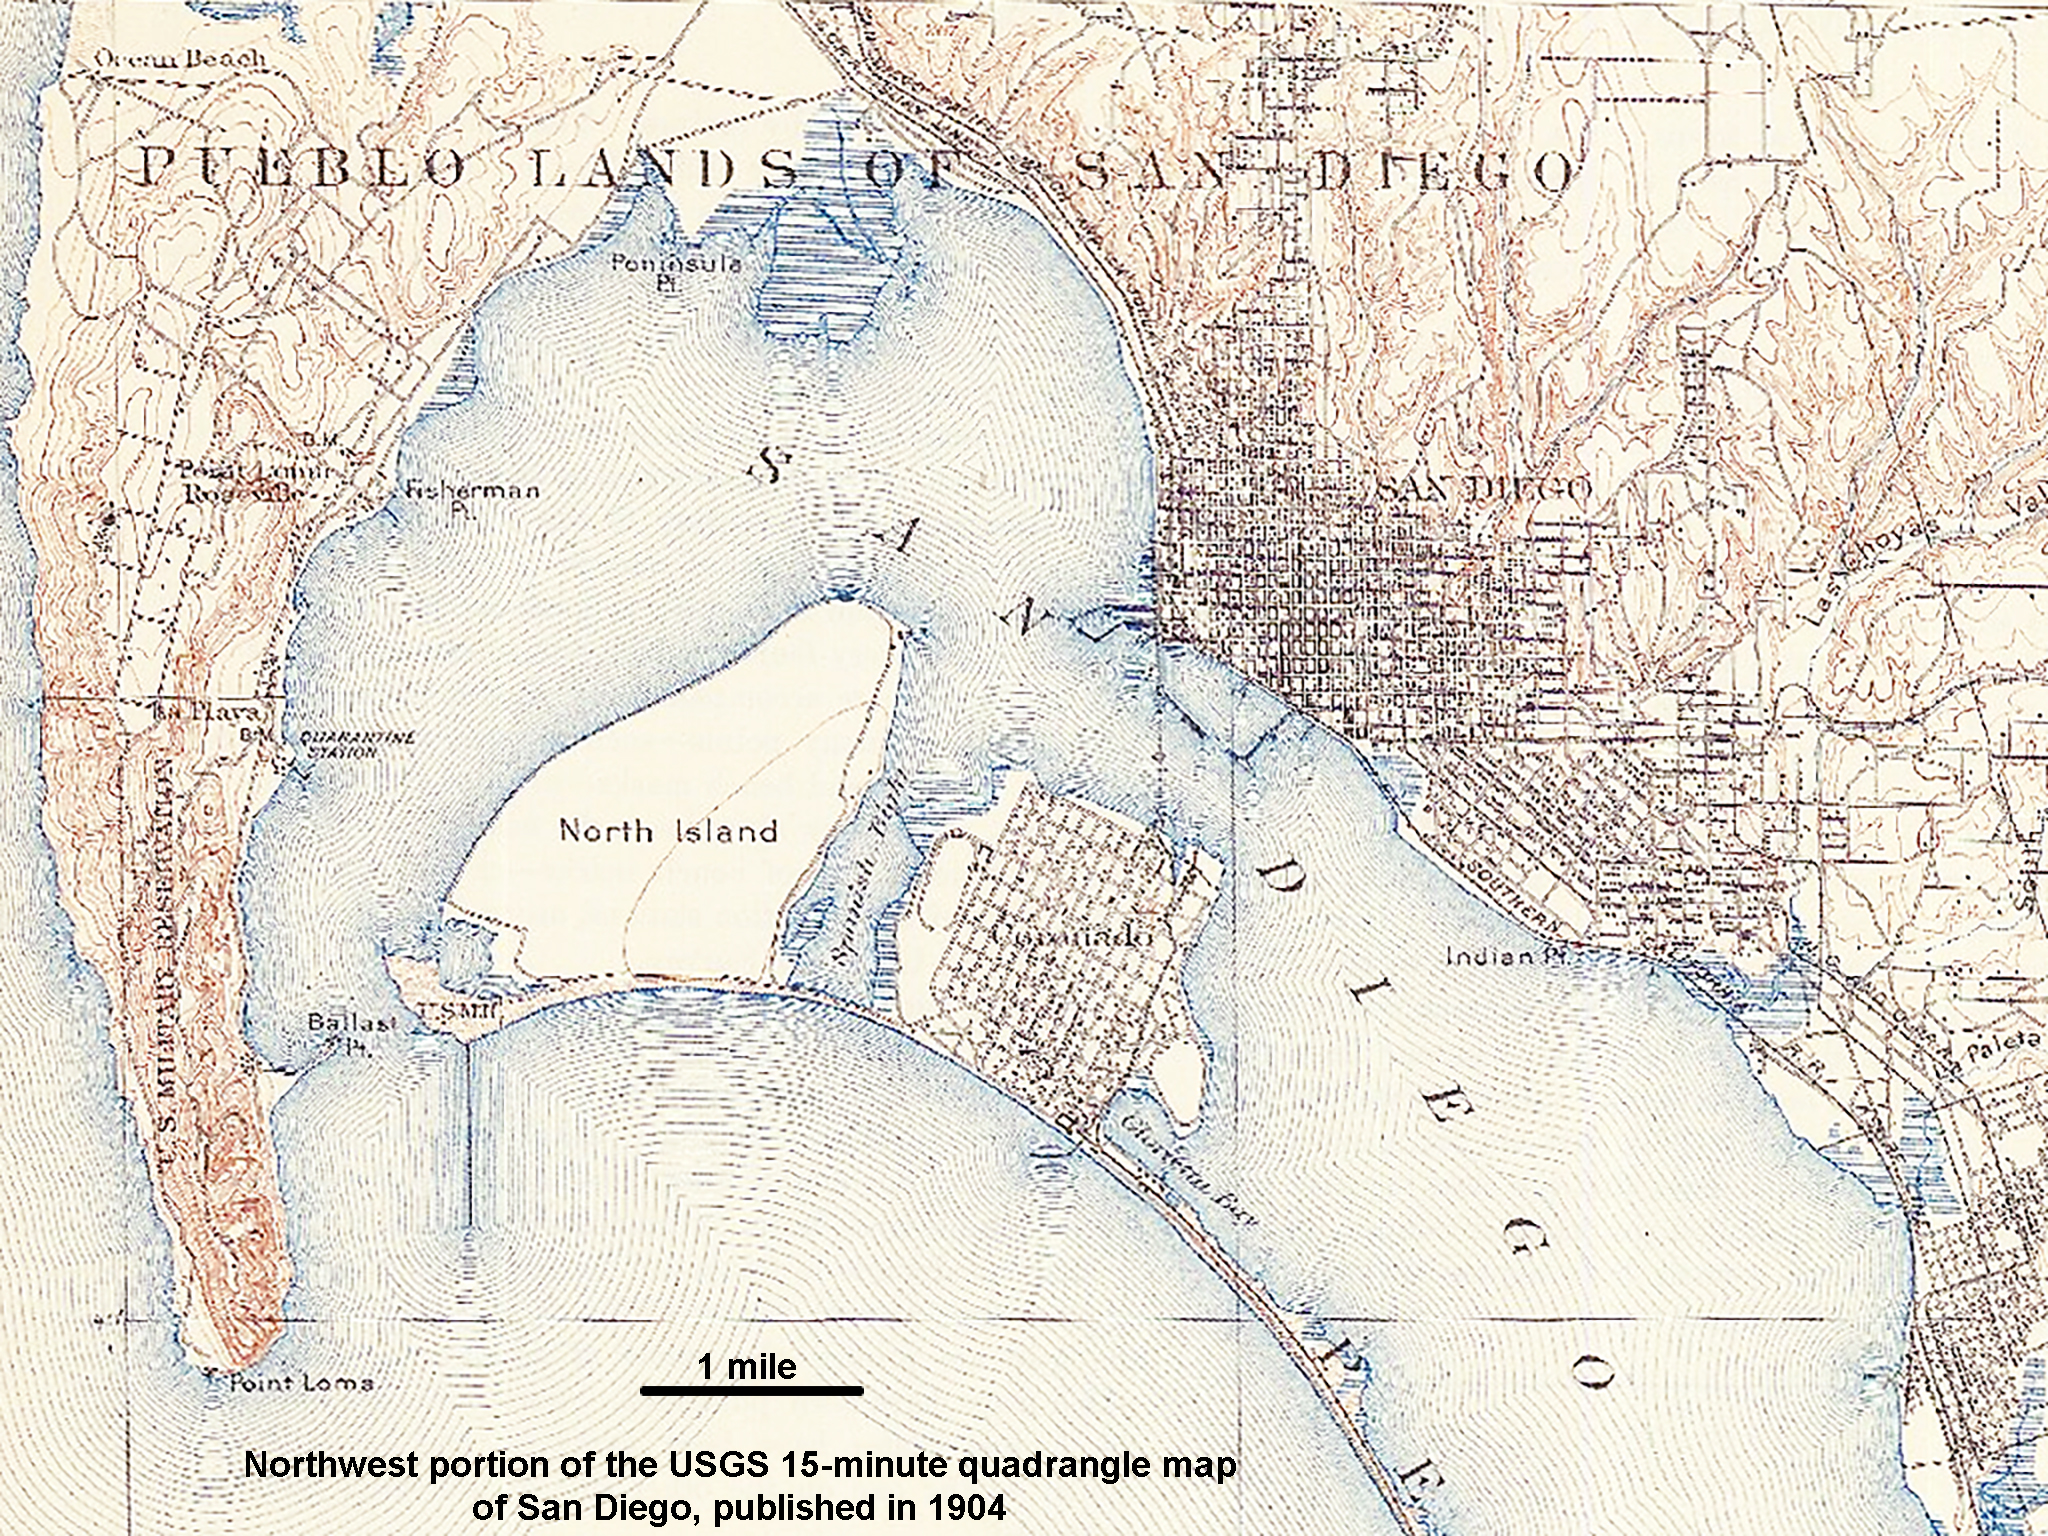
The 1904 topographic map of the San Diego area shows a landscape before it had been significantly modified (Figure 129). On the old map you can see several landforms associated with the fault zones. For instance, shoreline feature on the north end of San Diego Bay (labeled Peninsula Point on the map).
Spanish Bight was a fault-bounded graben between North Island and Coronado (defined by the Spanish Bight Fault). The historic Spanish Bight area has been filled in.
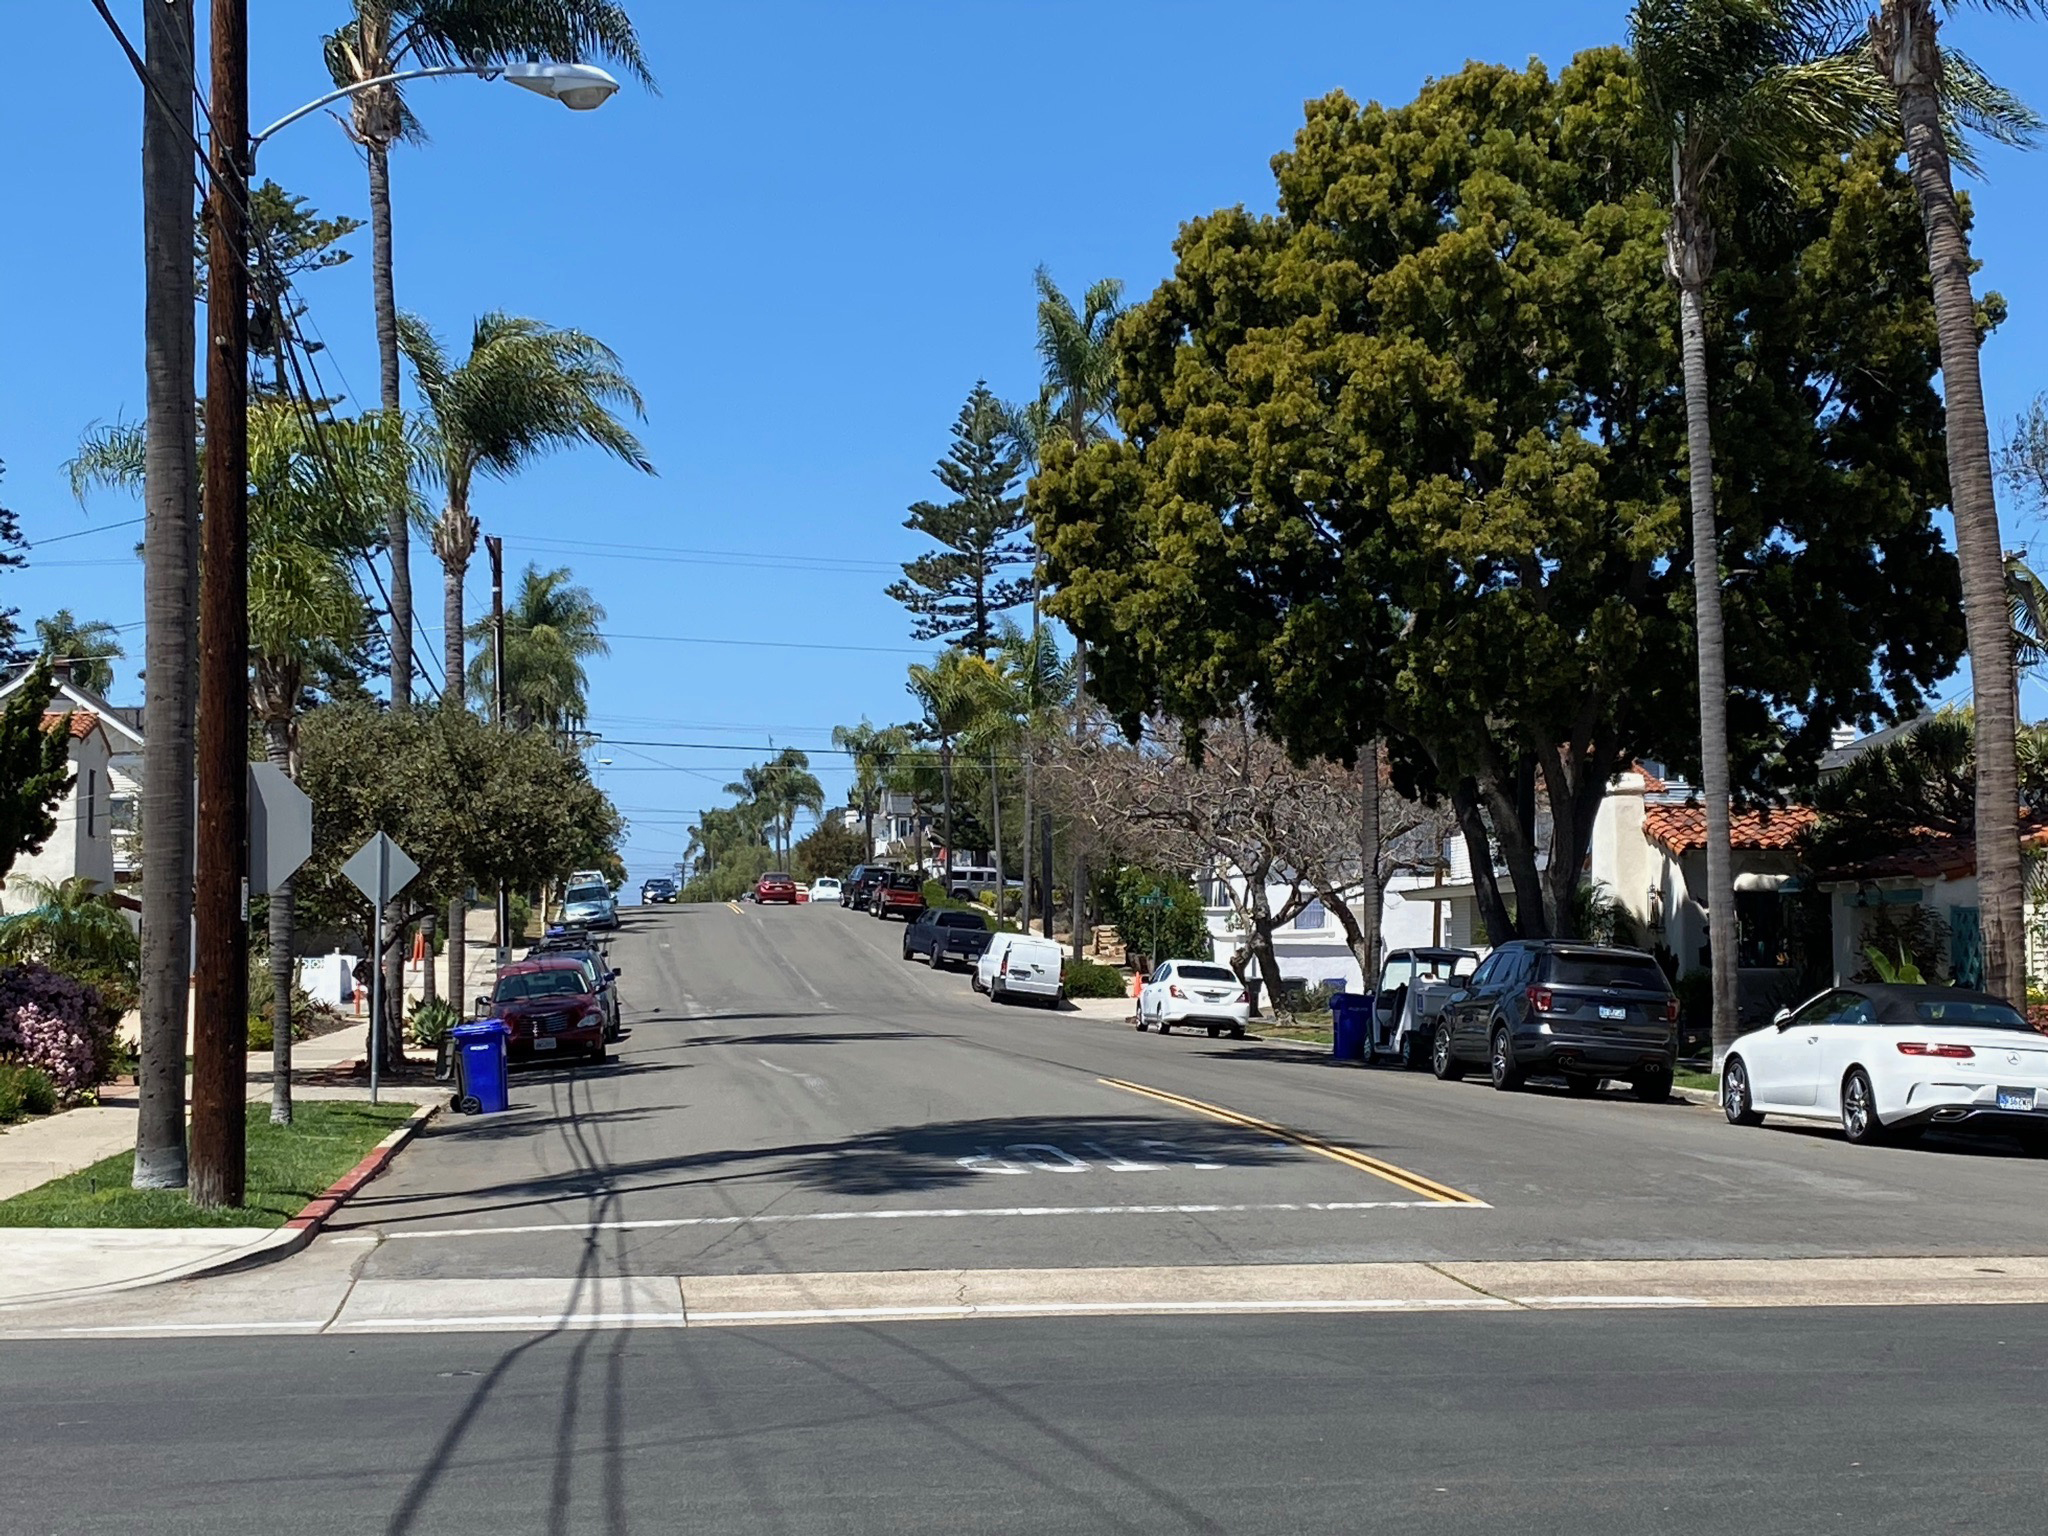
The east shoreline of Coronado near Glorietta Bay displays a scarp associated with the Coronado Fault. The scarp can still be seen as a change in slope along the streets in the older neighborhood near the Coronado Bridge. |
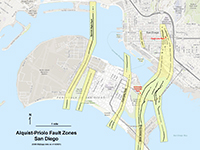
Fig. 128. Alquist-Priolo fault zones map of San Diego with faults and features labeled. |
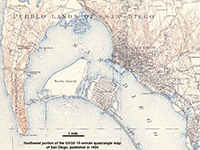
Fig. 129. Northwest portion of the 1904 San Diego 15-minute quadrangle (USGS). |
A19
Fault Line Park
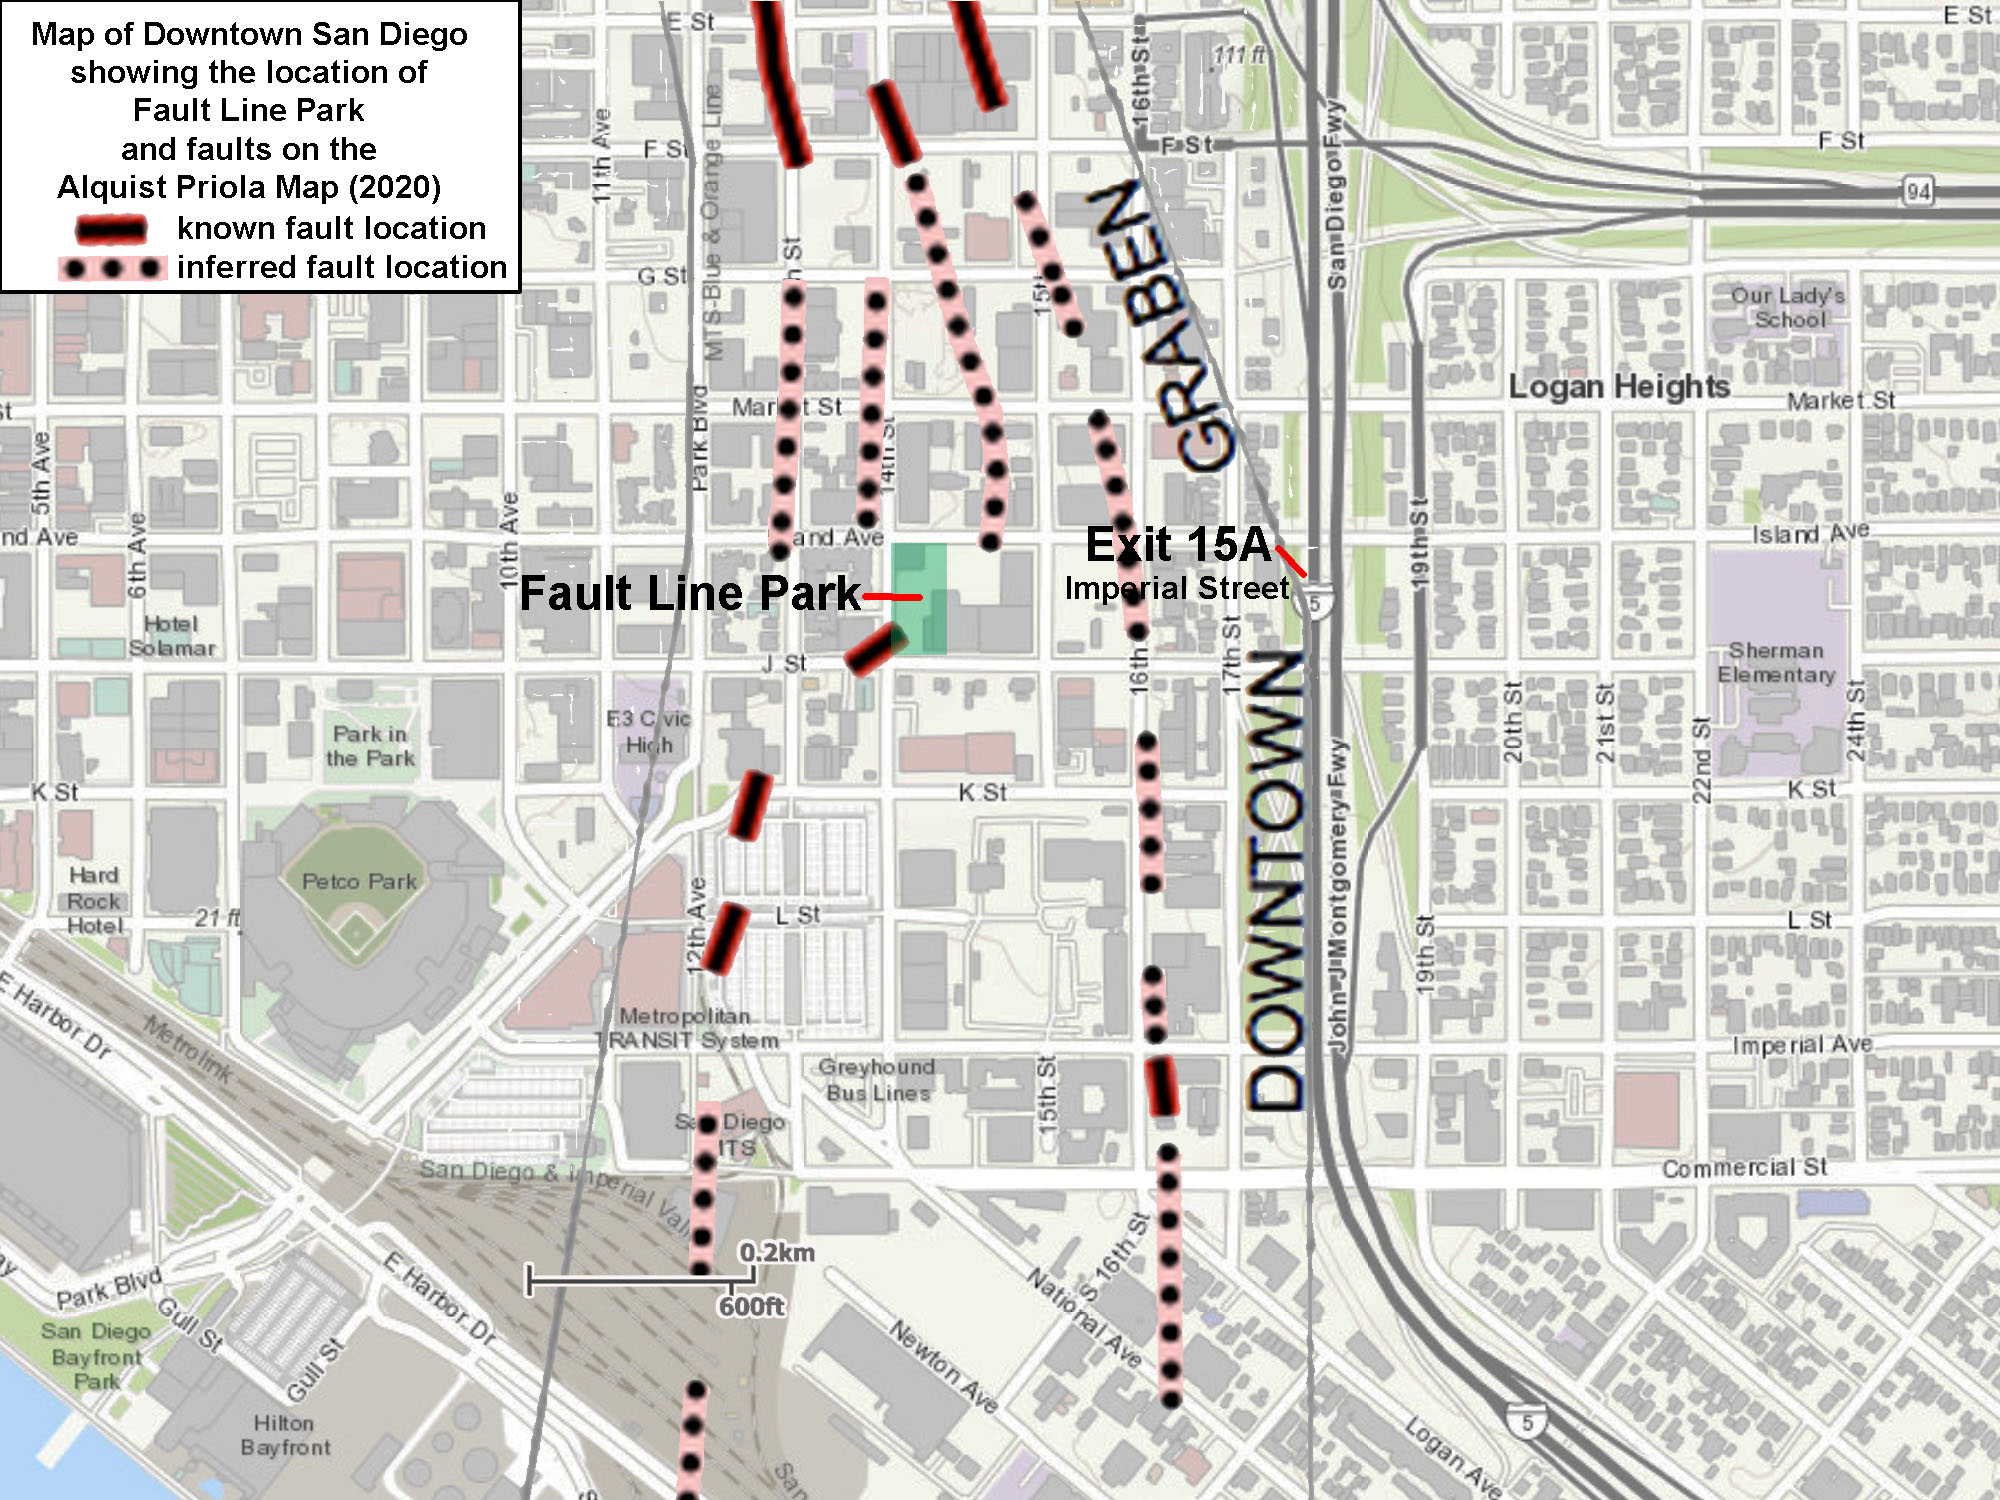
Fault Line Park is located in San Diego's East Village neighborhood (located at the intersection of 14th Street and Island Avenue, San Diego, CA 92101). The location of Fault Line Park in downtown San Diego is shown on Figure 130. The map shows the location of faults in the downtown San Diego area shown on the preliminary Alquist-Priolo earthquake fault zones map for San Diego (as of March, 2021). The park is located with the Downtown Graben fault zone area.
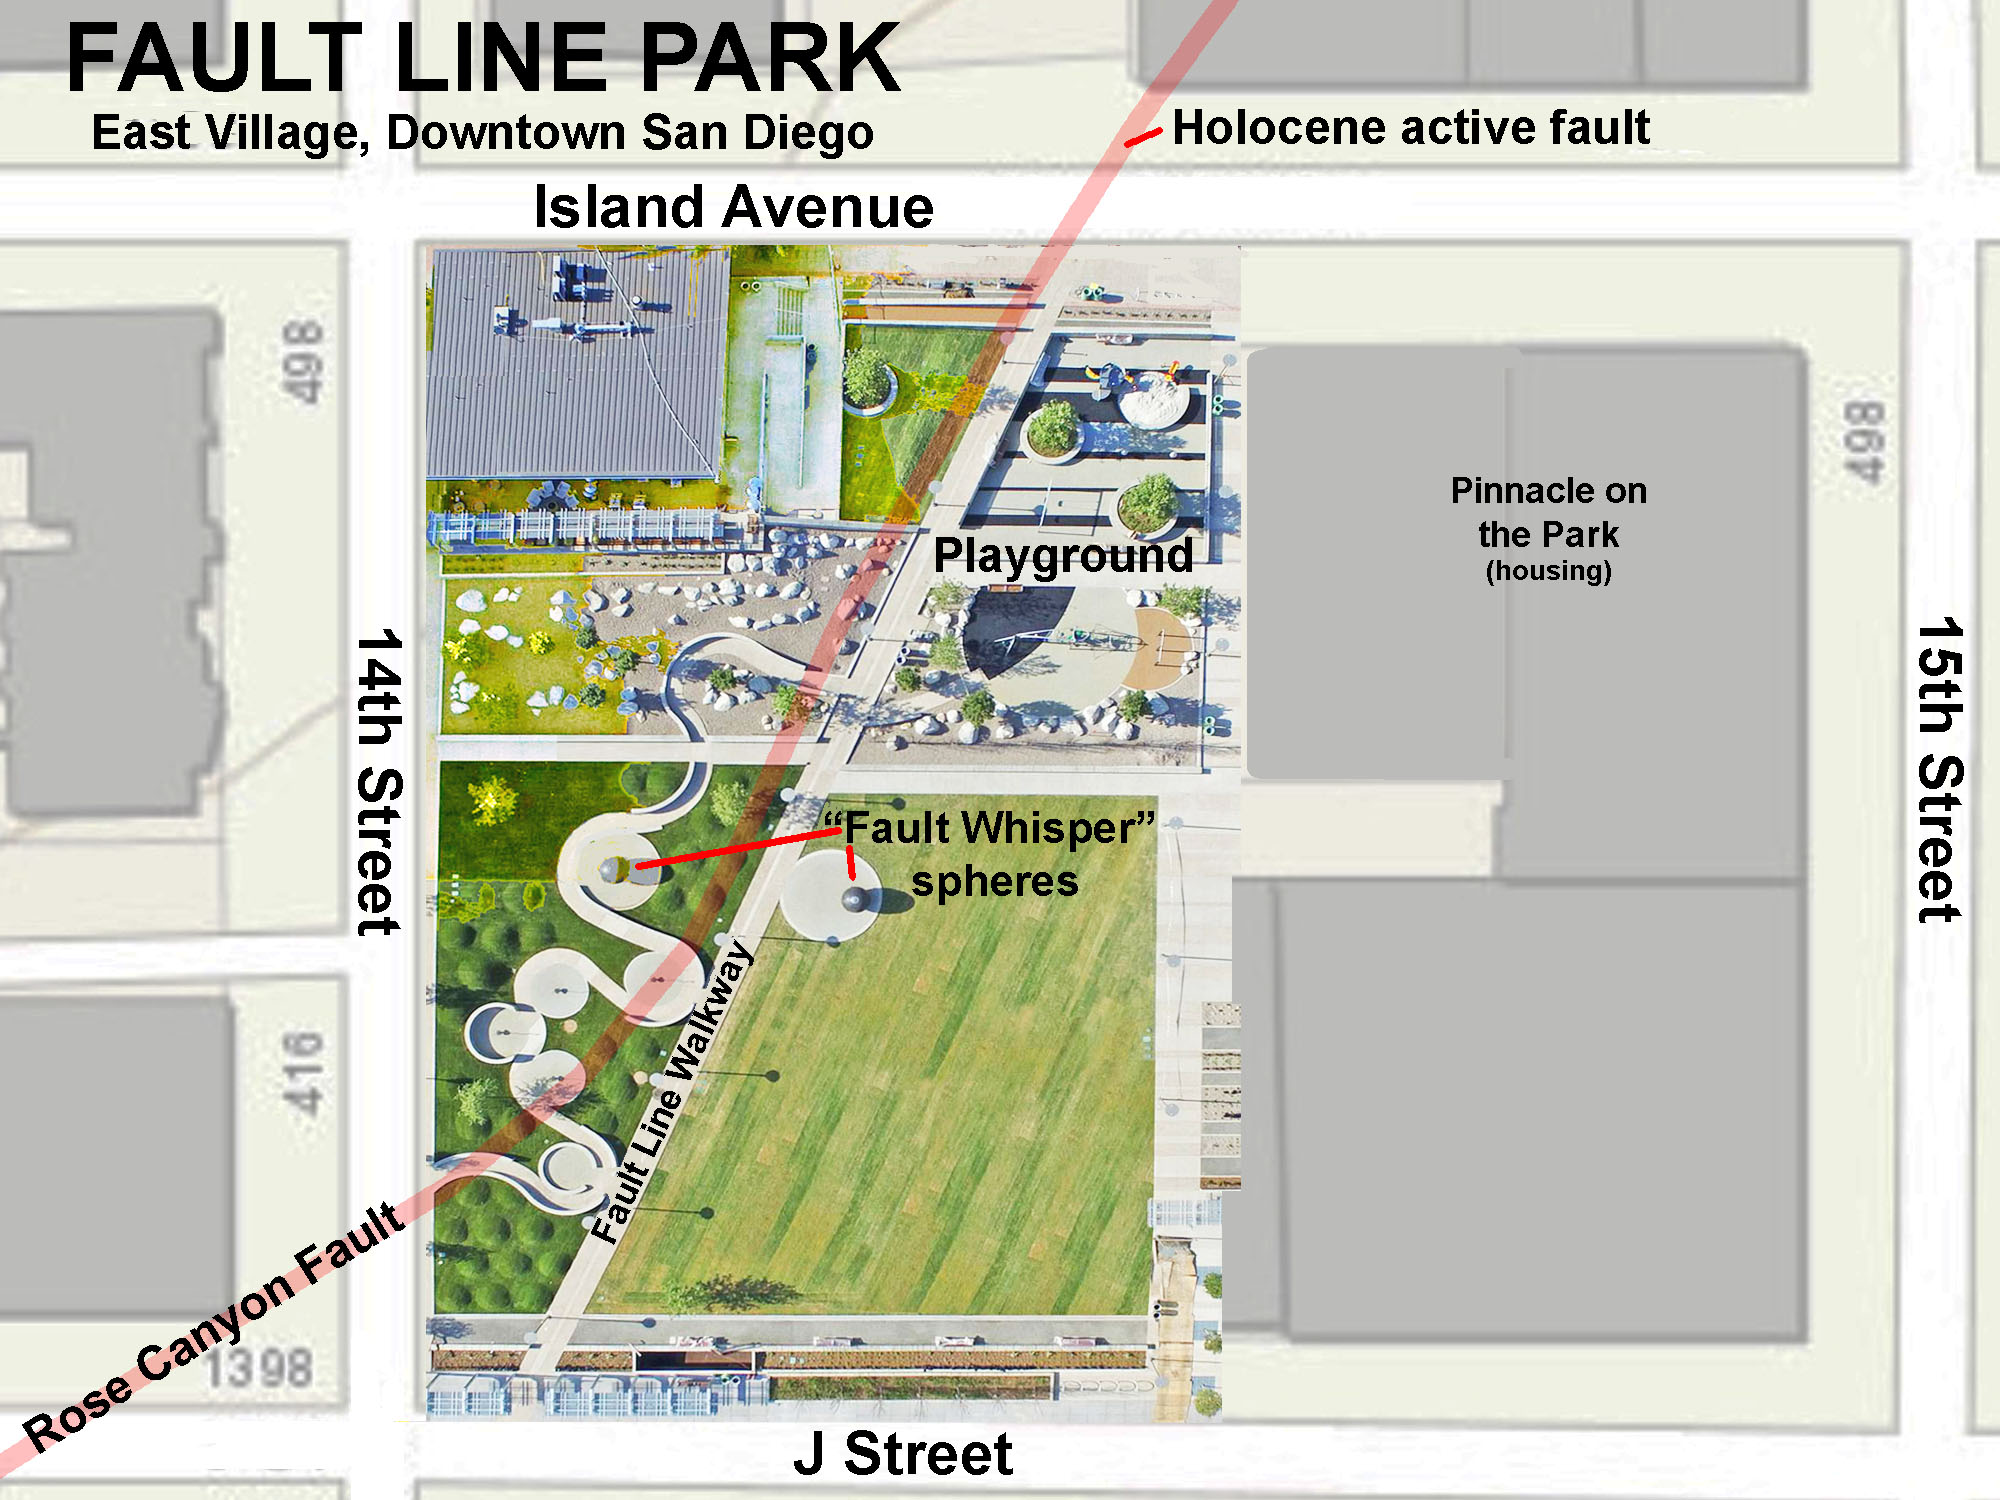
You can't actually see the fault, but the fault's presence is the paramount attraction in the park's landscaping design. Figure 131 is a park map that shows the mapped trace of the fault line compared to landscaping, art, and architectural features in the park. Fault Line Park got its name because it was built on a earthquake fault strand within the Rose Canyon Fault Zone (Figure 132). The park was built on land that could not be developed because the strand of the Rose Canyon Fault showed evidence of Holocene displacement.
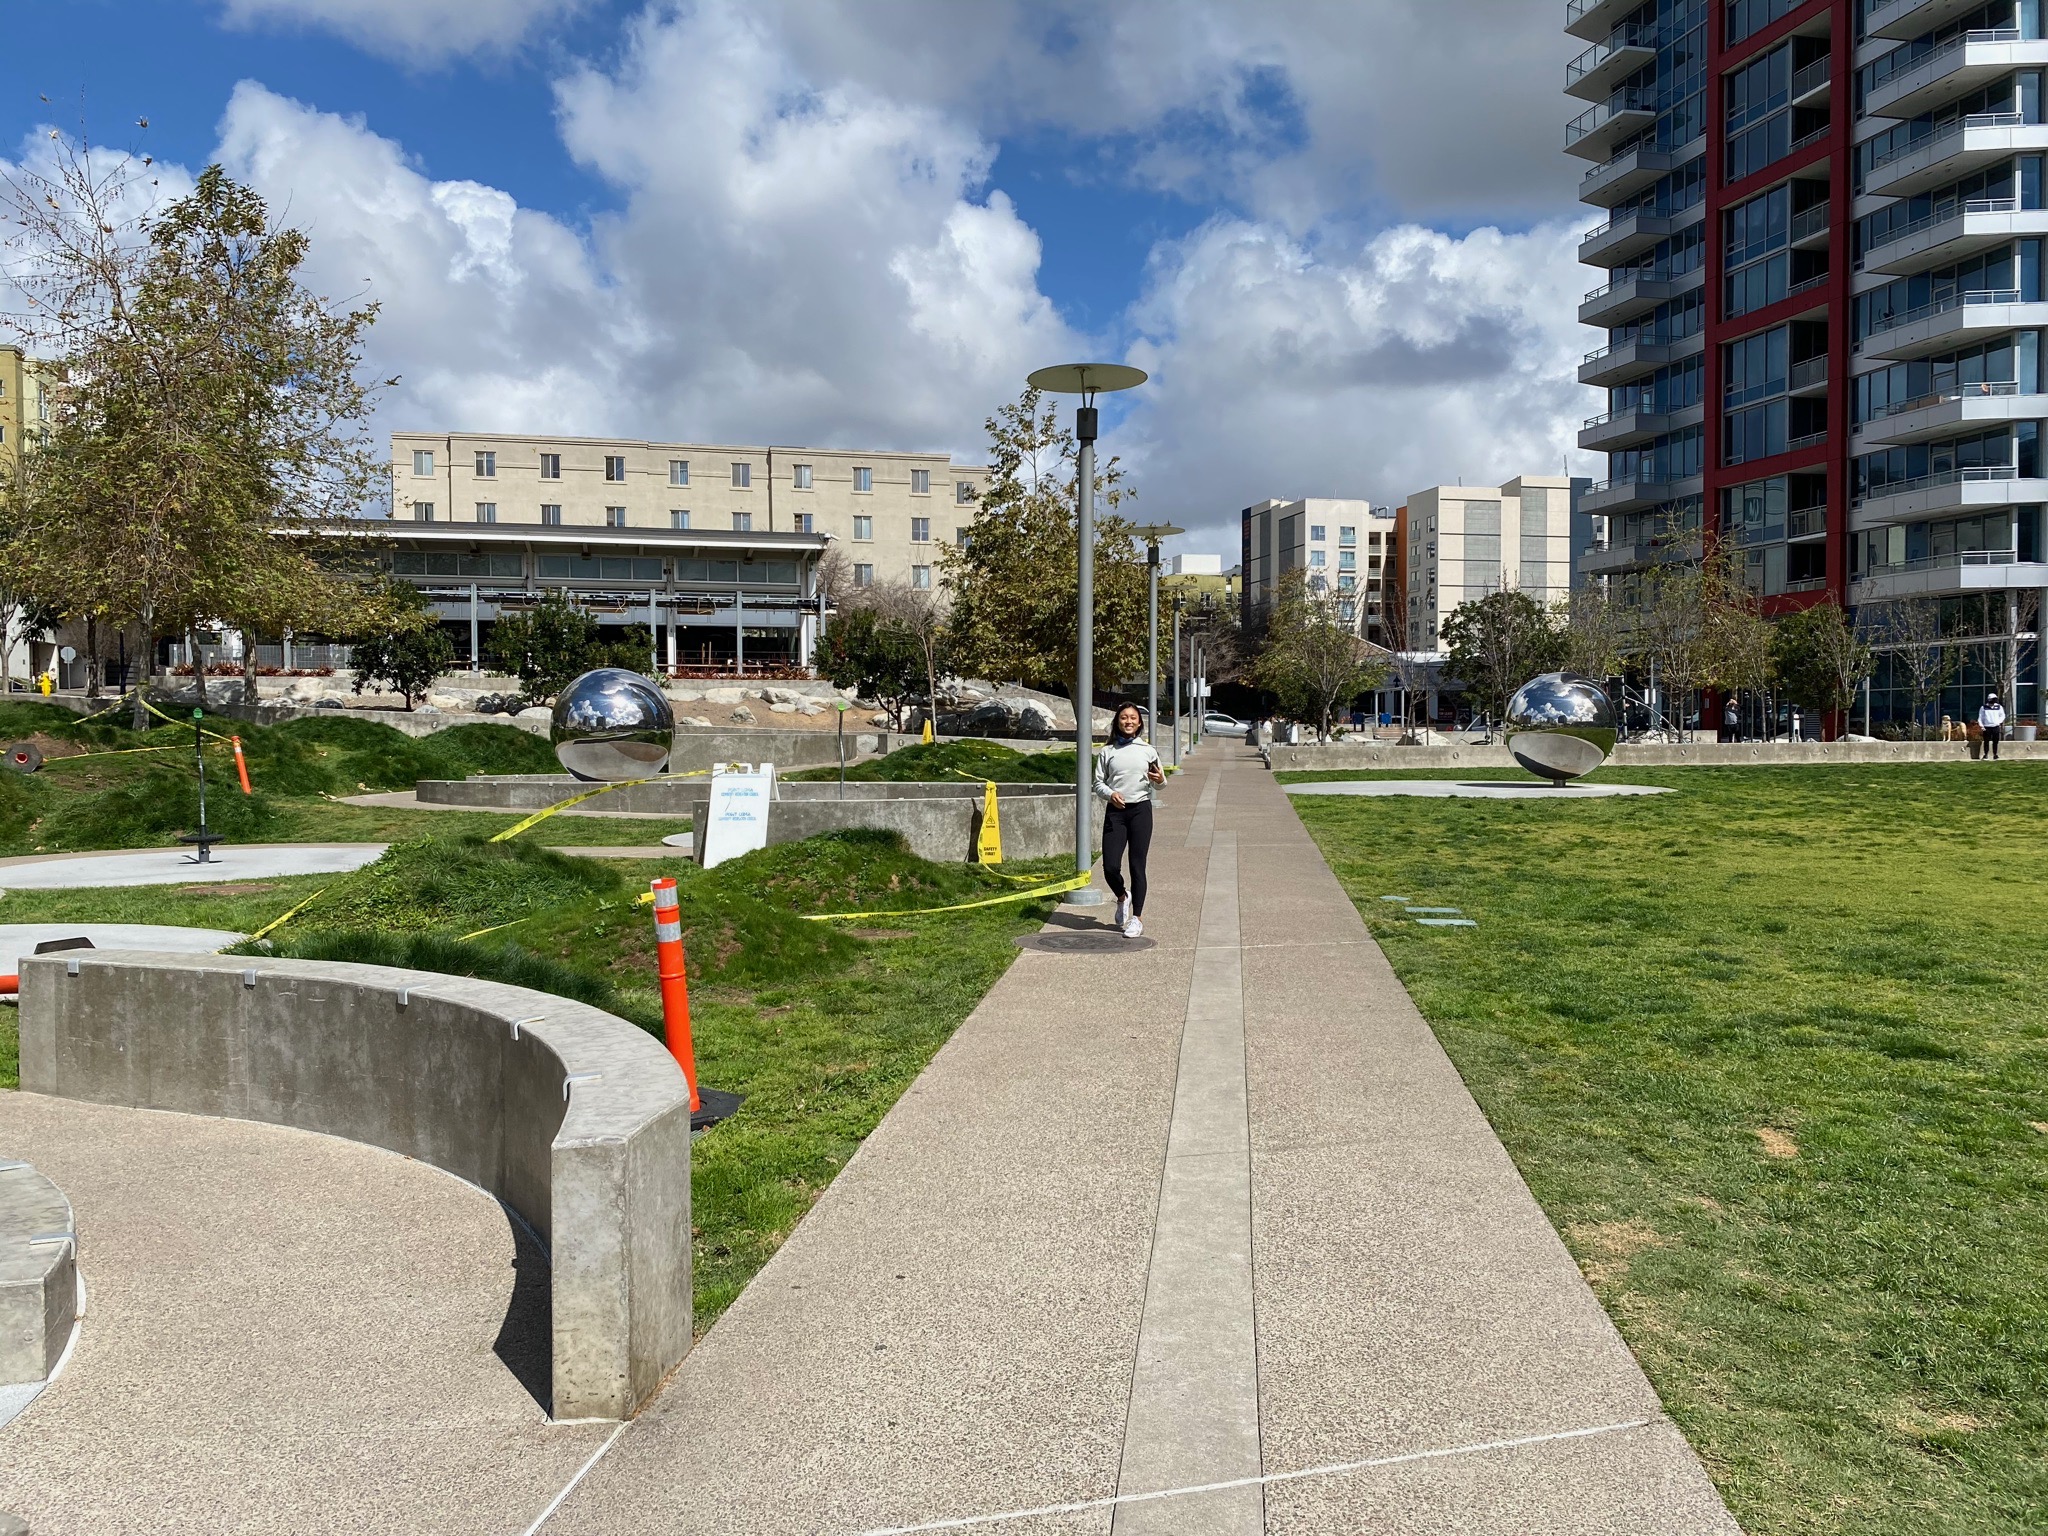
The park's public art installation, called the Fault Whisper, was designed by artist Po Shu Wang. It features a twisted sidewalk that traces the Rose Canyon Fault line that runs through the park. It was created by Po Shu Wang and his wife Louise Bertelsen for the San Diego Commission for Arts and Culture. In addition to the art, the 1.5 acre park has a lawn area, a playground, public restrooms, and restaurants nearby.
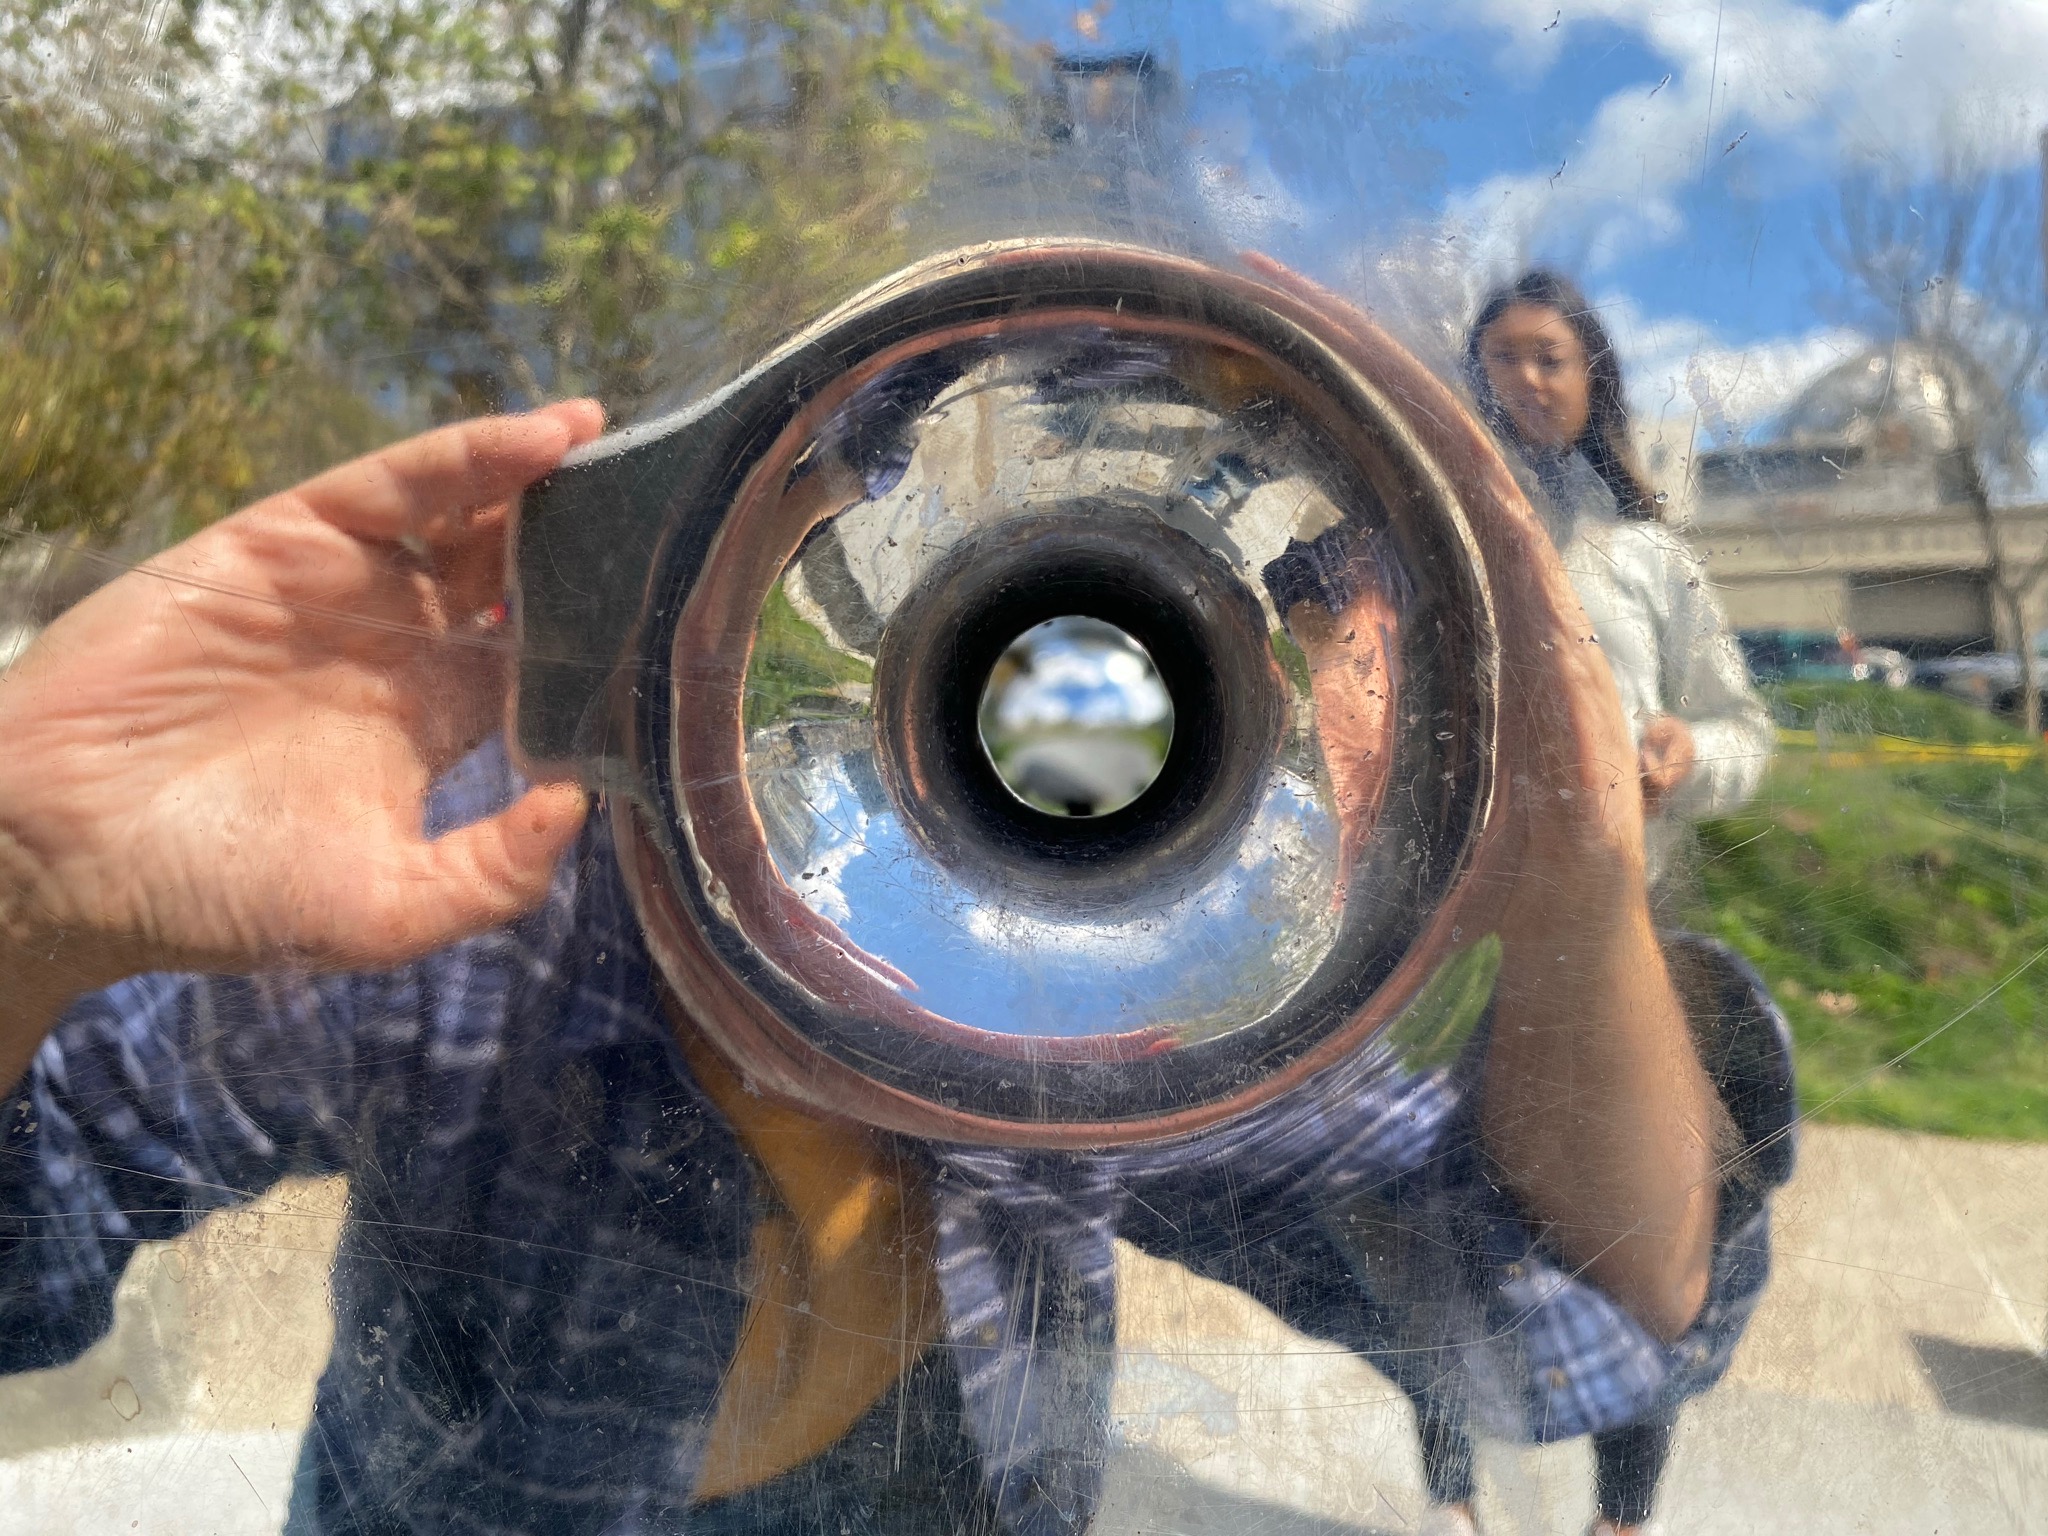
A sidewalk running diagonally across the park is intended to show that the general trend where the earthquake fault passes through the area (Figure 133) . Two large mirrored stainless-steel spheres have been placed on opposite sided of the fault (Figure 134). A hole through the mirrored sphere on the north side of the fault is aligned with the other sphere on the opposite side of the fault. This allows viewers, now and in the future, to see how the fault may have moved over time, either through slow creep or from the sudden offset of an earthquake fault rupture (Figure 135). |
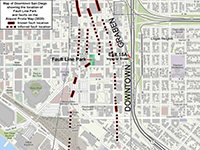
Fig. 130. Fault lines shown on a map of downtown San Diego showing the location of Fault Line Park.
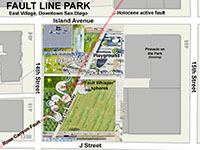
Fig. 131. Fault Line Park map with fault trace shown. |
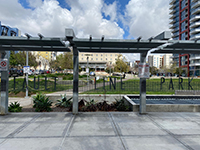
Fig. 132. Fault Line Park in San Diego's East Village area.
|
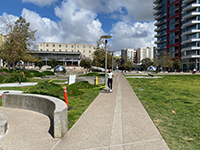
Fig. 133. A park path roughly follows a strand of the fault. |
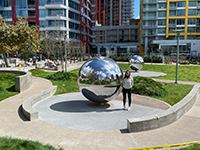
Fig. 134. Two orbs on opposite side of the fault. |
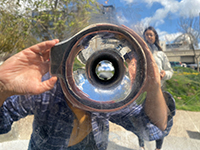
Fig. 135. The orbs line up through a viewing hole |
|
A20
Coronado Island
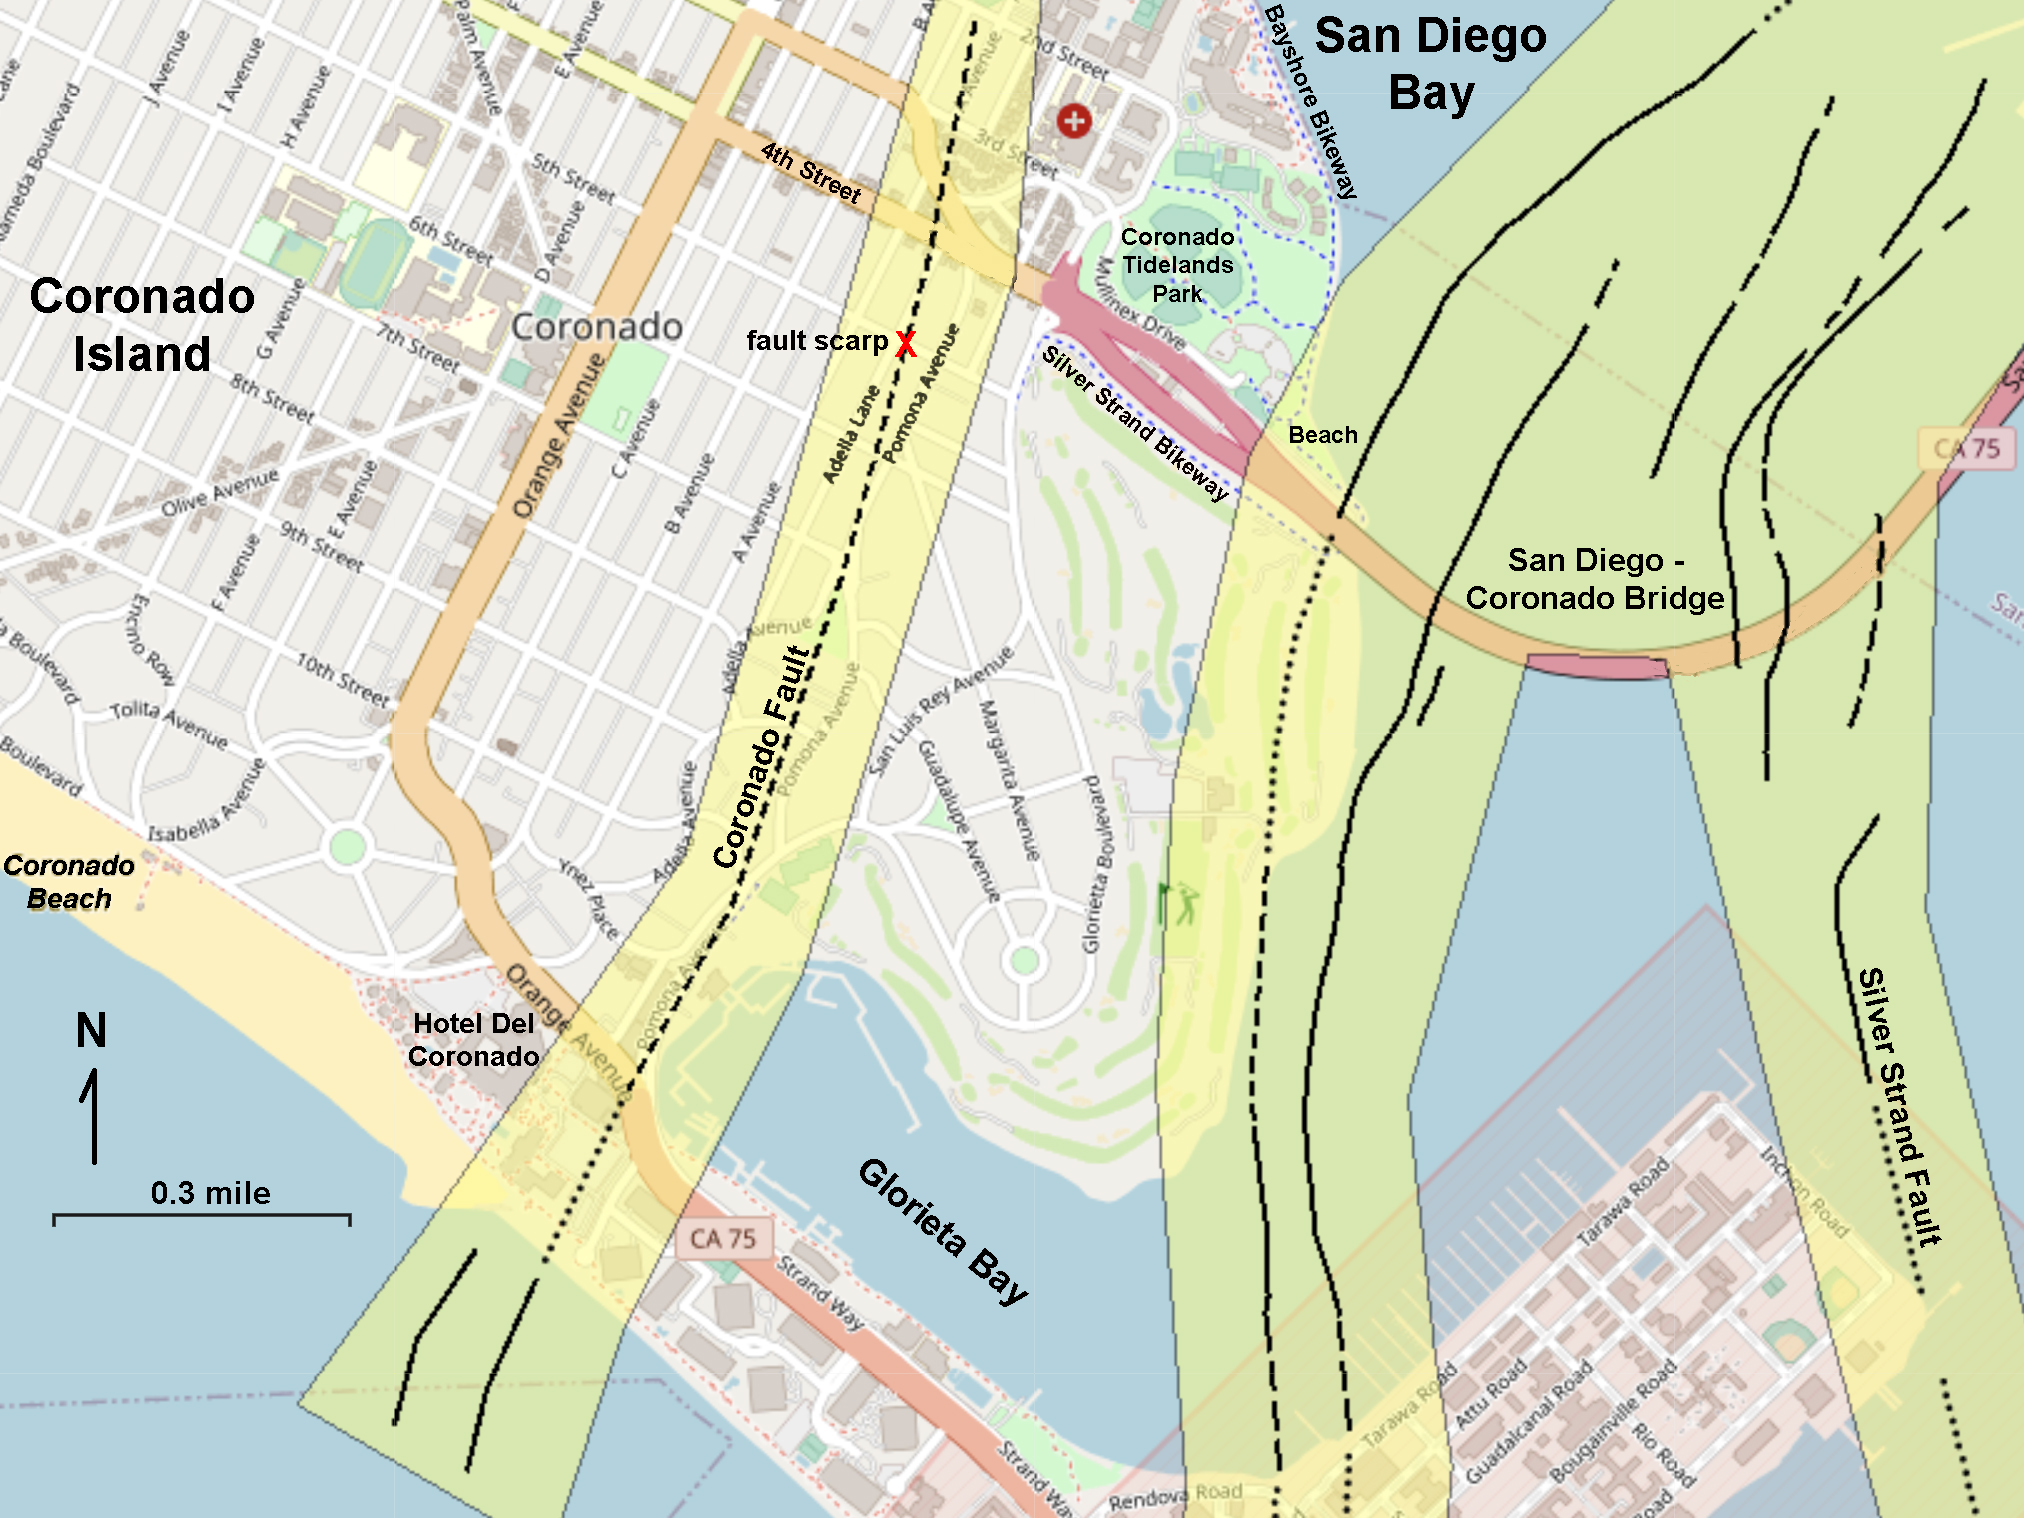
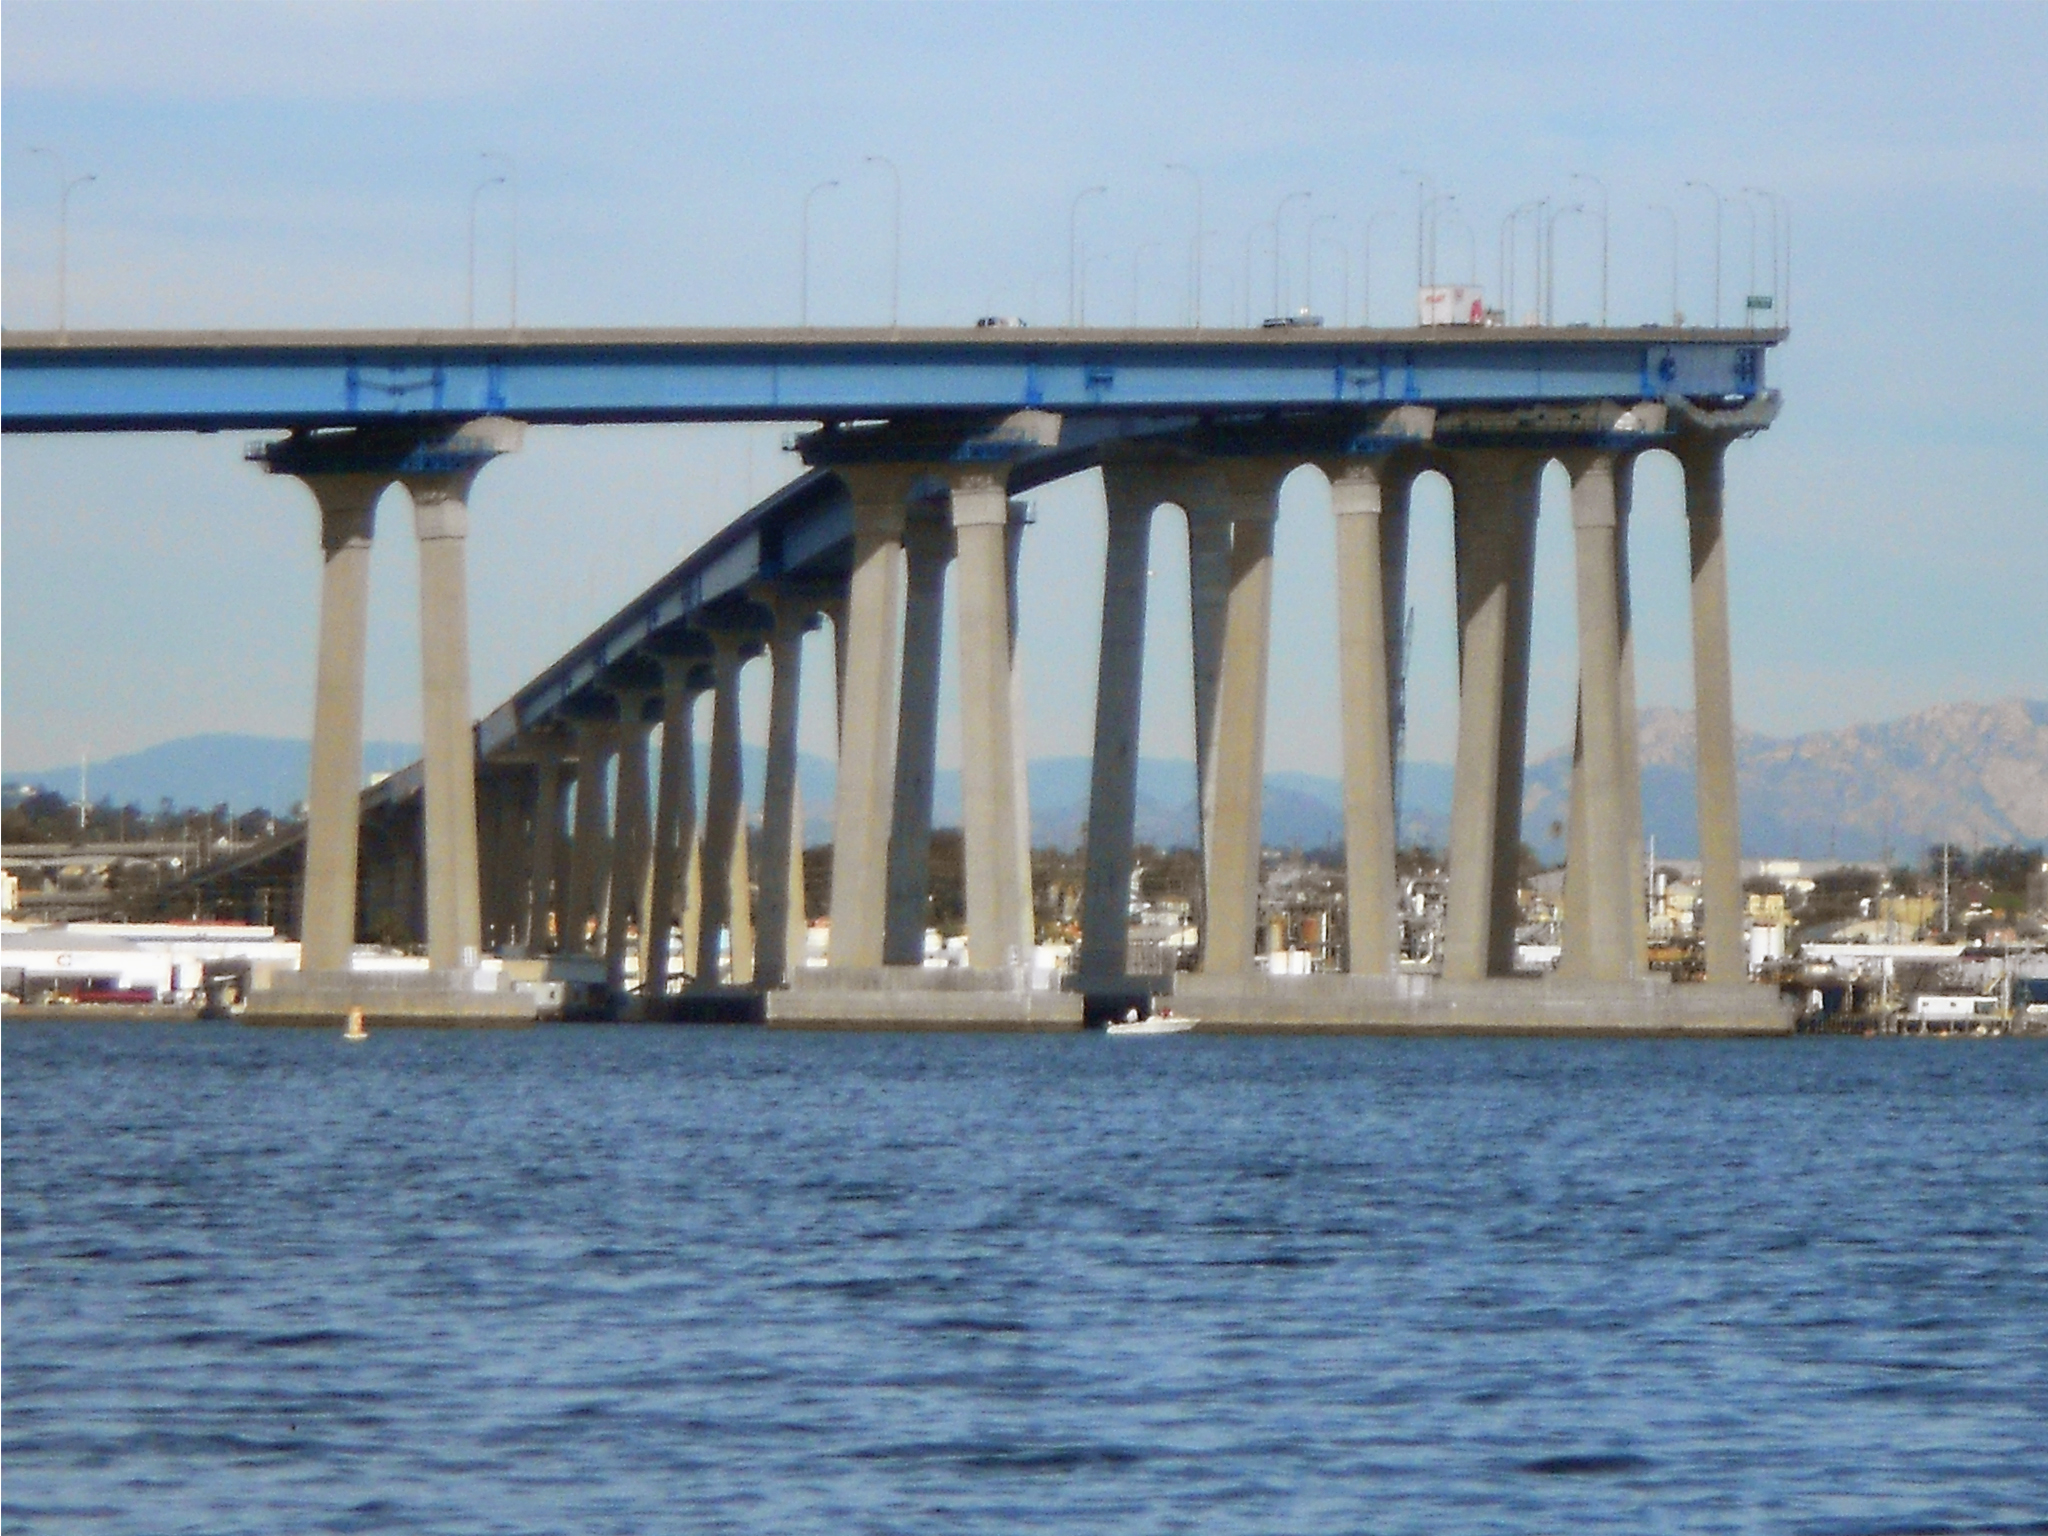
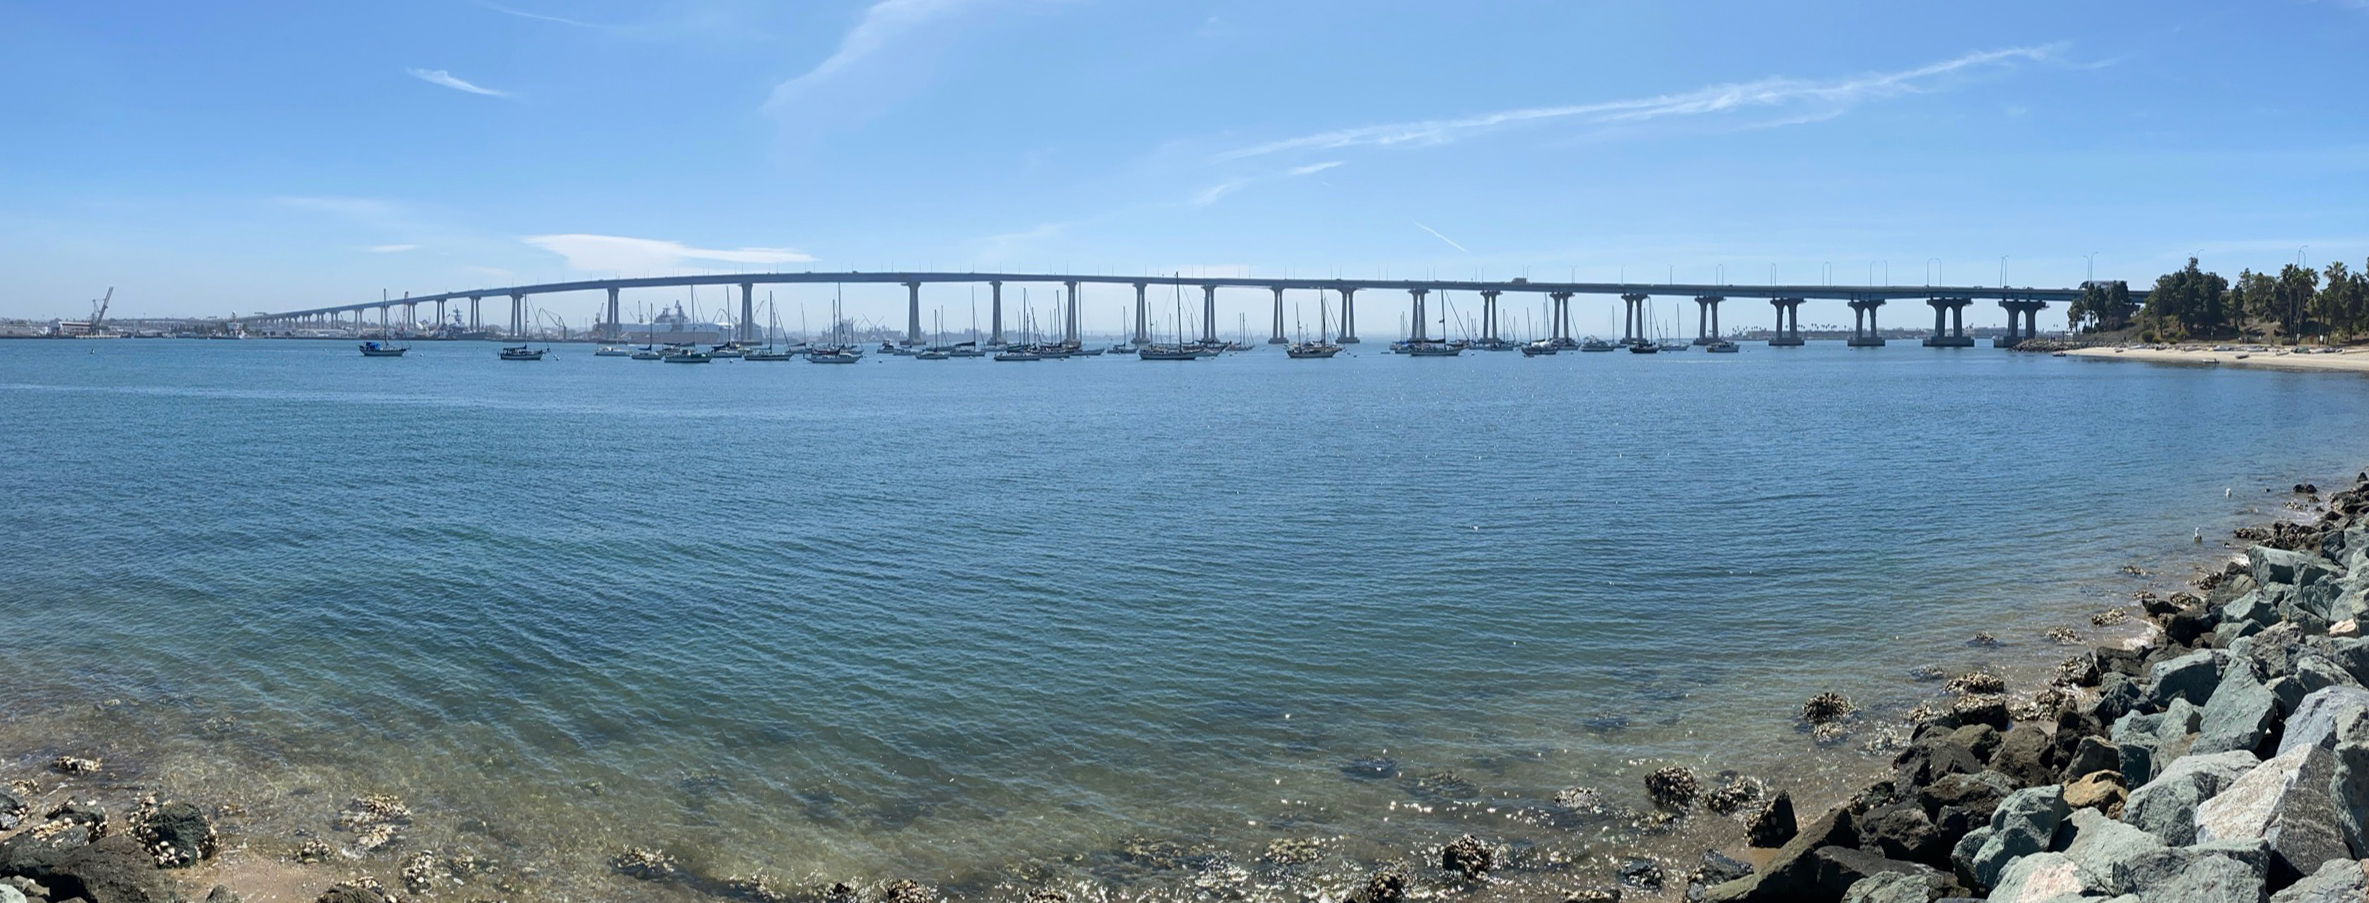
Figure 136 shows the Alquist-Priolo fault zone map for the area around Glorietta Bay on the southern end of Coronado Island. Numerous fault strands of the Rose Canyon Fault Zone have been mapped crossing San Diego Bay, Coronado Island, and the Silver Strand barrier island. Several fault strands pass beneath the San Diego-Coronado Bridge. A good location to ponder these hidden faults is along shoreline at Coronado Tidelands Park.
A fault strand named The Coronado Fault cuts through old neighborhoods in Coronado. The fault goes offshore beneath the beach just south of the Hotel del Coronado. The Silver Strand Fault crosses beneath the barrier island about a mile south of the Hotel del Coronado. |

Fig. 136. Fault line map and Alquist-Priolo fault zone map of central Coronado Island. |
A21
The Bayshore/Silver Strand Bikeway, Coronado Tidelands Park, and Glorietta Bay
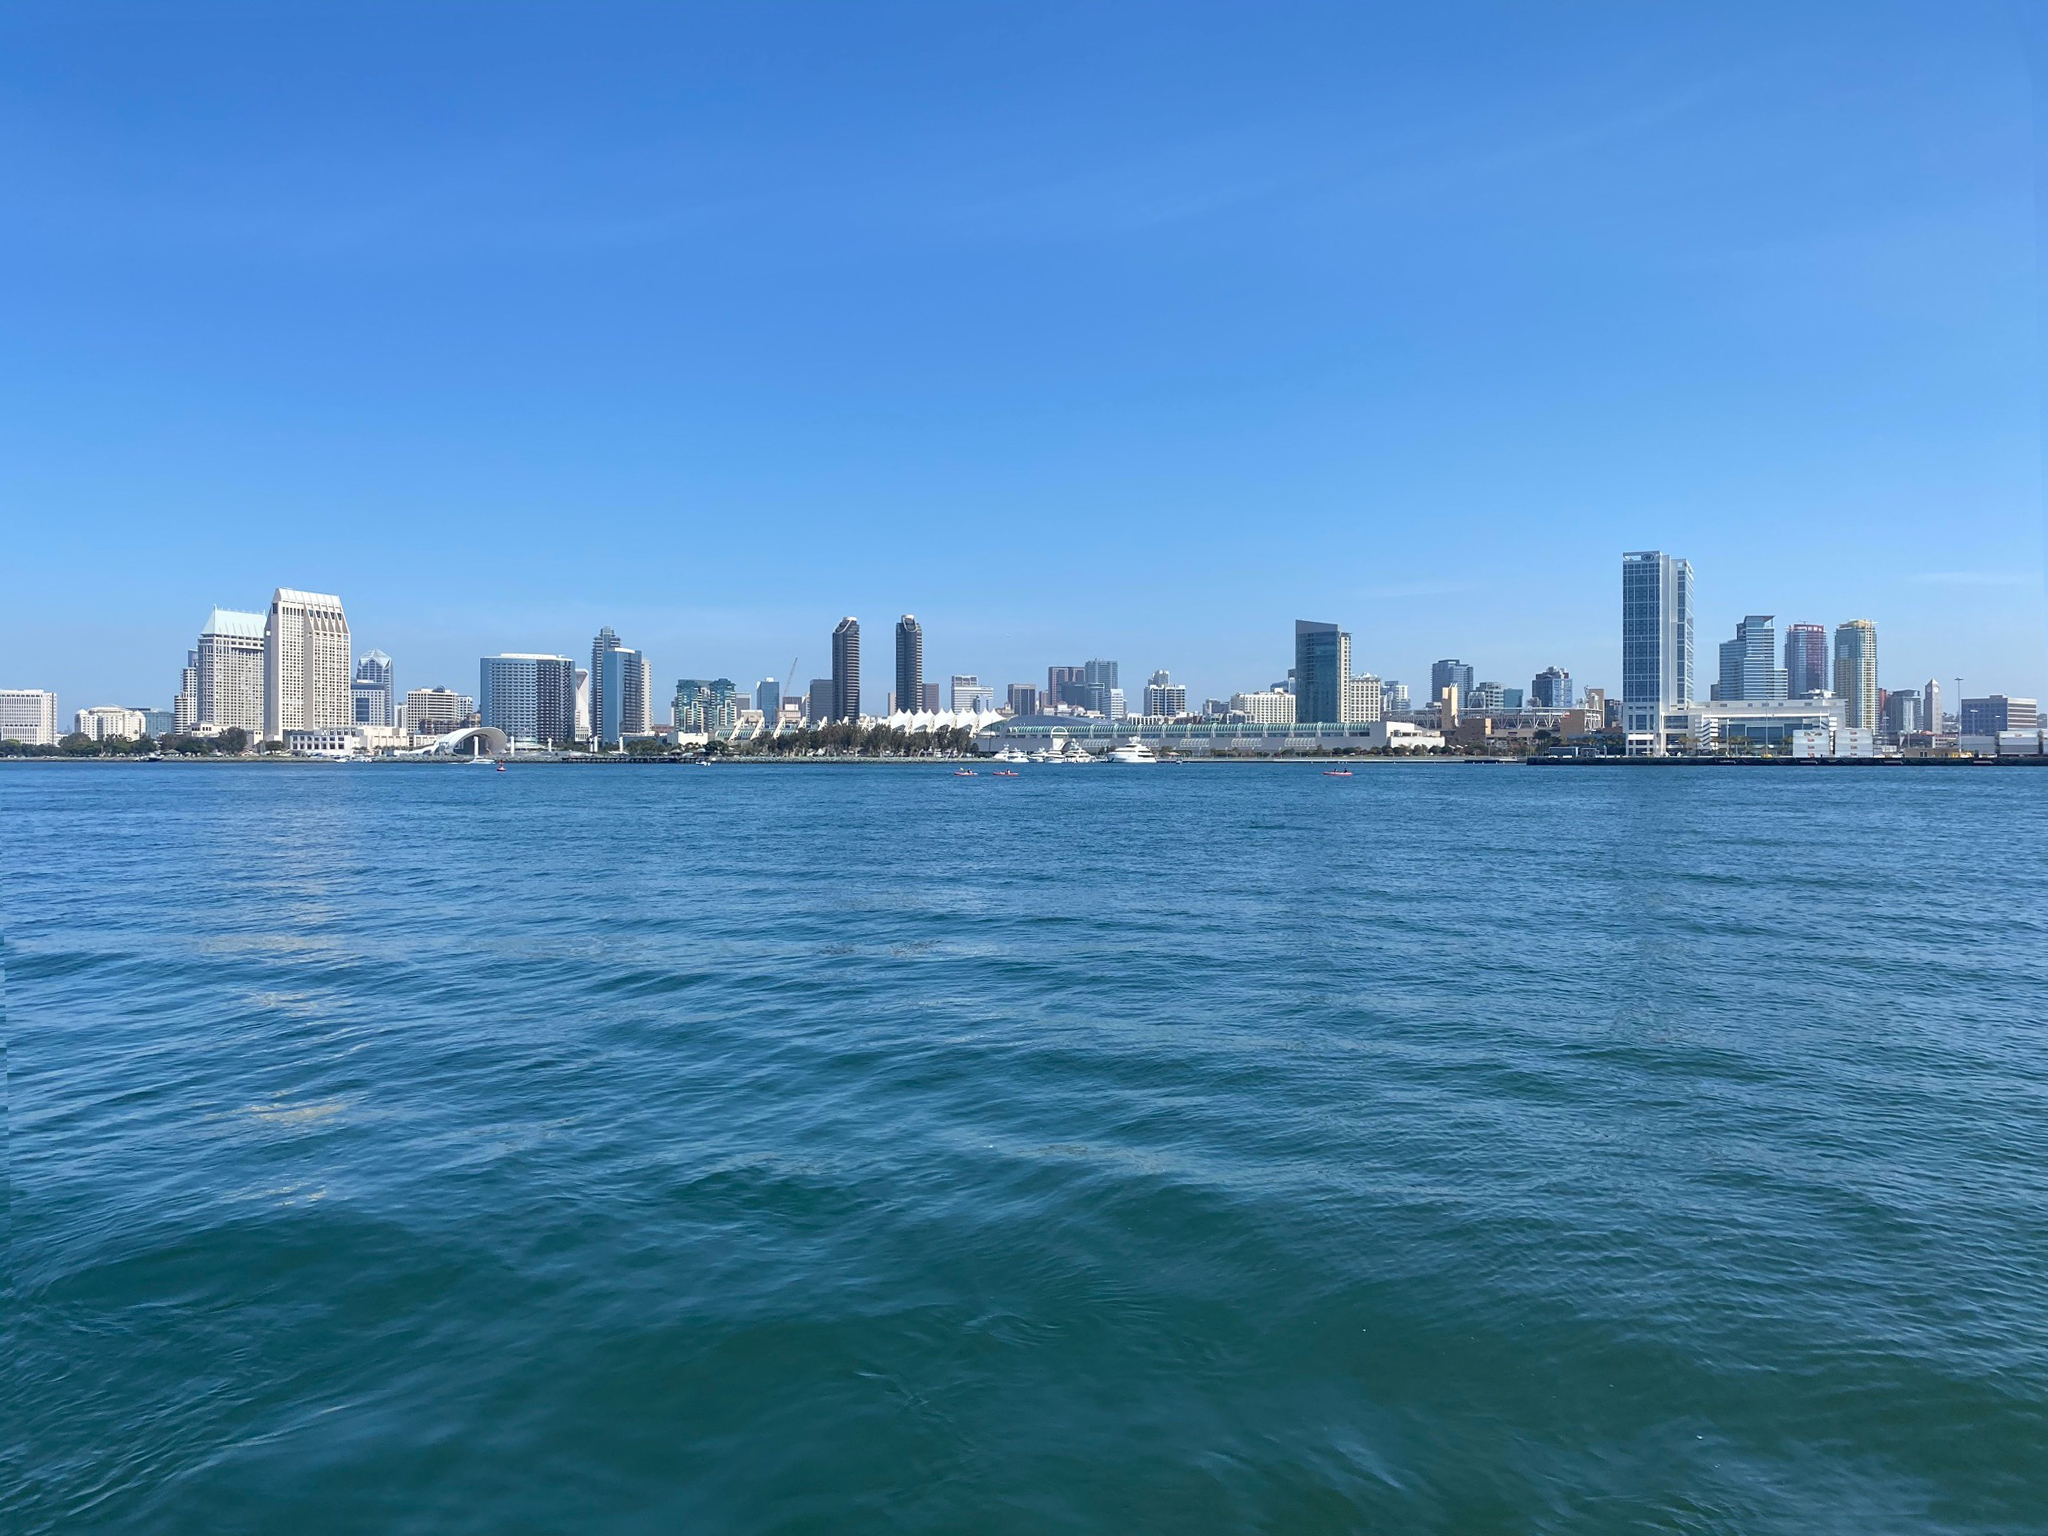
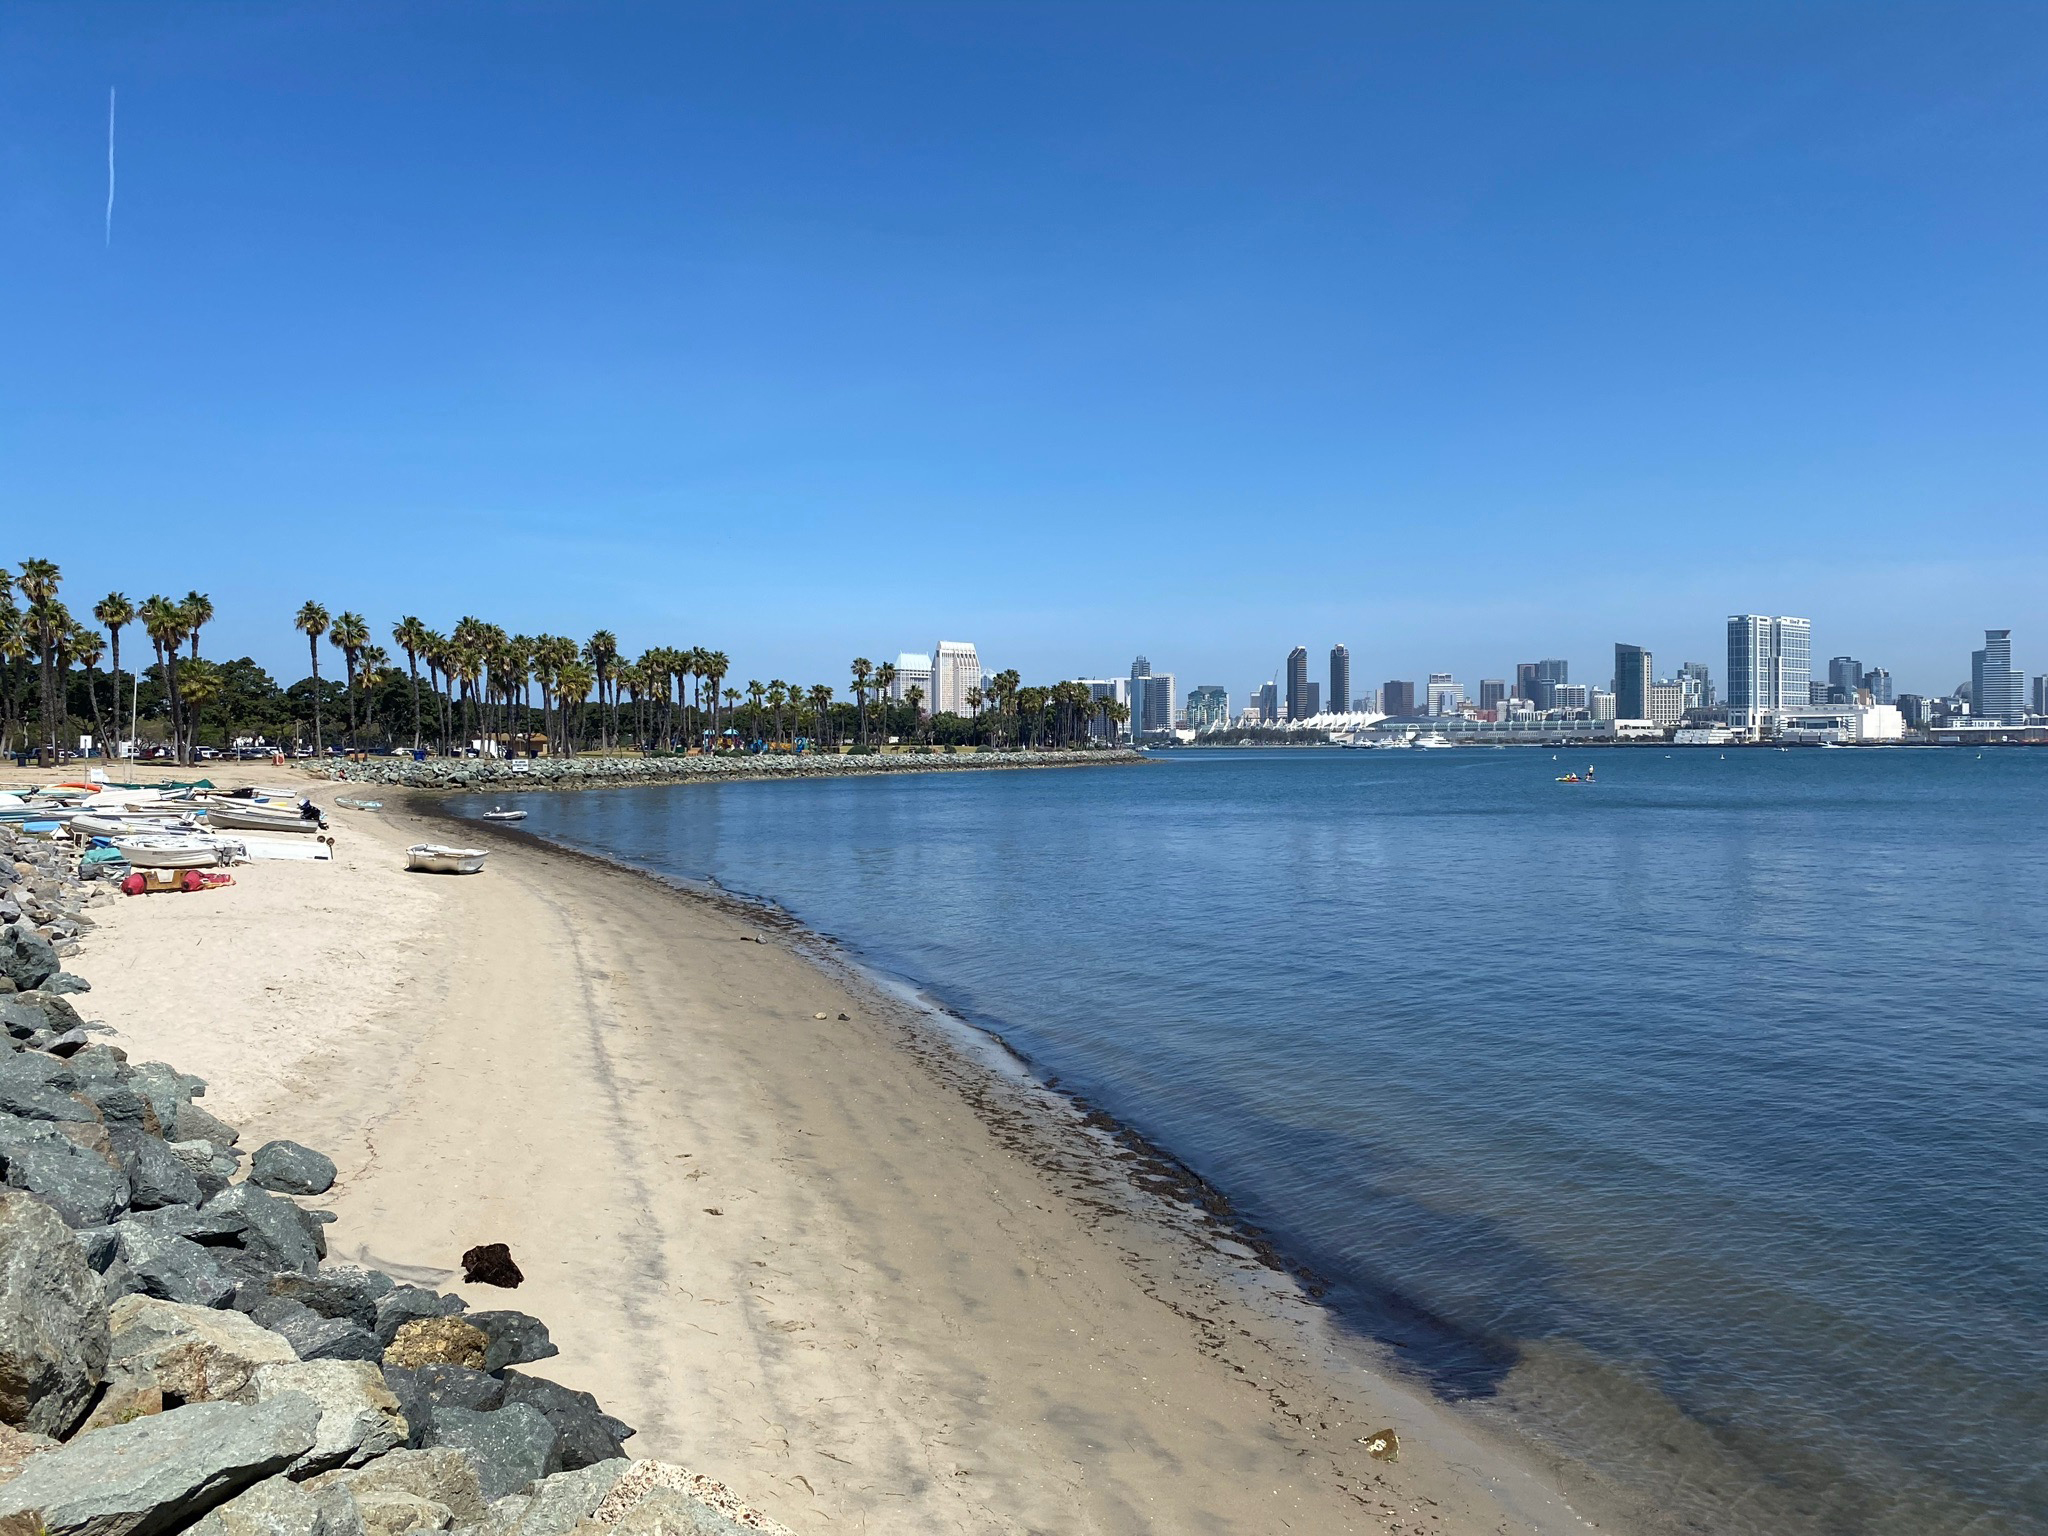
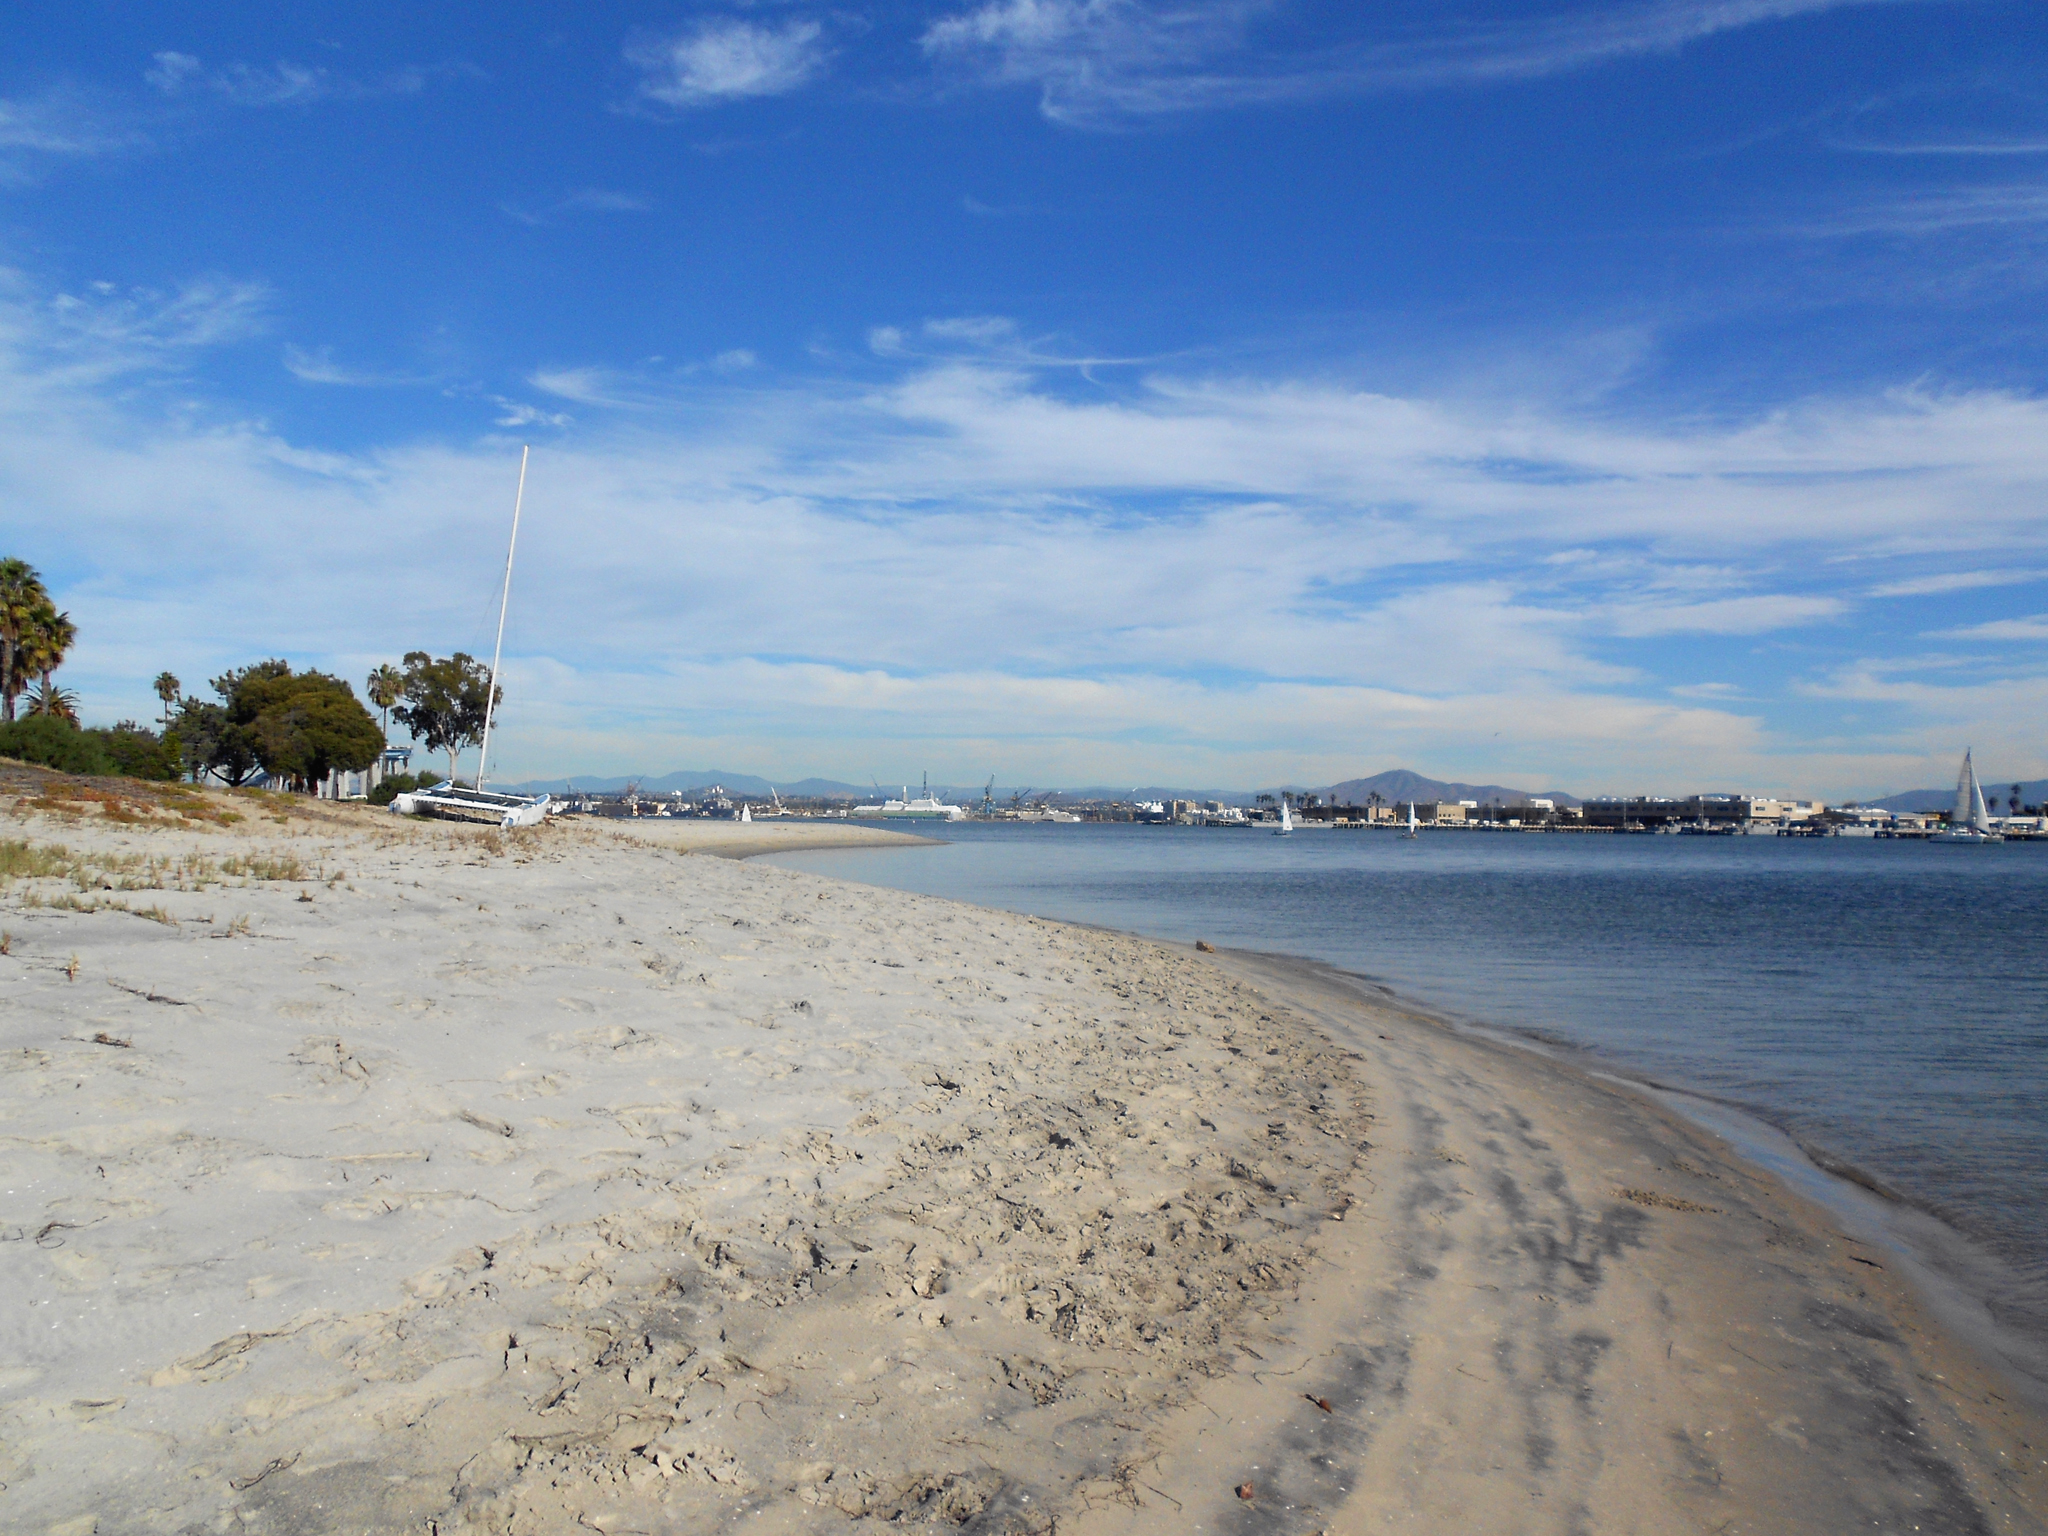
The Coronado Tidelands Park on Coronado Island is an excellent place to take in the scenery around San Diego Bay. There is ample parking (usually), restrooms, beach, and access to the Bayshore/Silver Strand Bikeway (shore path). A stroll east along the bikeway provides exceptional views of the San Diego skyline across San Diego Bay (Figure 137).
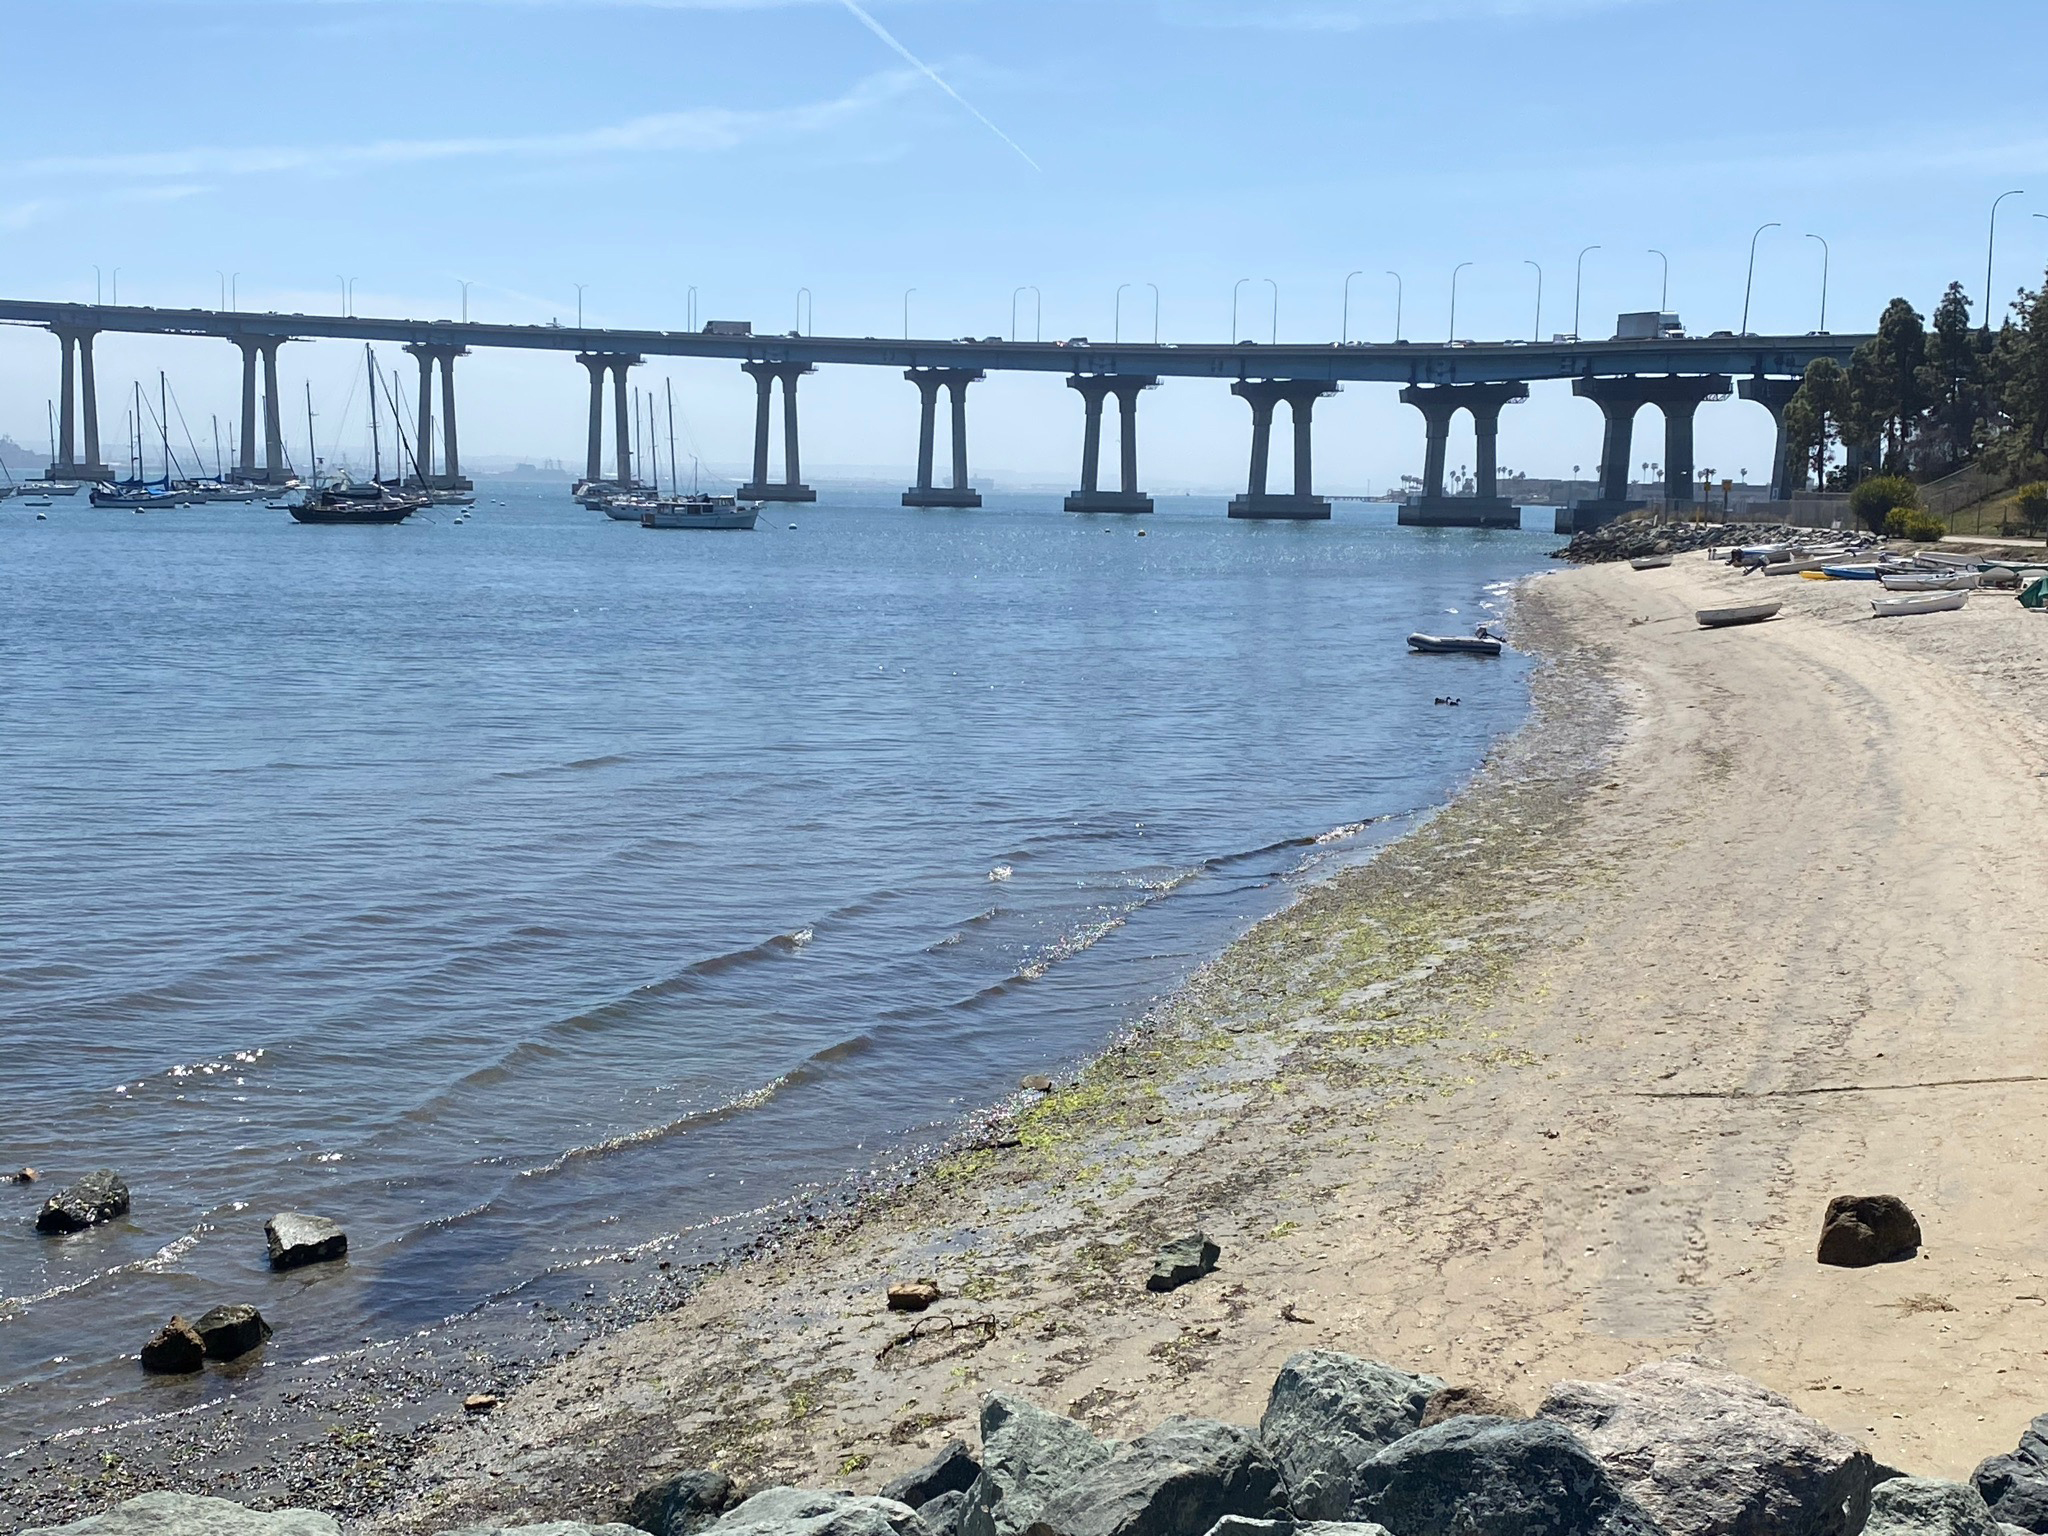
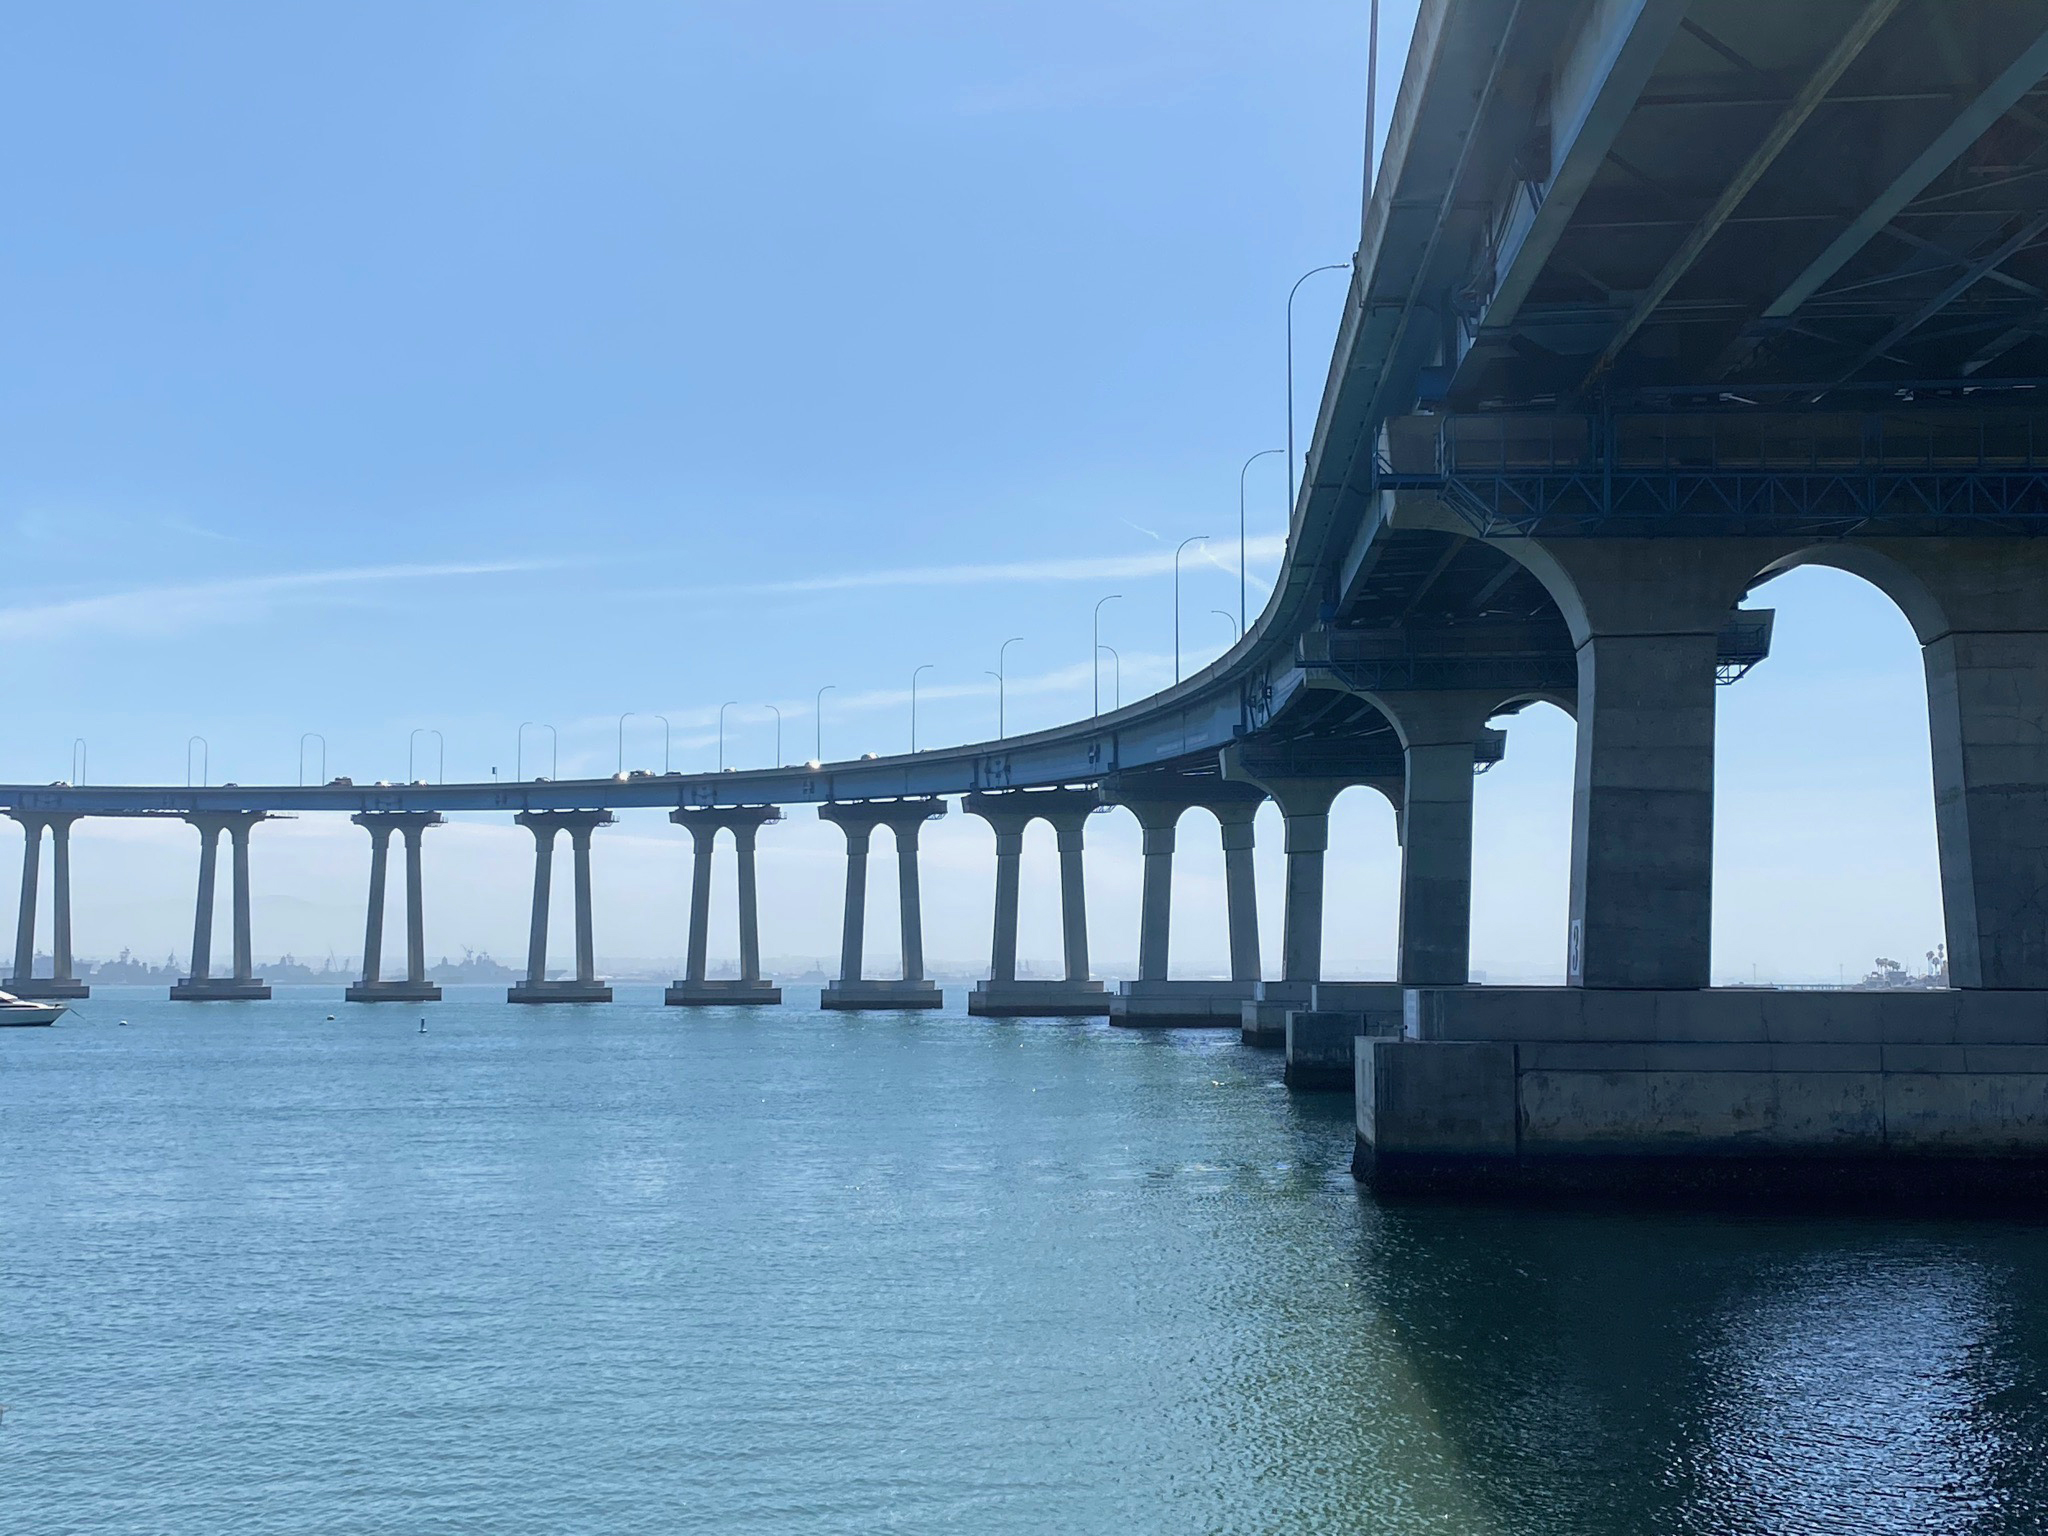
The Alquist-Priolo fault zones map shows an unnamed fault that displaces Holocene activity coming onshore in the kayak launch area on the beach in Coronado Tidelands Park (Figure 138). This fault, and other fault strands offshore, go under the San Diego - Coronado Bridge (Figures 139 to 140).
The beach is a popular kayak launch area. A kayak tour starting at the Coronado Tidelands Park beach is a good way to appreciate the scenery and isolated beaches along Glorietta Bay (Figures 142 and 143). Note that thes beaches are inaccessible to hikers, but can be reached by kayaks or small boats.
The Bayshore Bikeway/Silver Strand Bikeway passes under the bridge (near the unnamed fault). The path turns inland to go around the Coronado Municipal Golf Course. The bike path ends at 5th Street where you can walk or ride over to Pomona Avenue to see where the Coronado Fault expresses itself as a low rise on 5th Street (Figure 144). The Coronado Fault line basically follow Pomona Avenue southward to the vicinity of the docks next to Hotel Del Coronado. |
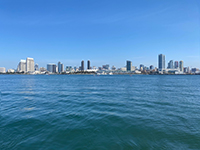
Fig. 137. View of San Diego skyline from Bayshore Bikeway on Coronado Island.
|
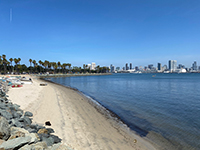
Fig. 138. View looking east along Coronado Tidelands Park Beach from near bridge. |
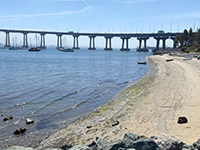
Fig. 139. Coronado Tidewaters Park Beach and west end of San Diego - Coronado Bridge. |
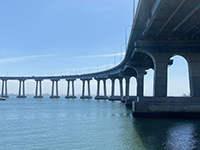
Fig. 140. View from the Bayshore Bikeway of the bend in the Coronado Bridge. |

Fig. 141. Kayak view of the bend in the San Diego - Coronado Bridge.
|

Fig. 142. Beach near where the fault runs along the shoreline in Glorietta Bay.
|
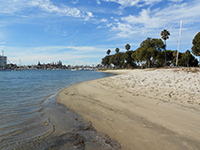
Fig. 143. View of the beach where a fault line goes into Glorietta Bay. |
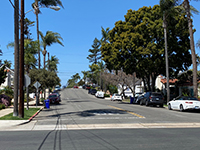
Fig. 144. Fault scarp as slope in road near 5th and Pomona Ave. on Coronado Island.
|
|

| Fig. 145. Panoramic view of the San Diego - Coronado Bridge and southern San Diego Bay looking south from Coronado Tidelands Park on Coronado Island. The unnamed fault runs parallel to the Bayshore Parkway just offshore, but comes onshore at the kayak/small boat put-in on the beach in the park (at the right of the bridge. The bridge was constructed to withstand strong earthquakes, but really, no one can be absolutely sure until a large one happens. |
A22
Hotel del Coronado and the Coronado Beach/Silver Strand
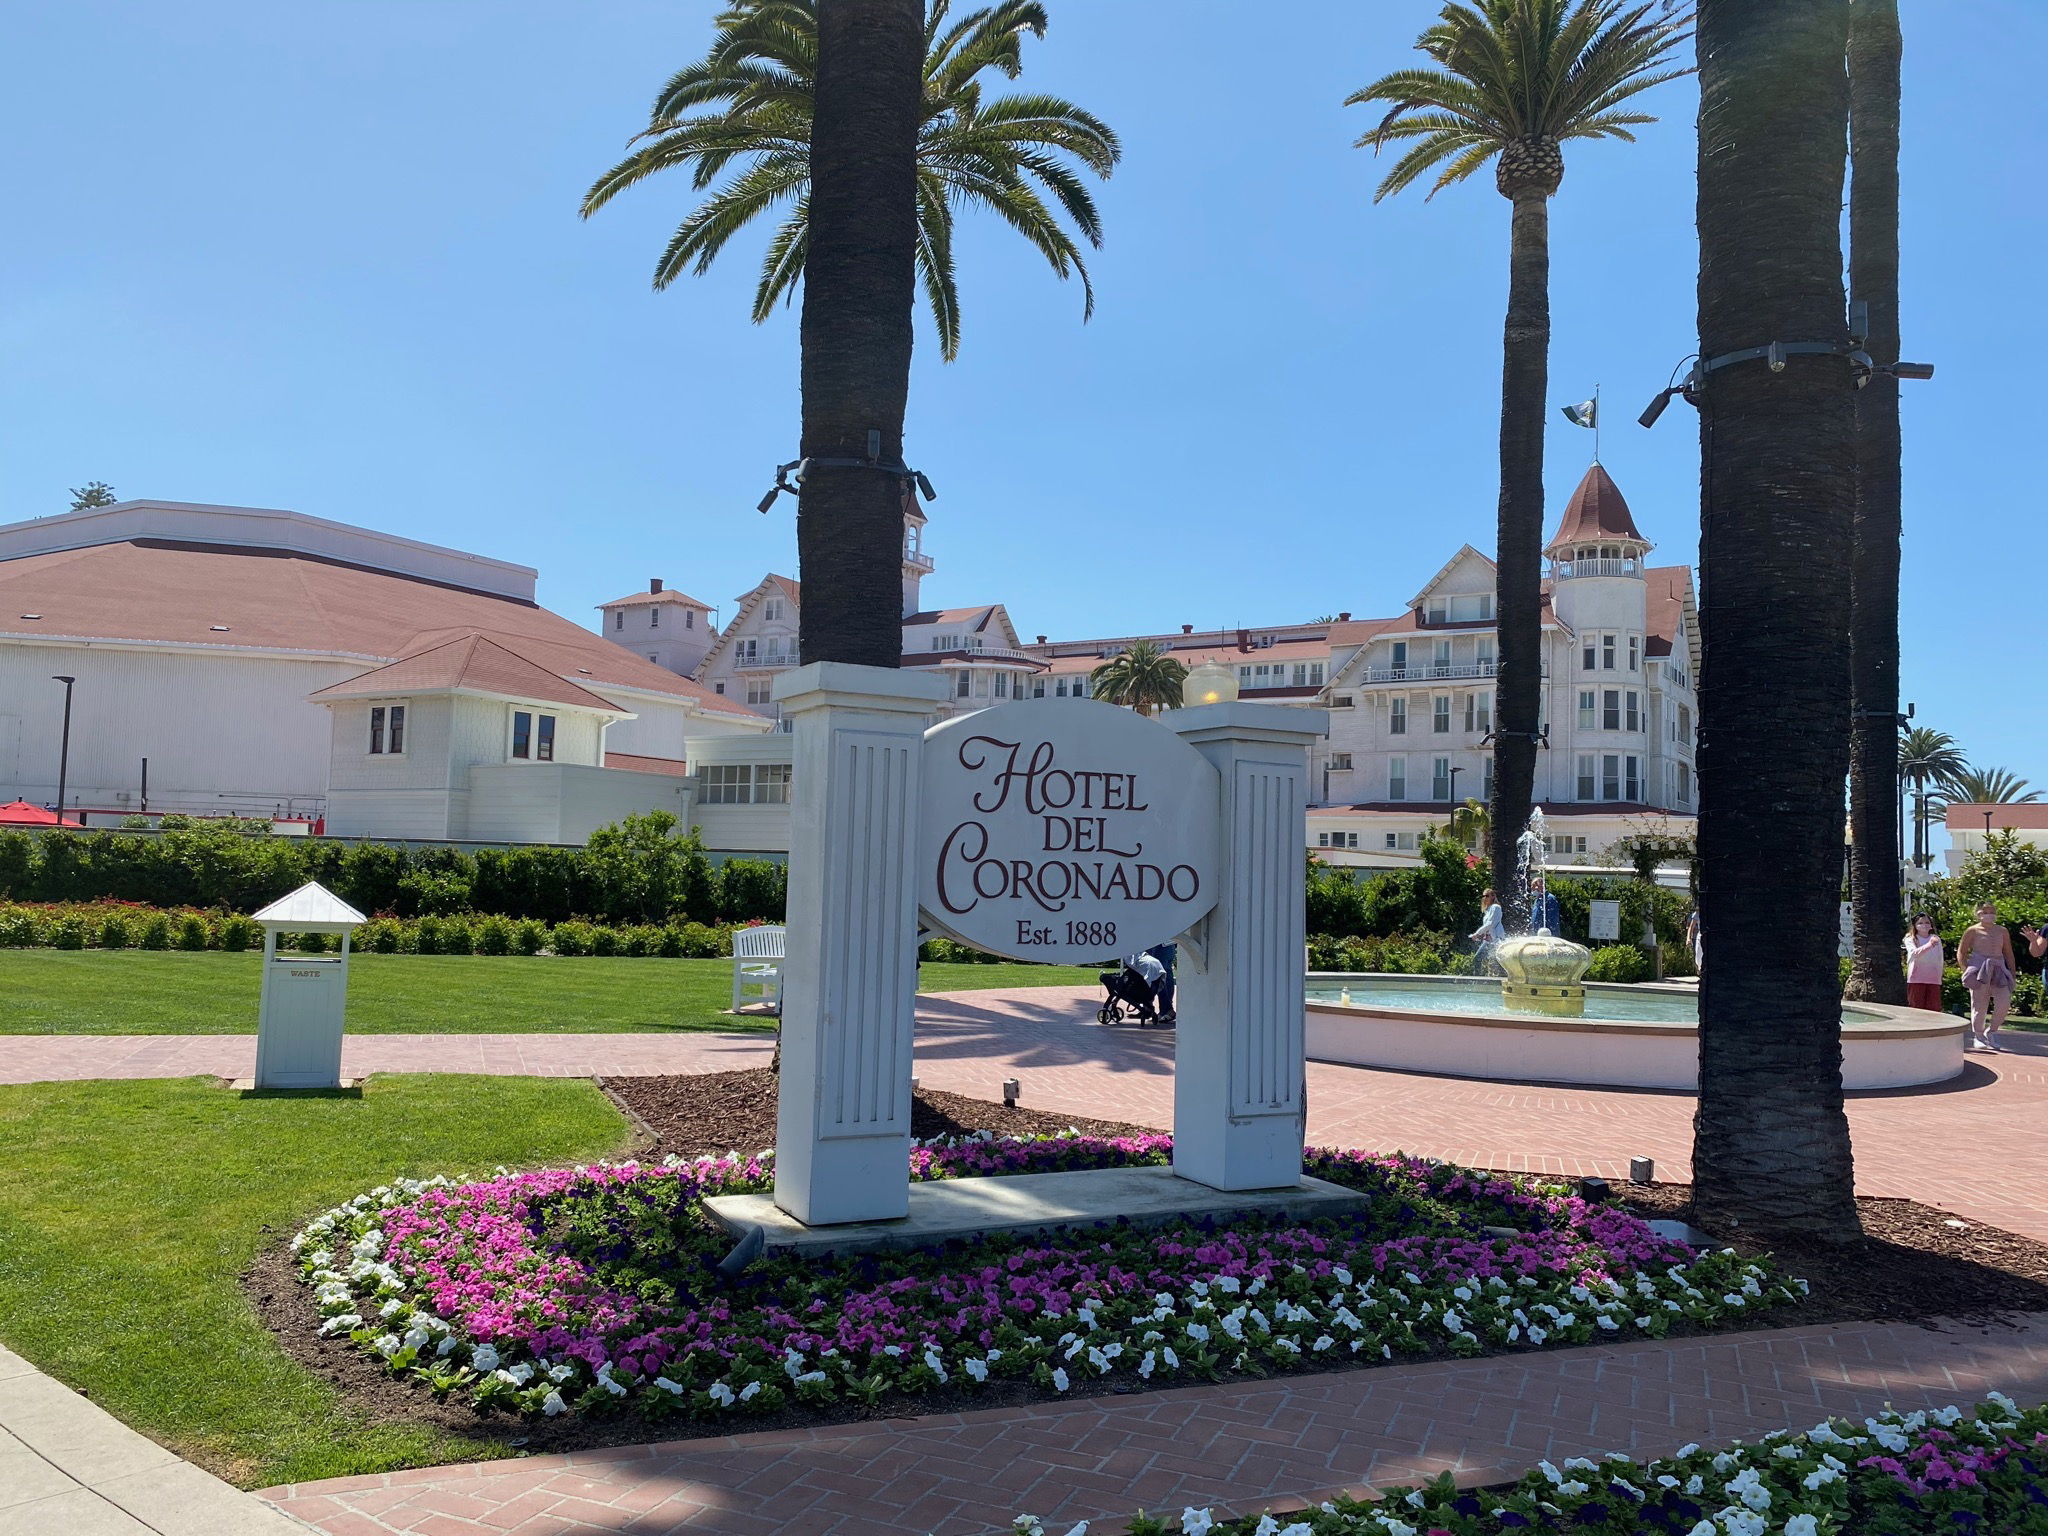
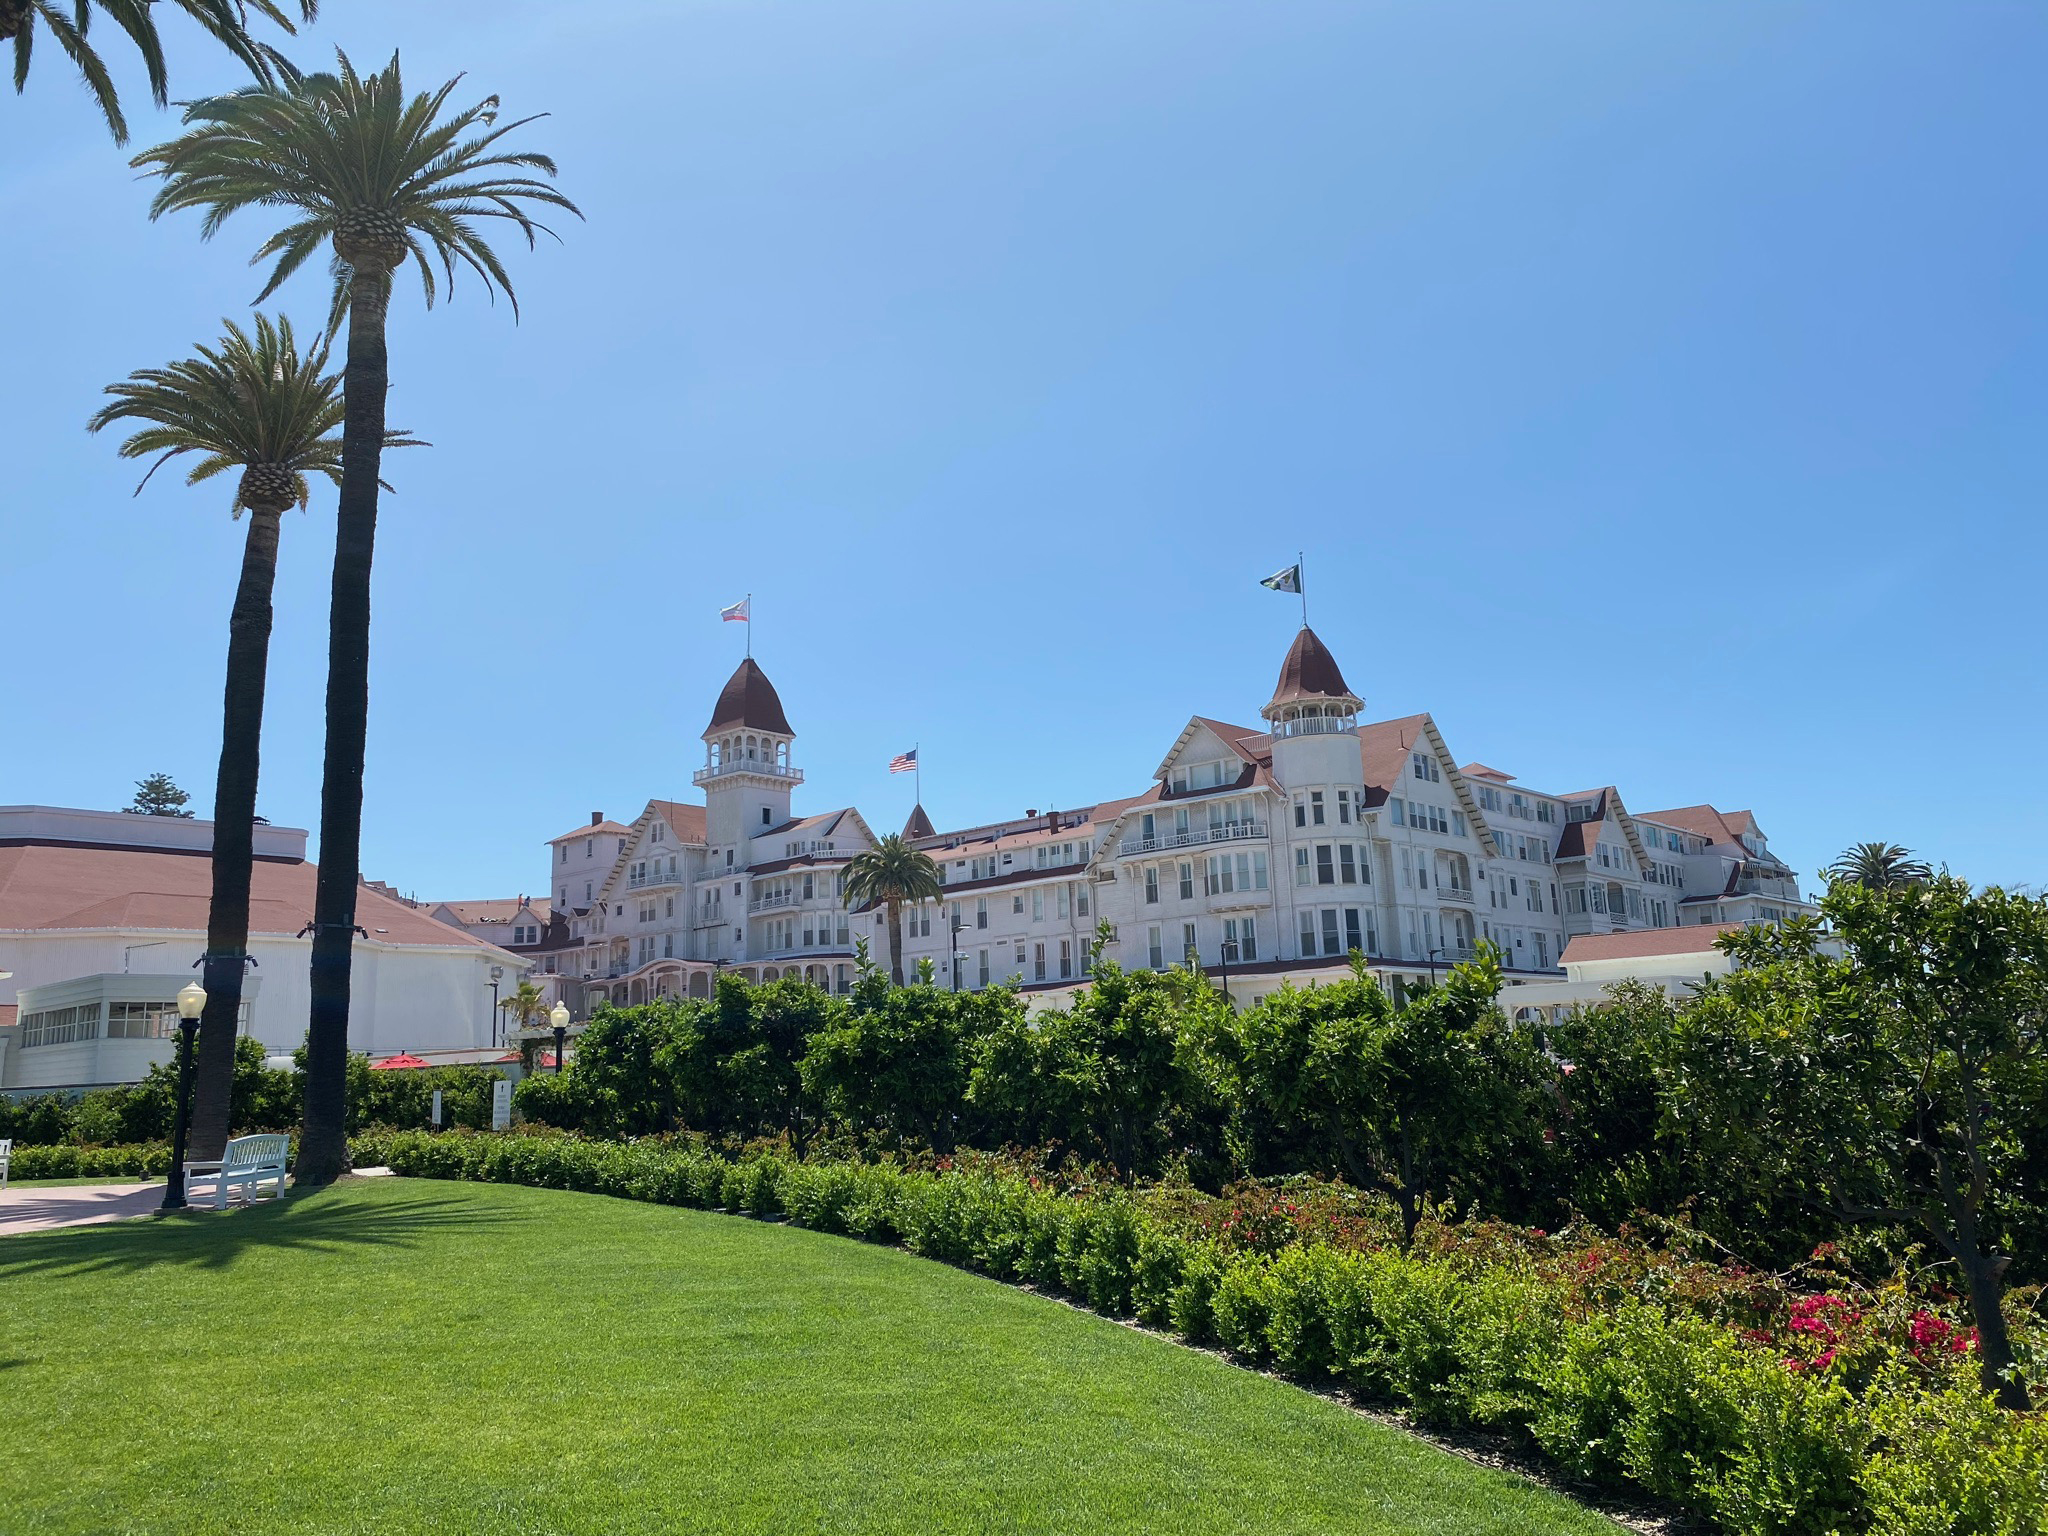
Hotel del Coronado is one of San Diego's most famous landmarks (Figures 146 to 149). When construction of the hotel was completed in 1888 it was the largest hotel resort in the world, and the second largest wooden structure in the United States. The hotel has a rich history hosting famous guests (presidents, royalty, and celebrities, and a setting for numerous movies and books). The hotel is located just a few hundred feet north from where the Coronado Fault passes through the Silver Strand barrier island and runs offshore. The flexible old wooden structure is known to shake, but survive significant damage, from local and regional earthquakes.
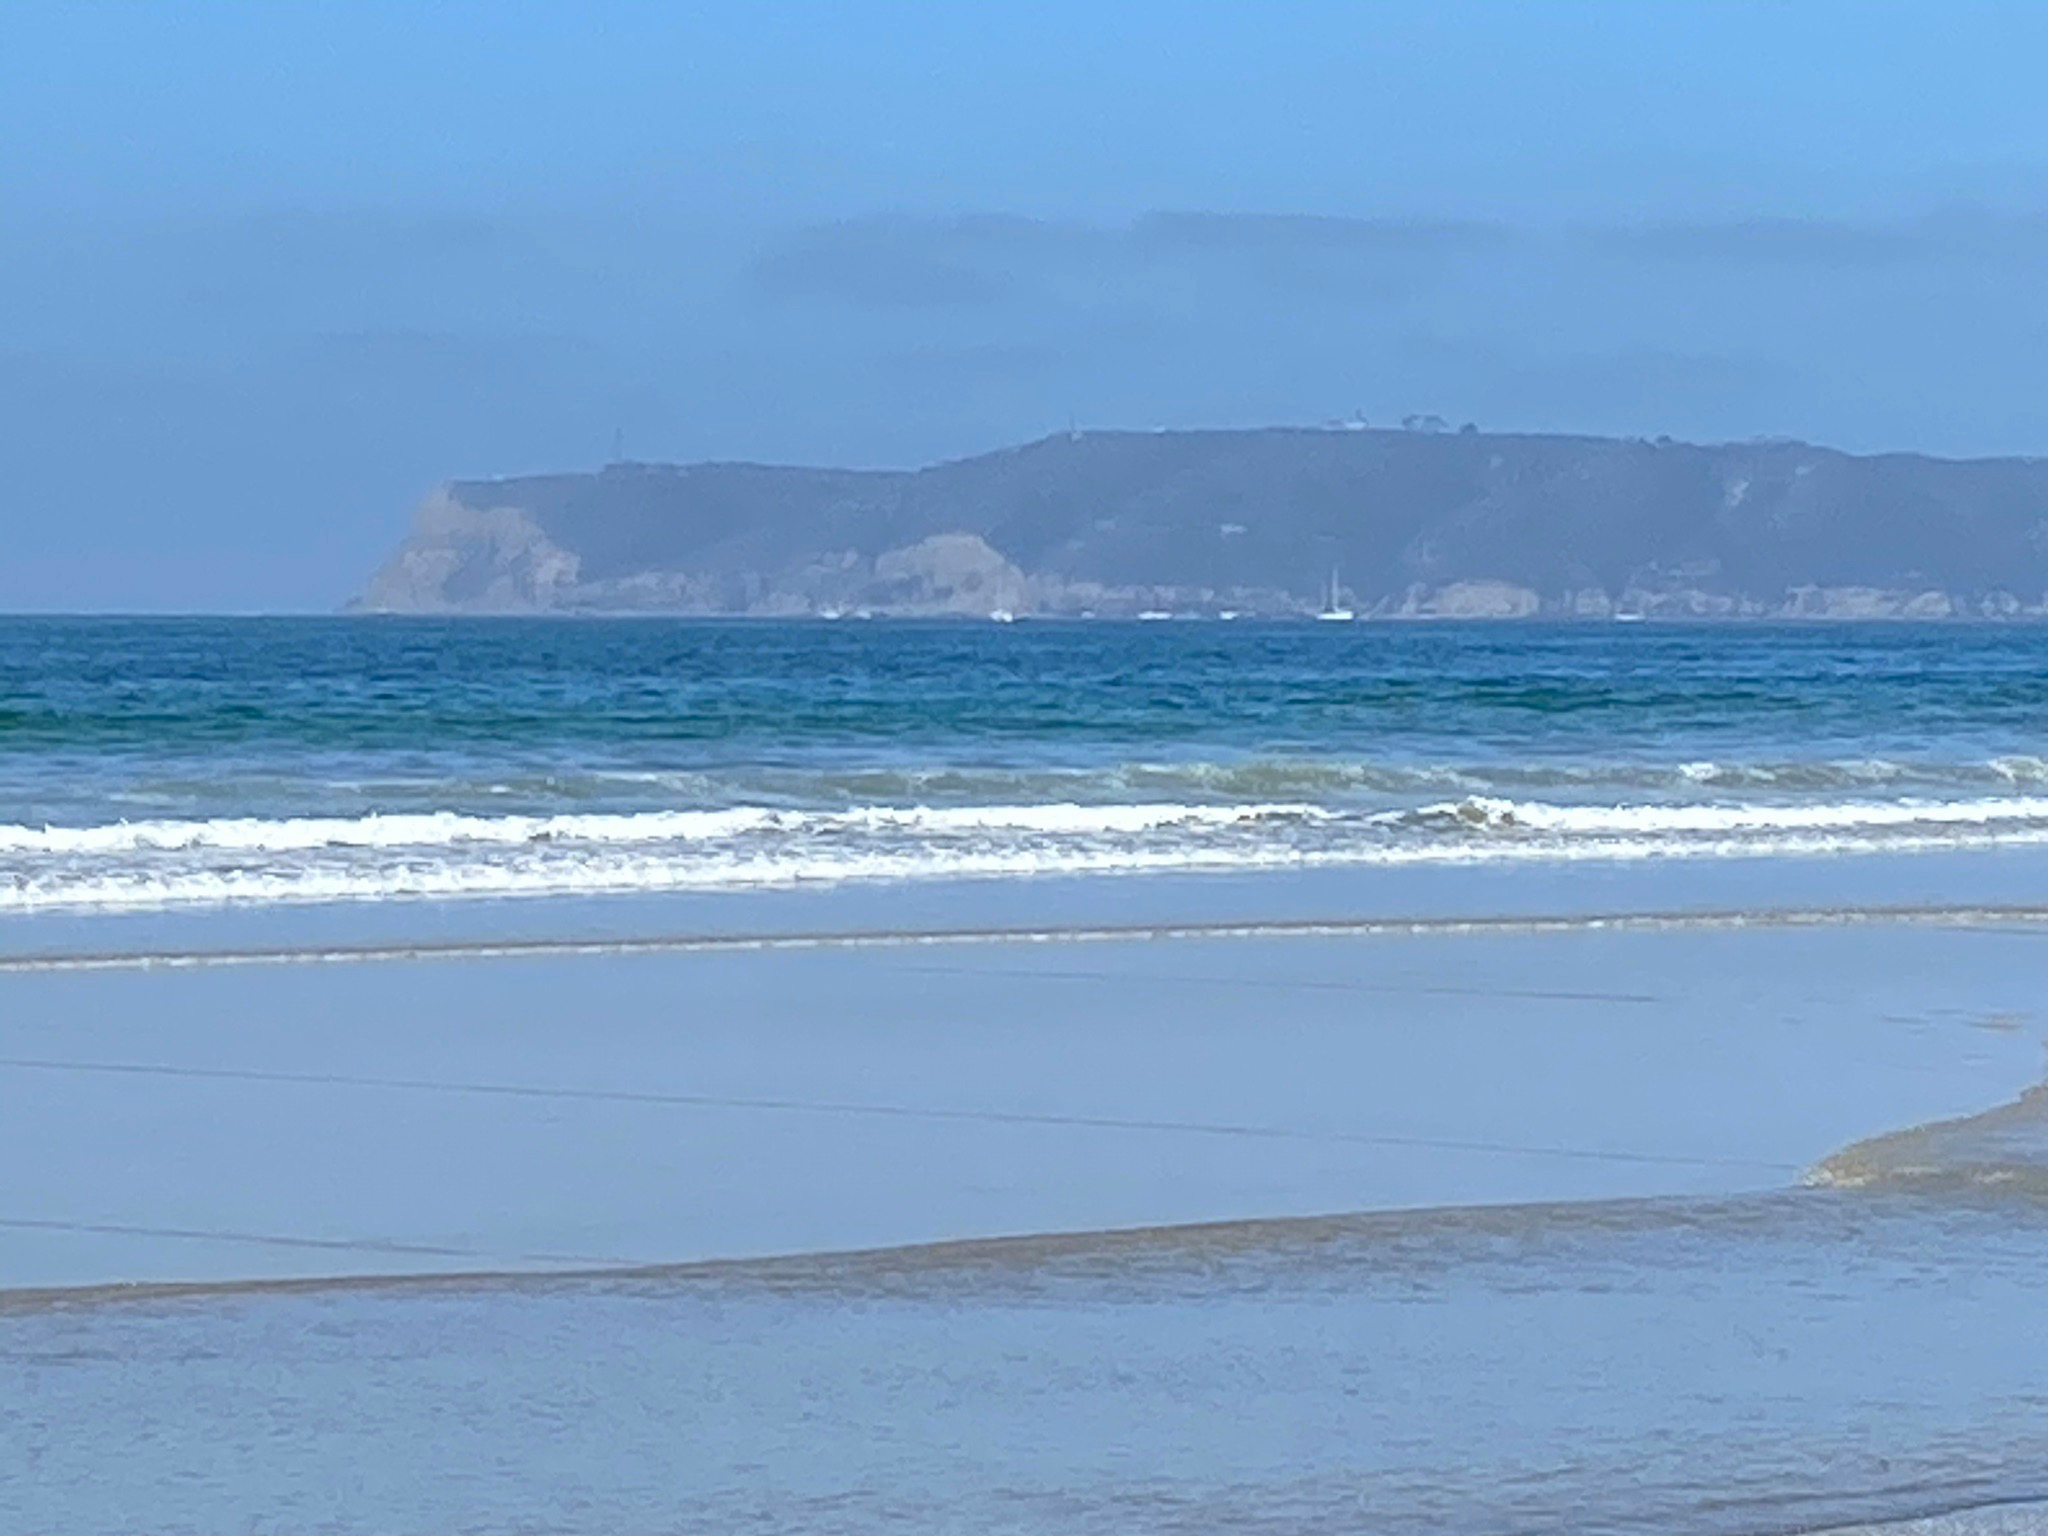
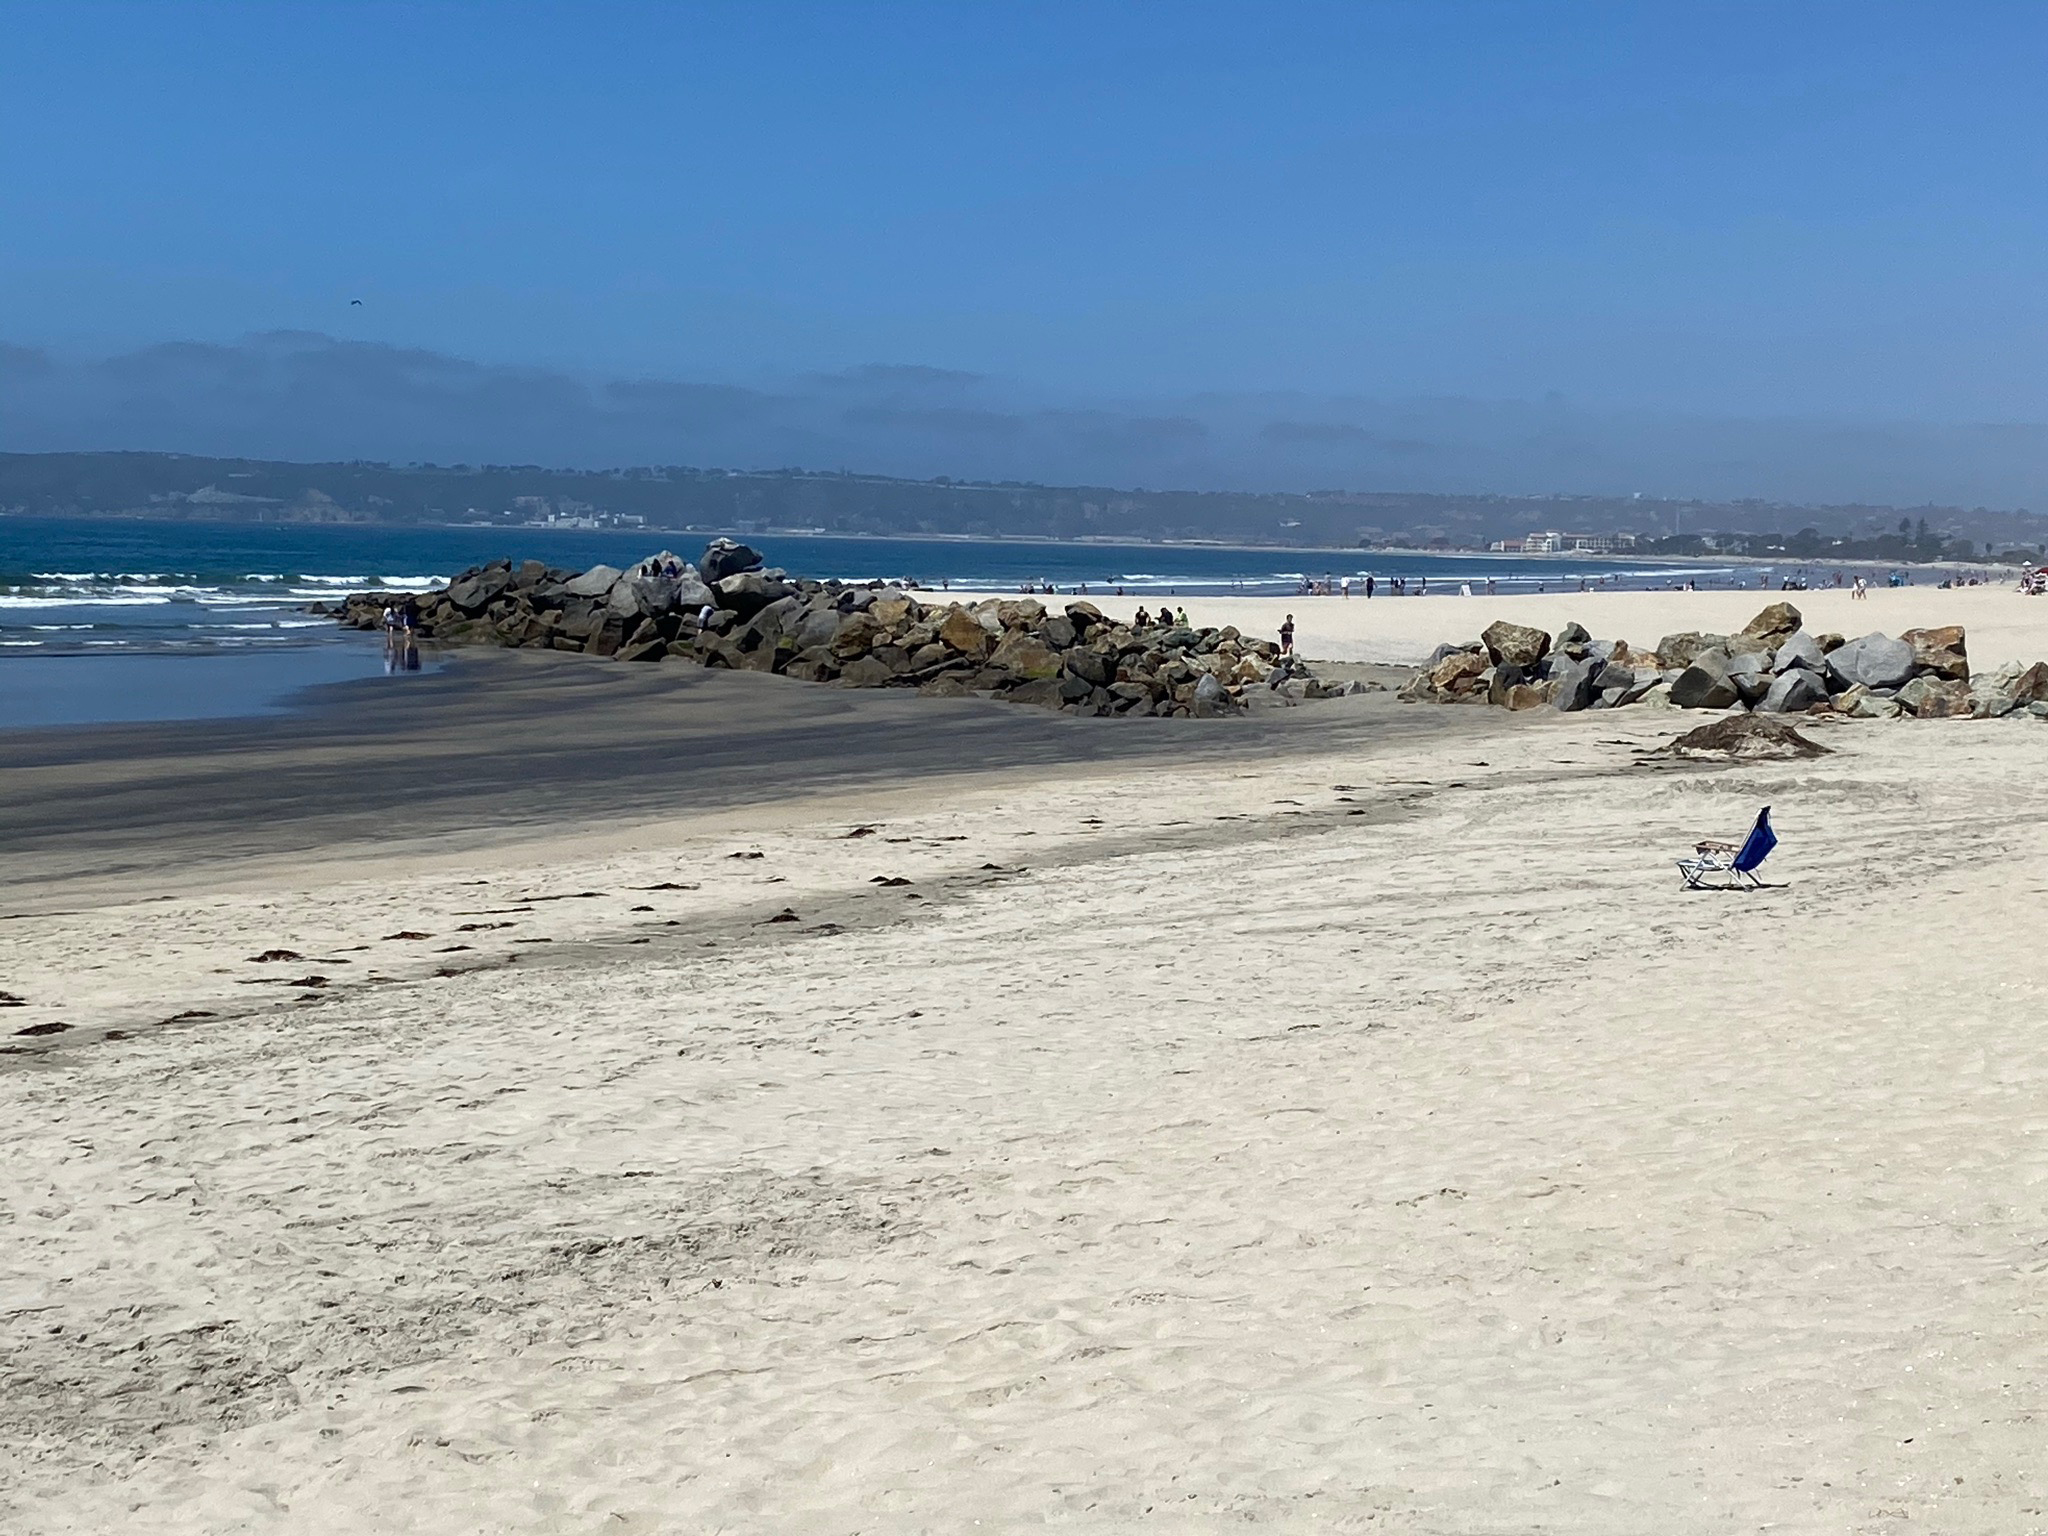
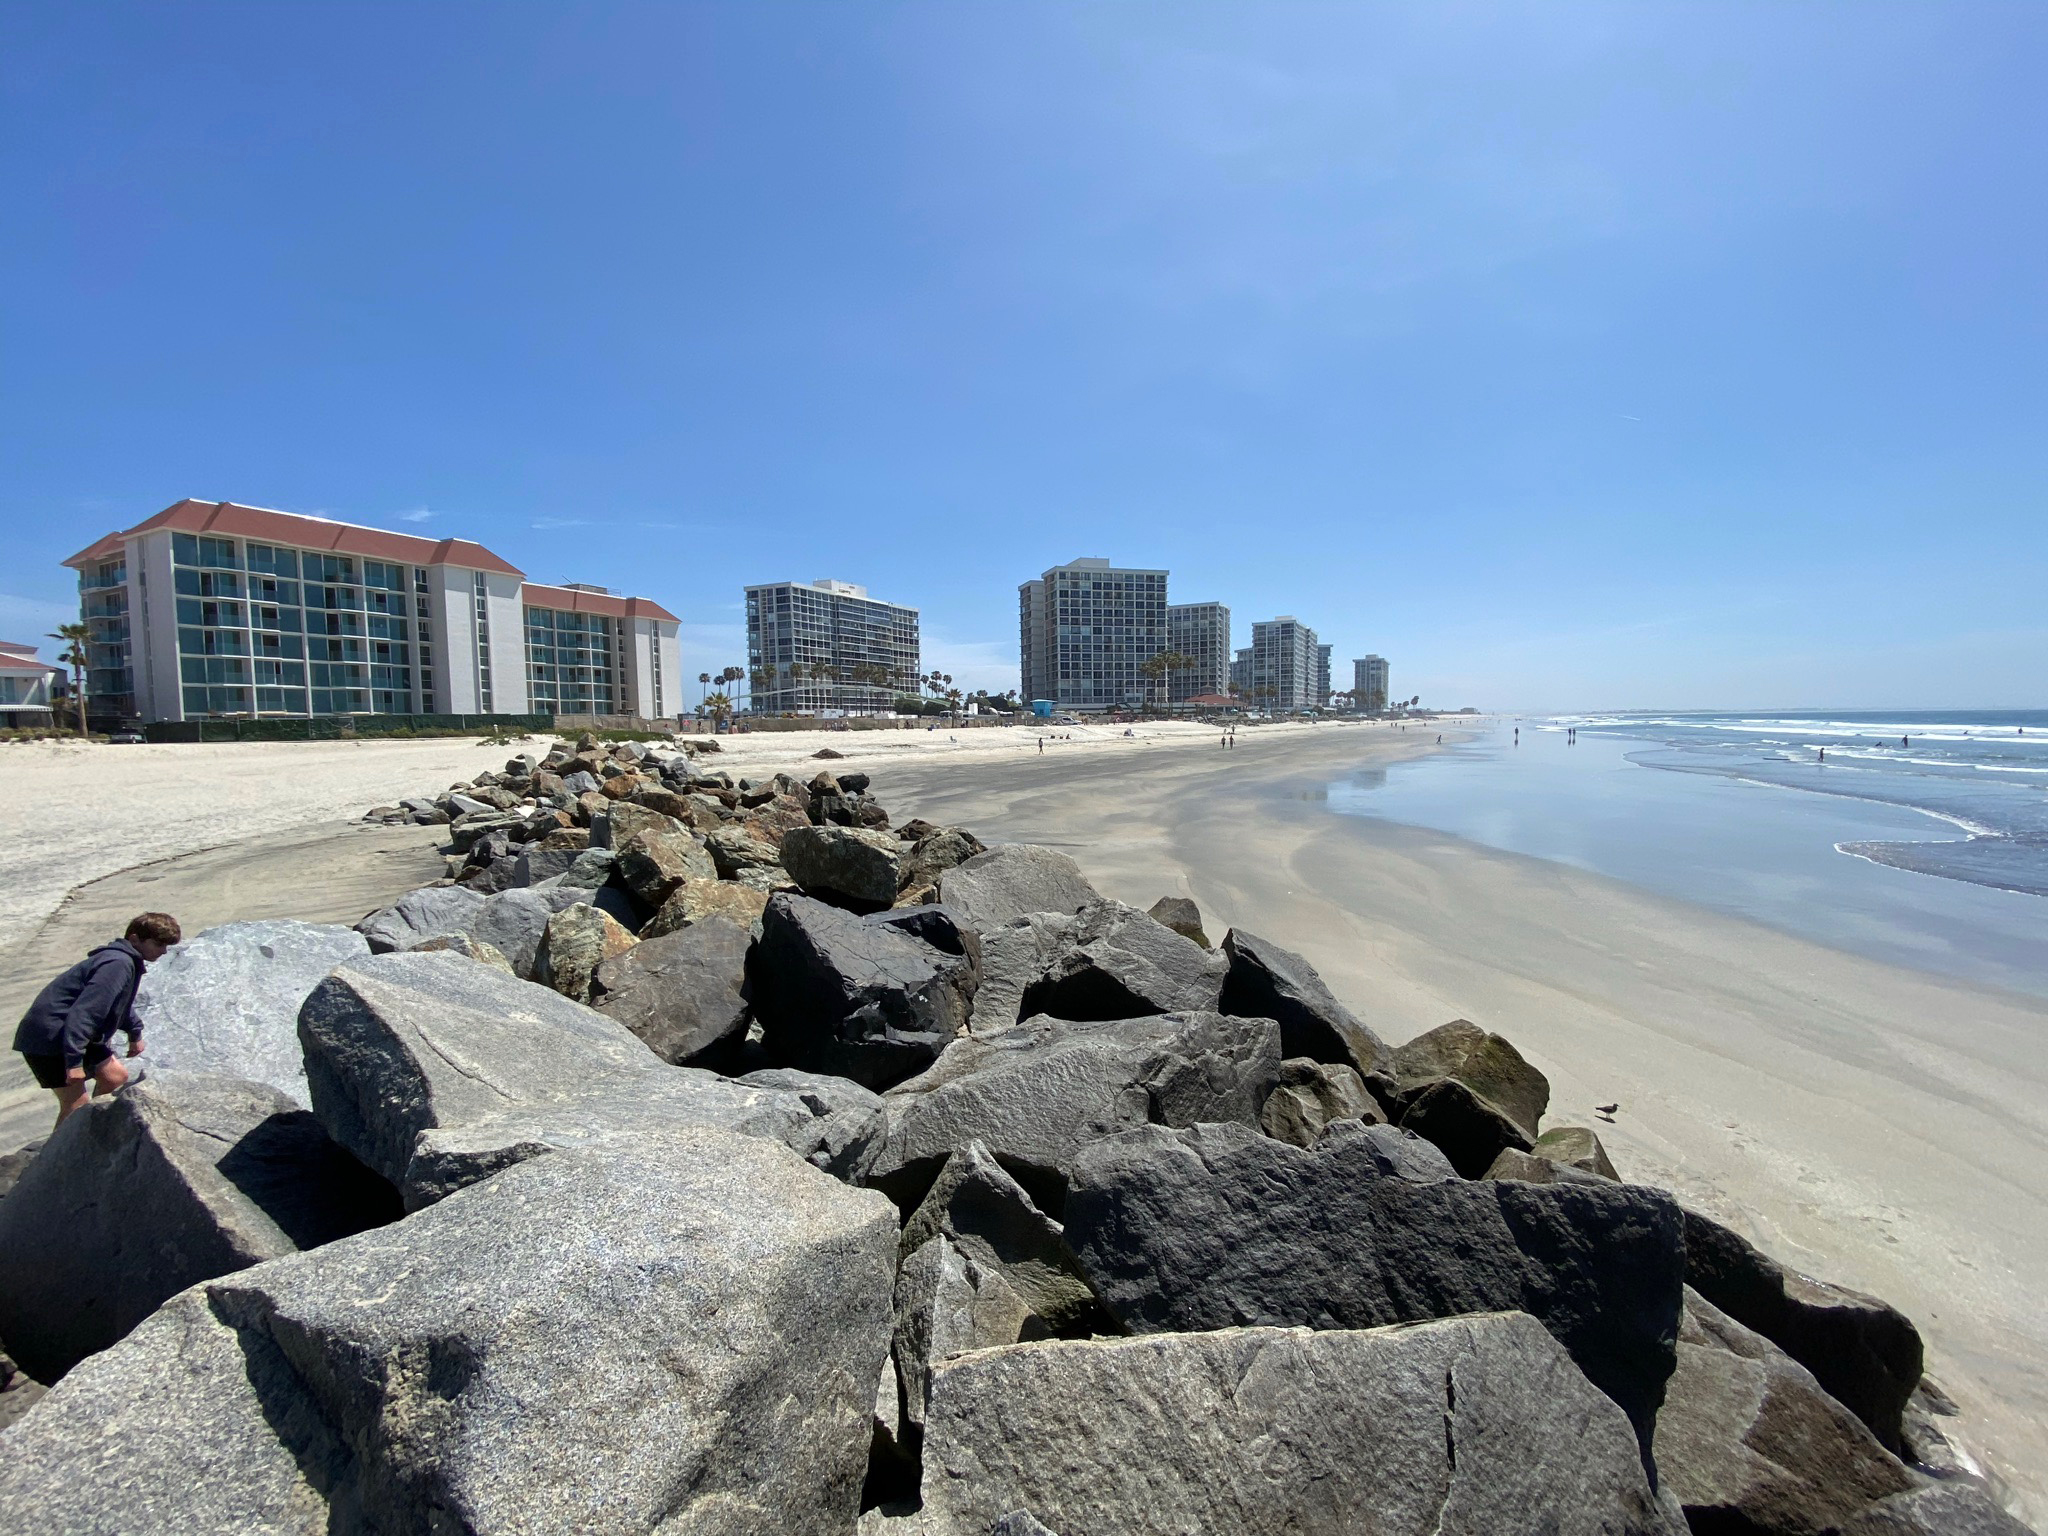
Figure 150 is a view looking north from Coronado Beach near the Hotel del Coronado toward the massive headlands of Point Loma near the mouth of San Diego Bay. Near Hotel del Coronado a rip-rap groin has been added to trap sand to keep a wide beach in front of the hotel (Figures 151 and 152). The groin is the dividing boundary of Coronado Beach to the north and the Silver Strand (beach) to the south. Figure 153 is a view looking south along the Silver Strand. The Coronado Fault runs offshore under the beach somewhere with a few hundred feet south of the rip-rap groin. |

Fig. 146. Walking entrance to the Hotel del Coronado on Orange Avenue.
|
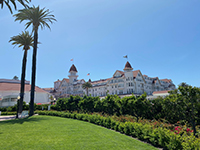
Fig. 147. Hotel del Coronado from a coast-side garden by the Coronado Rail-Trail. |
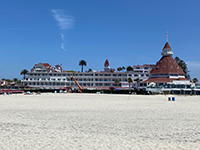
Fig. 148. View from Coronado Beach of the Hotel del Coronado. |
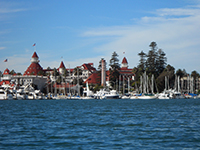
Fig. 149. View looking across Glorietta Bay toward the Hotel del Coronado dock area. |
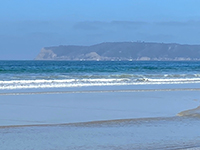
Fig. 150. View looking north from Coronado Beach to Point Loma on the northwest side of San Diego Bay.
|
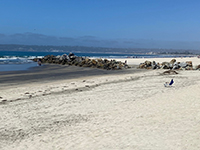
Fig. 151. A rip-rap groin on Coronado Beach near where the Coronado fault goes offshore. |
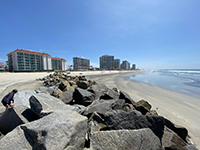
Fig. 152. View looking along the groin along the fault line at Coronado Beach near Hotel Del Coronado. |
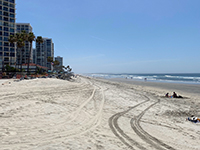
Fig. 153. View looking south from near Hotel Del Coronado along Silver Strand Beach where the fault goes offshore. |
|
A23
Selected Resources
Abbott, P.L., 1999, The Rise and Fall of San Diego: 150 Million Years Of History Recorded In Sedimentary Rocks. San Diego: Sunbelt Publications, 231 p.
Bennett, R.A., Friedrich, A.M., and Furlong, K.P., 2004, Codependent histories of the San Andreas and San Jacinto fault zones from inversion of fault displacement rate: Geology, v. 32, p. 961-964. (link)
California Department of Conservation, California Geological Survey, 2019, EQ Zapp: California Earthquake Hazards Zone Application (EQ Zapp) [Maps of Alquist-Priolo Act - Earthquake Fault Zones used for construction zoning]. (link)
California Earthquake Authority, 2020, Rose Canyon Fault Earthquake Predictions. (link)
California Earthquake Authority, 2020, Earthquake Risk in San Diego. (link)
California Geological Survey, 1991, Earthquake Zones of Required Investigation: La Jolla Quadrangle. 1 sheet. Map scale 1:24,000. (link)
California Geological Survey, 2021, Earthquake Zones of Required Investigation: Point Loma Quadrangle. 1 sheet. Map scale 1:24,000. (link)
DeFrisco, M., 2021, The Rose Canyon Fault in the Point Loma and La Jolla 7.5 Minute Quadrangles San Diego County, California: California Geological Survey Fault Evaluation Report FER 265, 57 p., with tables and 3 plates. (link)
Deméré, T. A., Faults and Earthquakes in San Diego County: San Diego Museum of Natural History [accessed in archive, 2021]. (link)
Earthquake Engineering Research Institute (EERI), San Diego Chapter, 2020, San Diego Earthquake Planning Scenario: Magnitude 6.9 on the Rose Canyon Fault Zone, 87 p. (link)
Frederiksen, N.O., 1991, Age determinations for Eocene formations of the San Diego, California, area, based on pollen data, IN Abbott, P.L., and May, J.A., eds., Eocene geologic history, San Diego region: Society of Economic Paleontologists and Mineralogists, Pacific Section, Field Trip Guidebook, book 68, p. 201-215.
Kennedy, M.P., and Moore, G.W., 1971, Stratigraphic relations of Upper Cretaceous and Eocene formations, San Diego coastal area, California: American Association of Petroleum Geologists Bulletin, v. 55, no. 5, p. 709-722.
Kennedy, M.P. and Tan, SS., 2008, Geologic map of the San Diego 30' x 60' quadrangle, California: California Geological Survey Regional Geologic Map No. 3, sake 1:100,000. (Link)
Kern, J.P., 1977, Origin and history of upper Pleistocene marine terraces, San Diego California: GSA Bulletin, v. 8, no. 11, p. 1553-1566. (link)
Levitan, C., 2018, Where the fault meets to salt: Exploring the most dangerous line in La Jolla: La Jolla Light (newspaper). (link)
Lindvall, S.C. and Rockwell, T.K., 1995,
Holocene activity on the Rose Canyon Fault Zone in San Diego, California. Journal of Geophysical Research, v. 100, no. B12, p., 24,121-24,132 [Dec. 10,1995]. (link)
Moore, G.W. and Kennedy, M.P., 1975, Quaternary faults at San Diego Bay, California: Journal of Research of the U.S. Geological Survey: v. 3, no. 5, p. 589-595. (link)
Robbins, G., 2021, SD marks 150th anniversary of biggest quake: The San Diego Union-Tribune, May 26 2012. (link)
Robbins, G., 2017. San Diego quake could kill 2,000, inflict $40B in property damage. San Diego Union Tribune, Sept 12, 2017. (link)
Rockwell, T., 2010, The Rose Canyon Fault Zone in San Diego: Fifth International Conference on Recent Advances in Geotechnical Earthquake Engineering and Soil Dynamics, May 24-29, 2010, paper no. 7, 9 p. (link)
Sahakian, V., Bormann, J., Driscoll, N., Harding, A., Kent, G., and Wesnousky, S., 2017. Seismic constrains on the architecture of the Newport-Inglewood/Rose Canyon Fault: Implications for the length and magnitude of future earthquake ruptures. JGR Solid Earth, 07 March 2017. (link)
Singleton, D. M., Rockwell T.K, Murbach, D., Murbach, M., Maloney, J. M., Freeman, T., and Levy, Y. , 2019, Late-Holocene Rupture History of the Rose Canyon Fault in Old Town, San Diego: Implications for Cascading Earthquakes on the Newport-Inglewood-Rose Canyon Fault System, Bulletin of the Seismological Society of America, v. 109, 855-874. (link)
Sleeter, B.M., Calzia, J.P., and Walter, S.R., 2012, Earthquakes and faults in southern California (1970–2010): U.S. Geological Survey Scientific Investigations Map 3222, scale 1:450,000. (link)
Treiman, J.A., and Lundberg, M., compilers, 1999, Fault number 127f, Newport-Inglewood-Rose Canyon Fault Zone, San Diego section, in Quaternary fault and fold database of the United States: U.S. Geological Survey website. (link)
U.S. Geological Survey Earthquake Science Center, 2019, Animation of a Scenario M6.9 Earthquake on the Rose Canyon Fault. (link)
U.S. Geological Survey and California Geological Survey, Quaternary Fault and Fold Database of the United States, Interactive Quaternary Fault Map (accessed 4/1/2021). (link)
University City Community Association (UCCA), 2019, Video and Map: Tour the Rose Canyon Fault – San Diego’s Biggest Earthquake Threat: University City News website. (link)
|
| This preliminary guide was prepared by Phil Stoffer (MiraCosta College) assisted by MC Oceanography honors student, Karis Lee. |
| https://gotbooks.miracosta.edu/fieldtrips/Rose_Canyon_Fault/index.html |
4/20/2021 |
|
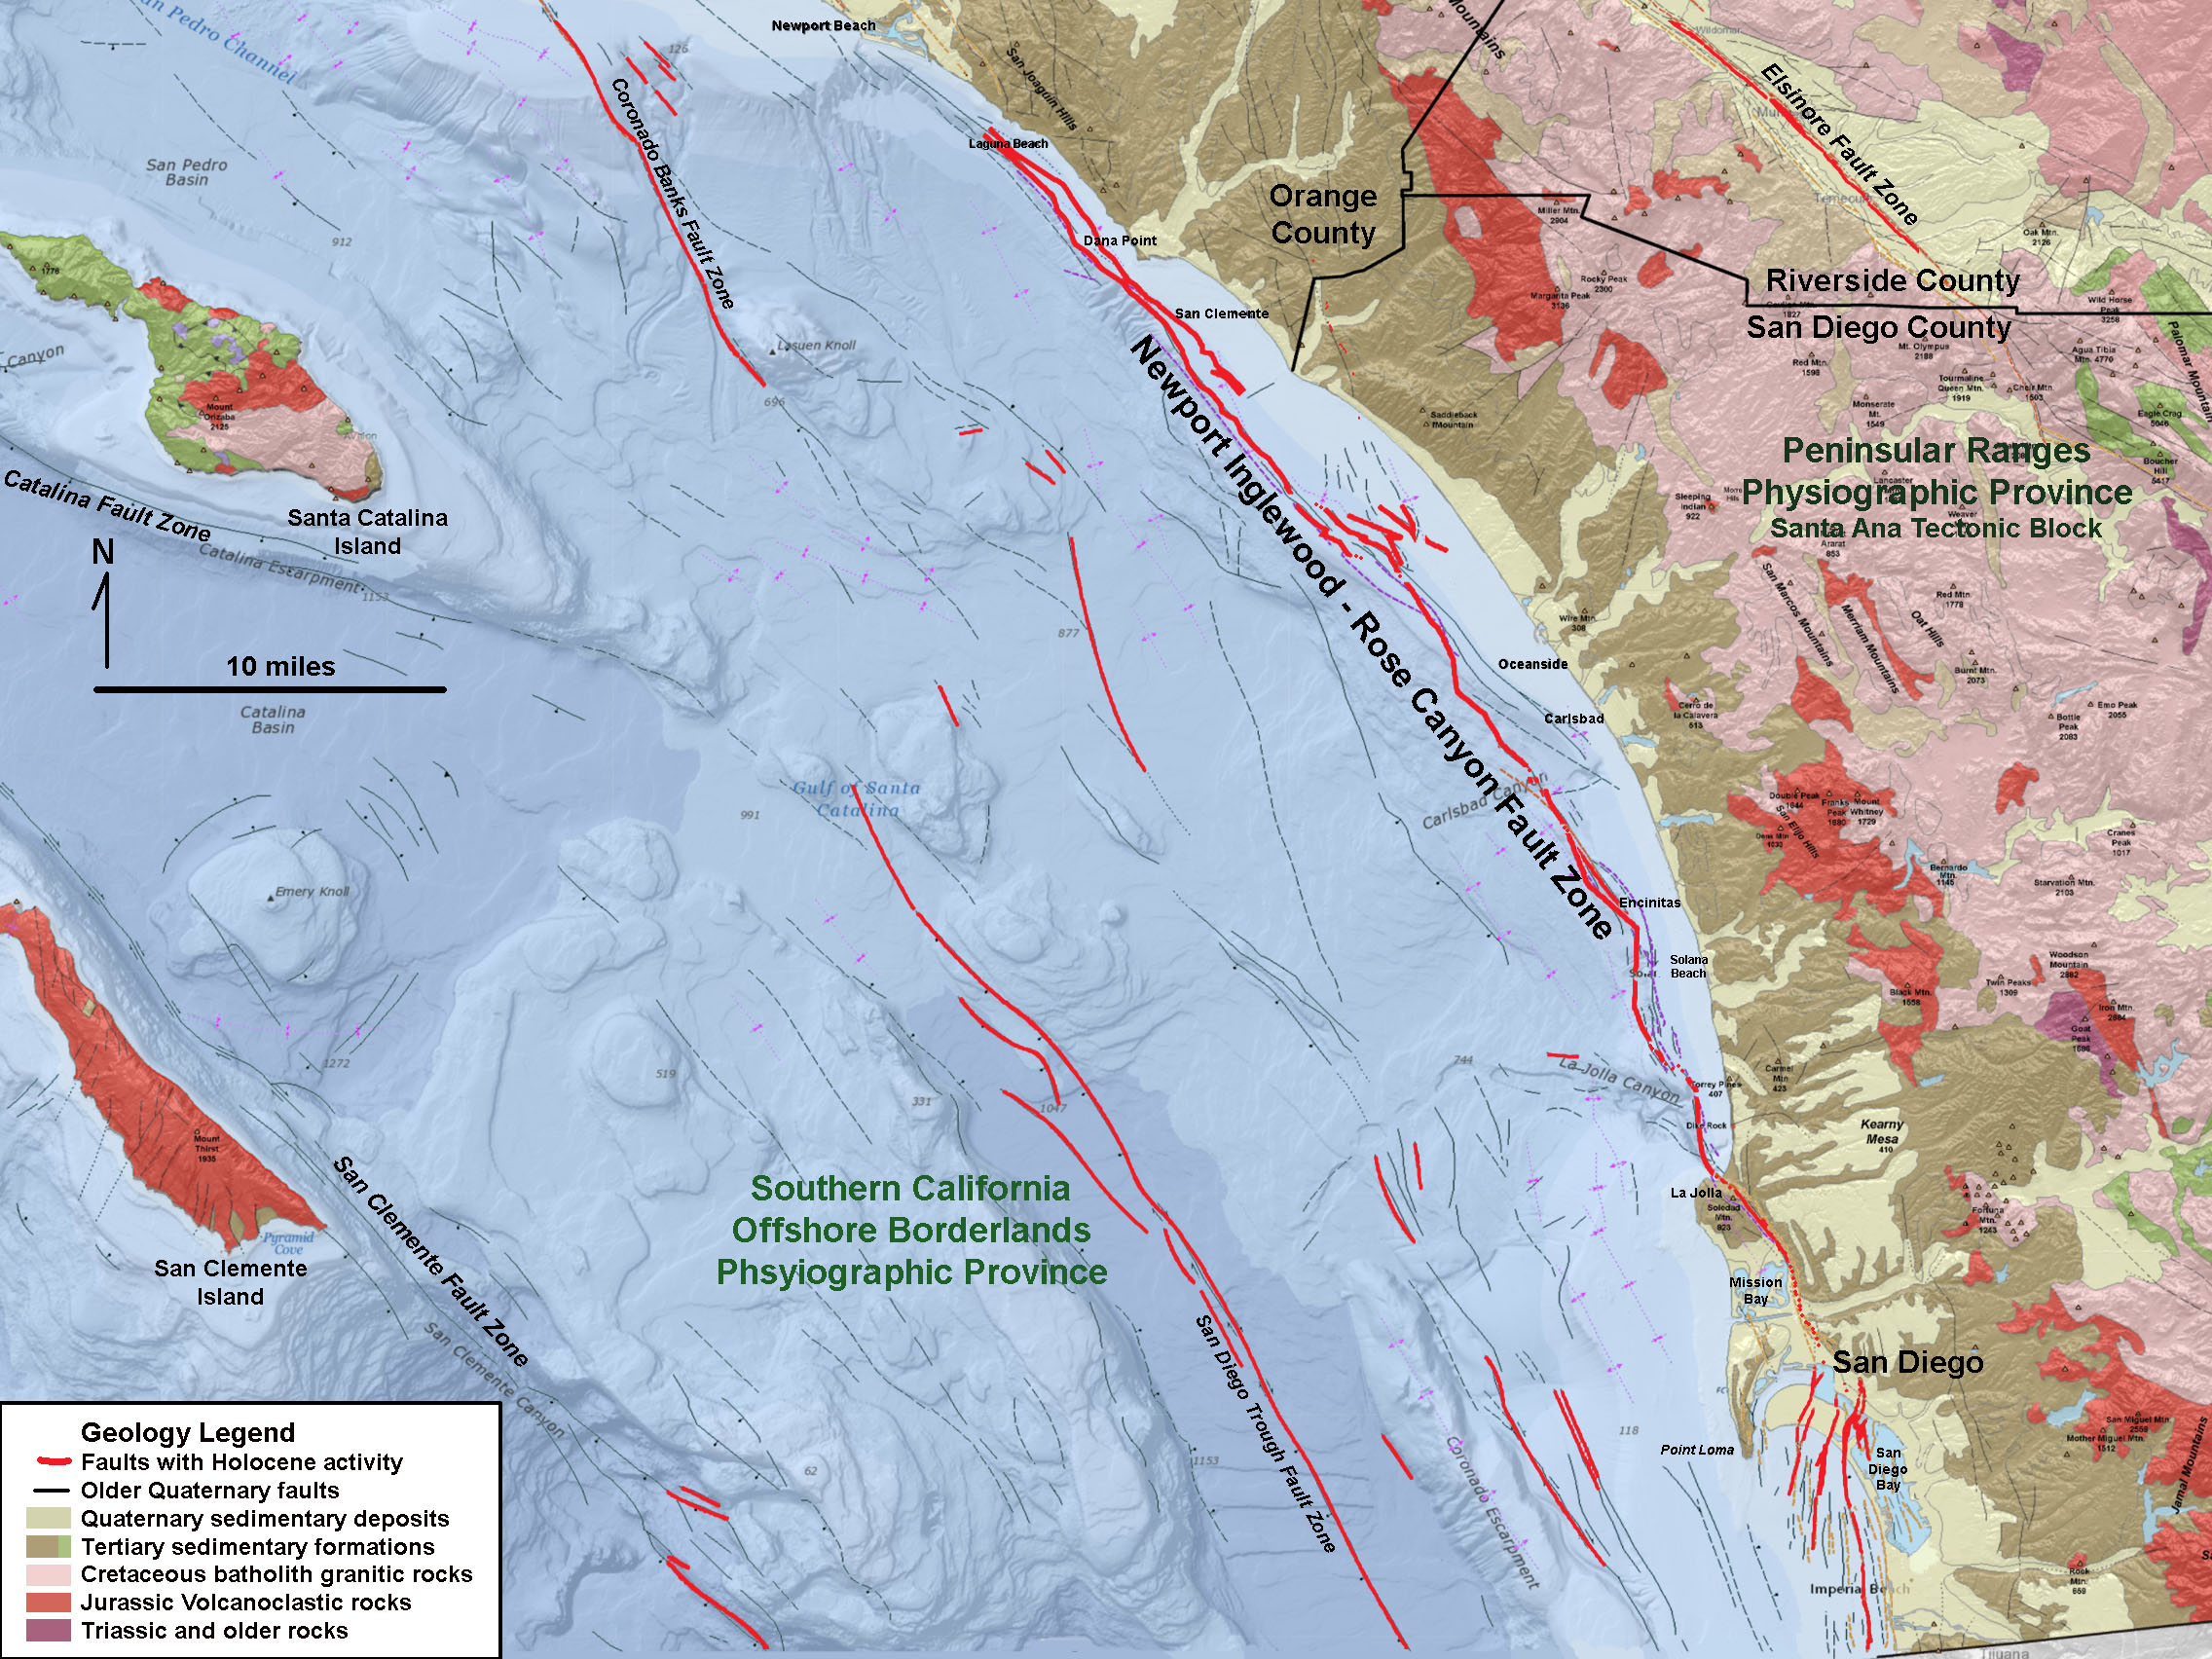

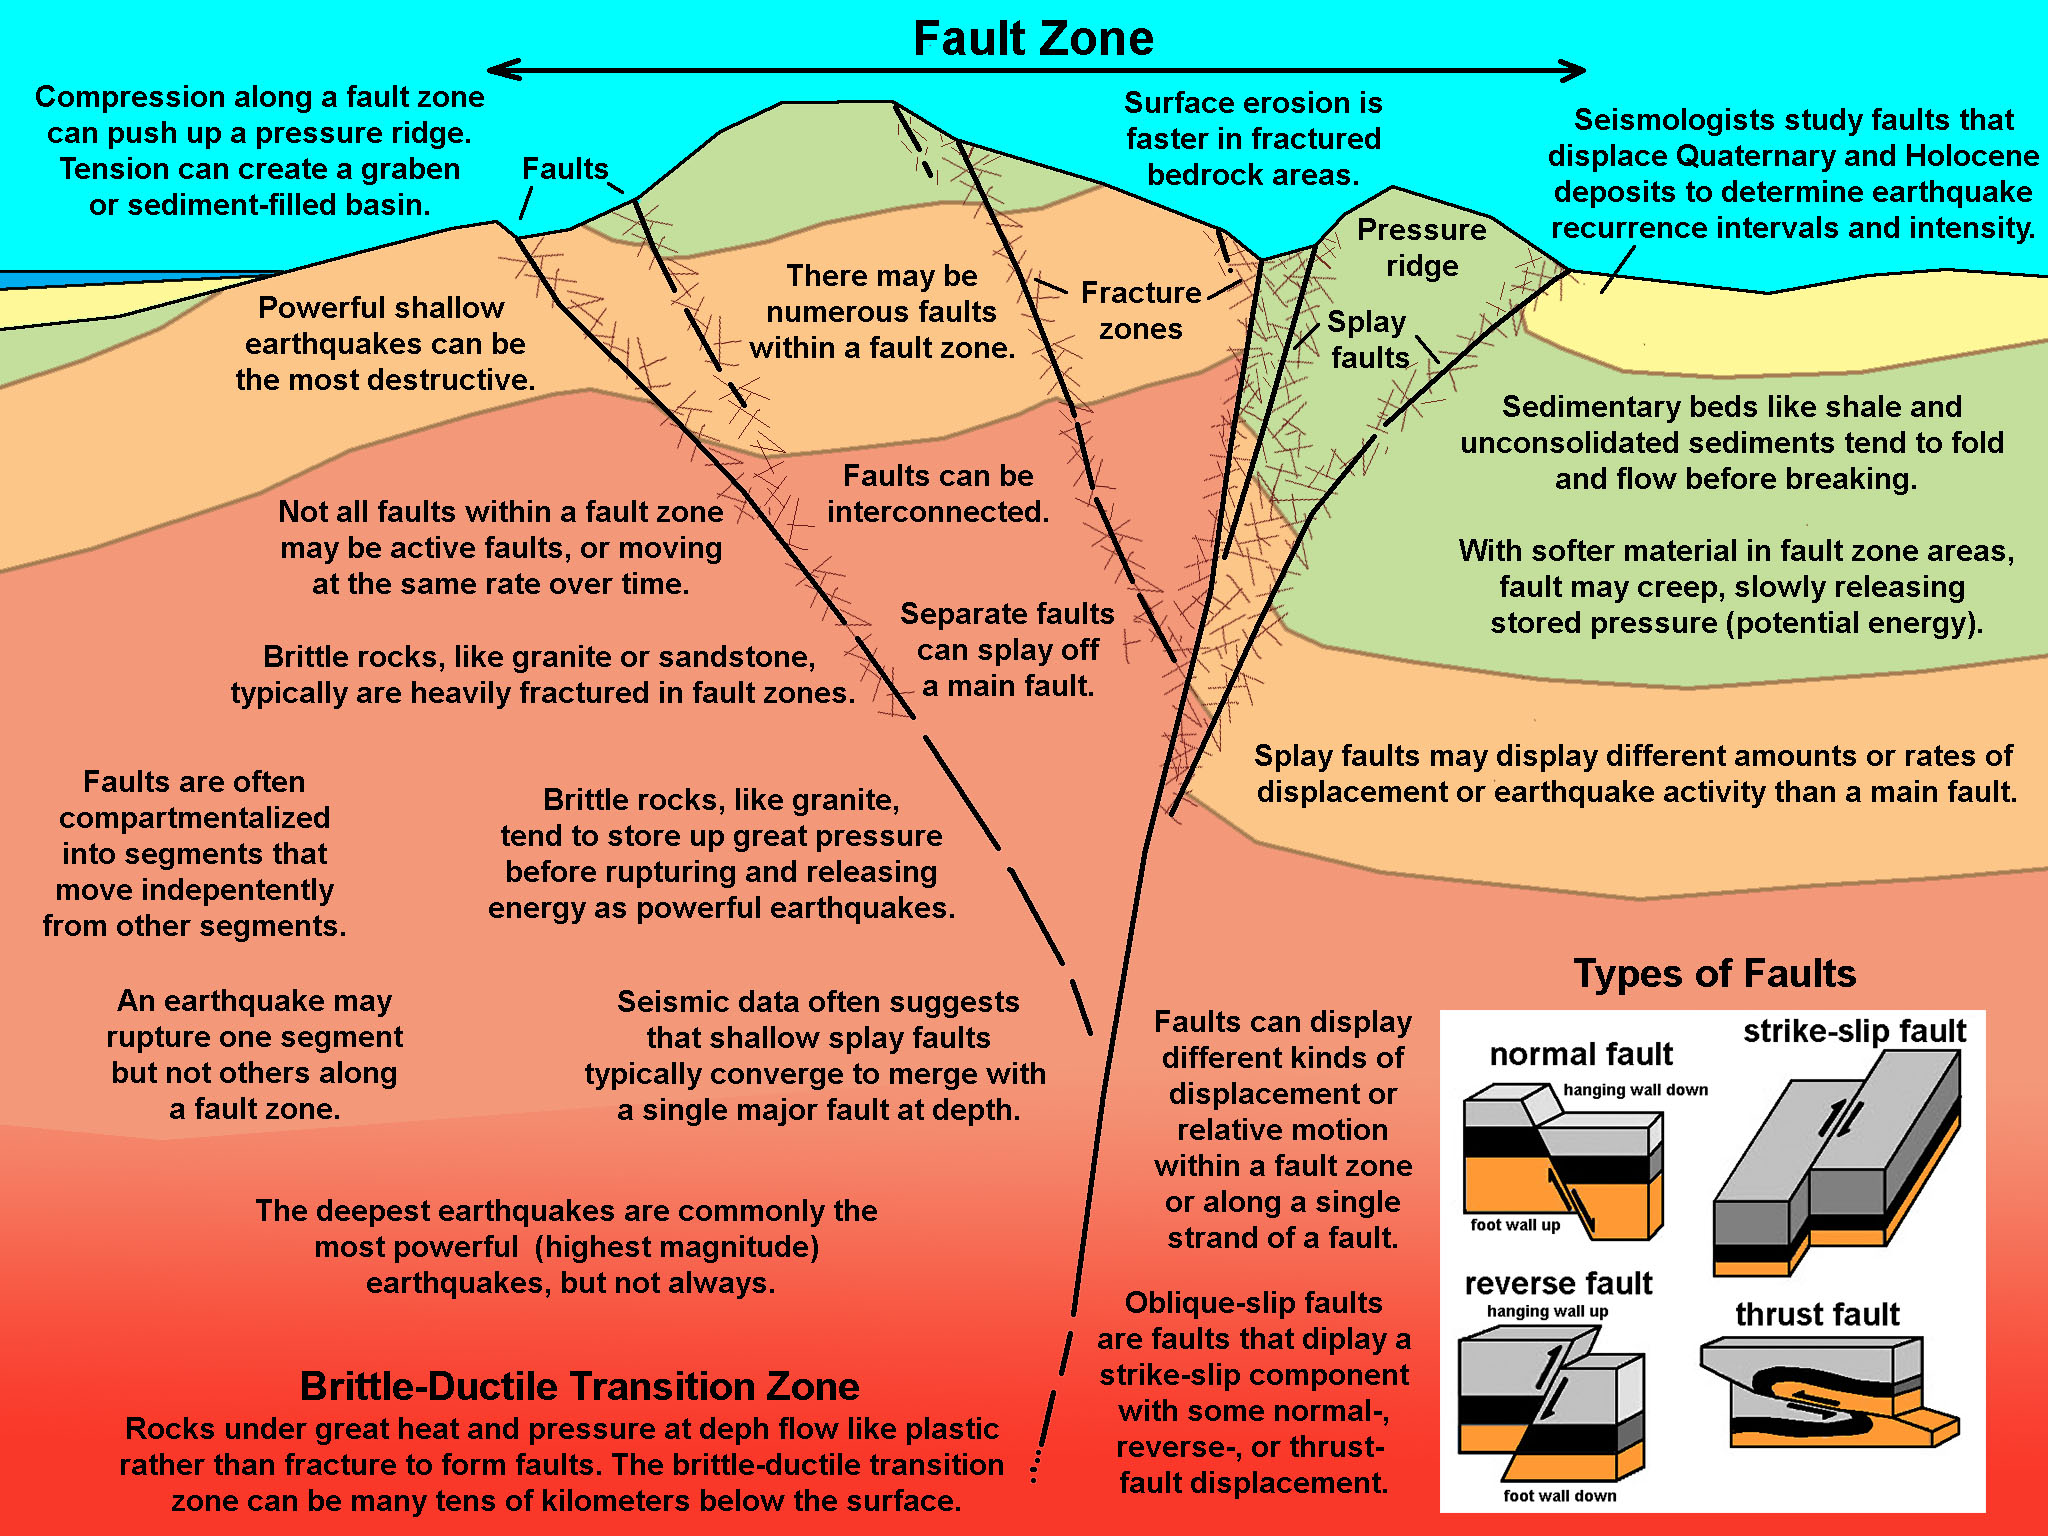
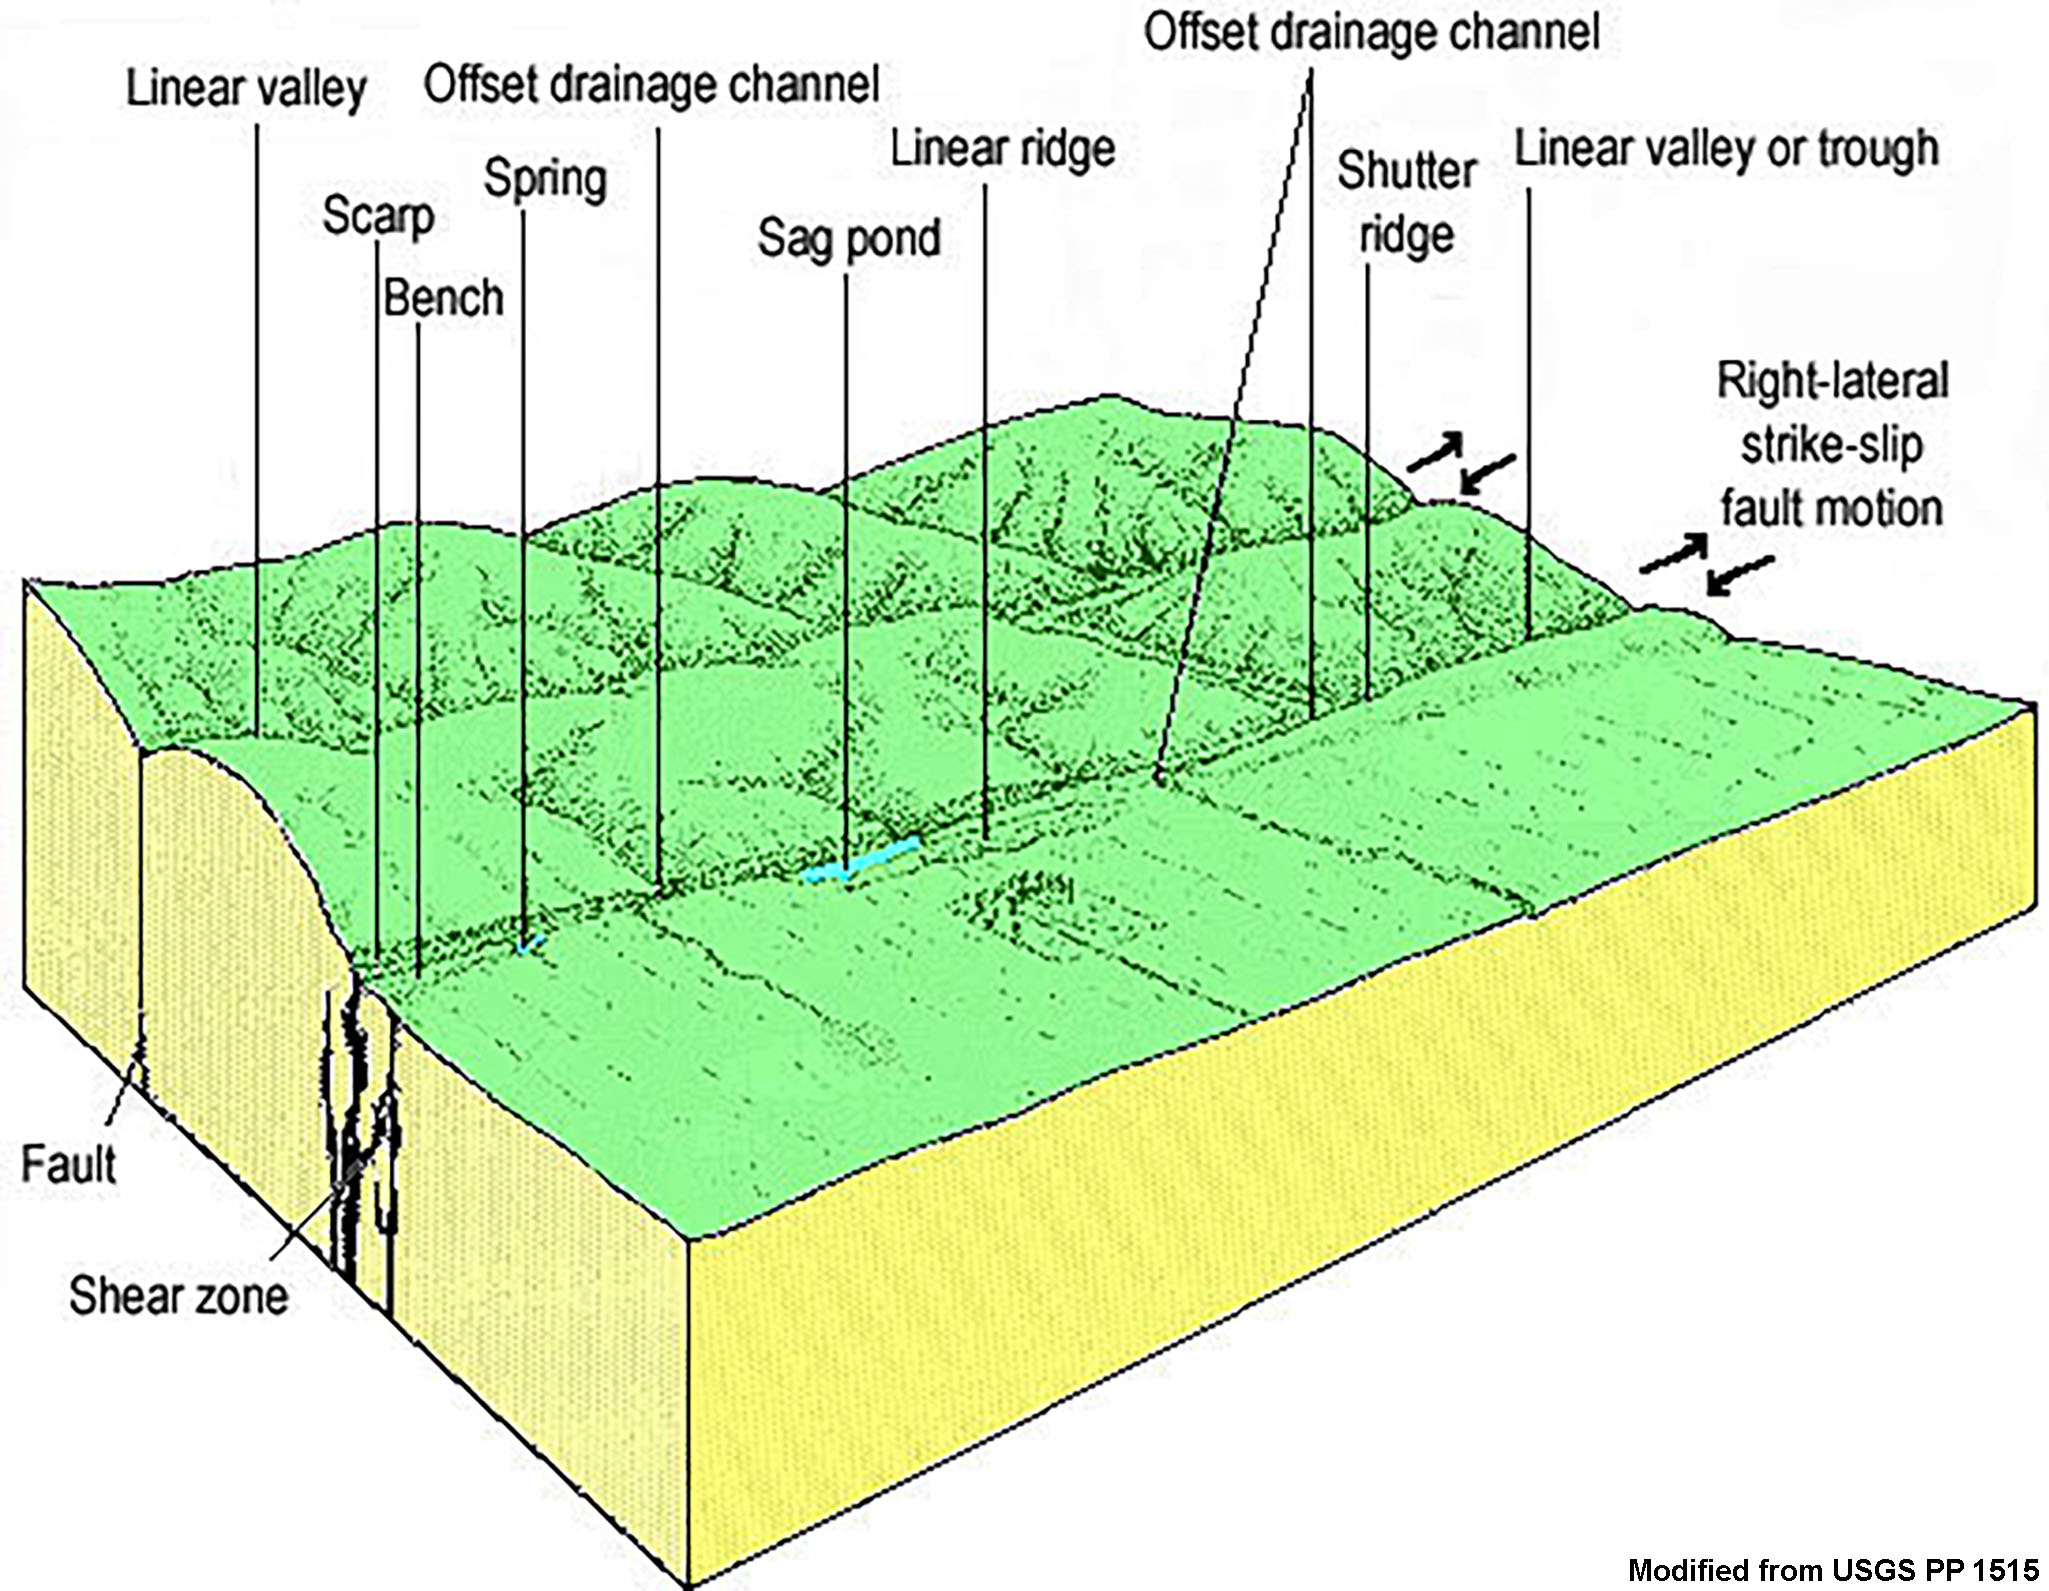
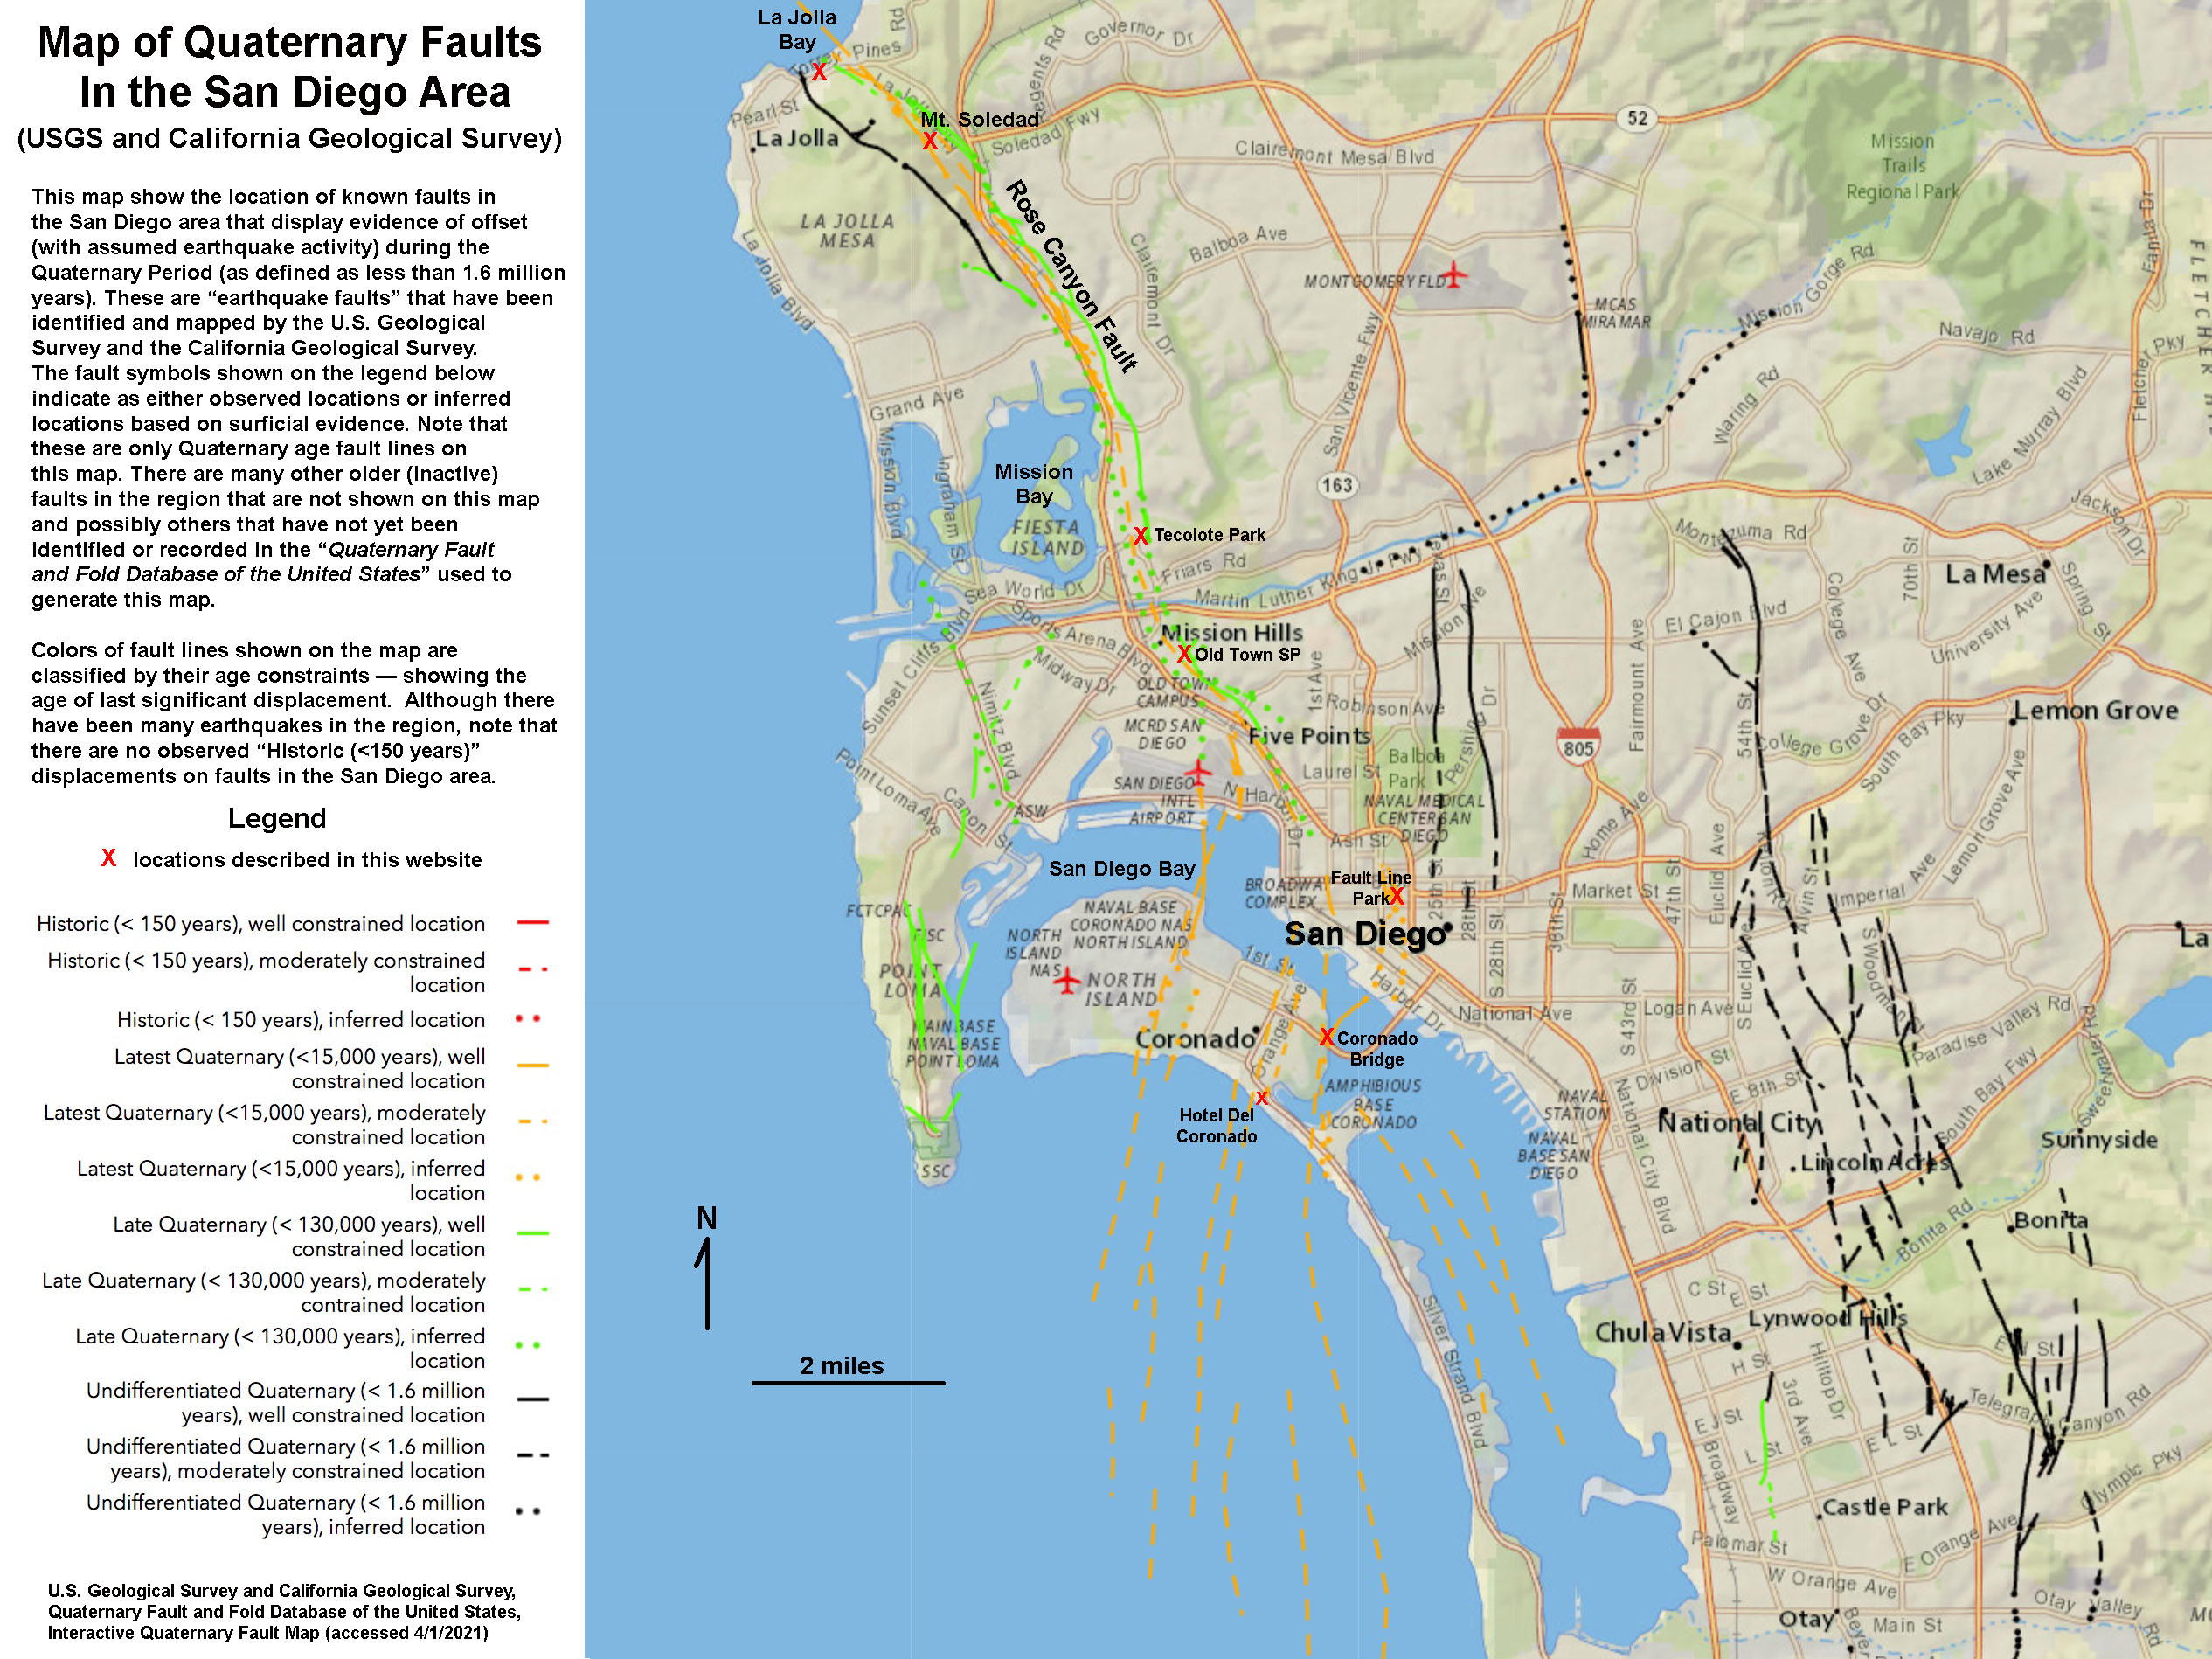
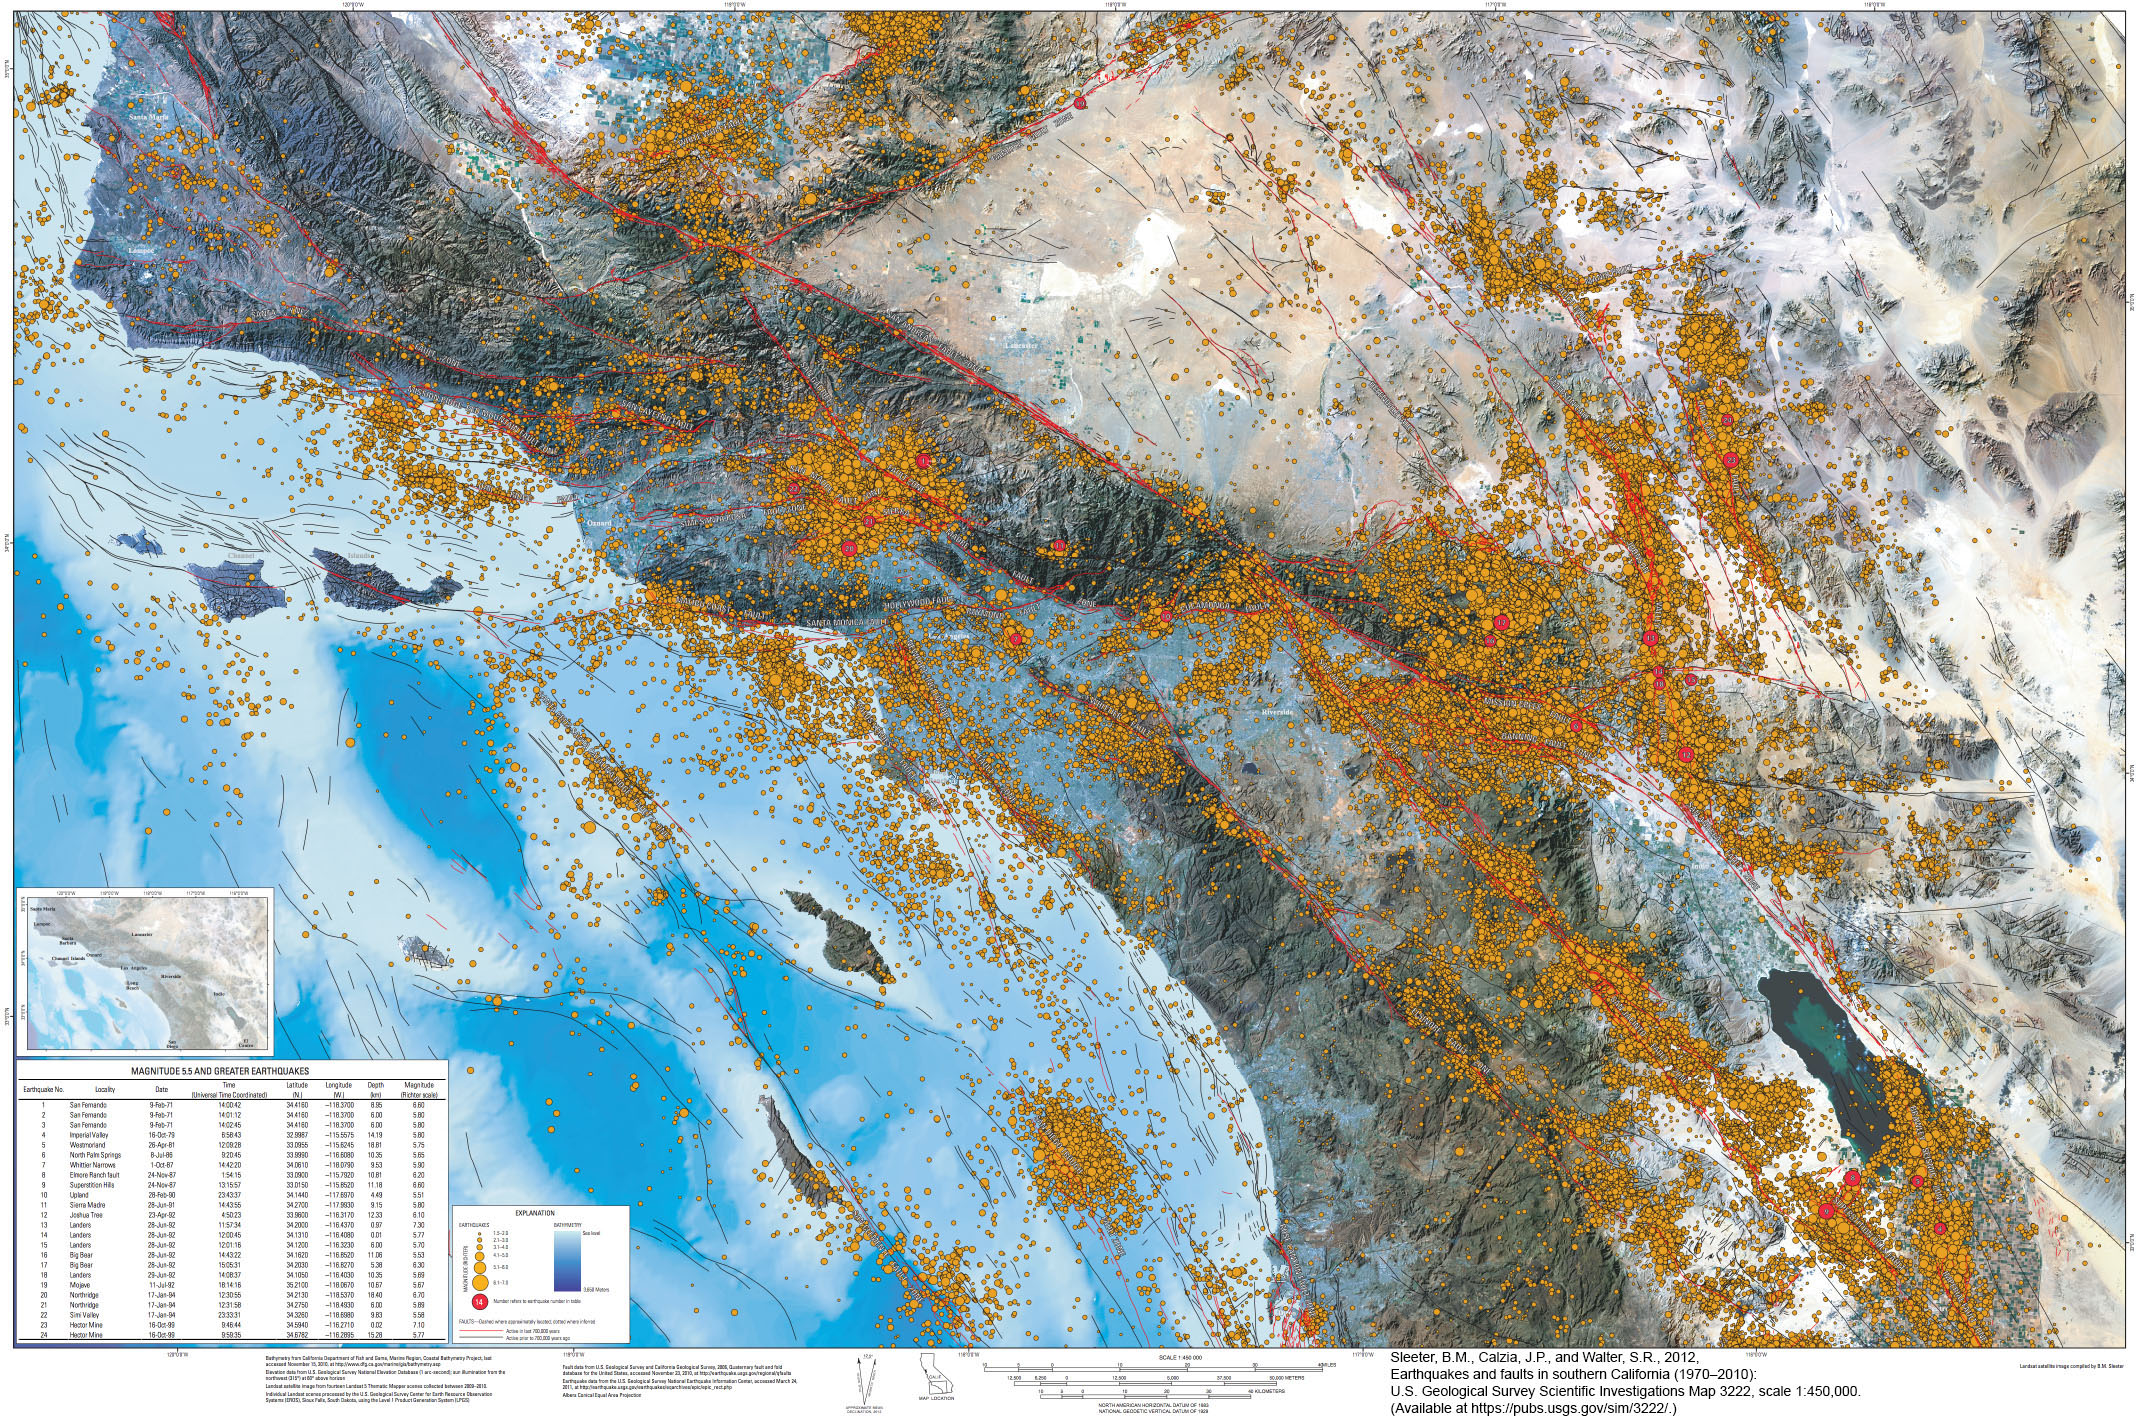
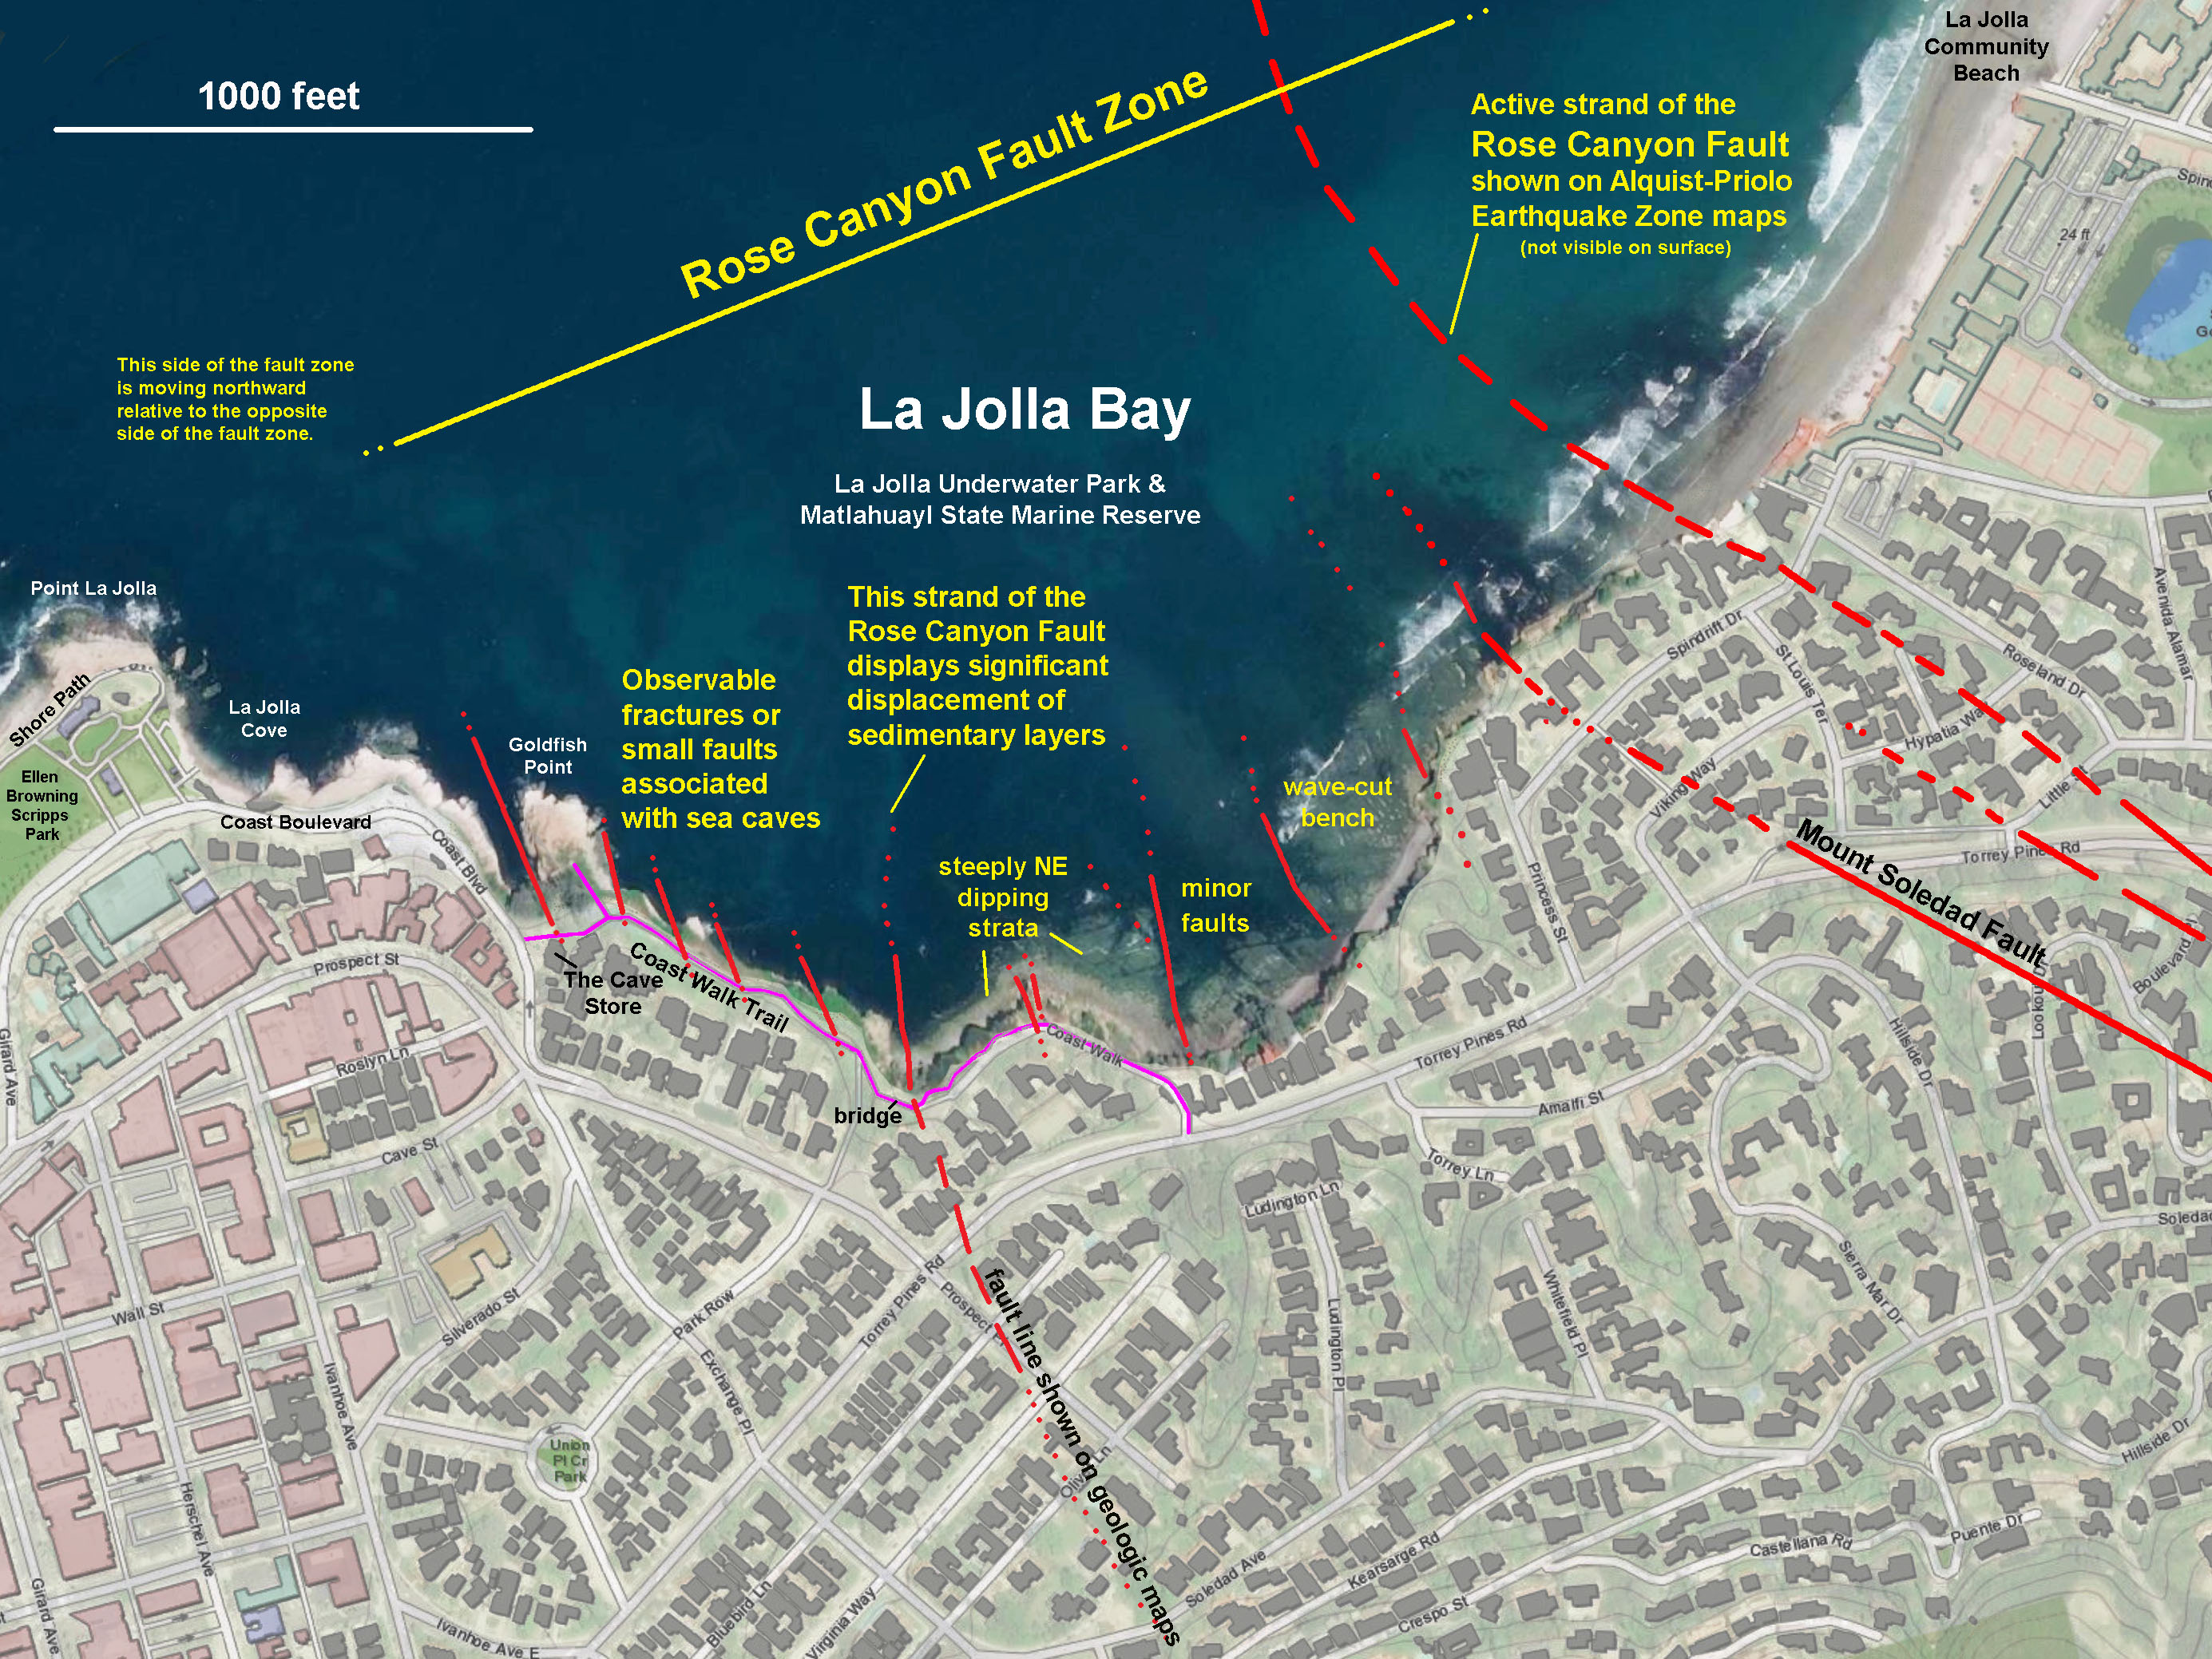
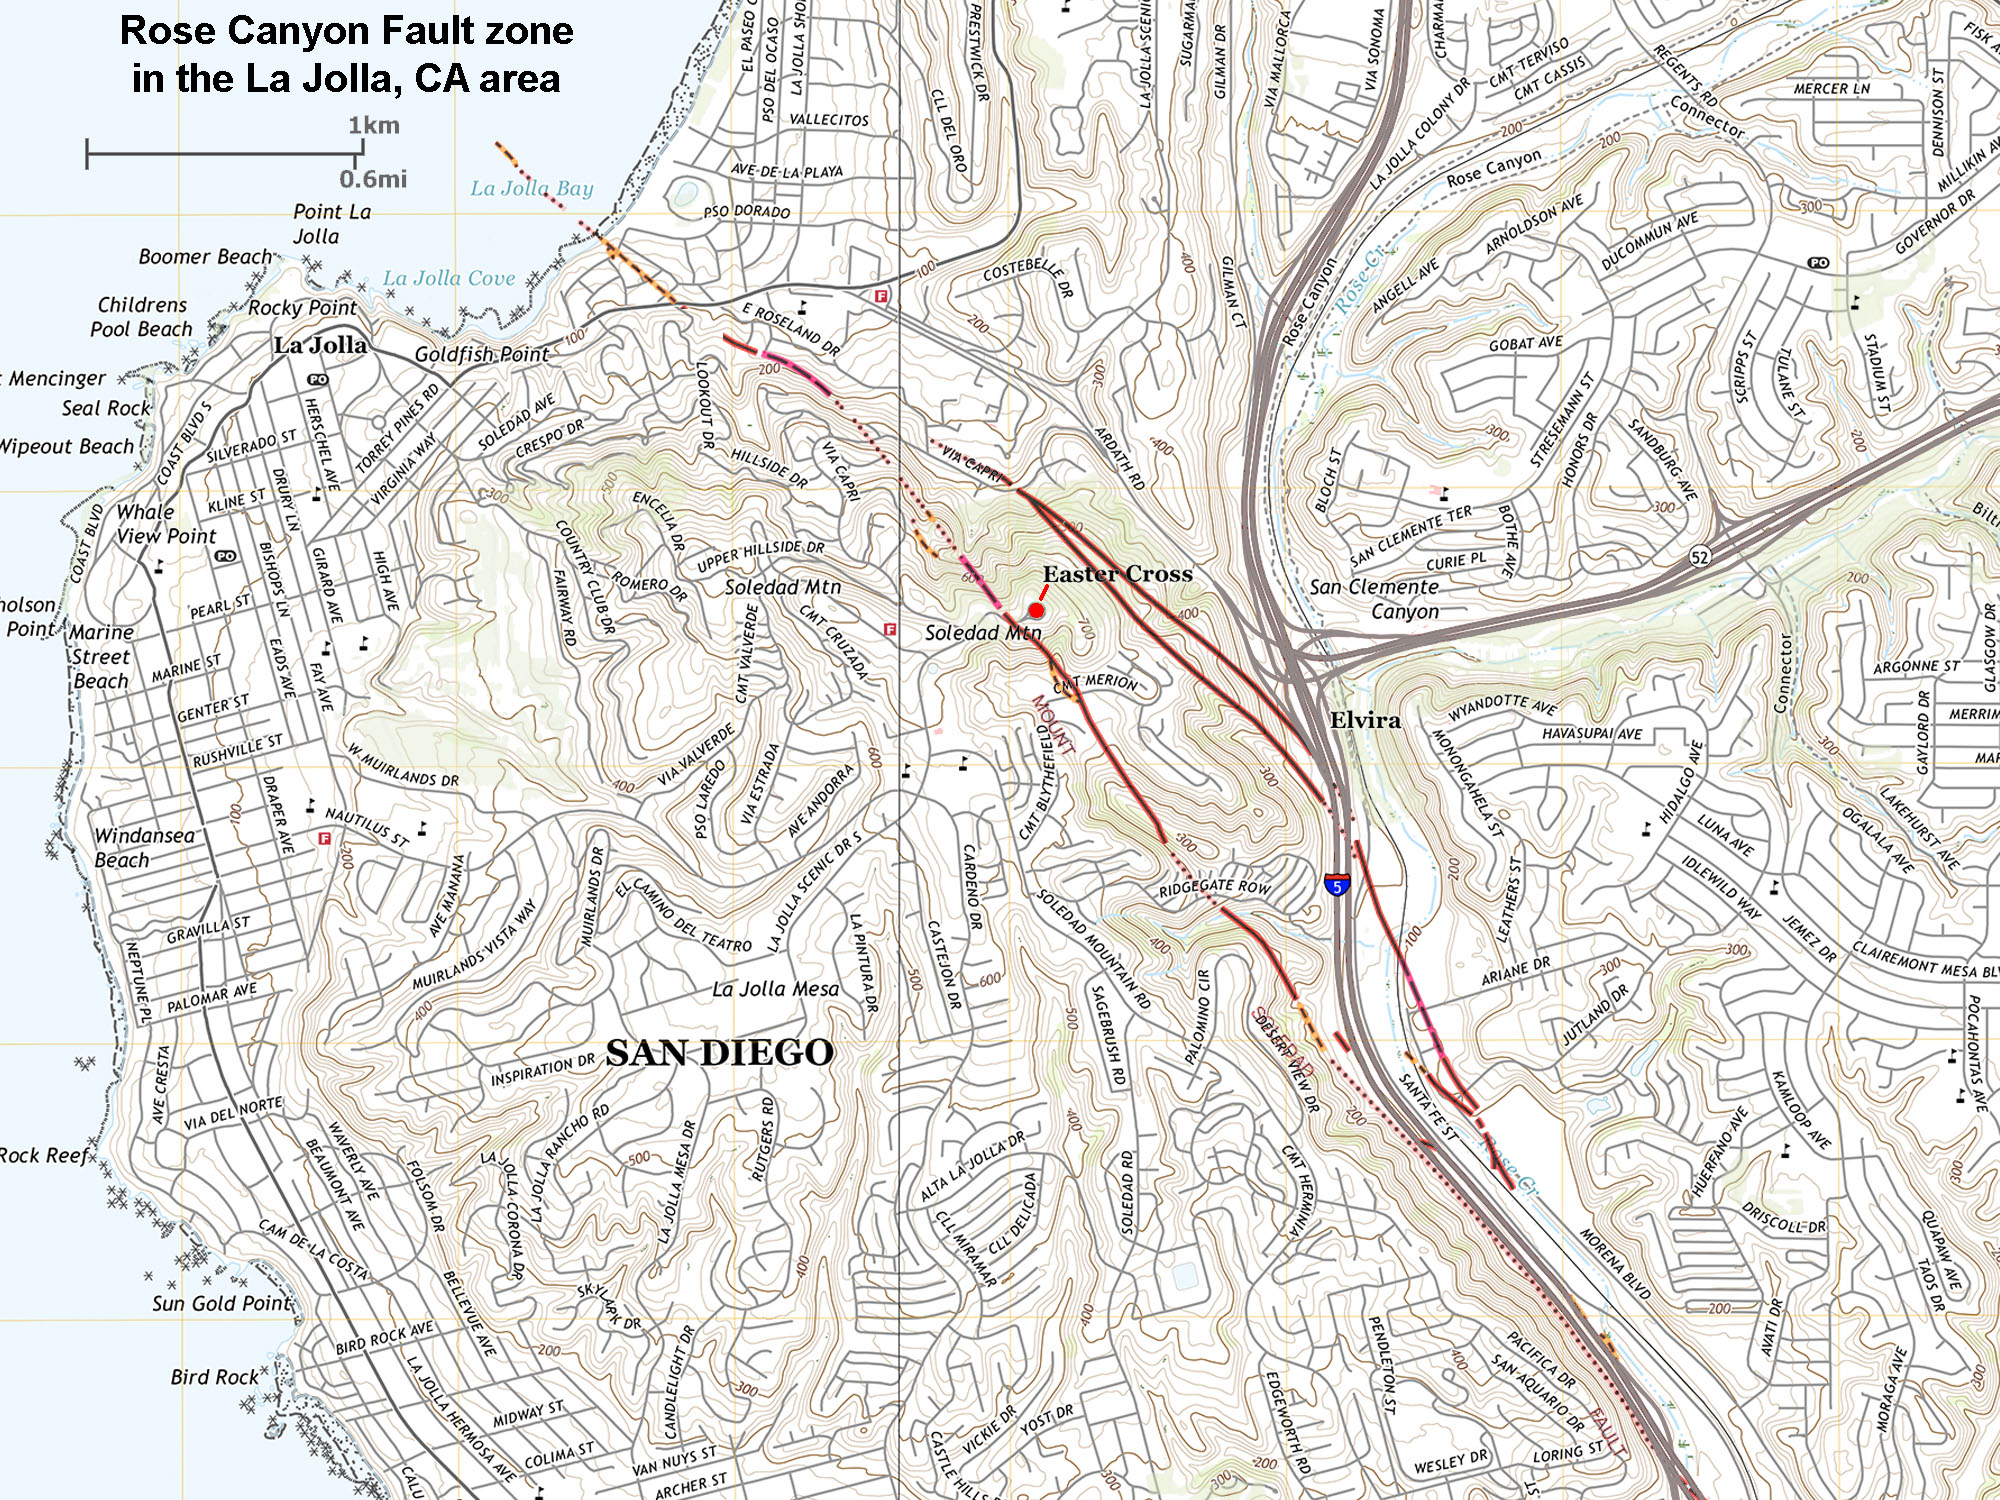
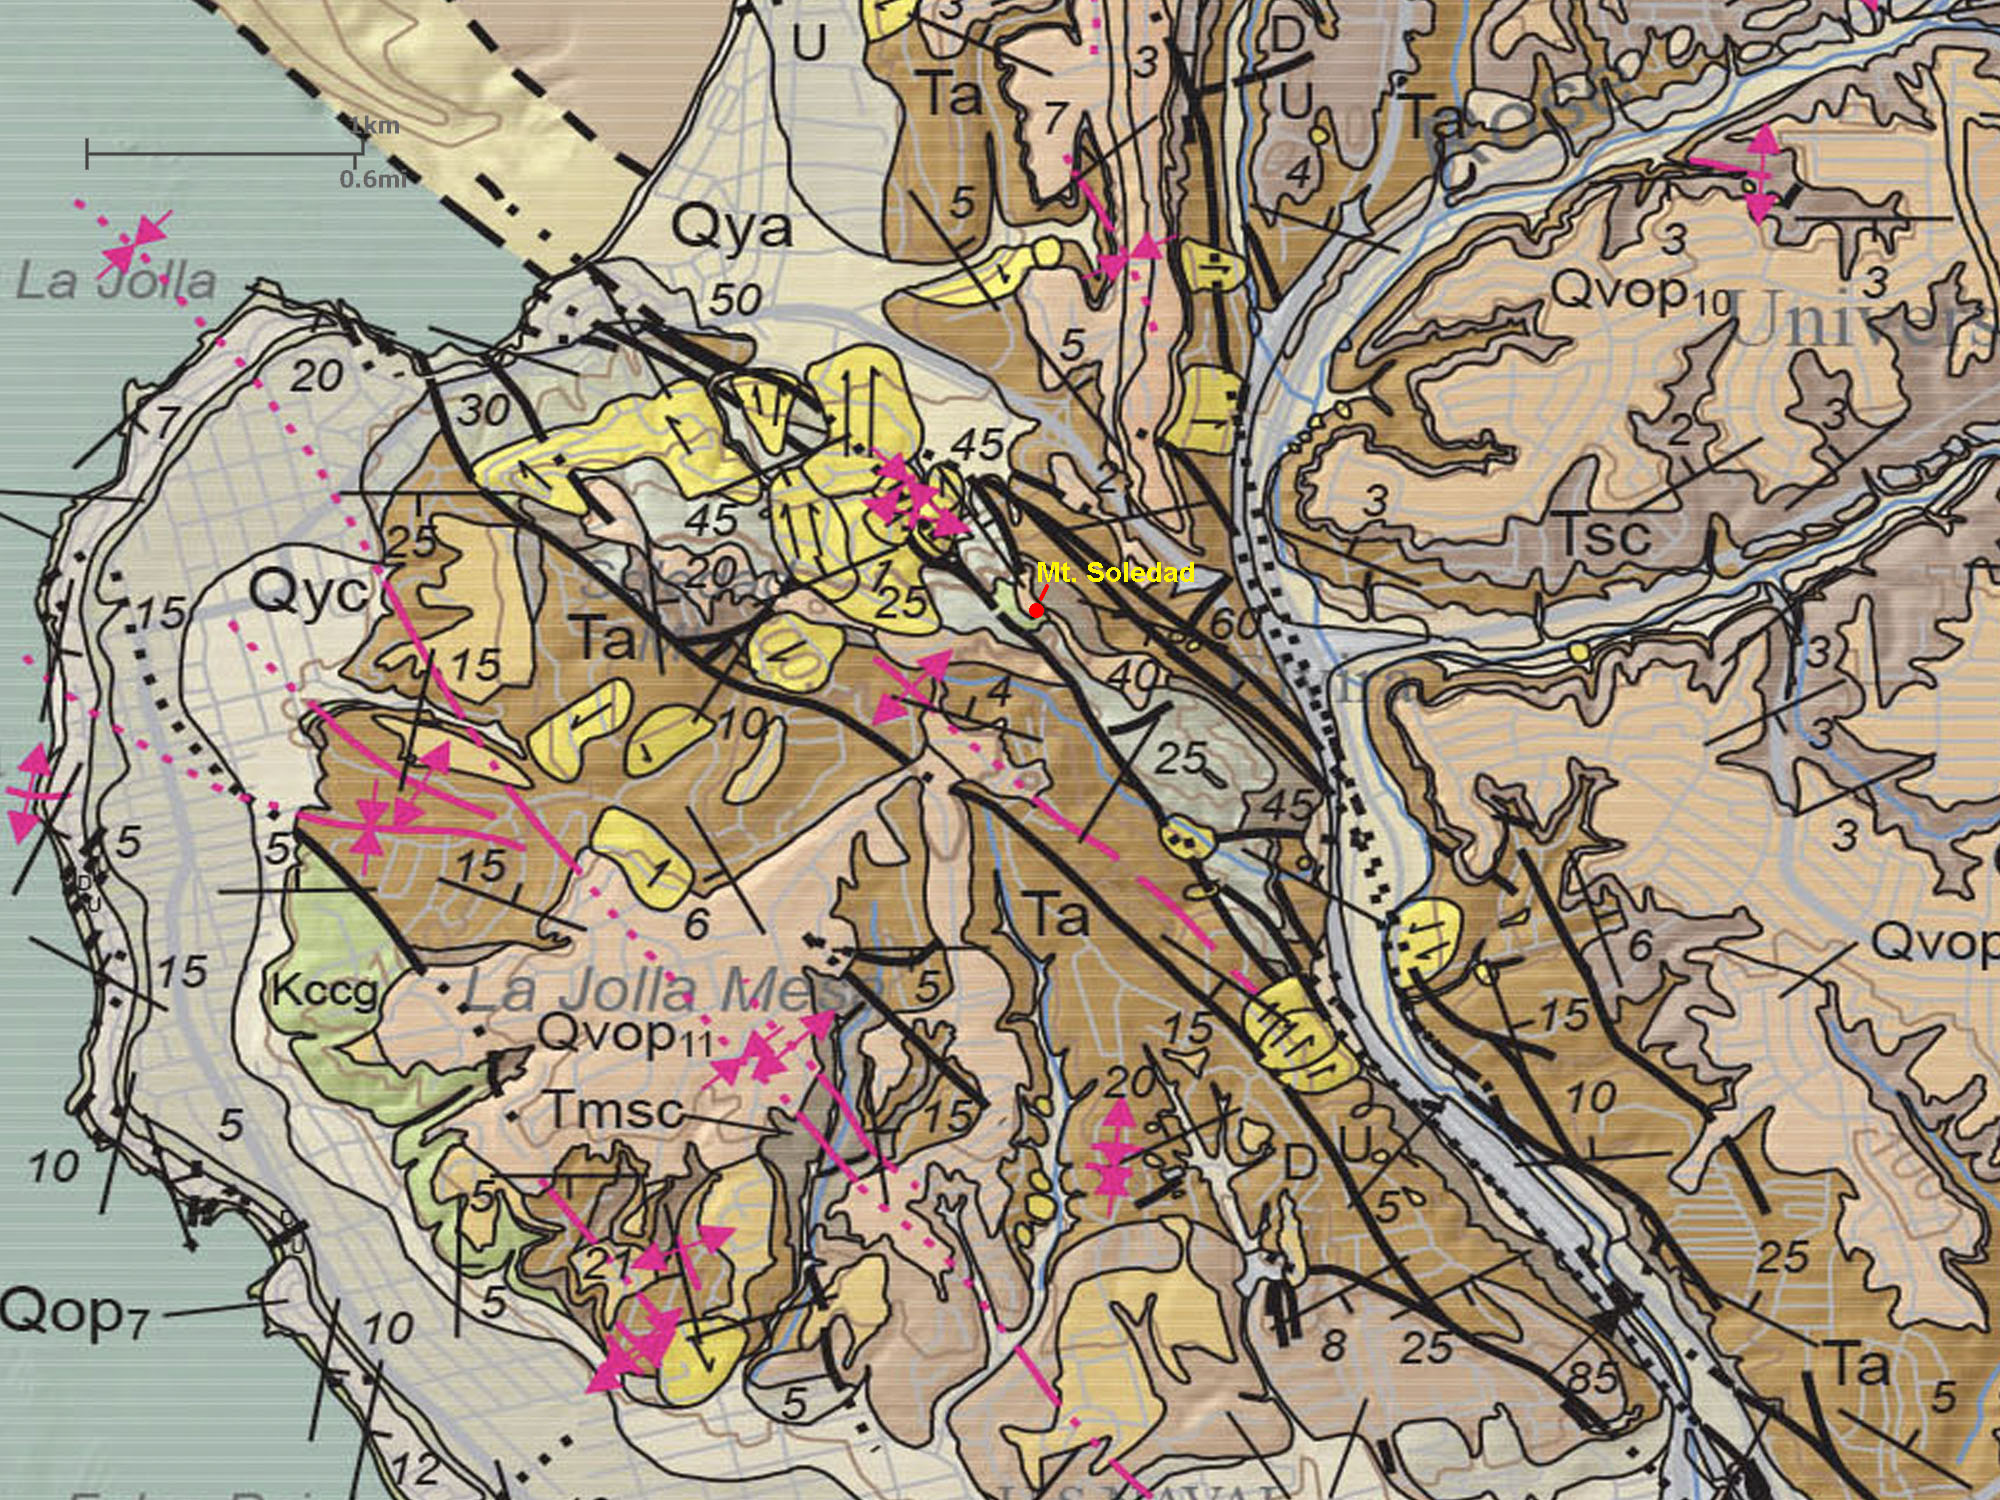
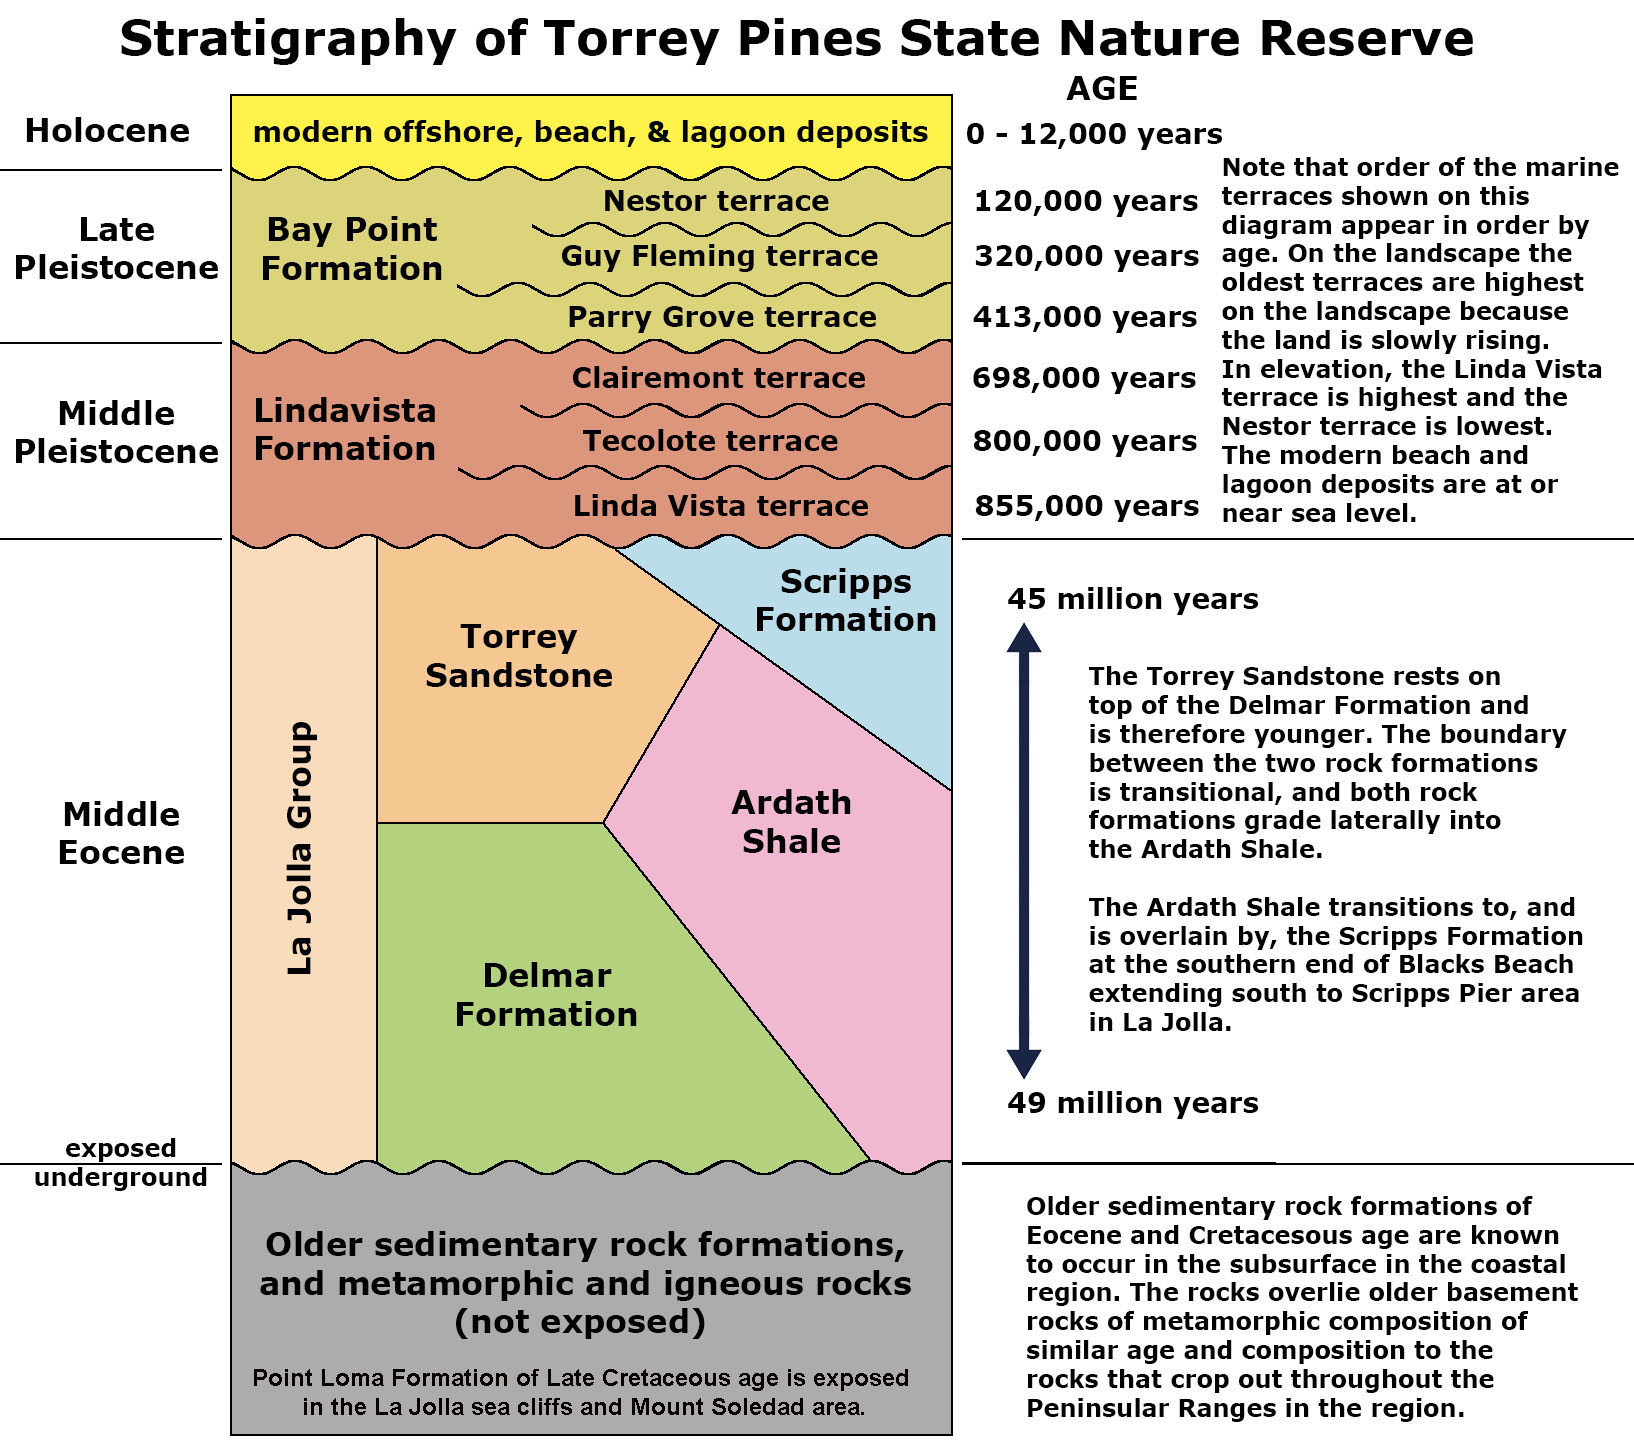 Fig. 10. Quaternary and Eocene stratigraphy of Torrey Pines area north of La Jolla Bay.