
Where Does San Diego Get Its Water? |
Understand Your Water Supply! |
Click on images for a larger view! |
50% comes from the Colorado River (via the Colorado River Aqueduct). |
Fig. 1.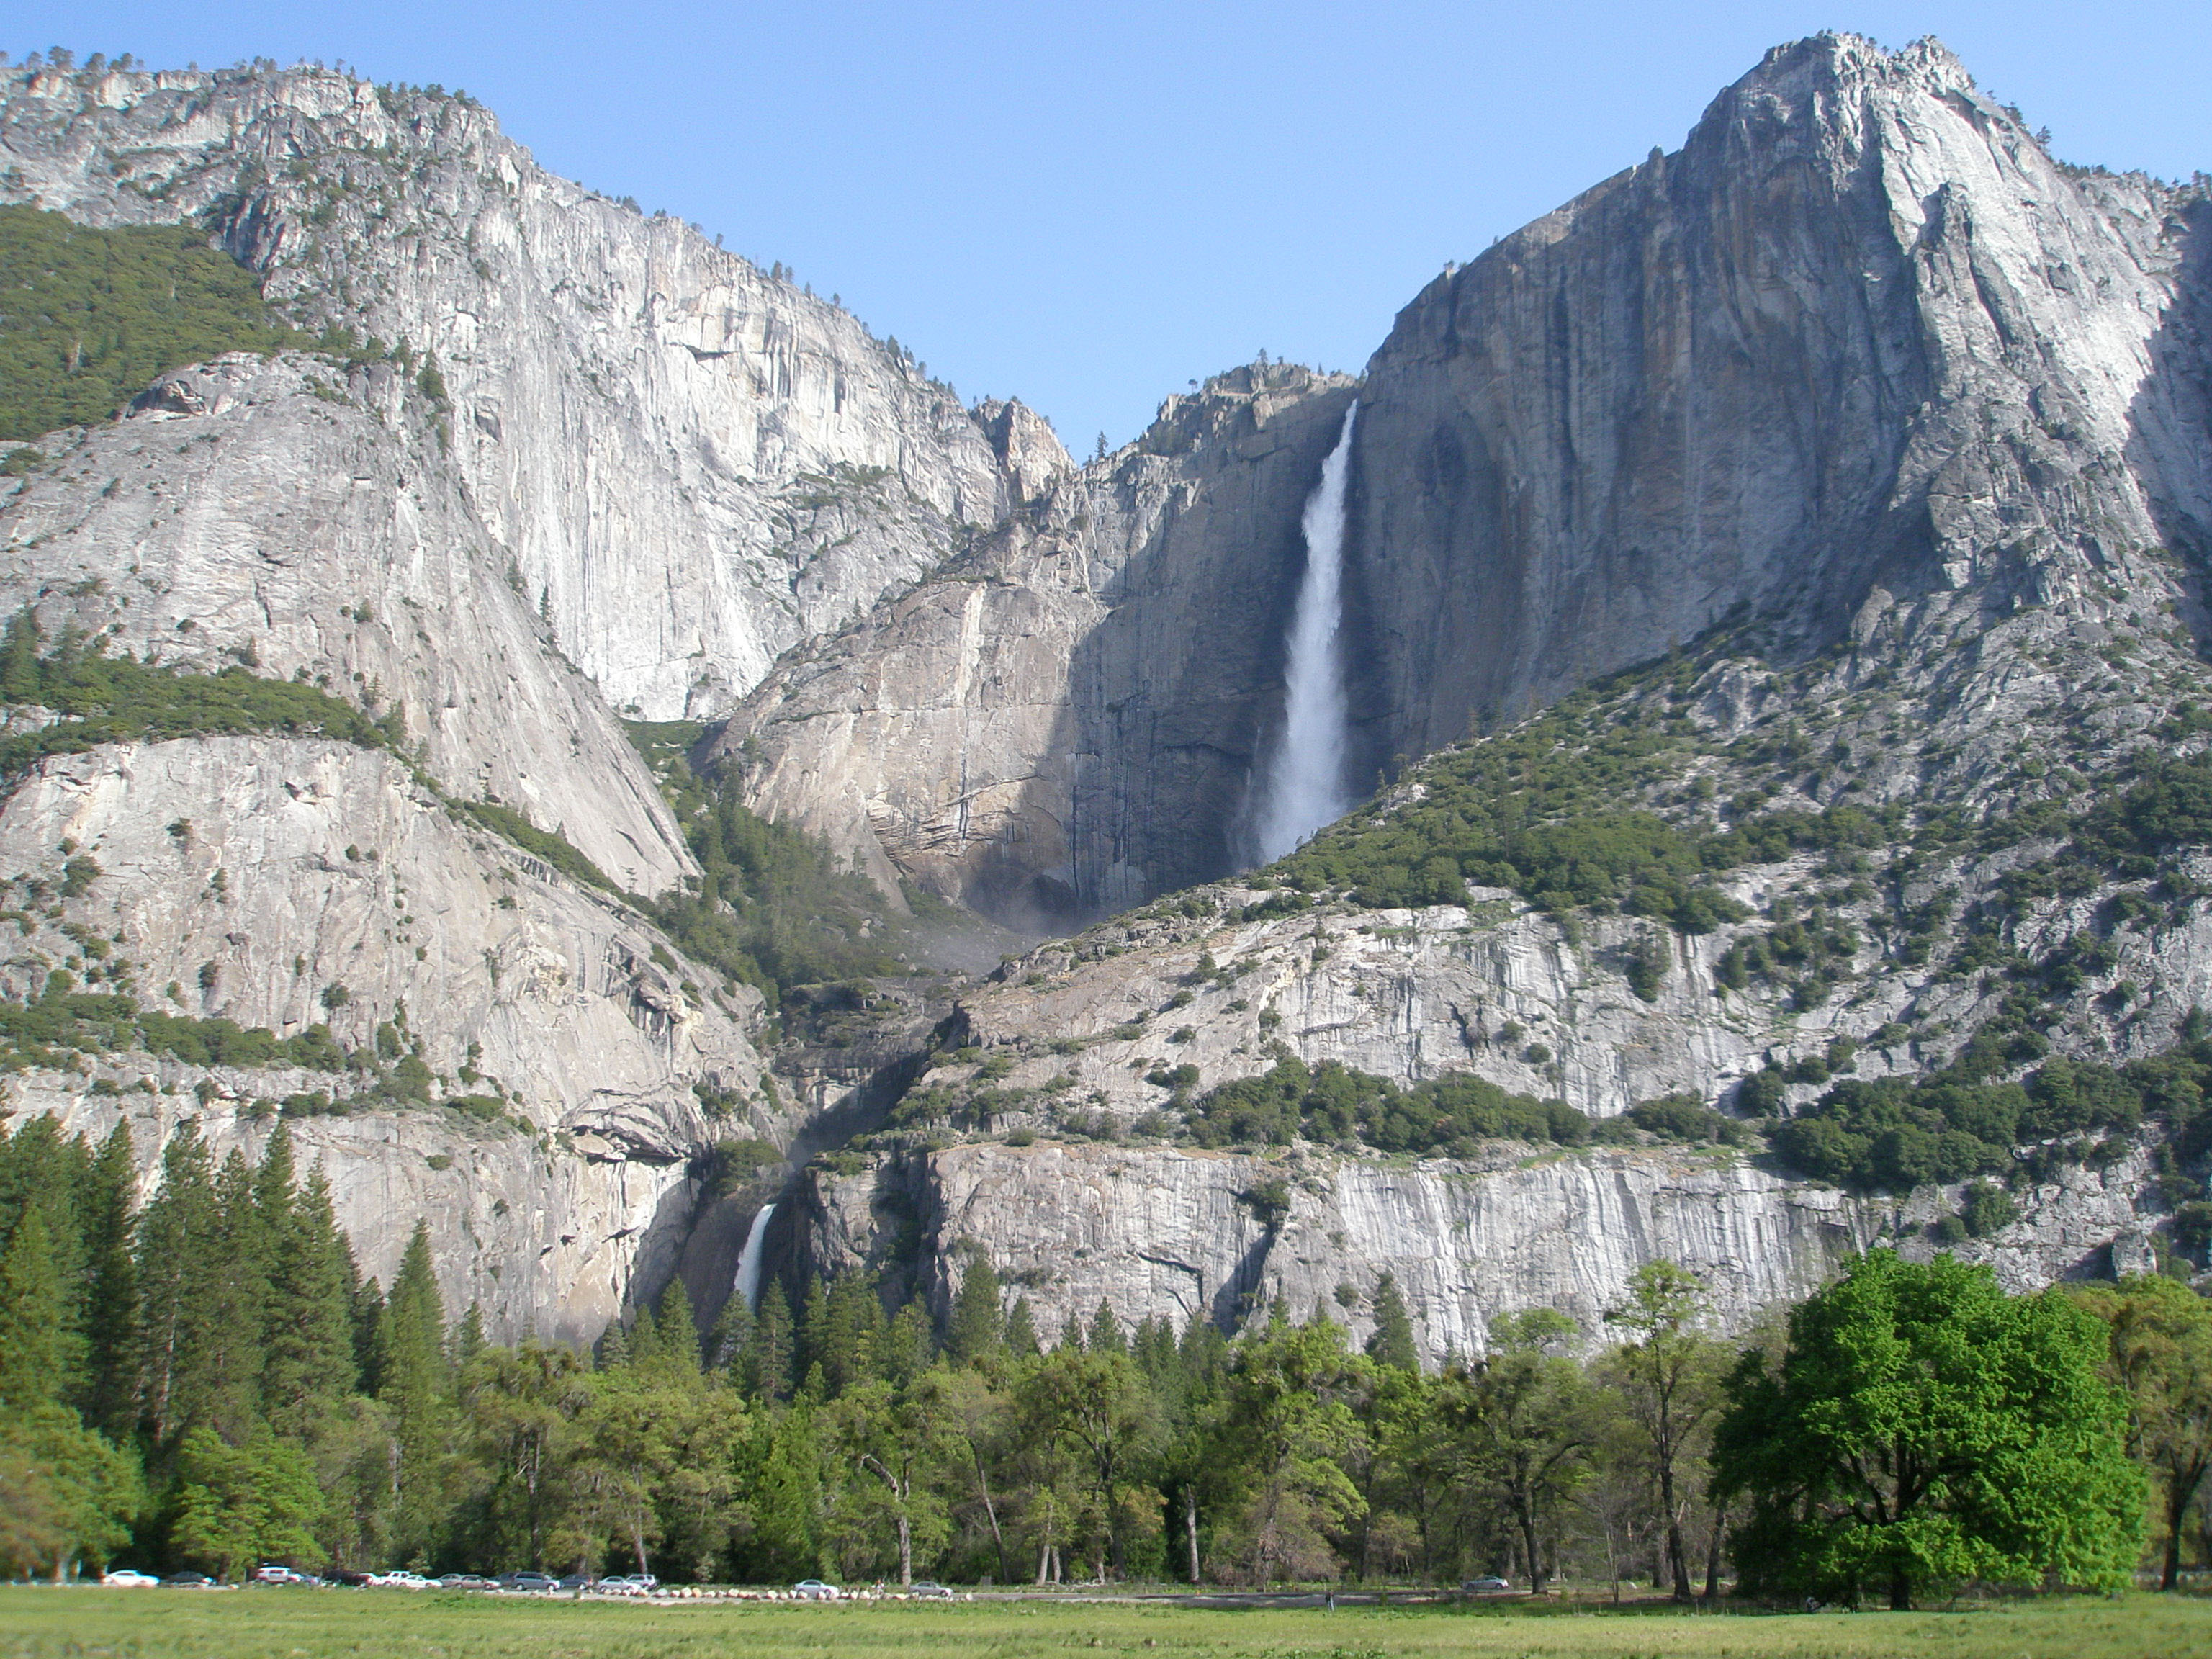 Yosemite Falls in Yosemite National Park, Sierra Nevada Range, California. |
How Is Water Measured? |
Fig. 2. 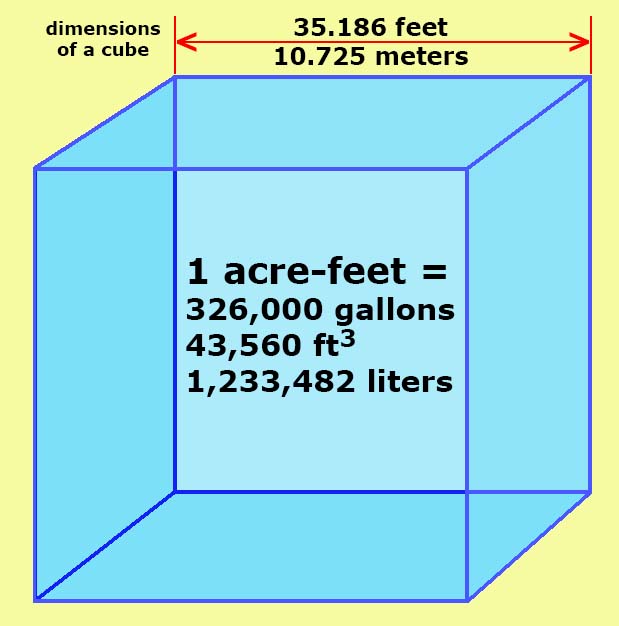 An acre foot in gallons, cubic feet, and liters. |
Water is measured in acre-feet (Figure 1).One acre-foot is the amount of water to cover one acre of land with one foot of water.This equals about:
|
|
How Is Water Flow Measured? |
|
| In hydrology, water flow is called discharge. Discharge is the volumetric flow rate of water that is transported through a given cross-sectional area, whether it be a in a pipe, canal, aqueduct, stream, or river channel. In the United States, discharge is typically reported in cubic feet per second moving past a location such as a dam. Elsewhere it may be measured in gallons or liters per second, etc. Large volumes of water are often reported in acre feet per year. |
Where Water-Supply Water Comes From |
Fig. 3.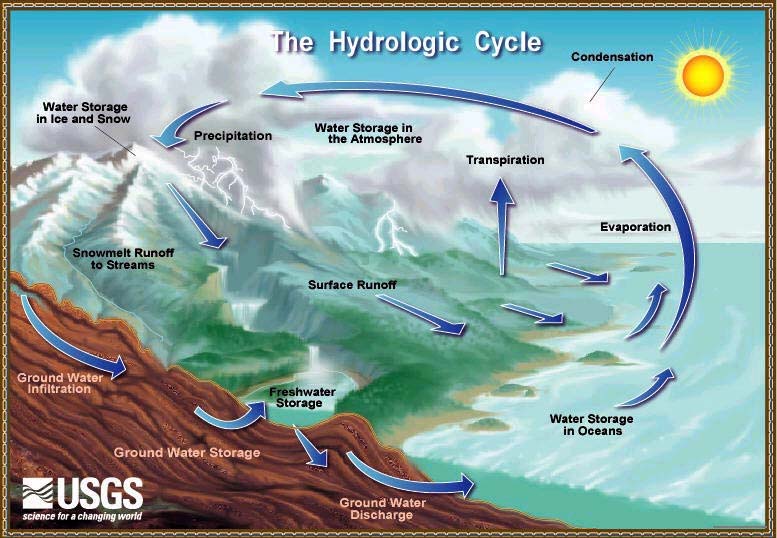 The water cycle involves all water-related process of the atmosphere, land, and oceans, involving precipitation, stream and river flow, evaporation and transpiration. |
Fig. 4. Groundwater flow feeds the Escondido River in the summer dry season , and the water flow is typical very clear. |
Where precipitation falls or accumulates, several things can happen. Some or most of it will evaporate, some will sink into the ground (becoming groundwater), some will flow on the surface (runoff or surface flow), and will be consumed and release by plants (transpiration). The majority of the water consumed in Southern California communities comes from stream flow. In some places it comes entirely from groundwater supplies. In fact, most of the water in streams comes from groundwater discharging to the surface. Runoff only happens during large storm events. This is most obvious when late in the summer, long after rains have ended, and streams are still flowing. Spring water flow occurs where groundwater reaches the surface. Spring water is clear whereas runoff water is brown (turbid) from suspended sediments (Figure 4). Most springs occur on the bottom of a stream channel. |
How Stream Discharge Is CalculatedStream flow (or stream discharge) is typically described as the volume of water moving past a point in a stream every second. The discharge of a stream is calculated by the following equation:Q = V x D x W
|
Fig. 5 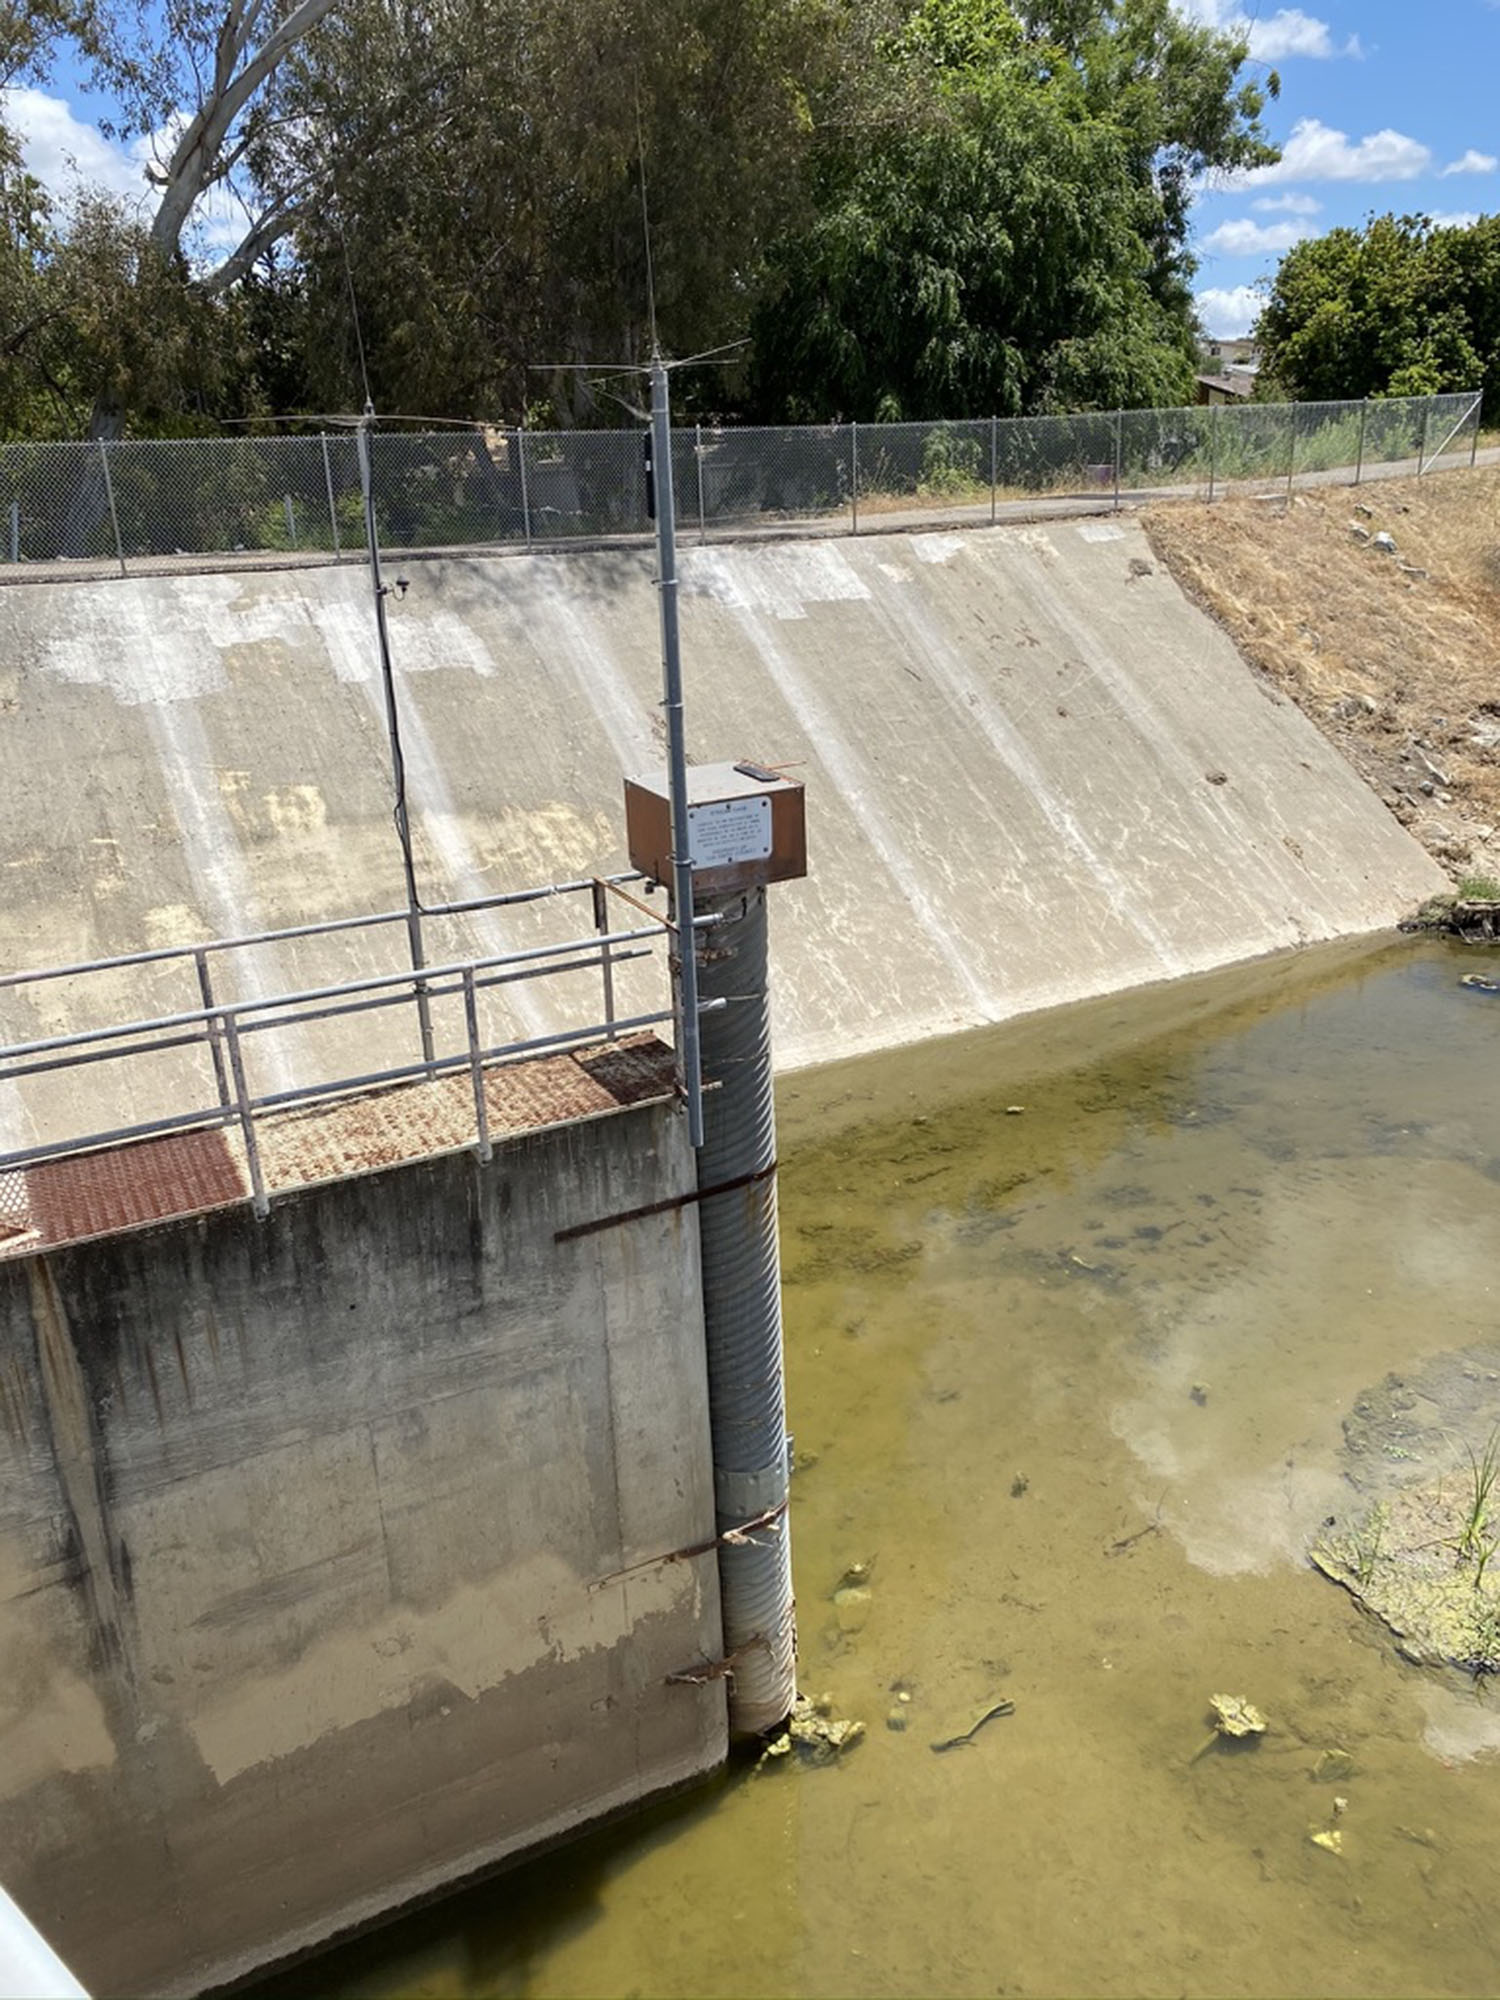 Example of a stream gauge in along the Escondido River in Escondido, California. |
Fig. 6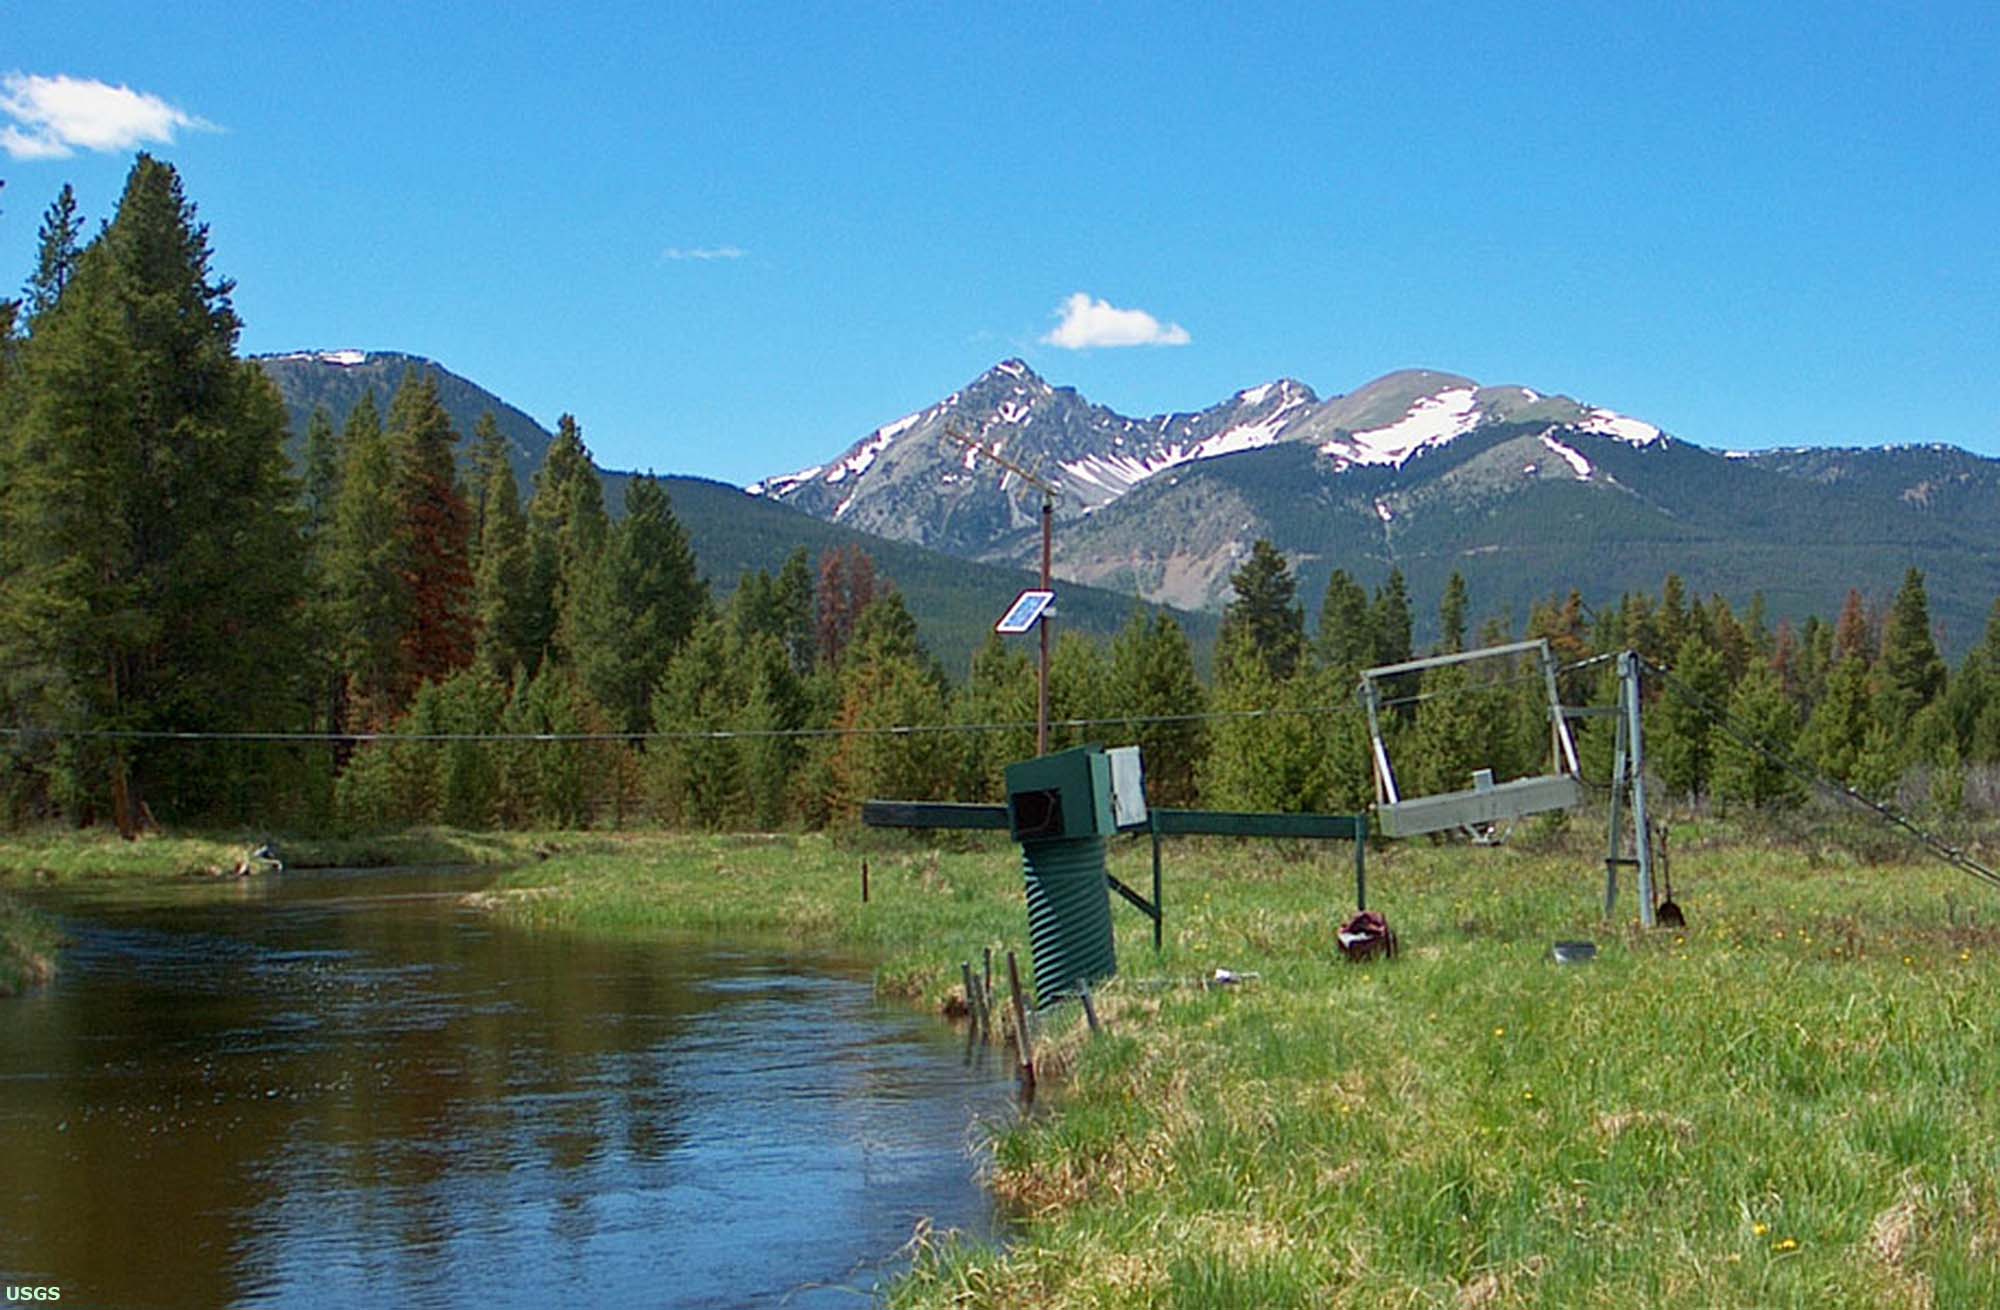 Example of a stream gauge near Grand Lake in headwater region of the Colorado River. |
Fig. 7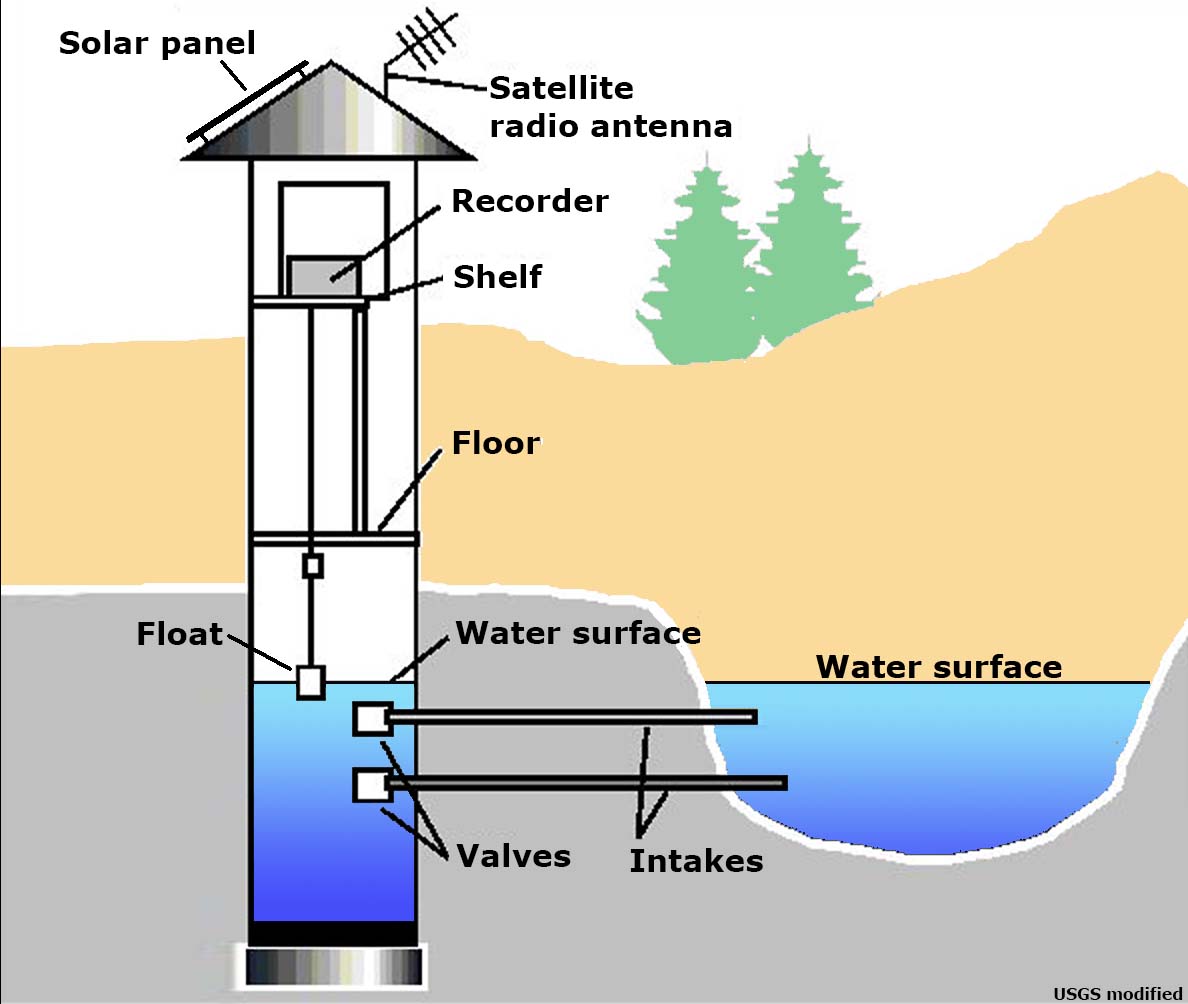 Stream gauge diagram |
Fig. 8 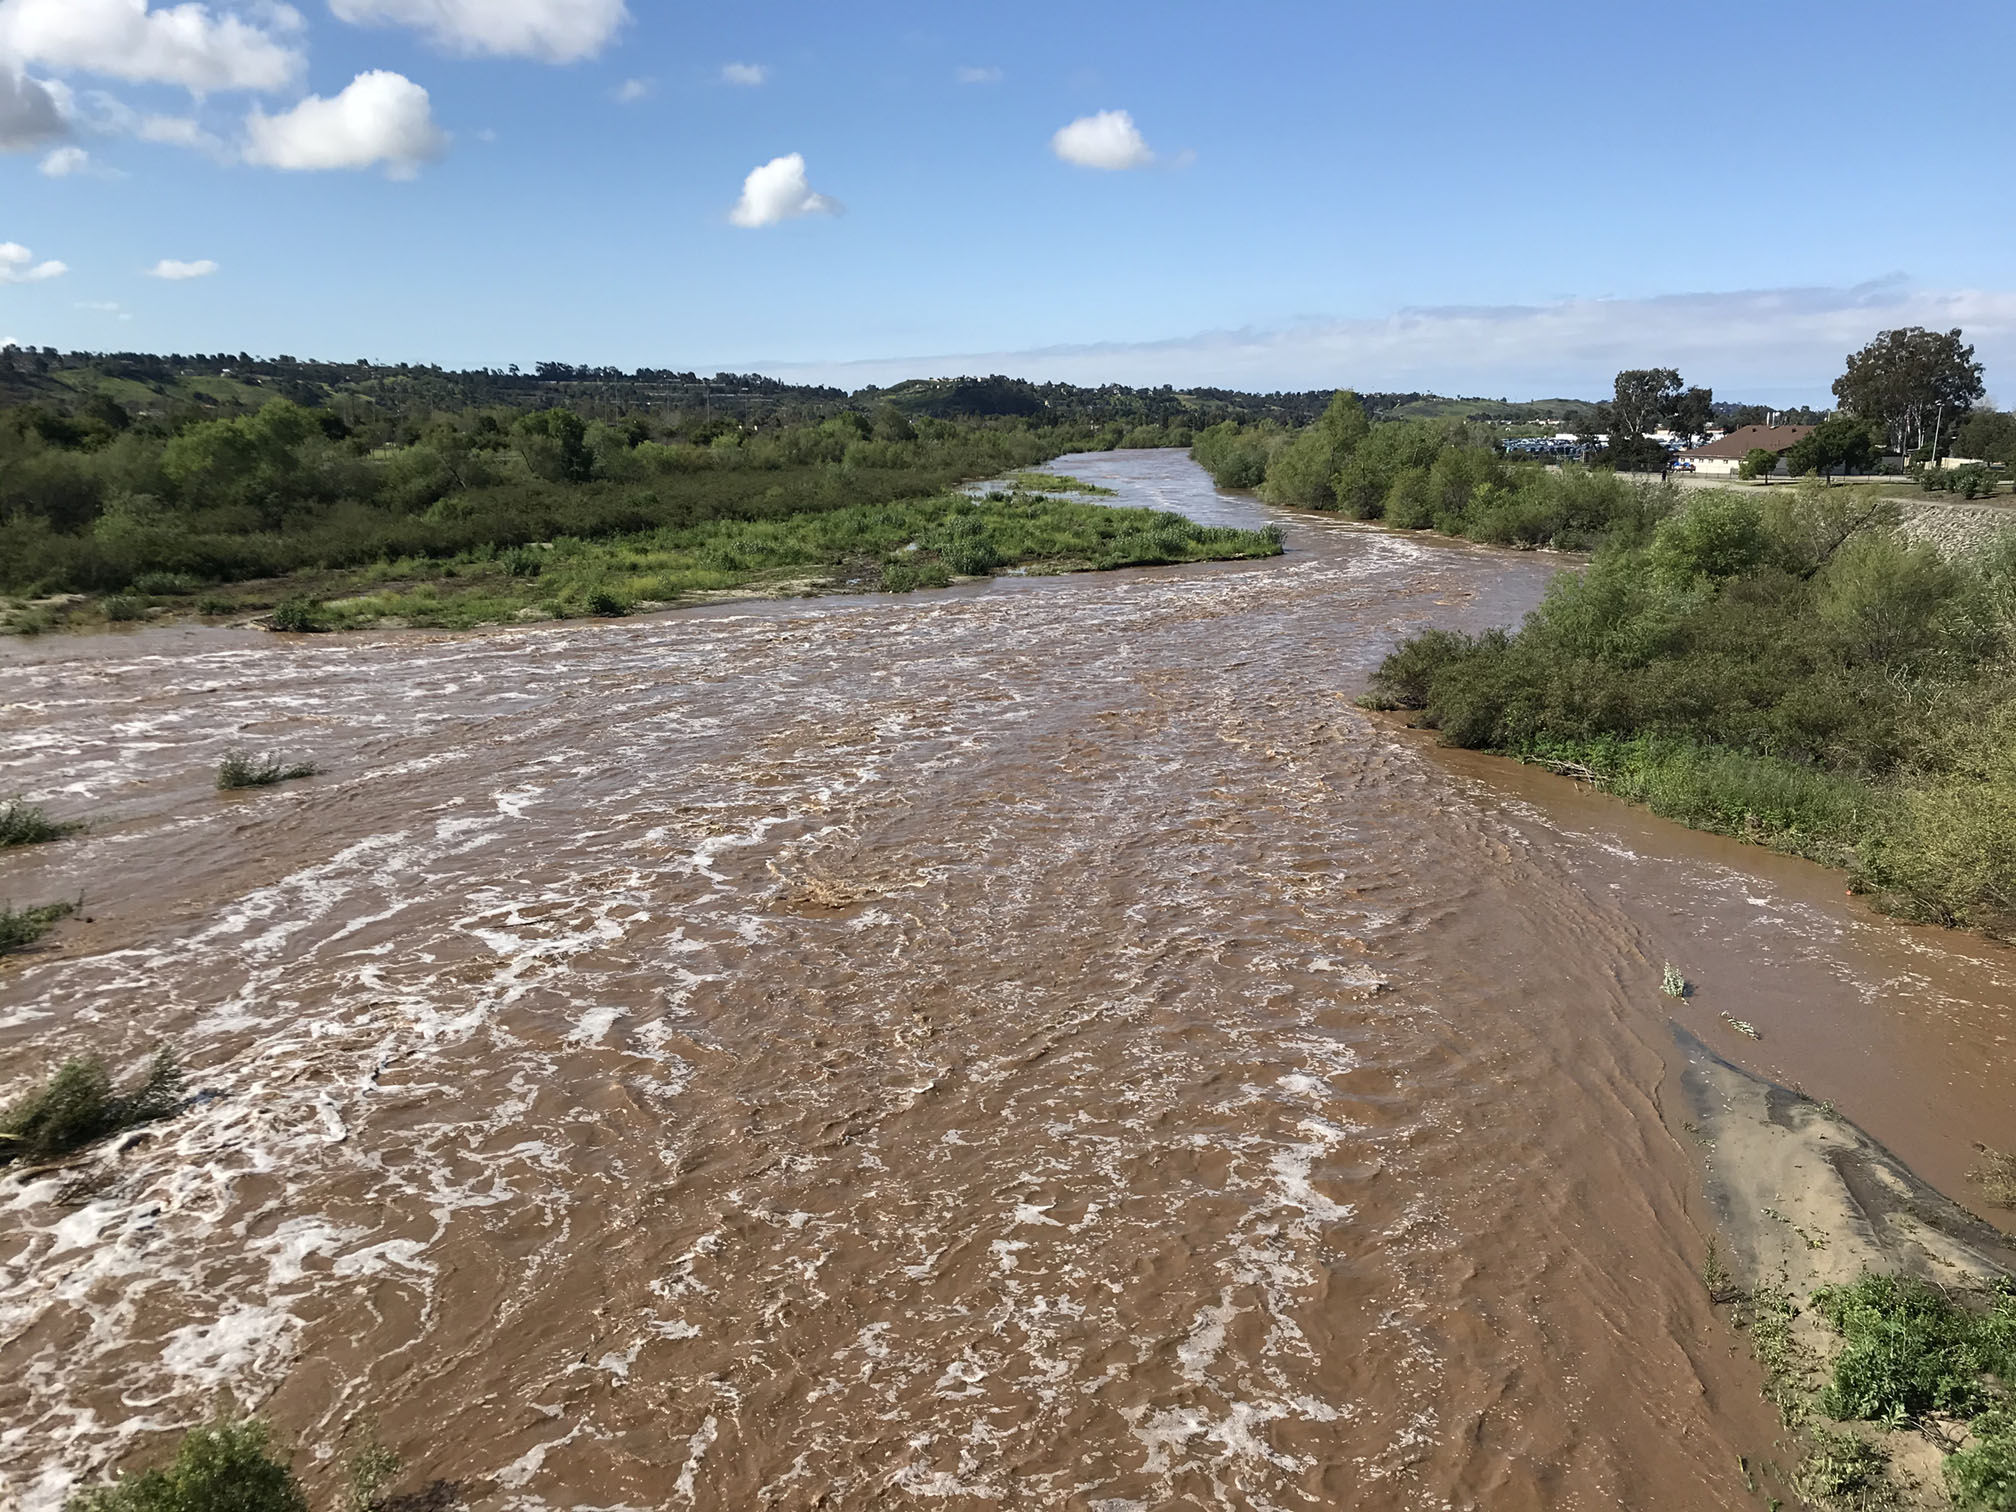 San Luis Rey River in flood in Oceanside, CA (4/11/2020) |
Fig. 9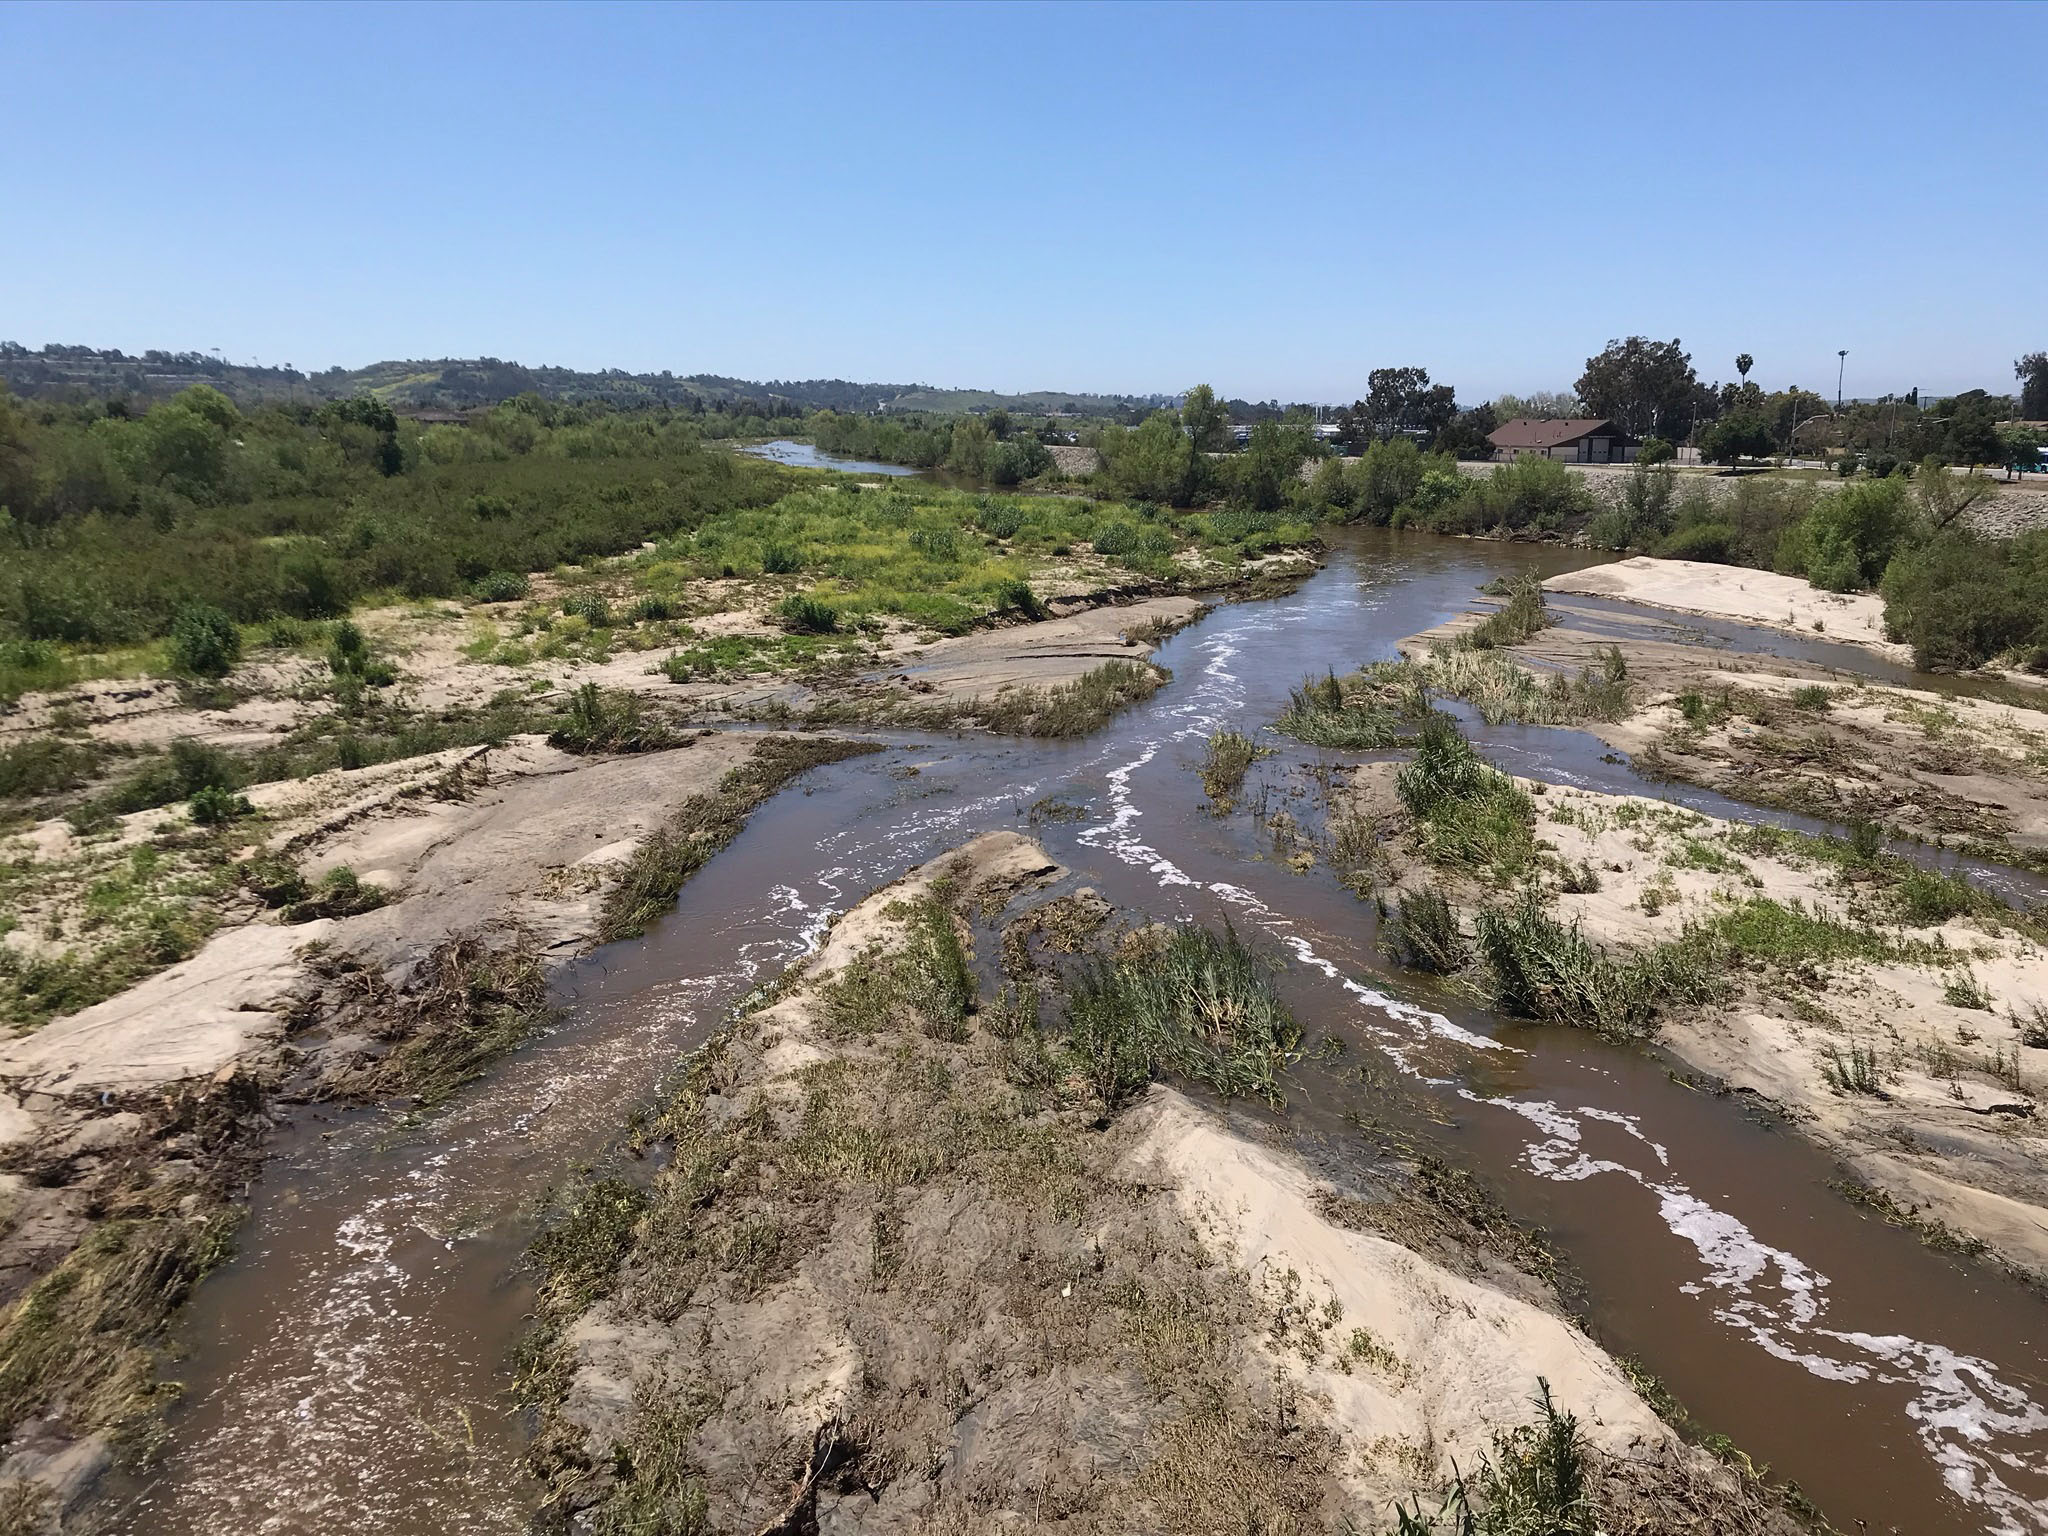 San Luis Rey River a couple days after flood had ended. |
Fig. 10 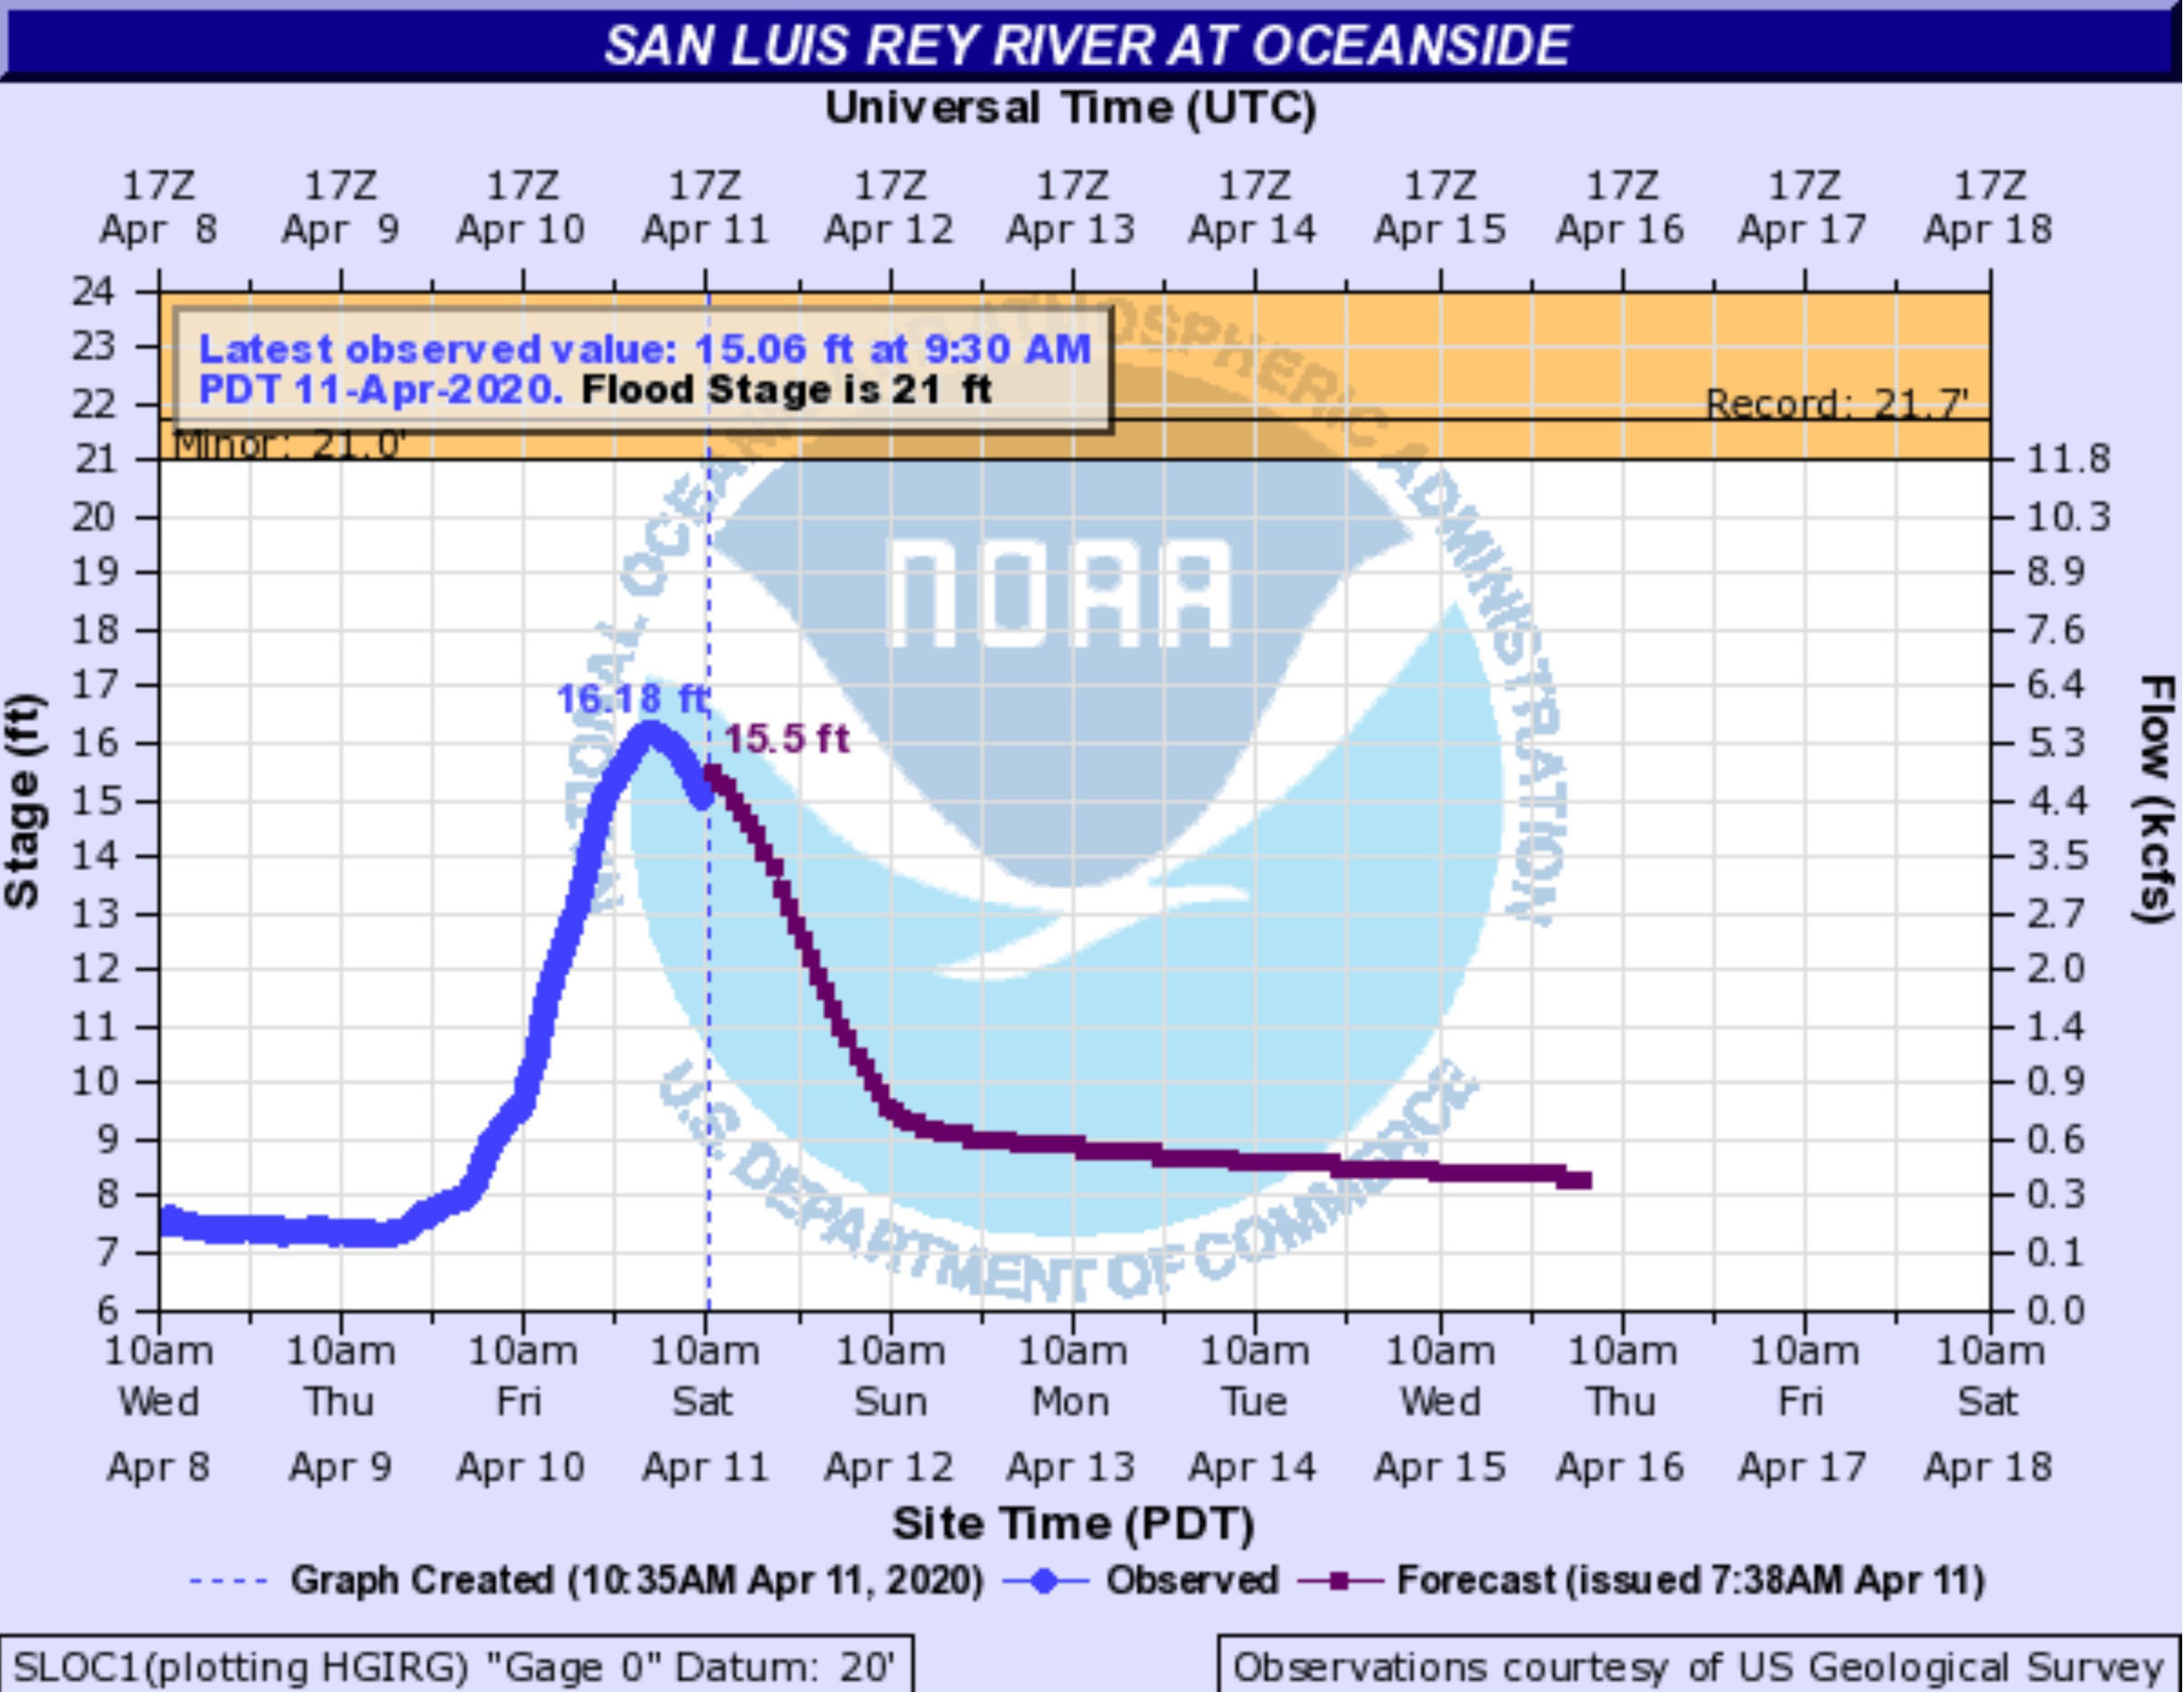 Stream gauge profile for the San Luis Rey River flood. |
How Much Water Do "We" Use? |
Fig. 11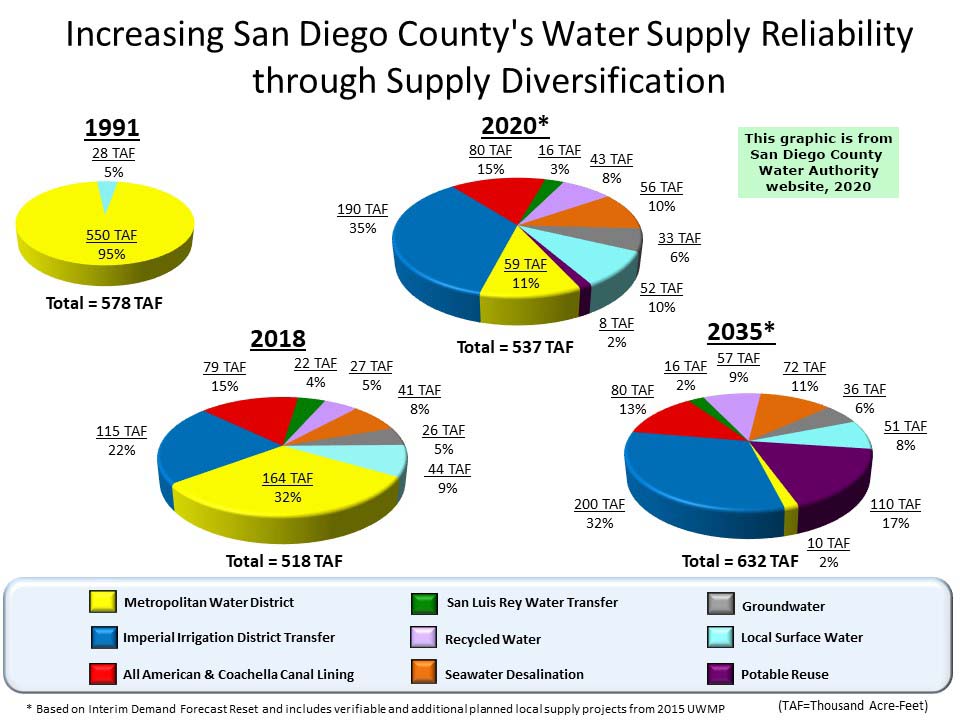 Past, current, and projected water supply for San Diego County as evaluated by the San Diego County Water Authority (2020). |
The amount of water people or communities use varies considerably—for many reasons. Organizations that manage the water supply to cities or region must constantly monitor both the supply and demand for water. Both too much and too little water supply can result in a multitude of problems and restrictions!Example: San Diego Daily Residential Water ConsumptionAccording to US Census estimates, there are about 3,338,000 people in 1.426,000 residents currently living in San Diego County (reported in 2019).According to the San Diego County Water Authority (SDCWA), the daily residential water consumption in San Diego County is about 91 gallons. This is equivalent to about 33,237 gallons per year or 0.103 acre feet per year for the average San Diego residence. (Note that this is the mean for all residents reported in 2018.) The total "potable" (drinkable) water consumed in San Diego County as calculated by the SDCWA for year 2018 was 452,090.2 acre-feet. Figure 11 shows how, where, and how much water has been consumed and is projected to be consumed in the future—from a changing variety of sources. |
Sources of Water for San Diego—Past, Present, and FutureNote that the water supply for San Diego receives is constantly changing as new sources of water become available, and other sources become restricted or are diverted elsewhere (because of natural, economic, and political reasons). Annual rainfall supplies vary with regional climate conditions. Water conservation efforts are playing an increasing roll in managing water supply. Watershed management, waste water recycling, and seawater/groundwater desalination projects are increasing. Learn more about our water supplies (San Diego County Water Authority website). The table below summarizes past, current, and project future water supply sources for San Diego County (from Figure 11 above).Table 1. Sources of water for San Diego County
|
||||||||||||||||||||||||||||||||||||||||||||||||||||||||||||||||||||||||||||||||||||
Notes relating to Table 1—Sources of water for San Diego County |
The Metropolitan Water District of Southern California imports water from two sources:
|
| The Imperial Irrigation District gets its water solely from the Colorado River. Some of it is transferred to San Diego County Water Authority. The American & Coachella Canal Lining Project is a conservation project that saves water by reducing water loss from existing canal and water systems. |
| The San Luis Rey Water Transfer involves a settlement involving water rights and water sharing agreements between the San Luis Rey Indian Water Authority and the San Diego County Water Authority. |
| Desalination Projects (involves desalination of seawater and salty groundwater in San Diego. In 2018, the Richard A. Reynolds Groundwater Desalination Facility started to provide 2,600 acre-feet per year to the county water supply. The Claude "Bud" Lewis Carlsbad Desalination Plant (described as "the largest, most technologically advanced, and energy-efficient seawater desalination plant in the nation") produces approximately 50 million gallons of tap water per day (150 acre-feet/day or 56,000 acre-feet per year). |
| Local surface water and groundwater supplies are managed in collaboration with watershed management by two dozen local water districts within San Diego County. (This is discussed San Diego County's Natural Water Supply and a section illustrating The San Dieguito River Watershed.) |
| Recycling of used potable water is already in operation and will become a greater source in the future for San Diego (and elsewhere). Trapping roof and urban runoff measures are a means to save water costs and protect local watersheds. (This is discussed under Water Conservation.) |
| Conservation—simply put: "The best way to save water is don't use or loose it." There are many efforts and means to conserve water resources. Practically every water district provides information about conserving water resources and the protecting watersheds (discussed below). Property owners are encouraged to remove or replace grass and plants with drought- and fire-resistant plants. Reduction of leakage and evaporation loss are the driving many projects to upgrade water systems—such as replacing surface reservoirs with underground water storage. |
Continue to the next page (a tour of the Colorado River Drainage Basin).A) Where Does San Diego Get Its Water?B) The Colorado River Drainage Basin C) California's Interconnected Water System D) San Diego County's Natural Water Supply E) The San Dieguito River Watershed F) Water Conservation G) Assignment Tasks & Questions |
| https://gotbooks.miracosta.edu/earth_science/water/index.html | 6/29/2020 |