Weather Information For Southern California |
| The old phrase, "If you don't like the weather, wait 5 minutes."—certainly applies here in Southern California. That is, when we actually "have weather" (meaning not just the usual clear sunny day so prevalent in the region). The myth that "it never rains in southern California" is just that... a myth! Southern California is host to occasional storms, even superstorms, that can wreak havoc and destruction as in other parts of the world. It is also prone to extended periods of drought. This website provides an over of important weather informations provided by the National Weather Service and other science agencies involved in weather and climate research. Although the focus of this website is on coastal Southern California, but discussions also apply to weather for the nation, and beyond. Topics range from the concepts associated with a local weather forecast, weather advisories (watches and warnings), understanding weather maps, weather radar, and weather satellite imagery. |
 |
| Click on images for a larger view or a web link. |
Weather Information SourcesThe National Weather Service (NWS) is a branch of the larger U.S. National Atmospheric & Oceanographic Administration (NOAA) that oversees the collection of weather and climate-related data for the United States in collaboration with many other organizations around the world. The NWS consists of a collection of national and regional research centers, and currently 122 local Weather Forecast Offices. Some of this data is released directly on National Weather Service websites, but the same data is used by News media and other commercial sources that repackage and display the information (with advertising).The National Weather Service website is https://www.weather.gov/ Enter a zip code on weather.gov to get to local weather information and forecasts. |
 |
| Please note! Links to government websites may be revised or changed as new information sourses and systems become available. |
|
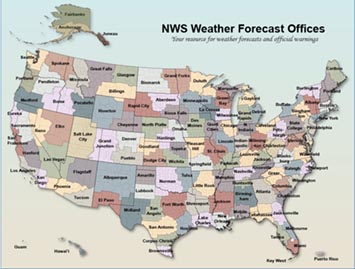
This website uses illustrations about weather in Southern California For Southern California there are five NWS Forecast Offices: San Diego NWS Forecast Office Los Angeles NWS Forecast Office Hanford, AZ NWS Forecast Office (covers the southern Central Valley and Southern Sierra Nevada) Phoenix, AZ NWS Forecast Office (covers California's southeastern deserts region) Las Vegas, NV NWS Forecast Office (covers Death Valley and surrounding mountain/deserts region) Each of these offices provide pertinent information to each these regions. Click here for an interactive map showing the location of Forecast Office region of the United States. Local weather forecasts are generated by a local forecast office, with spot weather information for places (towns, parks, and other areas) throughout the local forecast office coverage area. This data is used by local news organizations and other commercial organizations that repackage weather data. |
 |
NWS Local Weather Forecasts include the following basic information:Current ConditionsTemperature (in °F and °C) Humidity Wind Speed Barometer (in millibars) Dew point (in °F and °C) Visibility 5-Day weather extended forecast Hourly weather forecast ( for 48 hours) 3 Day History |
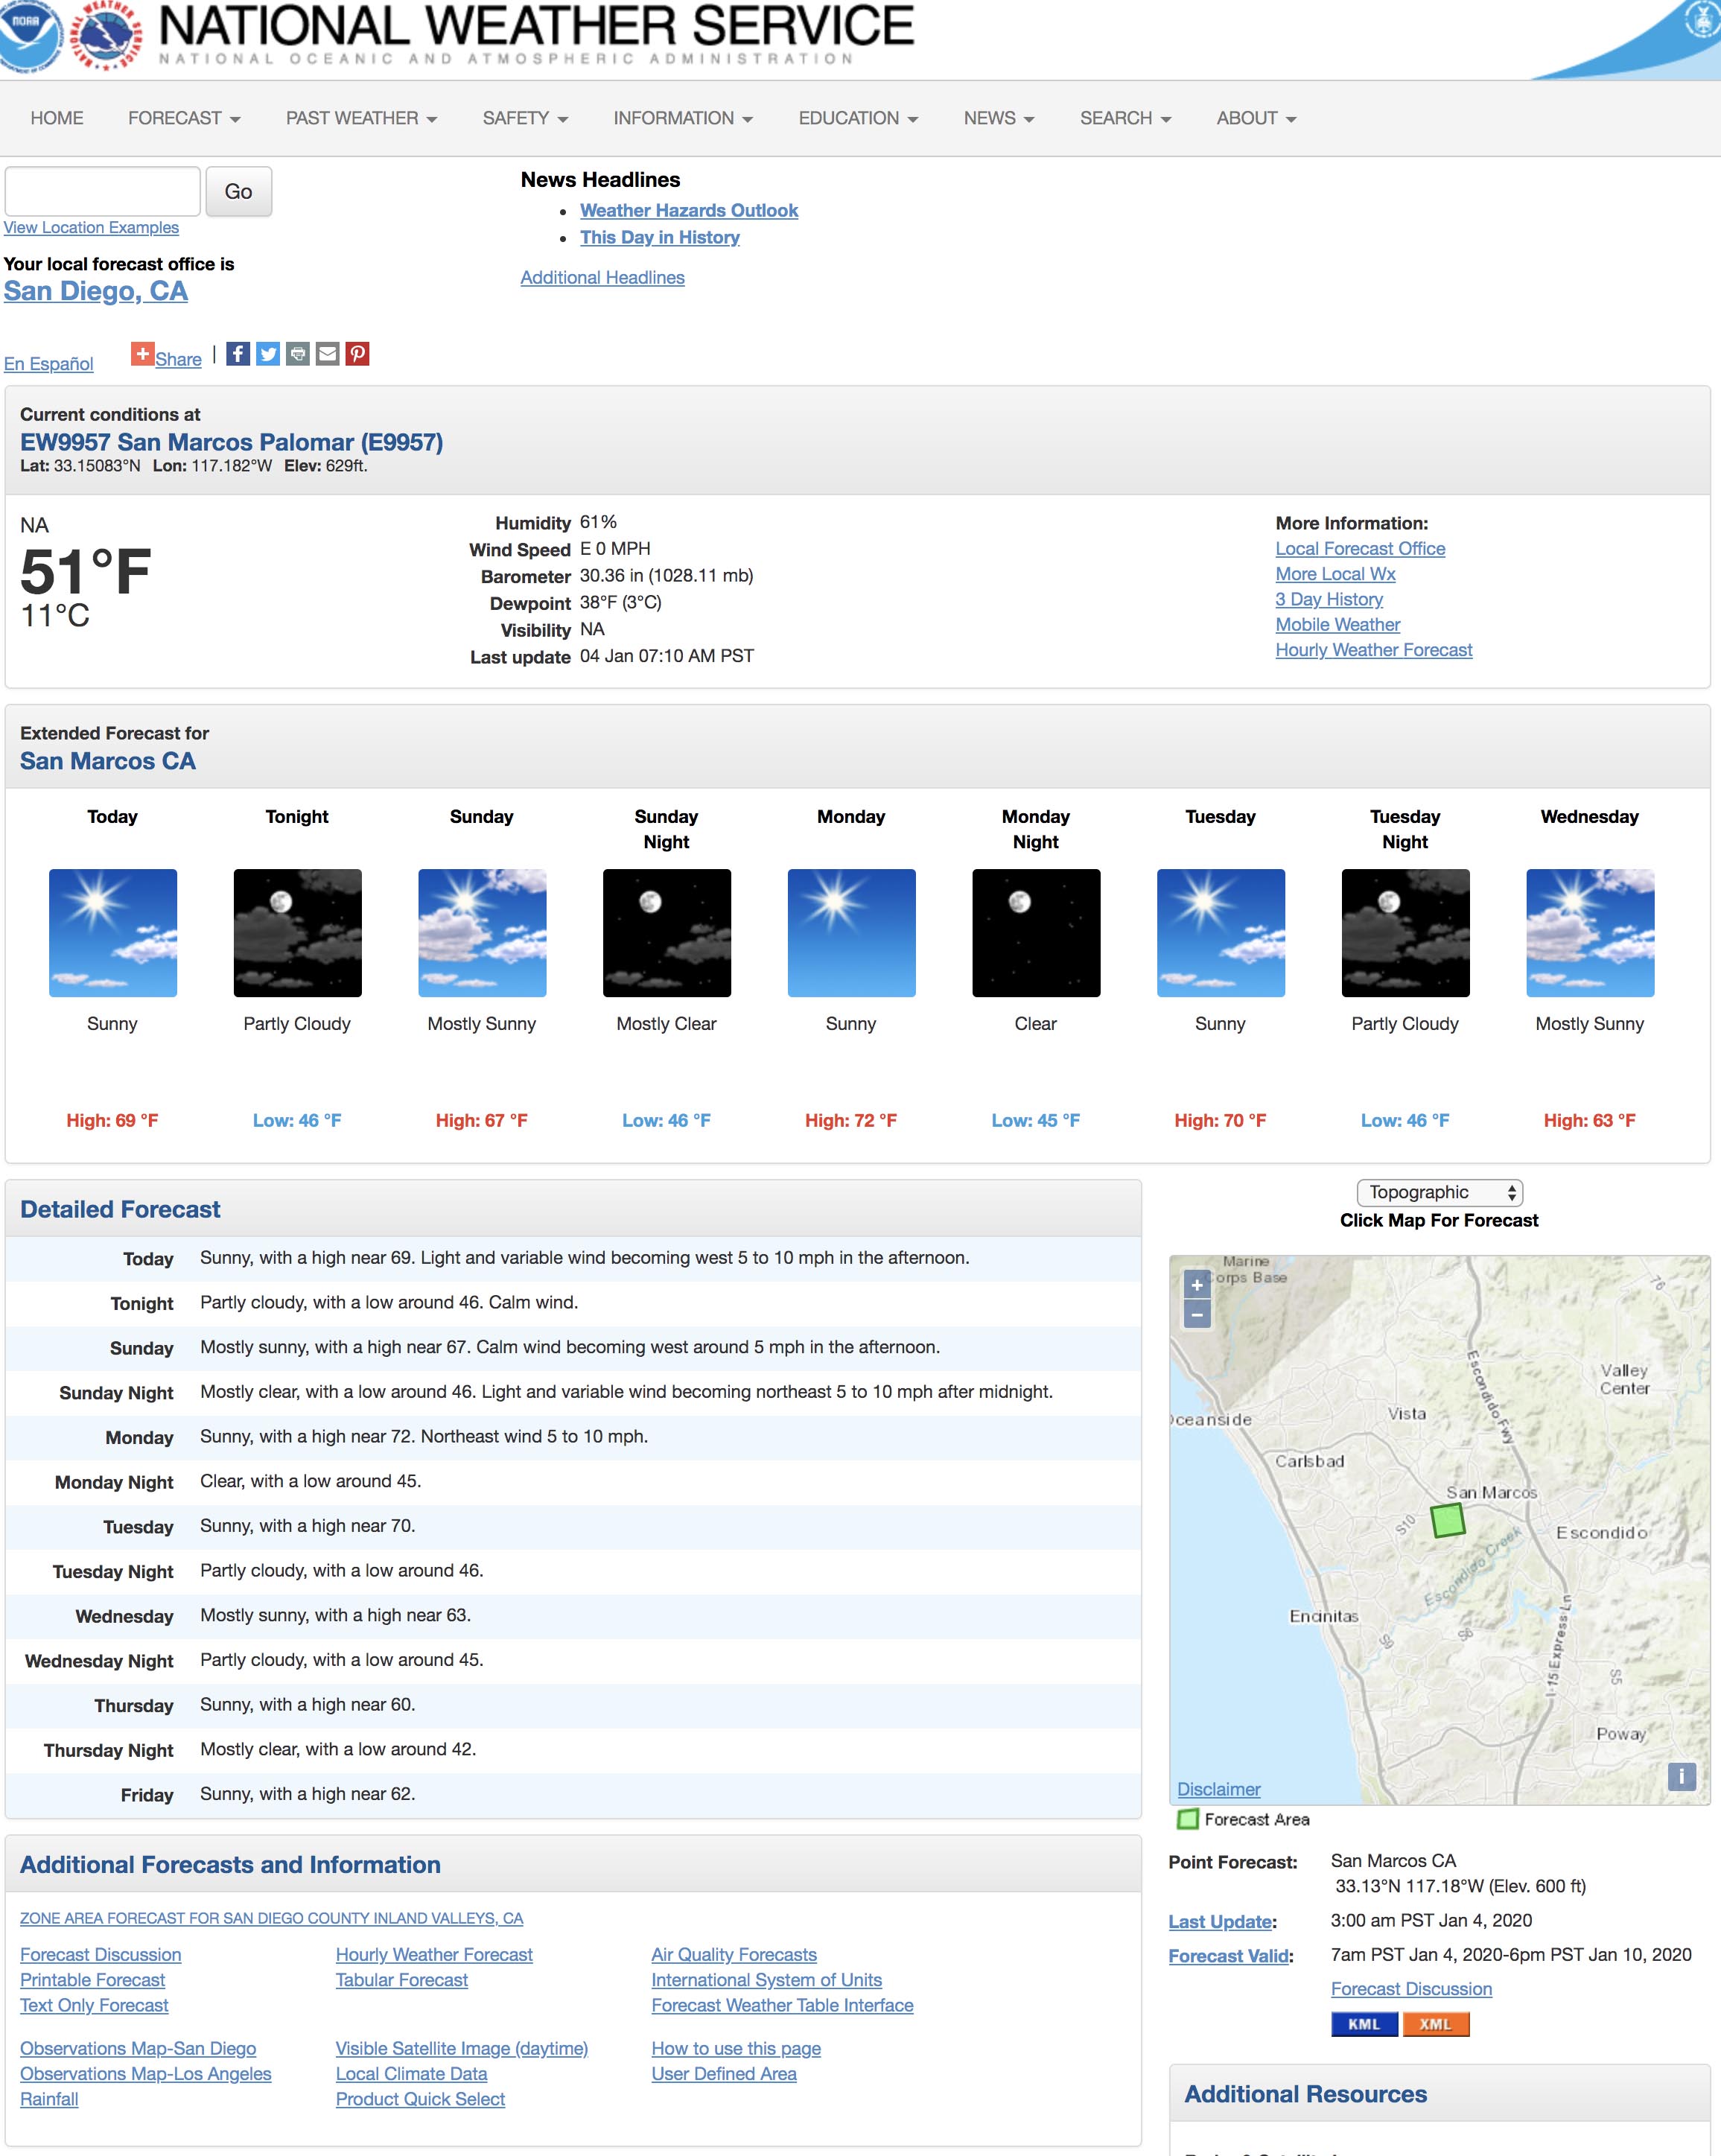 |
Regional Weather Information From Weather Forecast OfficesRegional NWS Weather Forecast Offices also release more detailed regional information including: Weather Hazard Outlook"ADVISORIES are sort of in between a WATCH and WARNING. The expected weather condition has a pretty good chance of occurring, even a likely chance of occurring, but typically an advisory is used for less severe type of weather conditions" (NWS). See the link below for detailed information of how weather watches, warnings, and advisories are specifically defined.Watch/Warning/Advisory DefinitionsWeather Forecasts and Advisories are released by district offices in collaboration with national centers overseen by NOAA and the National Weather Service. |
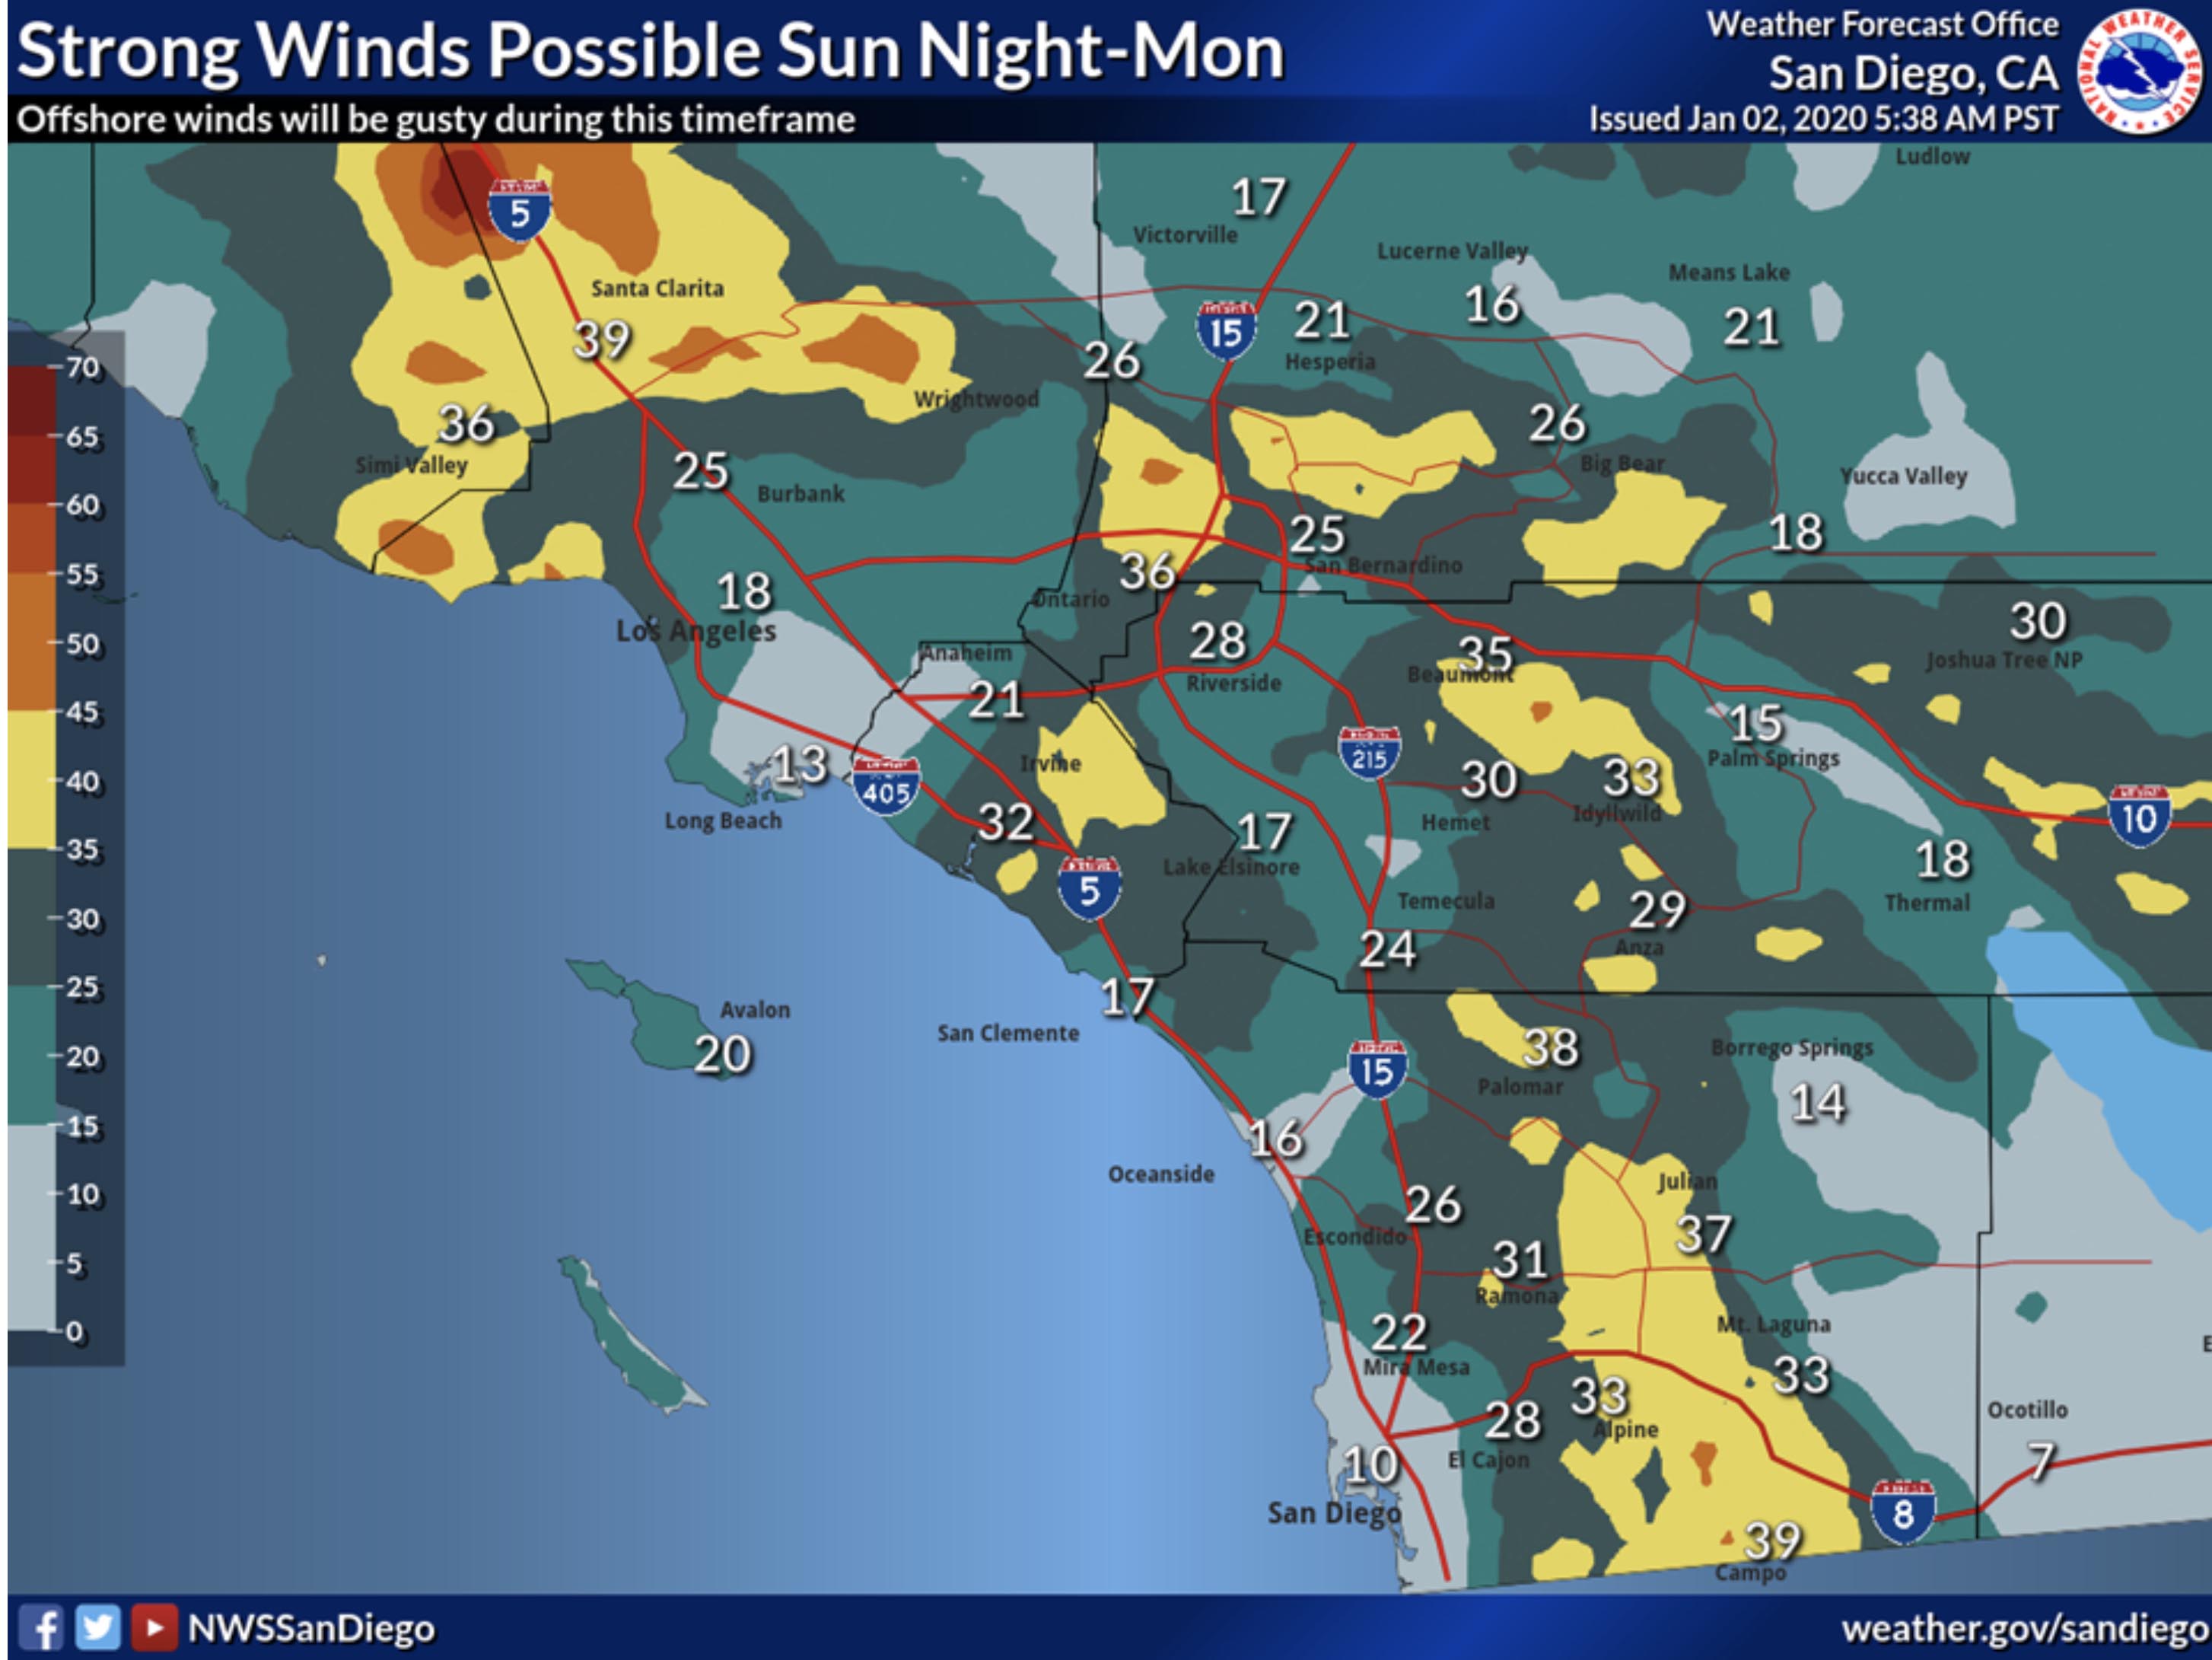 Example of a Wind Advisory for San Diego, CA Example of a Wind Advisory for San Diego, CA |
| Weather Forecast Offices release a Weather History summary: ("On this day in...") provides historical data record for each day of the year in the district's region as long as data has been recorded and released. This summary provides information about weather-related phenomena and hazards for each day. |
Examples of Forecasts, Advisories, Watches and Warnings by the National Weather Service |
|||
| Severe Weather Statements | High Wind Advisories & Warnings | Heat Advisories & Warnings | Winter Weather Advisories & Warnings |
| Severe Weather Watches & Warnings | Gale Watches & Warnings | Air Quality Advisories & Warnings | Winter Storm Watches & Warnings |
| Severe Thunderstorm Warnings | Hurricane Watches & Warnings | Drought Conditions | Wind Chill Advisories &Warnings |
| Tornado Watches & Warnings | Tsunami Warnings | Ocean Waves & Tides Forecasts | Freeze Watches & Warnings |
| Lightning Watches & Warnings | Fire Weather | Lakeshore Flood Watches &Warnings | Hard Freeze Watches & Warnings |
| Flood Advisories & Warnings | Ultraviolet Radiation | Rip Currents Advisories & Warnings | Boating Advisories & Warnings |
| Flash Flood Watches & Warnings | Space Weather | Storm Surge Advisories & Warnings | Aviation Forecasts & Warnings |
Current Regional Weather Information and ForecastsThe National Weather Service provides an abundance of information related to weather on local, regional, national and global scales. Local (or regional) office provide the most significant weather information to most people. For the average citizen living here in Southern California, perhaps the most significant information includes:● Current temperature and weather conditions ● Short-range and medium-range weather forecasts ● Storm expected rainfall (before a storm) ● Rainfall totals (after a storm) ● Wildfire weather hazard information. Trip planning weather information depends on what your destination may be: ● Sky cover, temperature and precipitation forecast, UV index (if you plan spend time outside, anywhere). ● snowfall conditions (for folks driving or going skiing in the mountains), ● tides, waves, water temperature, and water pollution warnings (if you are going to the beach.) ● weather forecasts for distance cities (if you are flying somewhere). |
Weather Station InstrumentsBelow is a list of instruments associated with weather stations used for measuring atmospheric conditions and phenomena. Modern systems are called automated surface-observing systems. Versions of them can be installed on land, ships, buoys, or aircraft. The most advanced stations have all these instruments, and more.
|
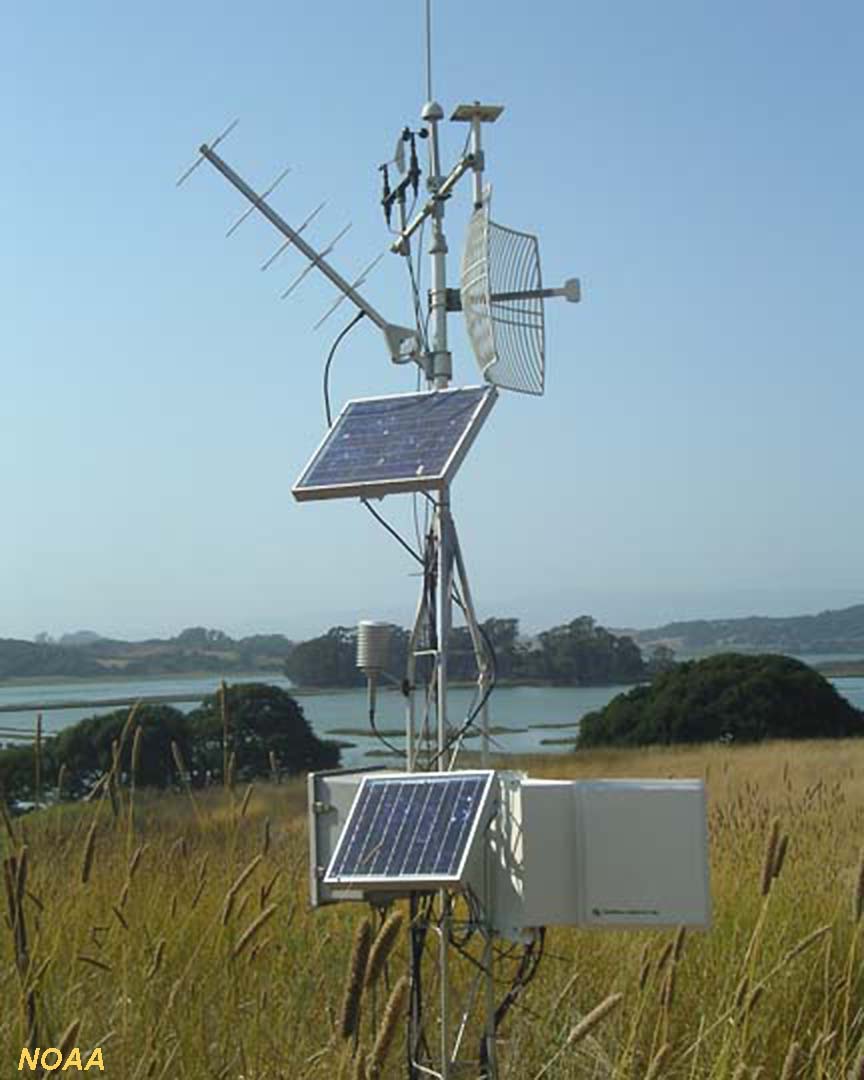 Example of a basic weather station |
| See NOAA's website on "6 tools our meteorologist use to forecast weather." In addition to weather stations, meteorologists use Doppler radar, satellite data, radiosondes (instruments attached to weather balloons), supercomputers, and NOAA's AWIPS (Advanced Weather Information Processing System). |
Weather Maps and Information |
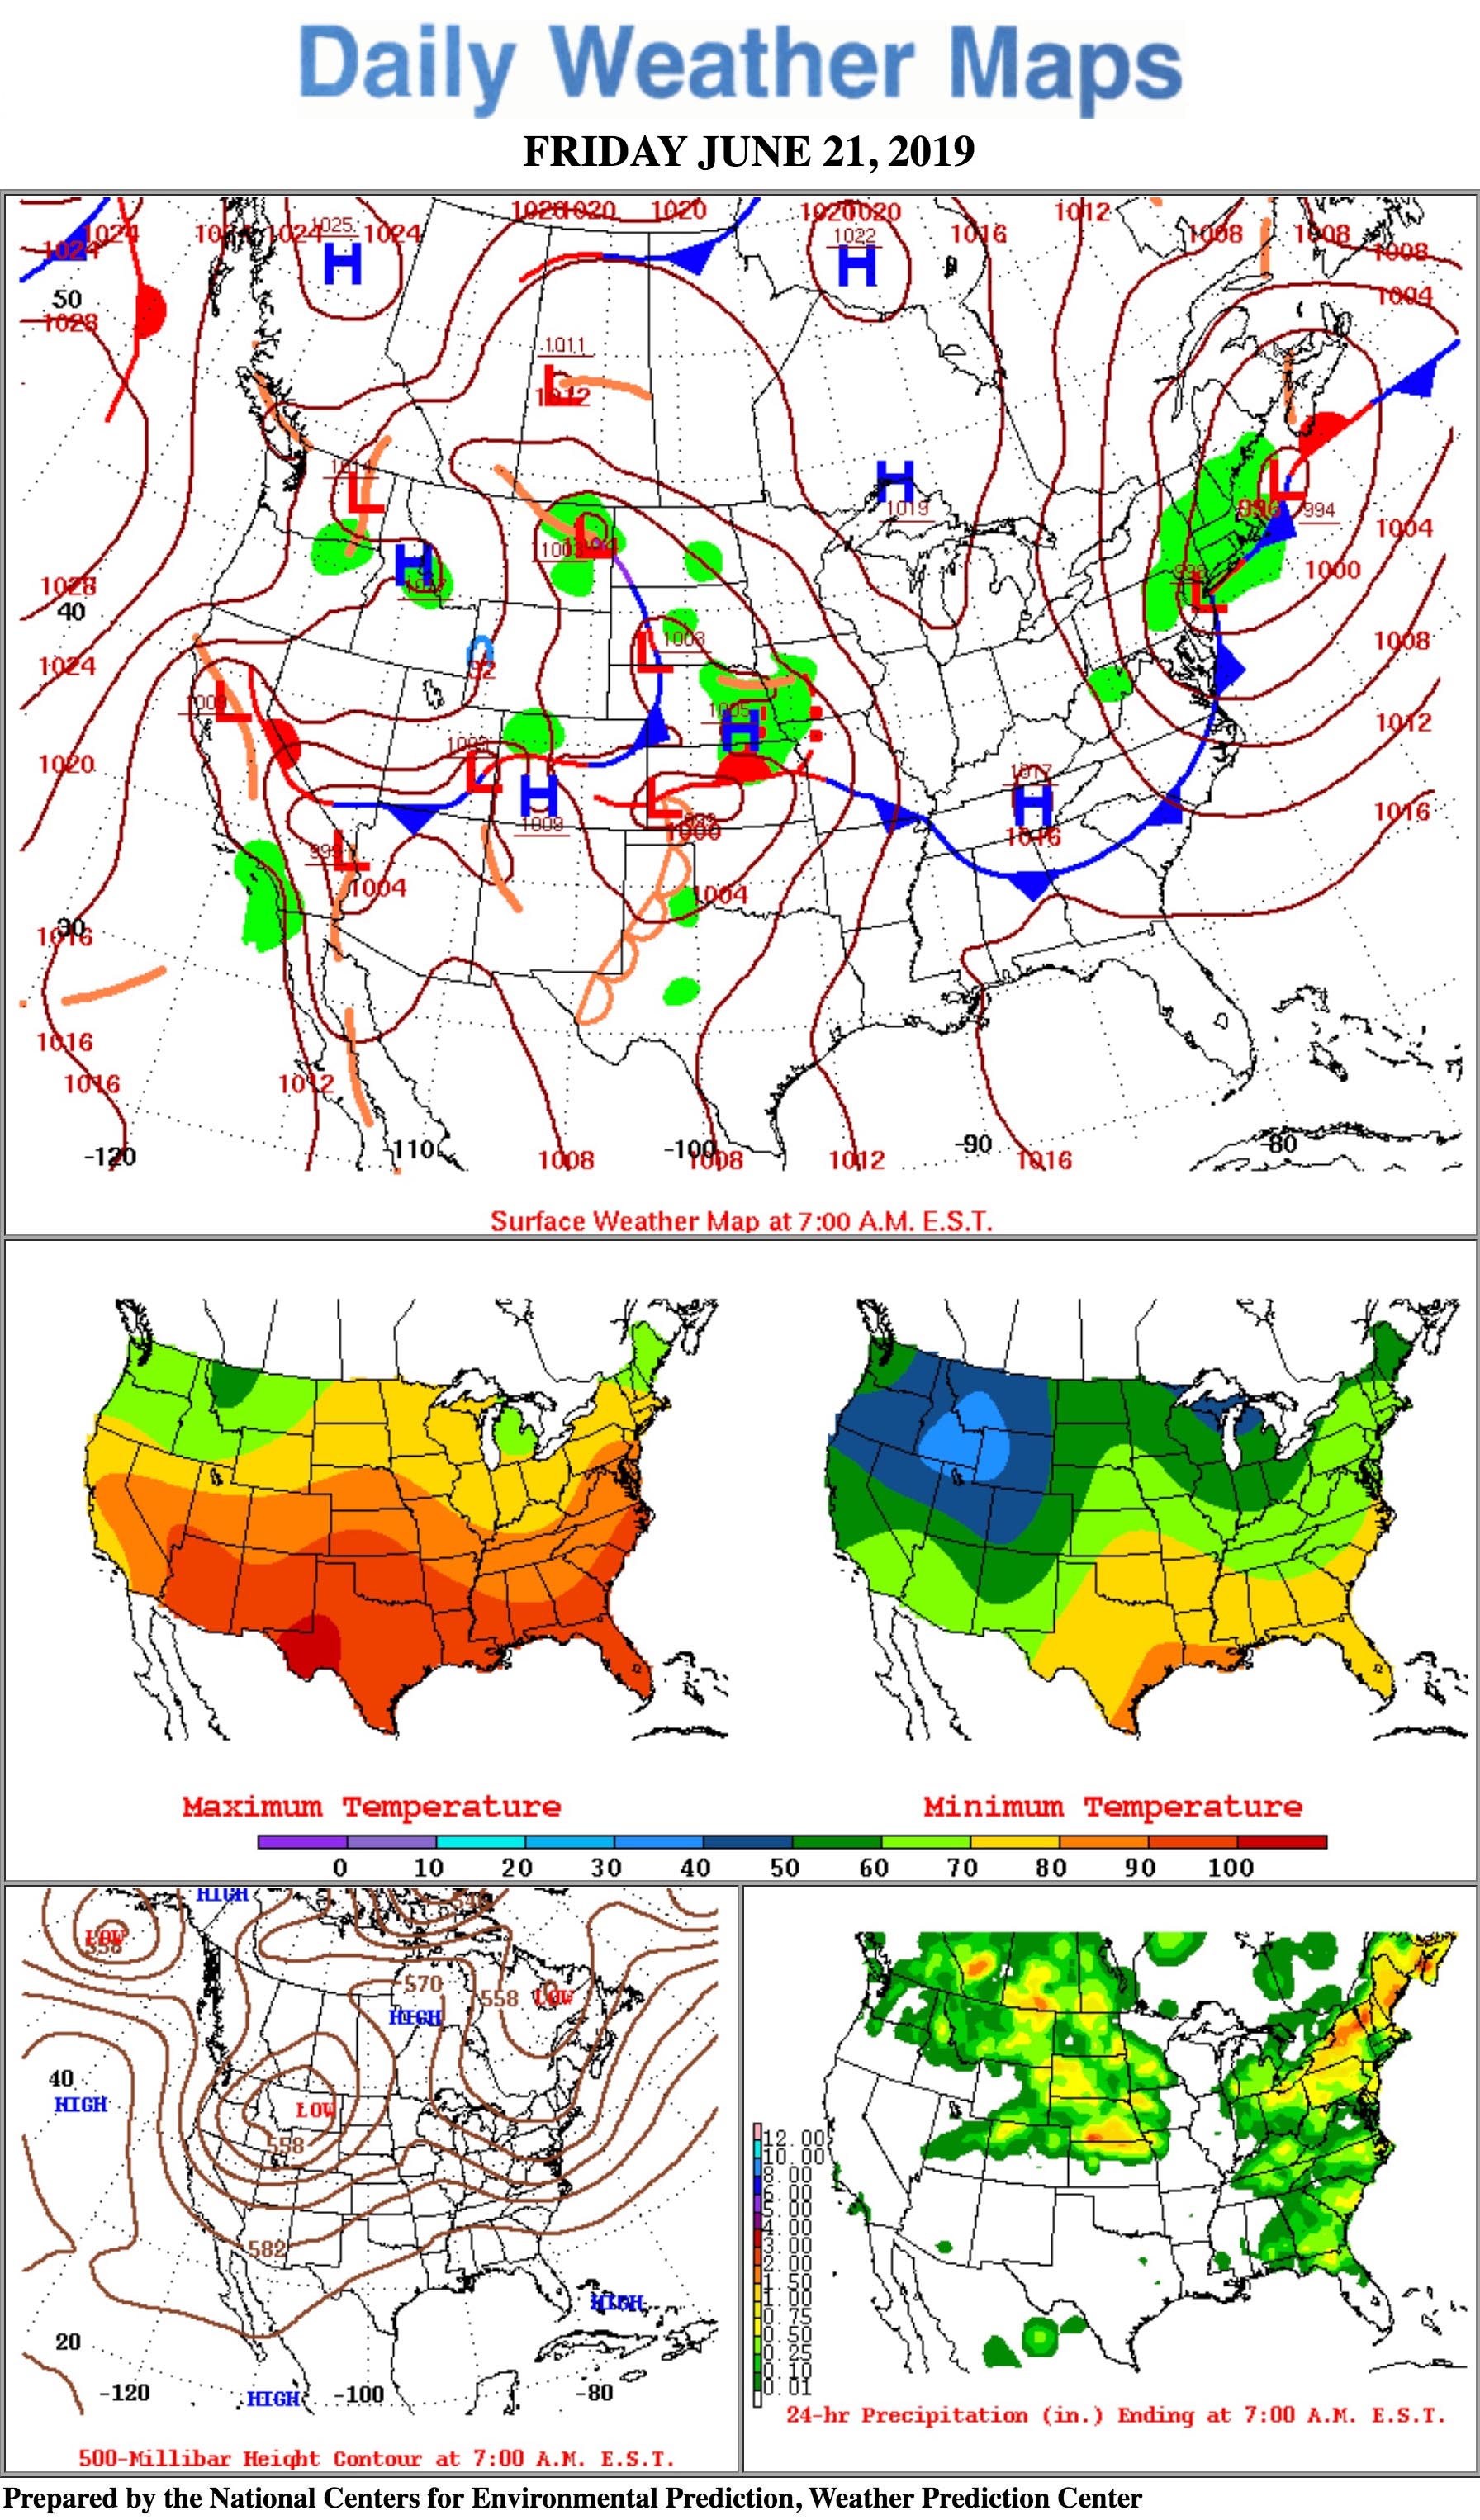
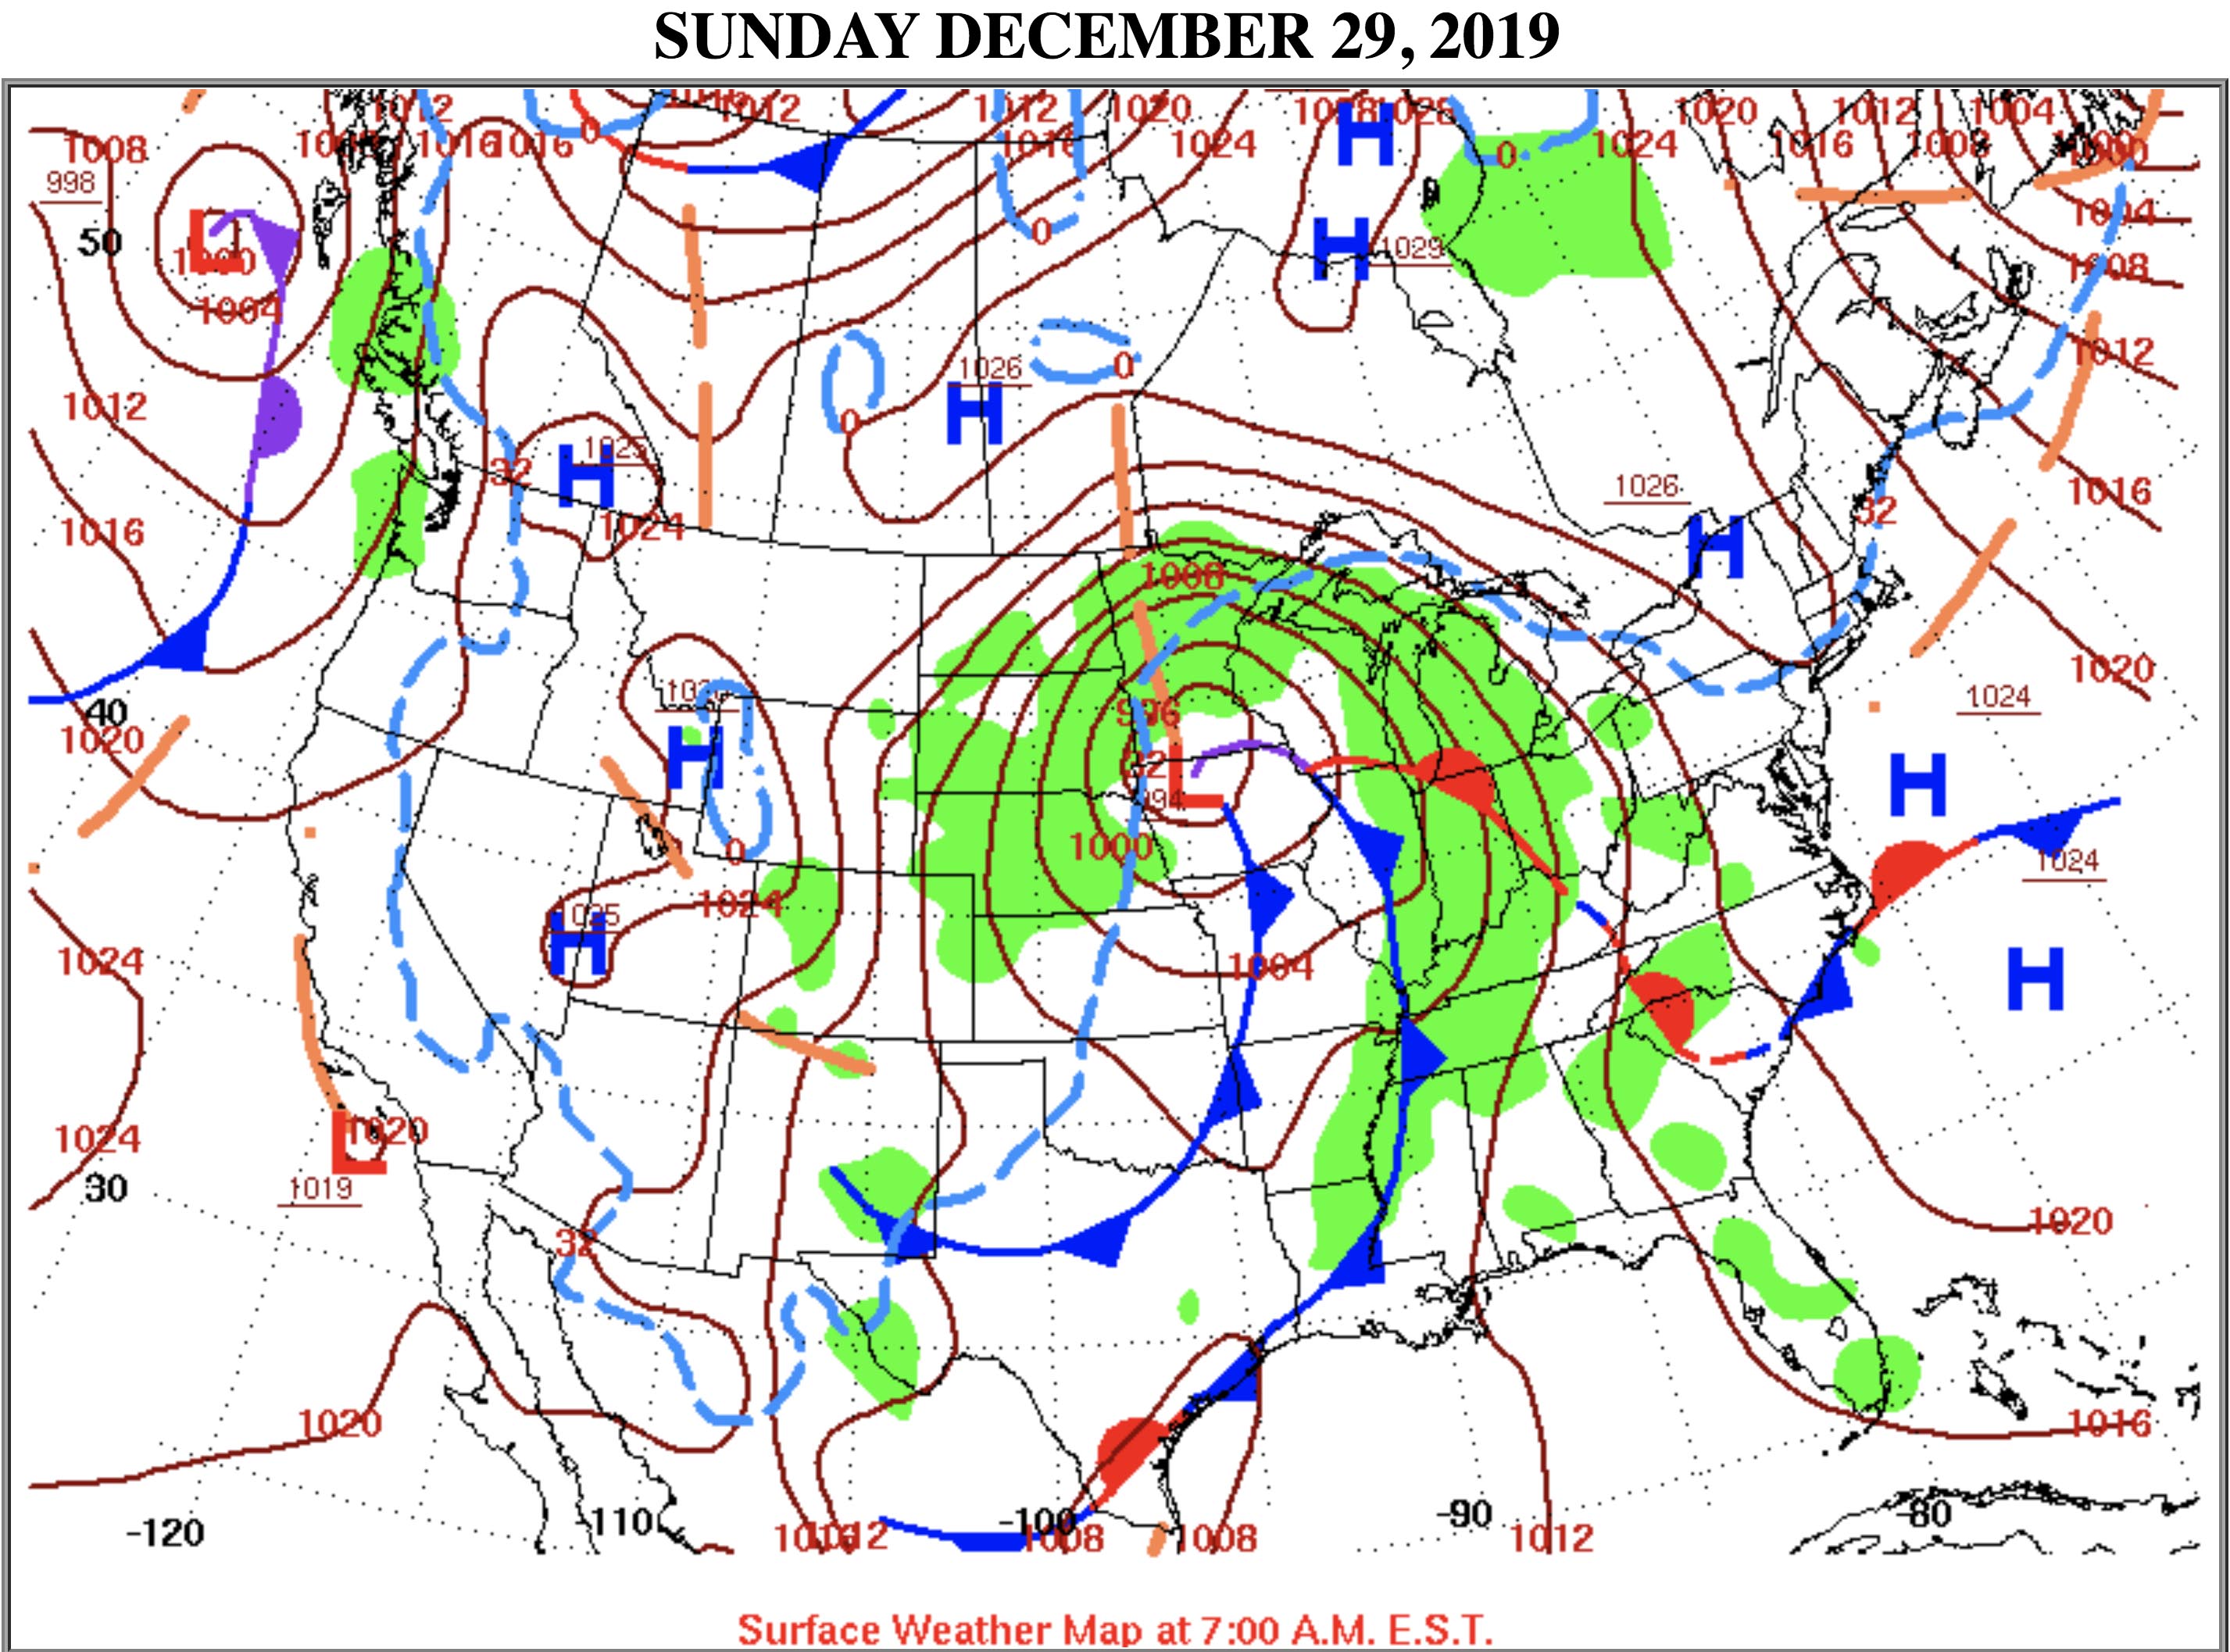
Daily Weather MapsThe National Weather Service provides Daily Weather Maps of the United States. |
 |
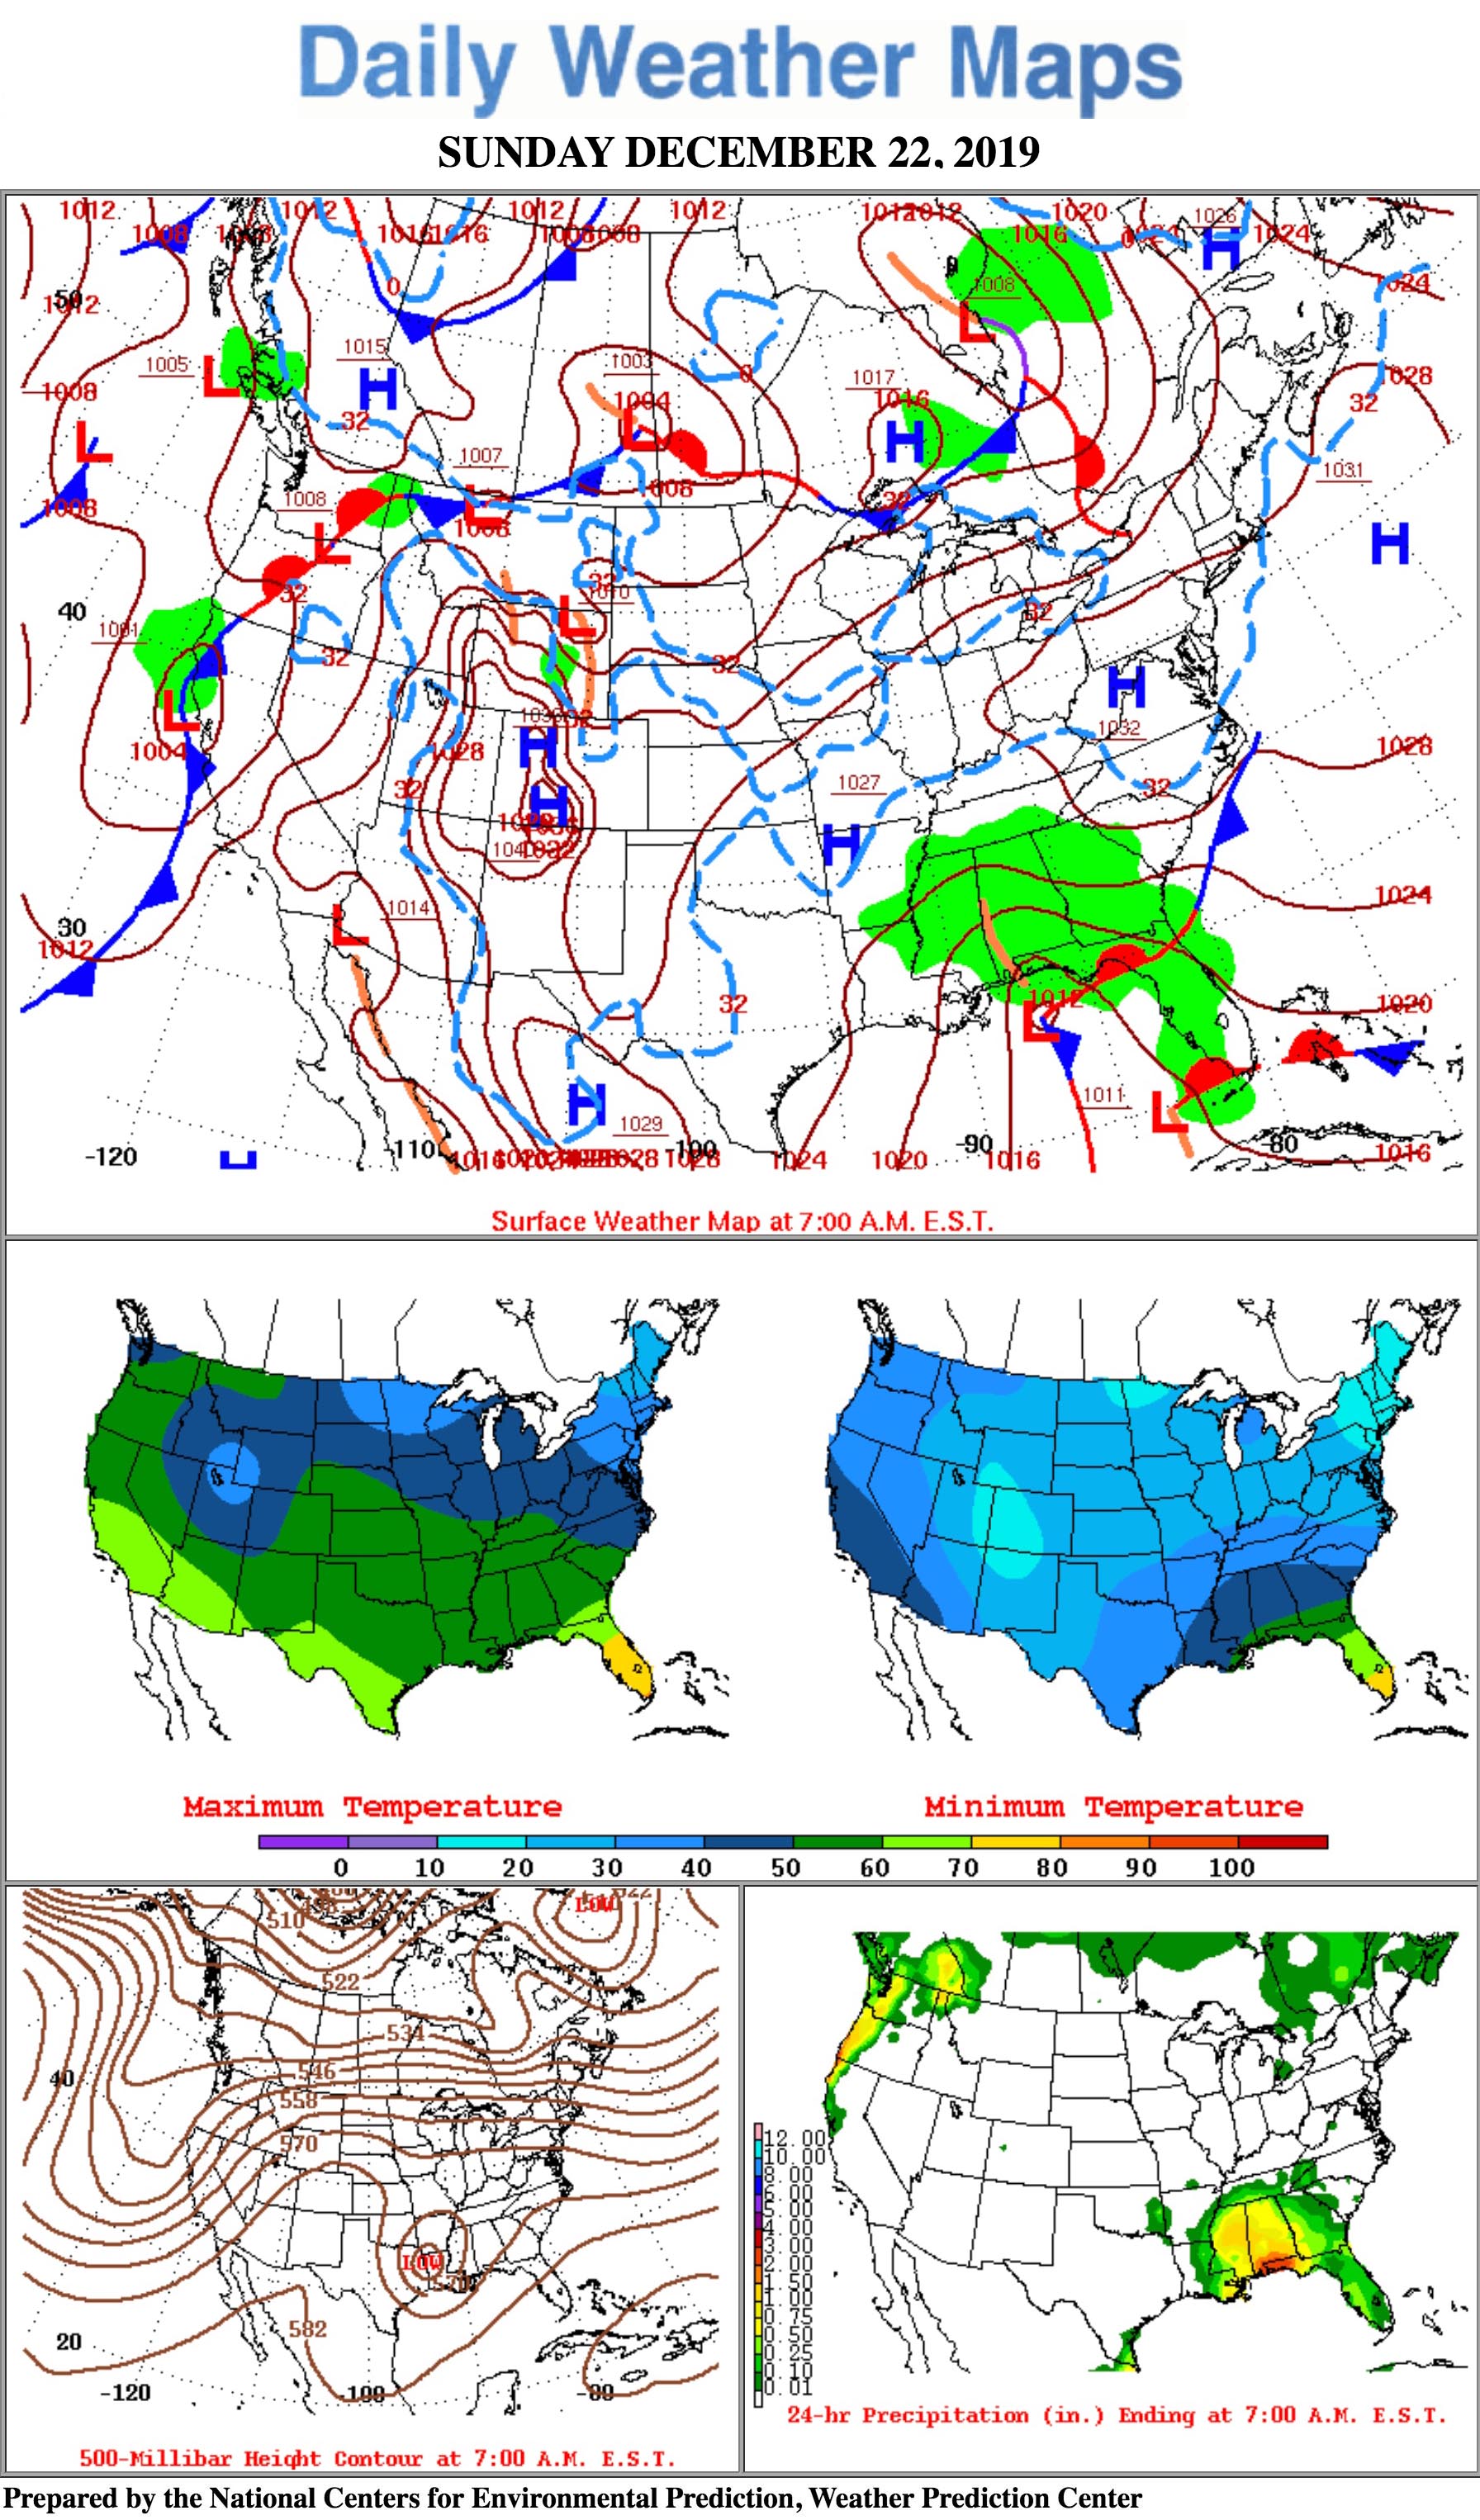 |
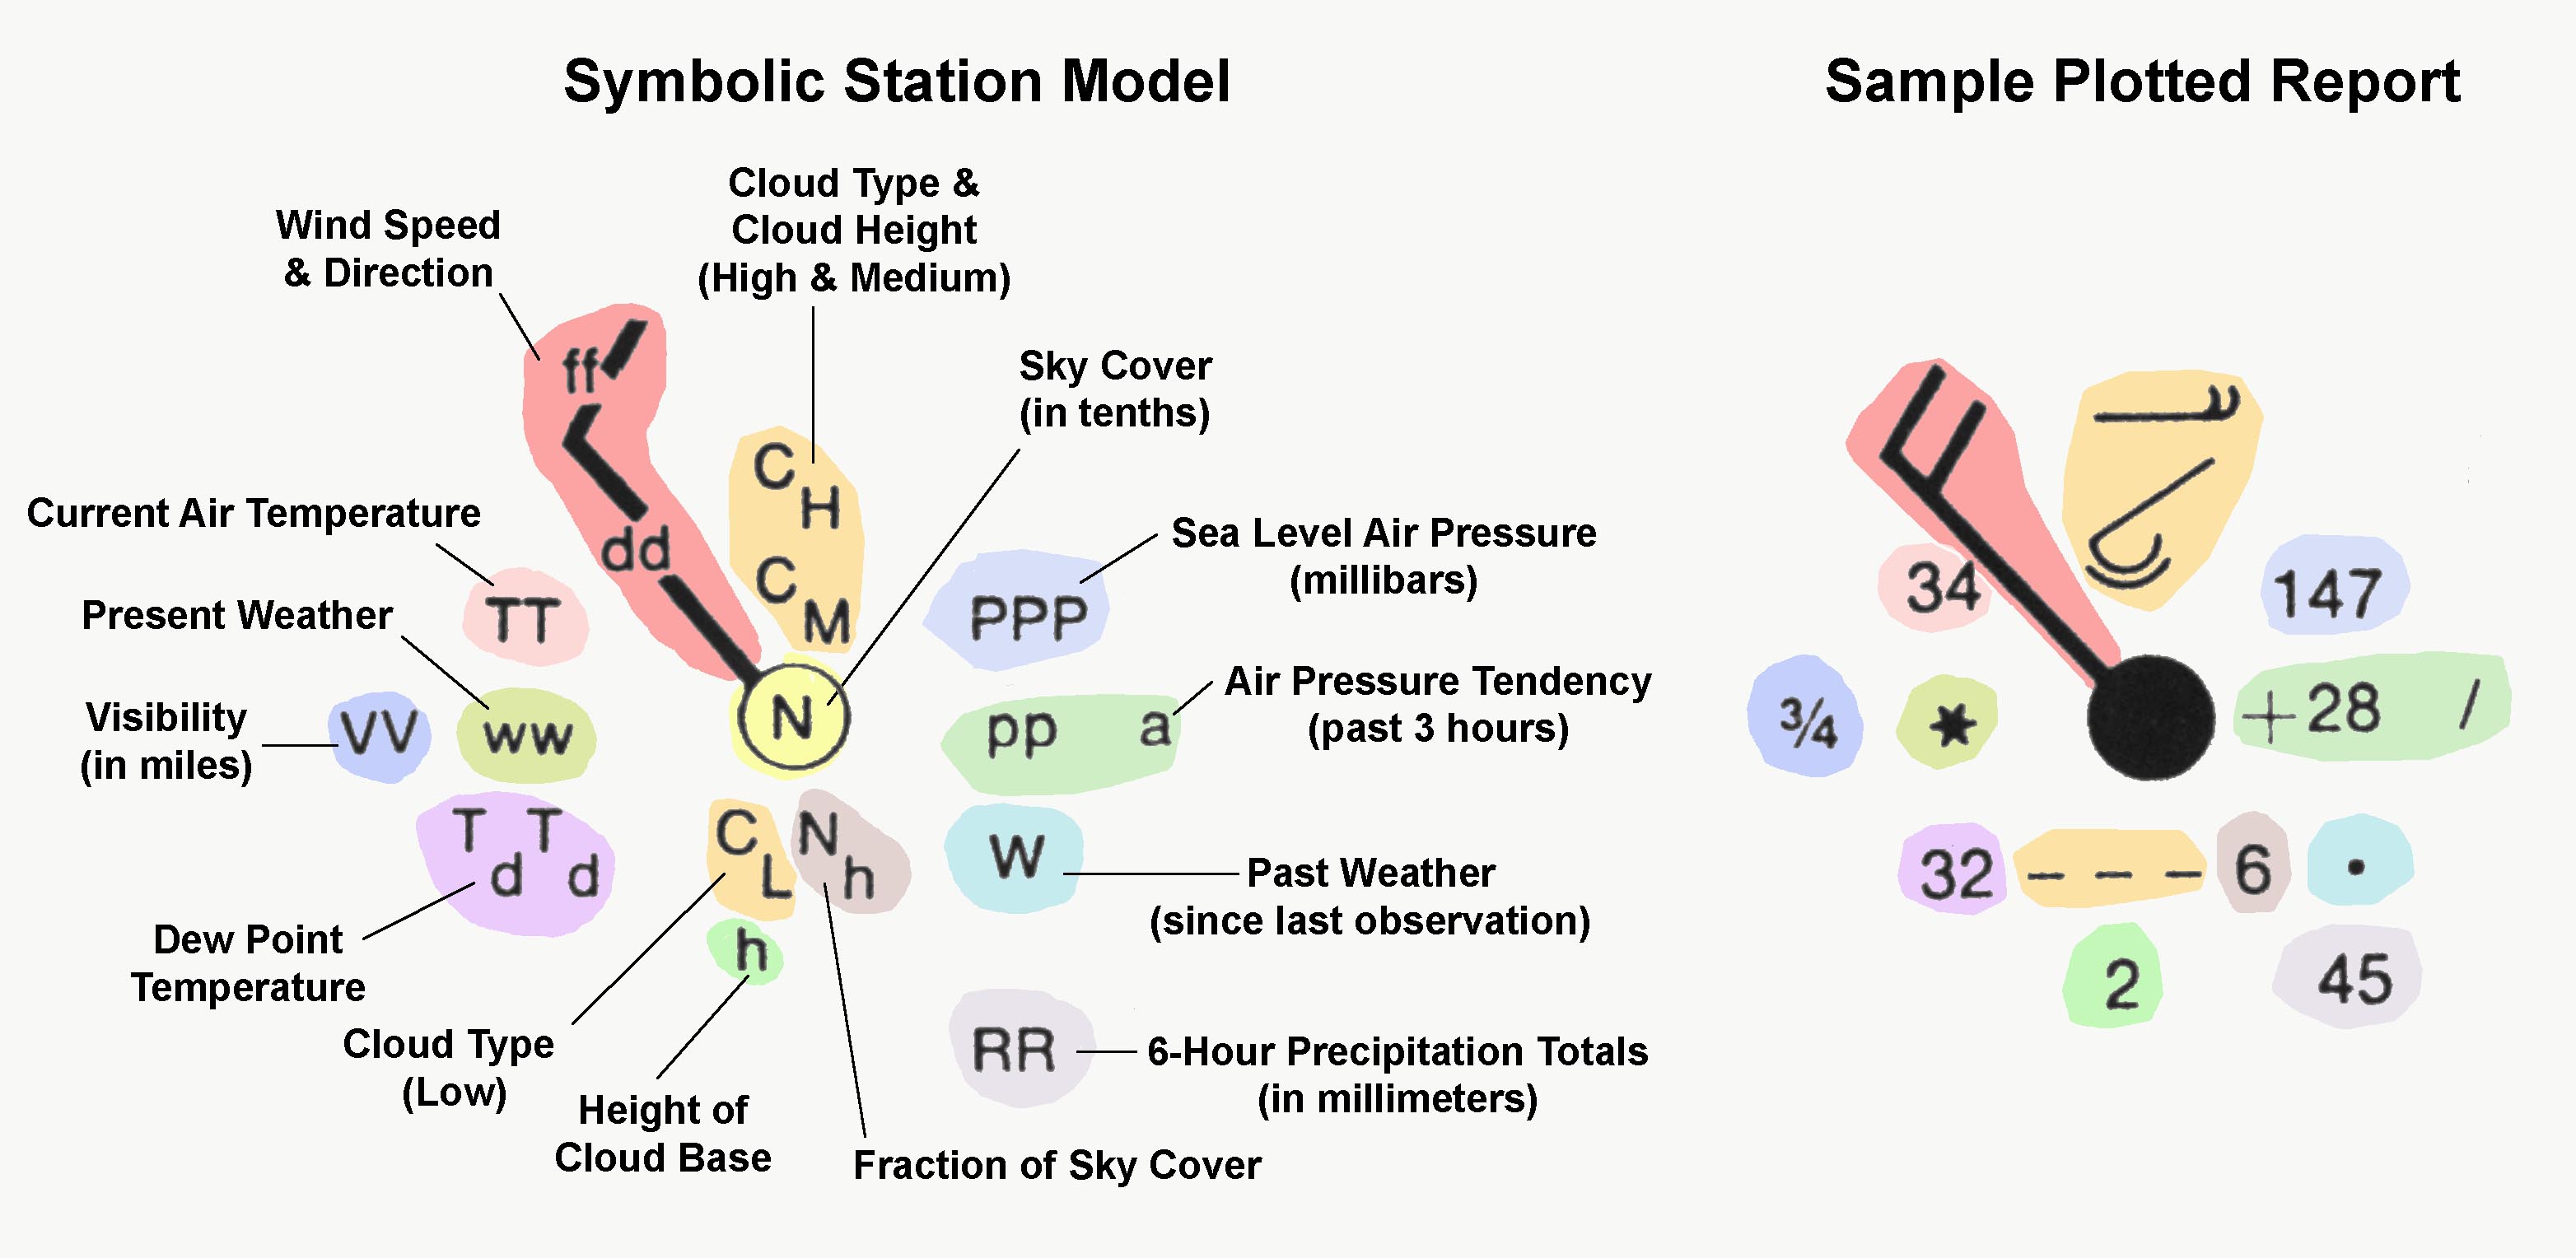
Surface Weather Map"The Surface Weather Map shows station data and the analysis for 7:00 a.m., EST. The weather reports displayed here are only a fraction of those on which the analyses are based. Occasional apparent discrepancies between the printed station data and the analyses result from the absence of station reports not included here because of a lack of space." NWS Daily Weather Map Explanation |
 Example of a Daily Weather Map (without weather station data) |
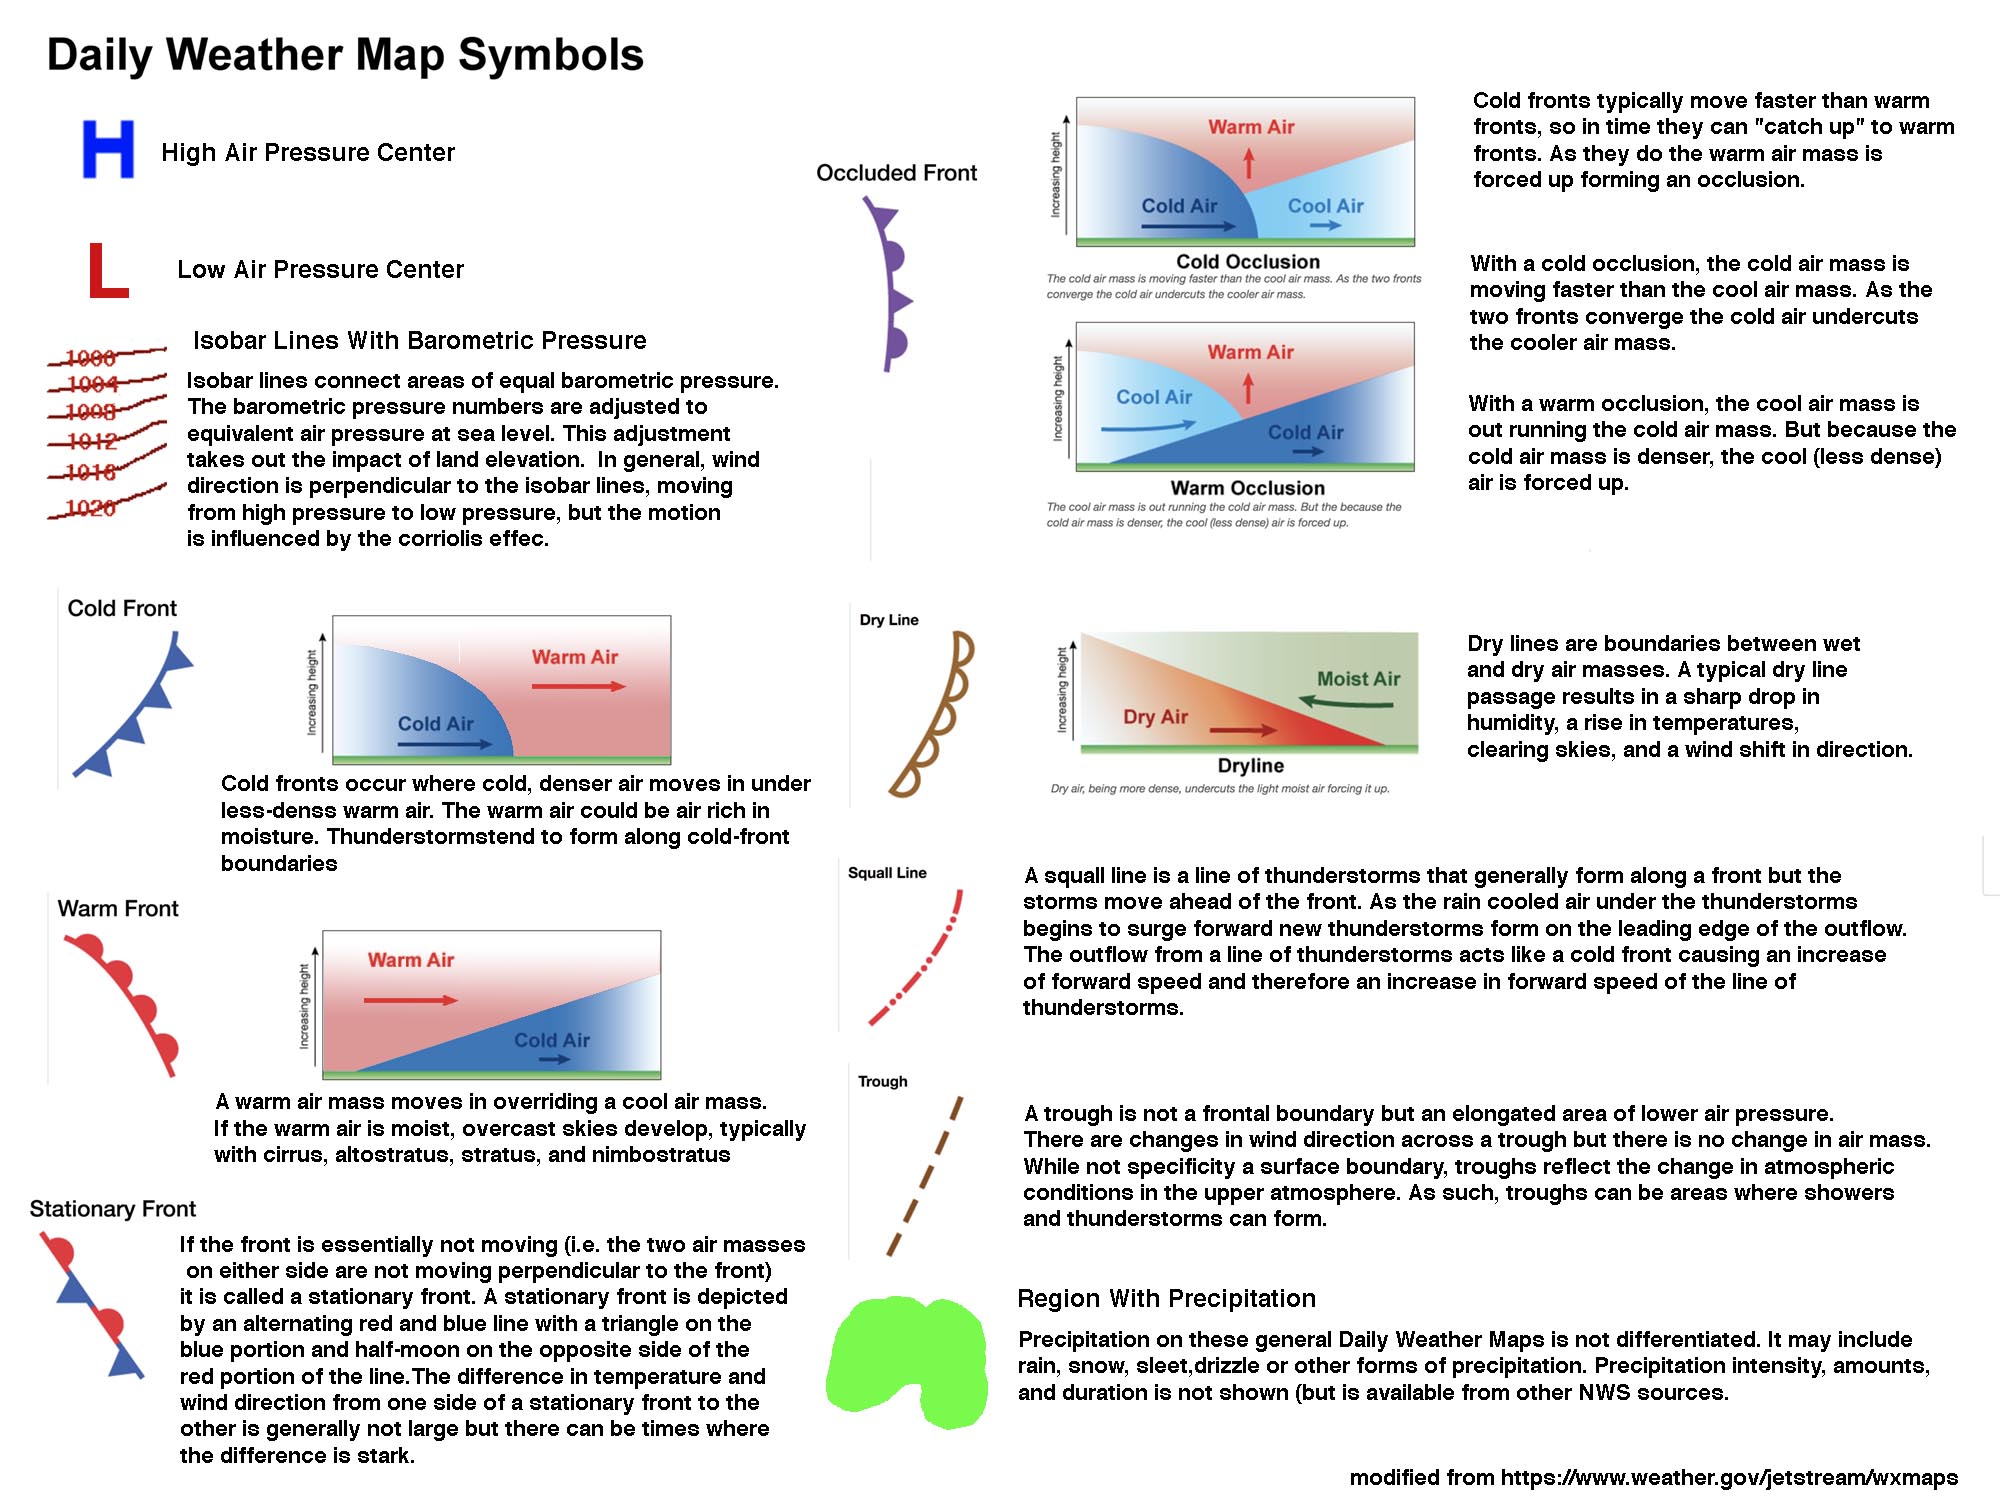 Daily Weather Map Symbols and explanations. Daily Weather Map Symbols and explanations. |
Daily Surface Weather Map
By clicking on the Daily Weather Map you get to see a weather map that includes weather station data. This is the weather information that is collected on the ground at designated locations by the National Weather Service. This data is integrated into weather models and and other observation data to create a detailed weather map for the country. |
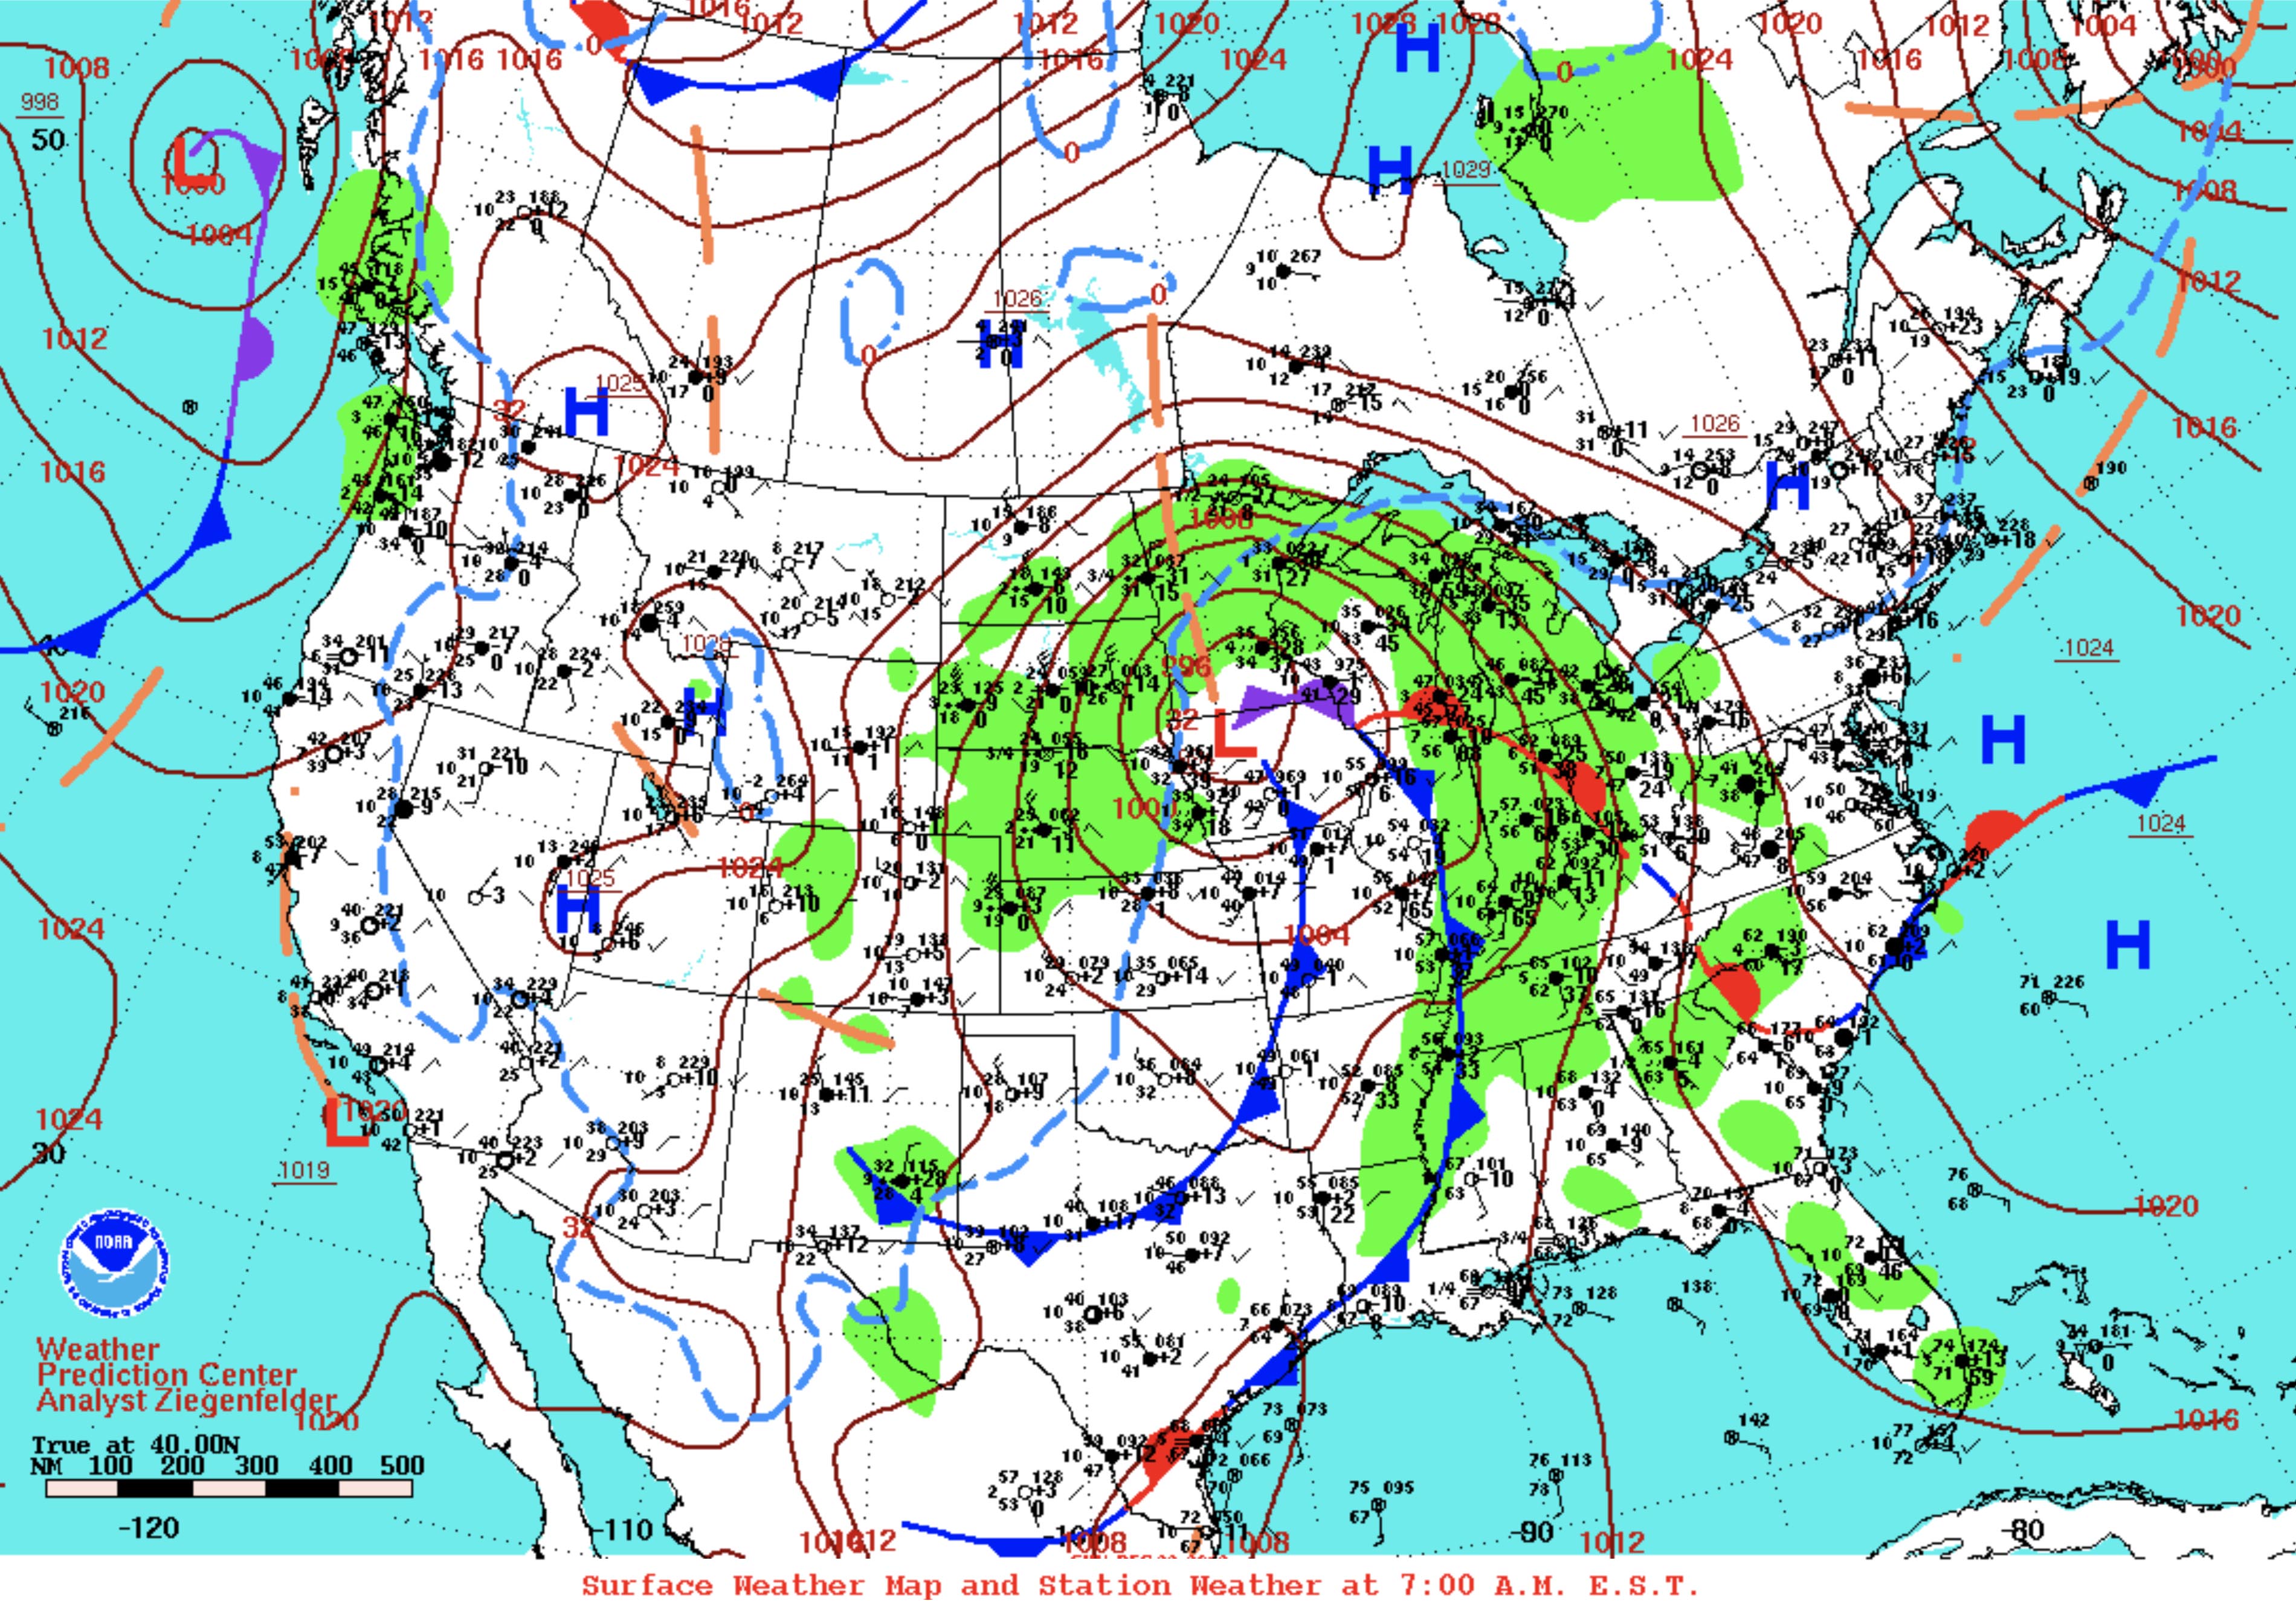 |
Weather Station Map Plot SymbolsSky CoverWind Speed and Direction Pressure Tendency (change in air pressure from 3 hr) Present Weather Temperature Dew Point Temperature Visibility (distance in miles) Sea Level Pressure (millibars reduced to sea level) Past Weather 6 Hour Precipitation (in millimeters) Cloud Type (predominant at high, medium, low levels) Cloud Fraction (percentage of sky covered by clouds) Cloud Base Height See a more detailed NWS website about: Station Plot Symbols |
 |
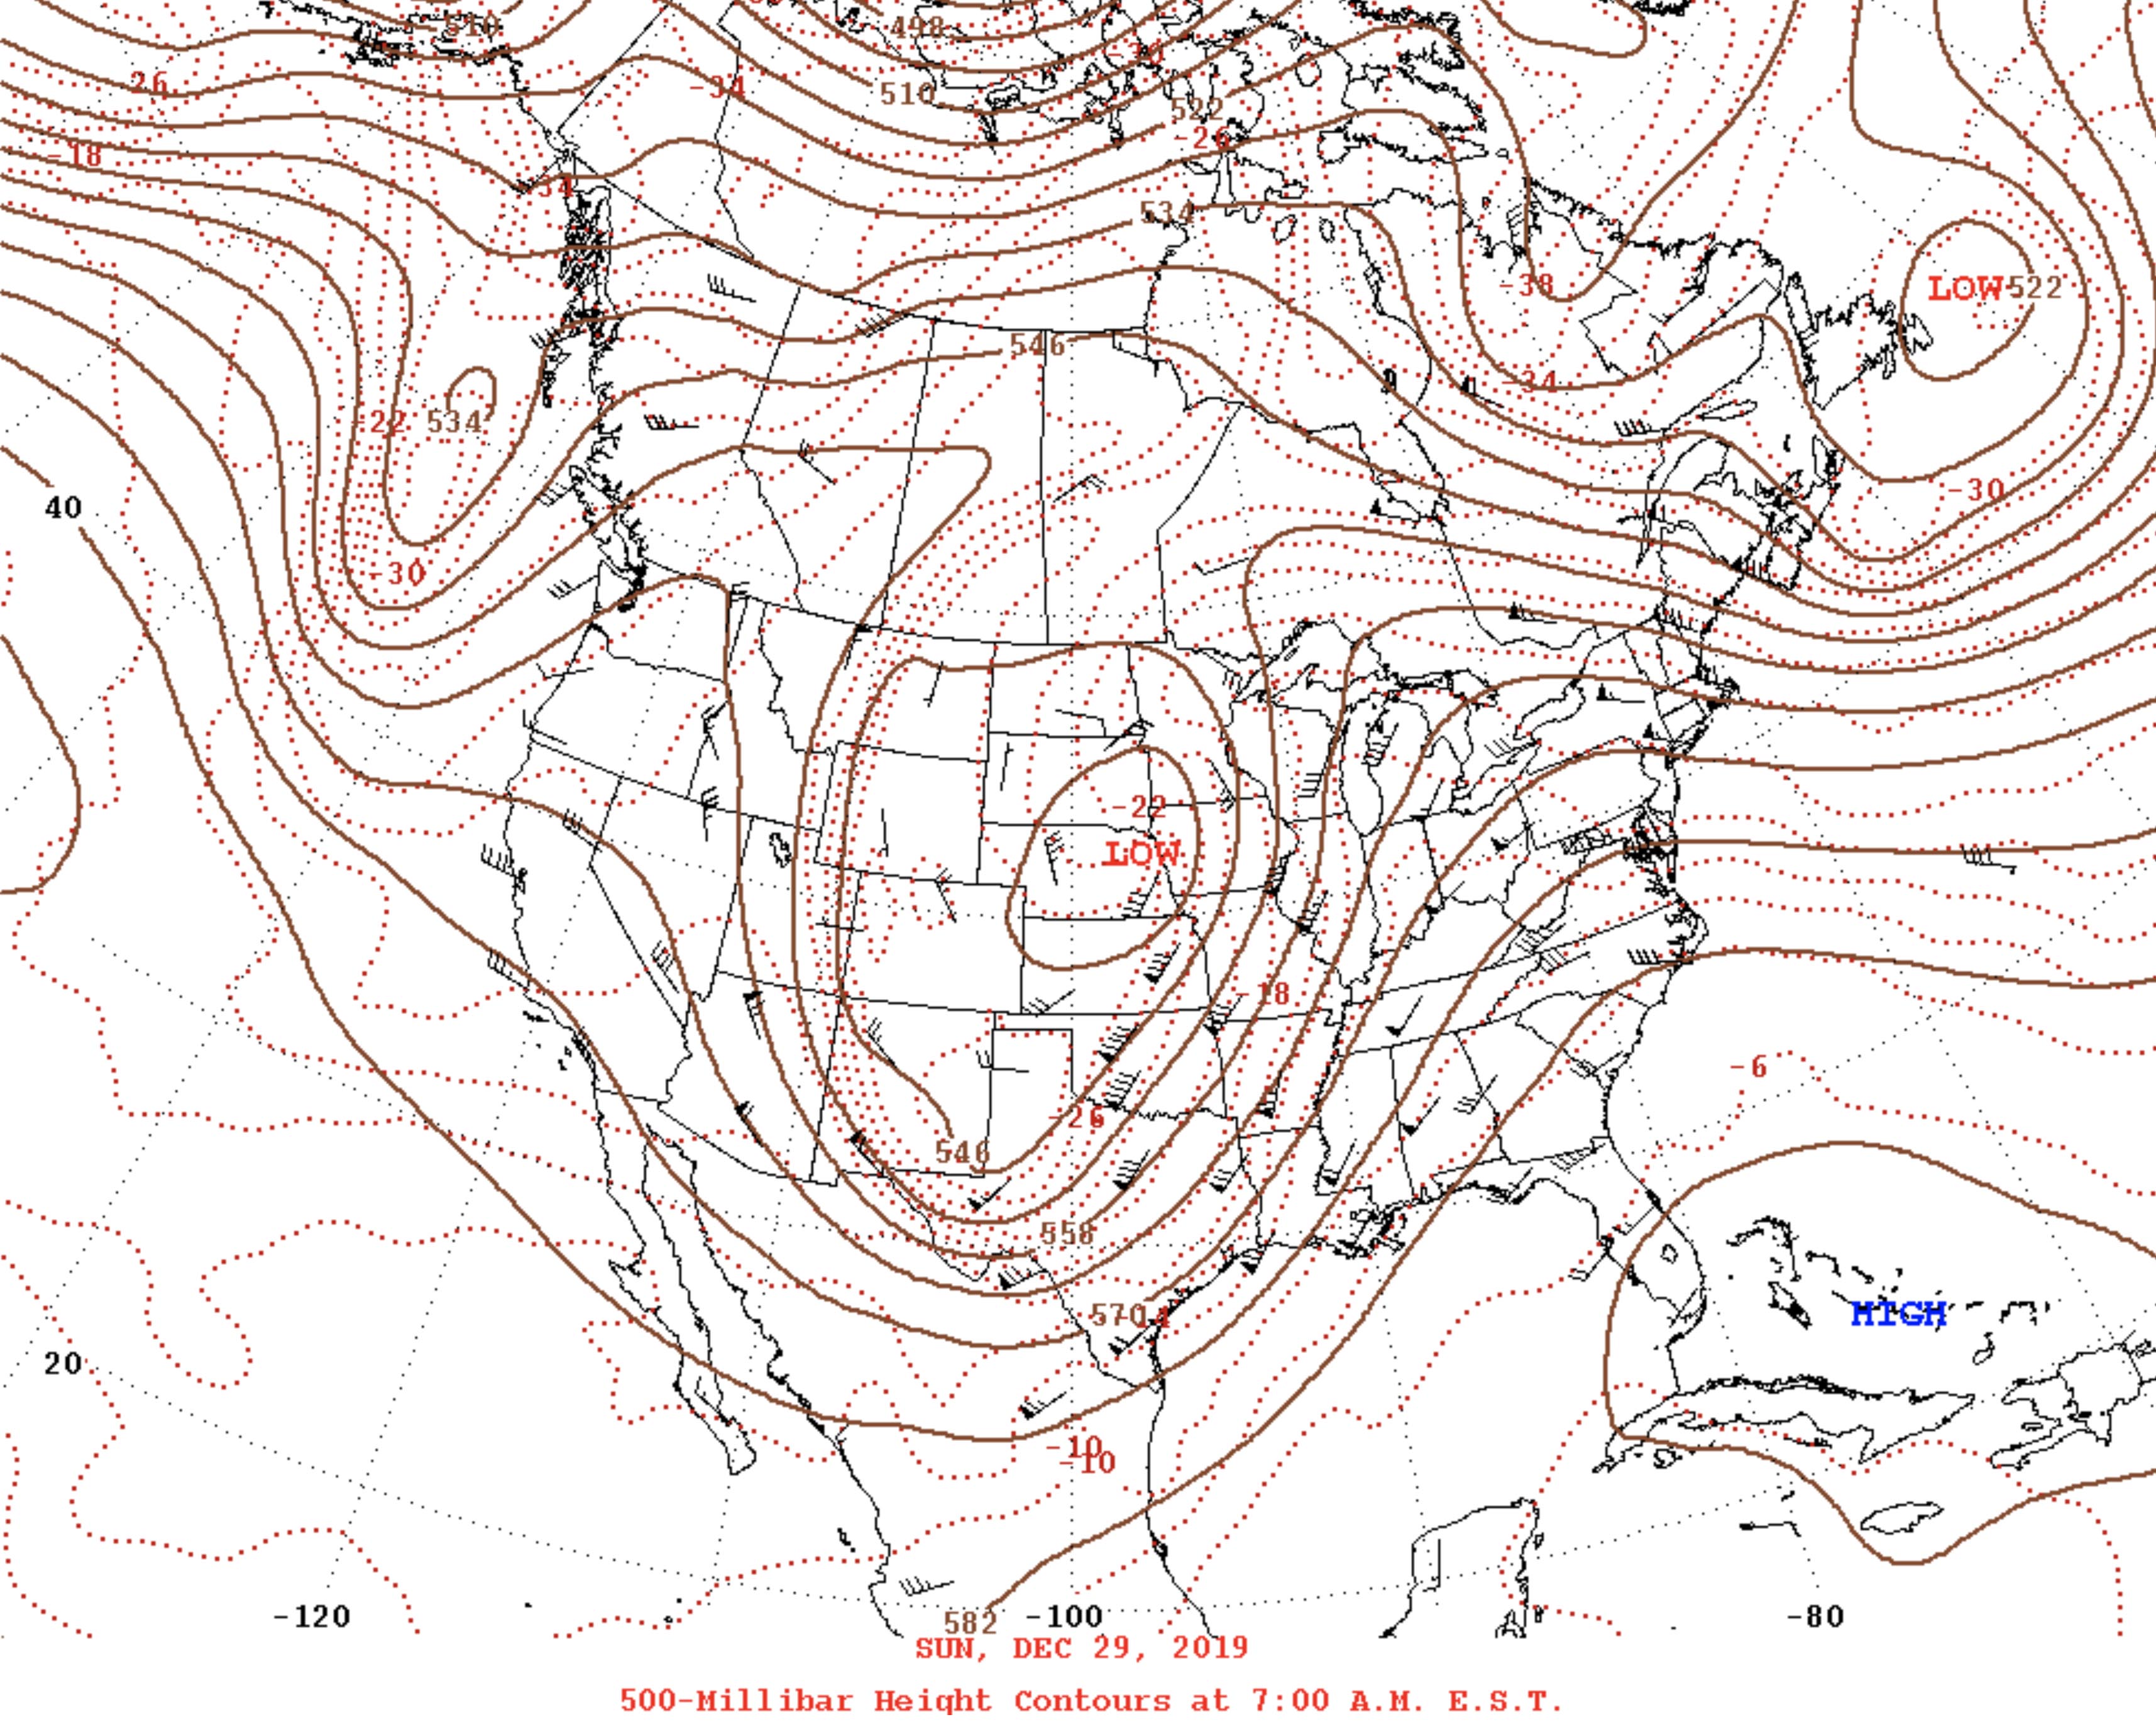
Daily 500-Millibar Height Contours ChartThe Daily Weather Maps display includes a map showing the The 500-Millibar Height Contours. When you click on the map it provides a more detailed view of the 500-Millibar Height Contours. The 500-Millibar height roughly shows the location where half of the mass of the atmosphere is above and below where the a point in the atmosphere. On average this elevation is roughly about 18,000 feet, but this level moves up and down with daily temperature changes and movement of air masses, etc. Click the 500-Millibar chart on the Daily Weather Maps to to see a larger version of the chart with temperature and winds data added. It is possible to click on "previous day" and "next day" links to see changes. |
 |
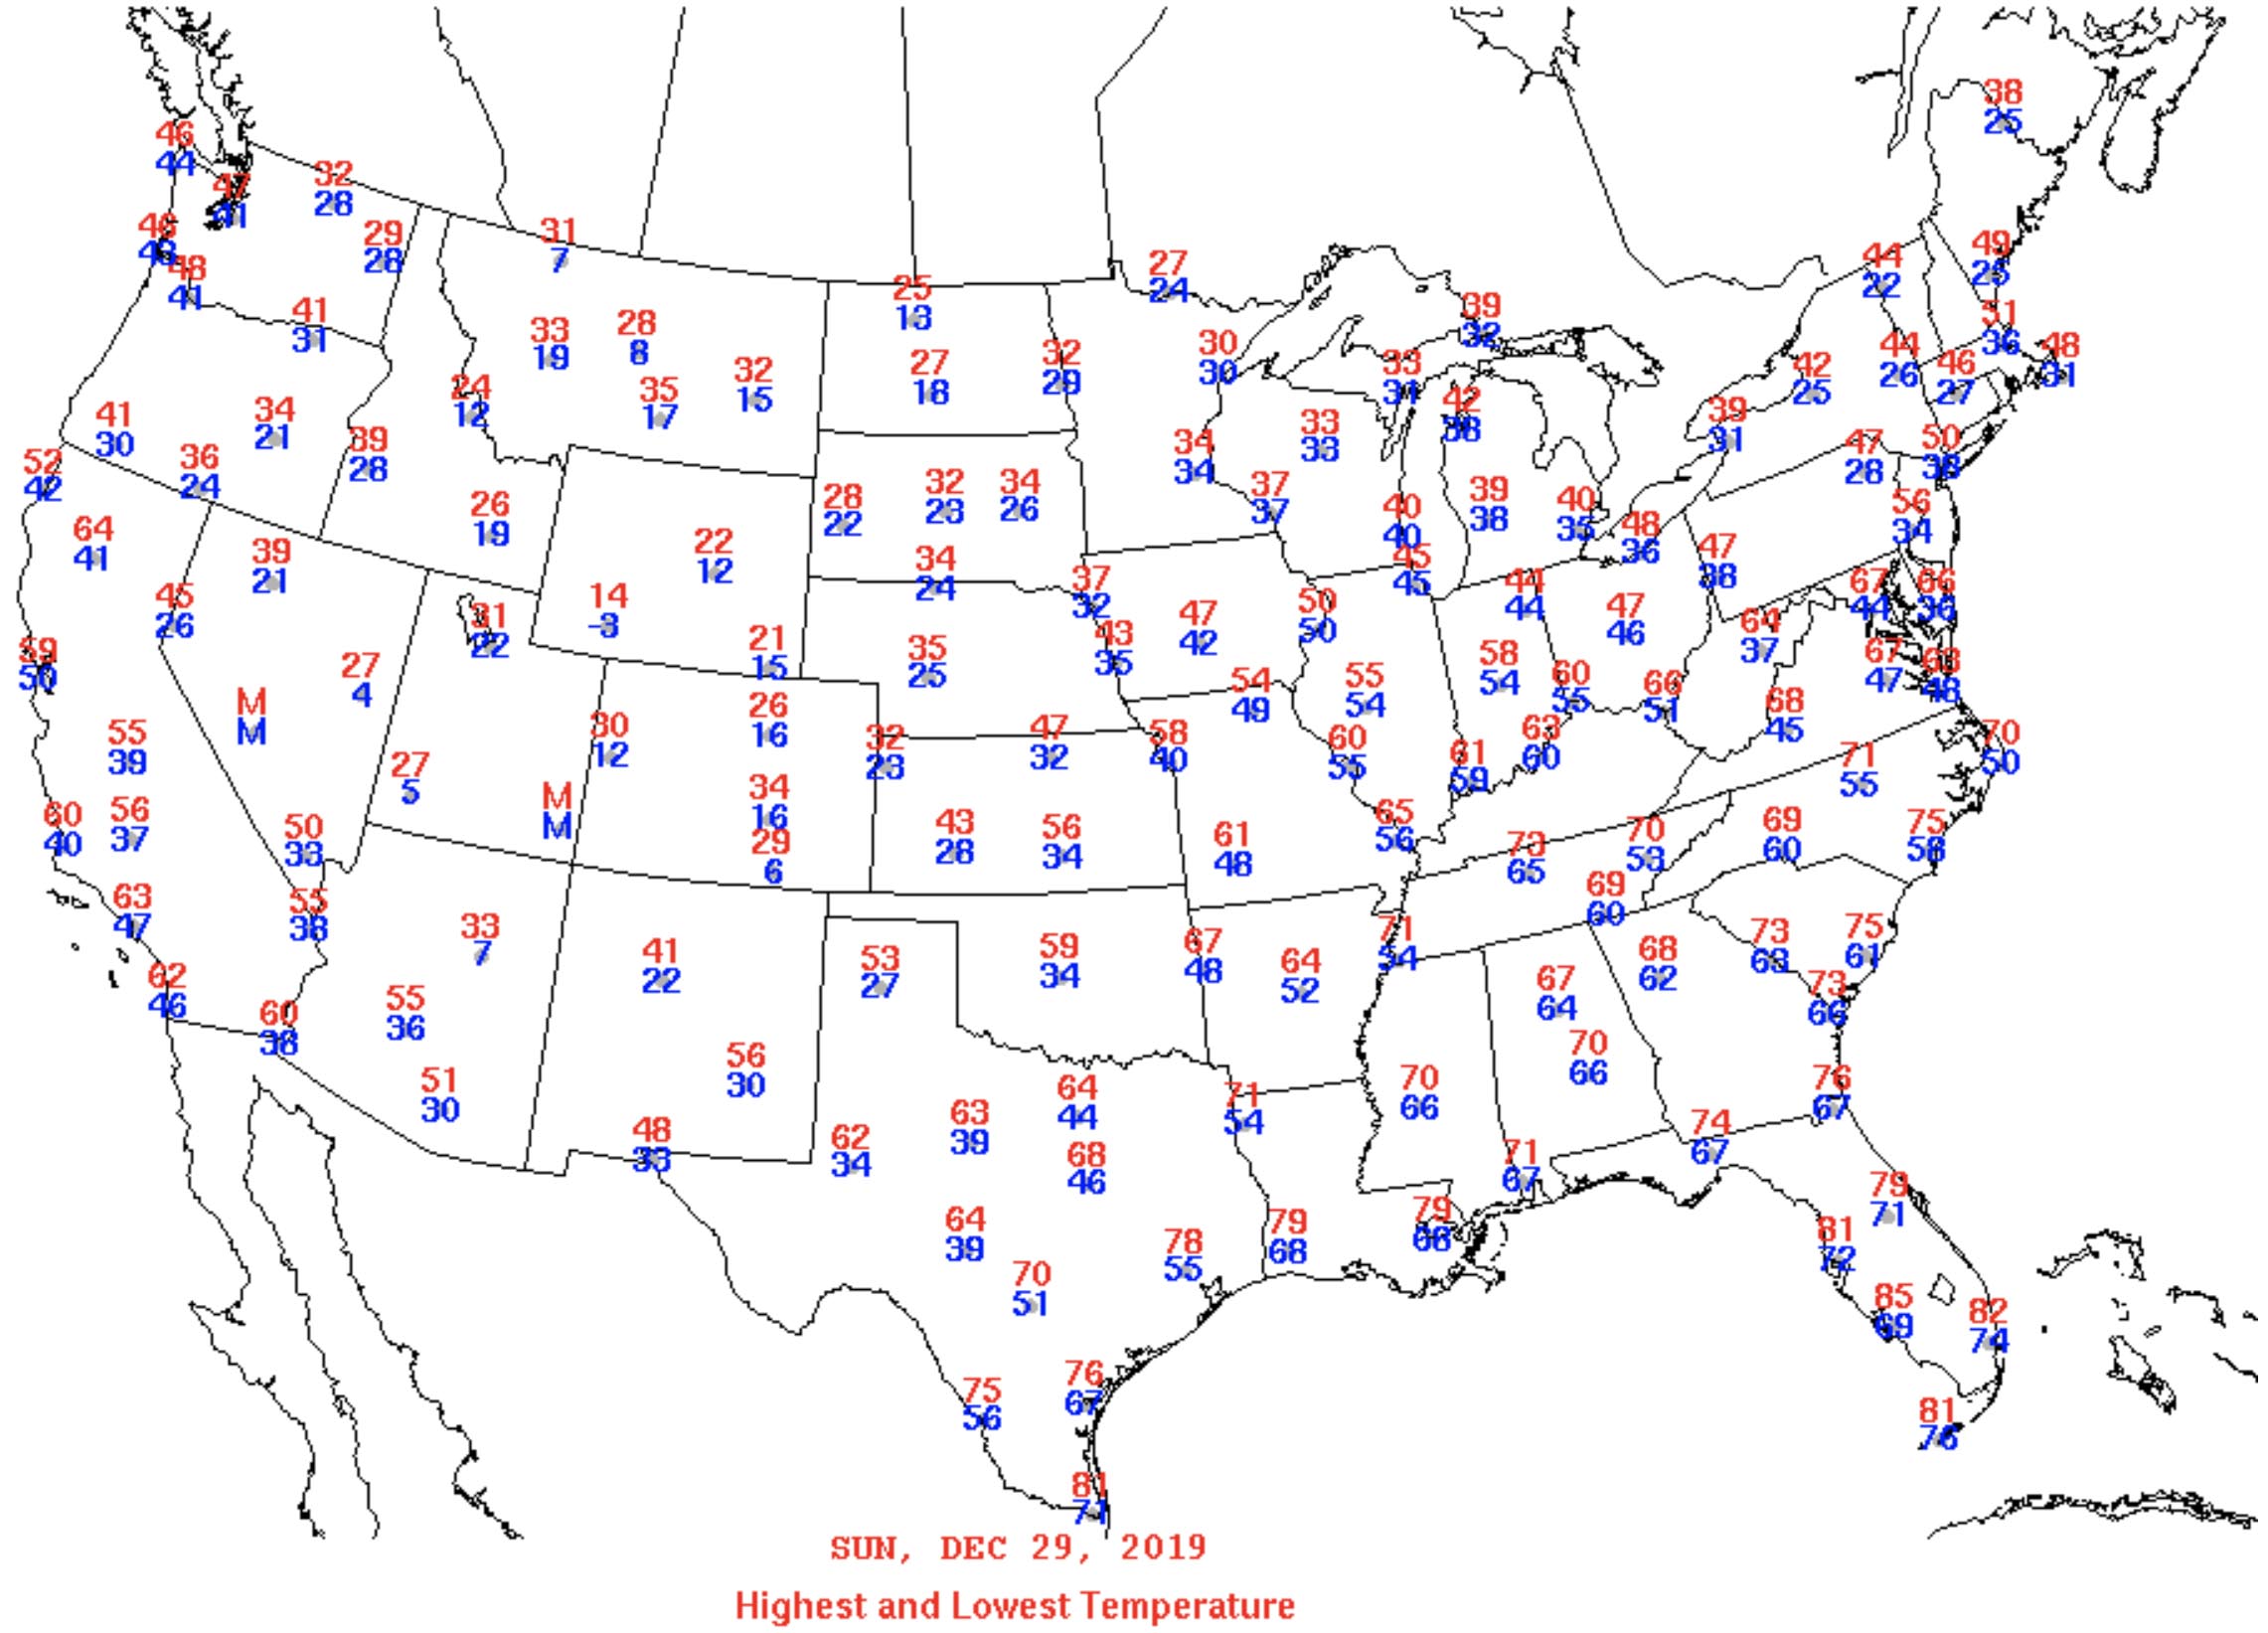
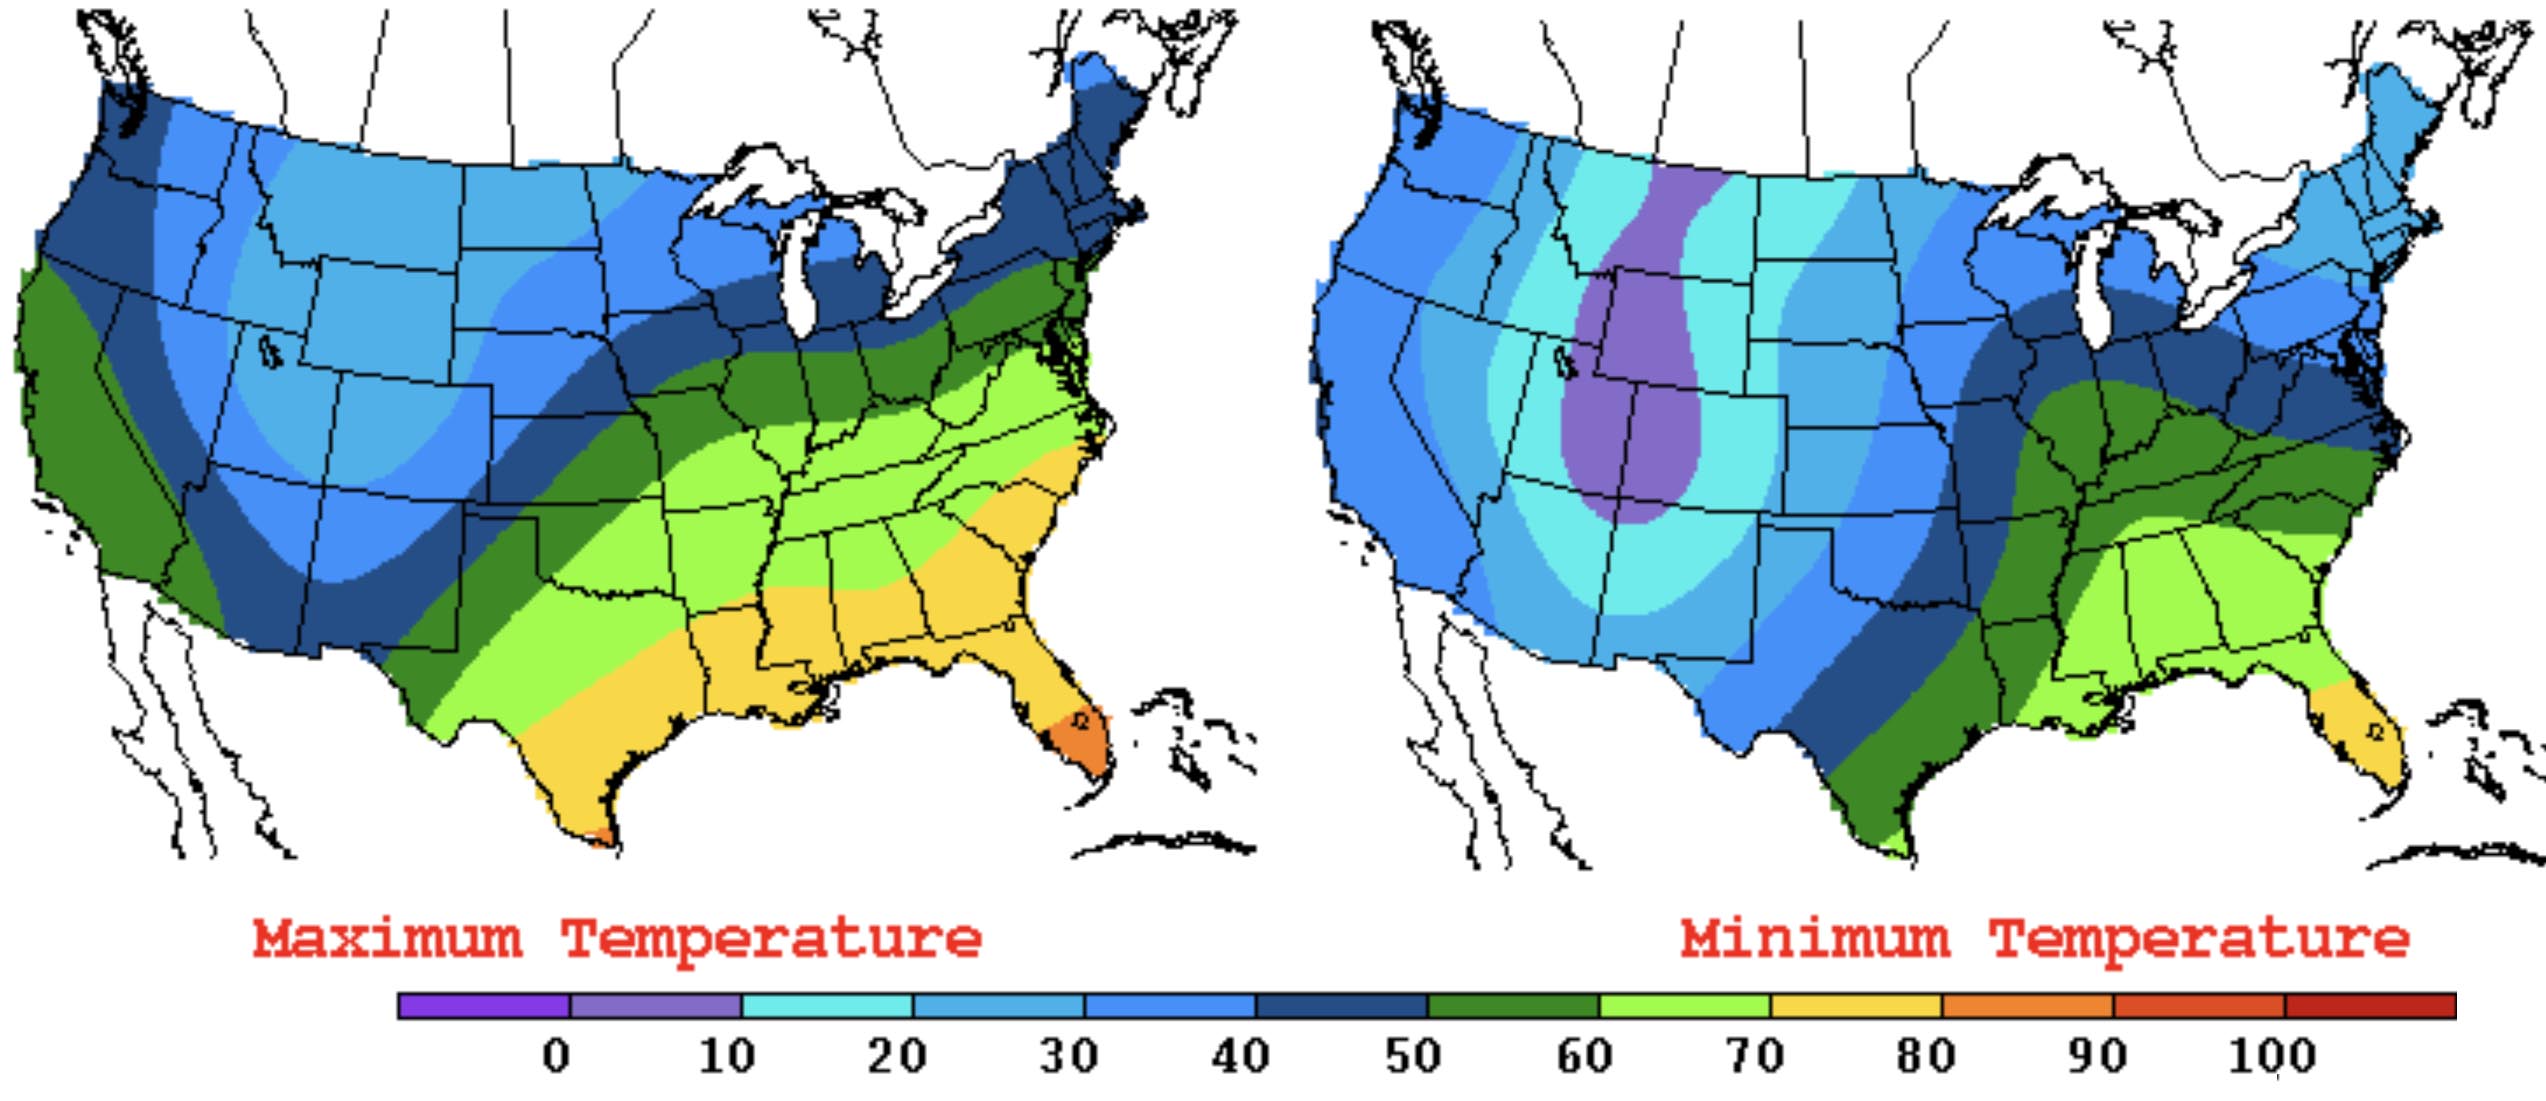
Daily Highest and Lowest Temperature Charts"The Highest and Lowest Temperature chart shows the maximum temperature for a period from 7:00 a.m. through 7:00 p.m. LST the previous day and the minimum temperature for the period from 7:00 p.m. LST the previous day through 8 a.m. The maximum temperature is plotted above the station location (in red) and the minimum temperature is plotted below (in blue)."Click either the Maximum or Minimum Temperature Map to see the actual Highest and Lowest Temperatures for selected weather station plot locations around the country. |
 |
Daily Highest and Lowest Temperature
The weather station data (show above) is used to compile the color temperature contour maps (in degrees Fahrenheit). |
 |
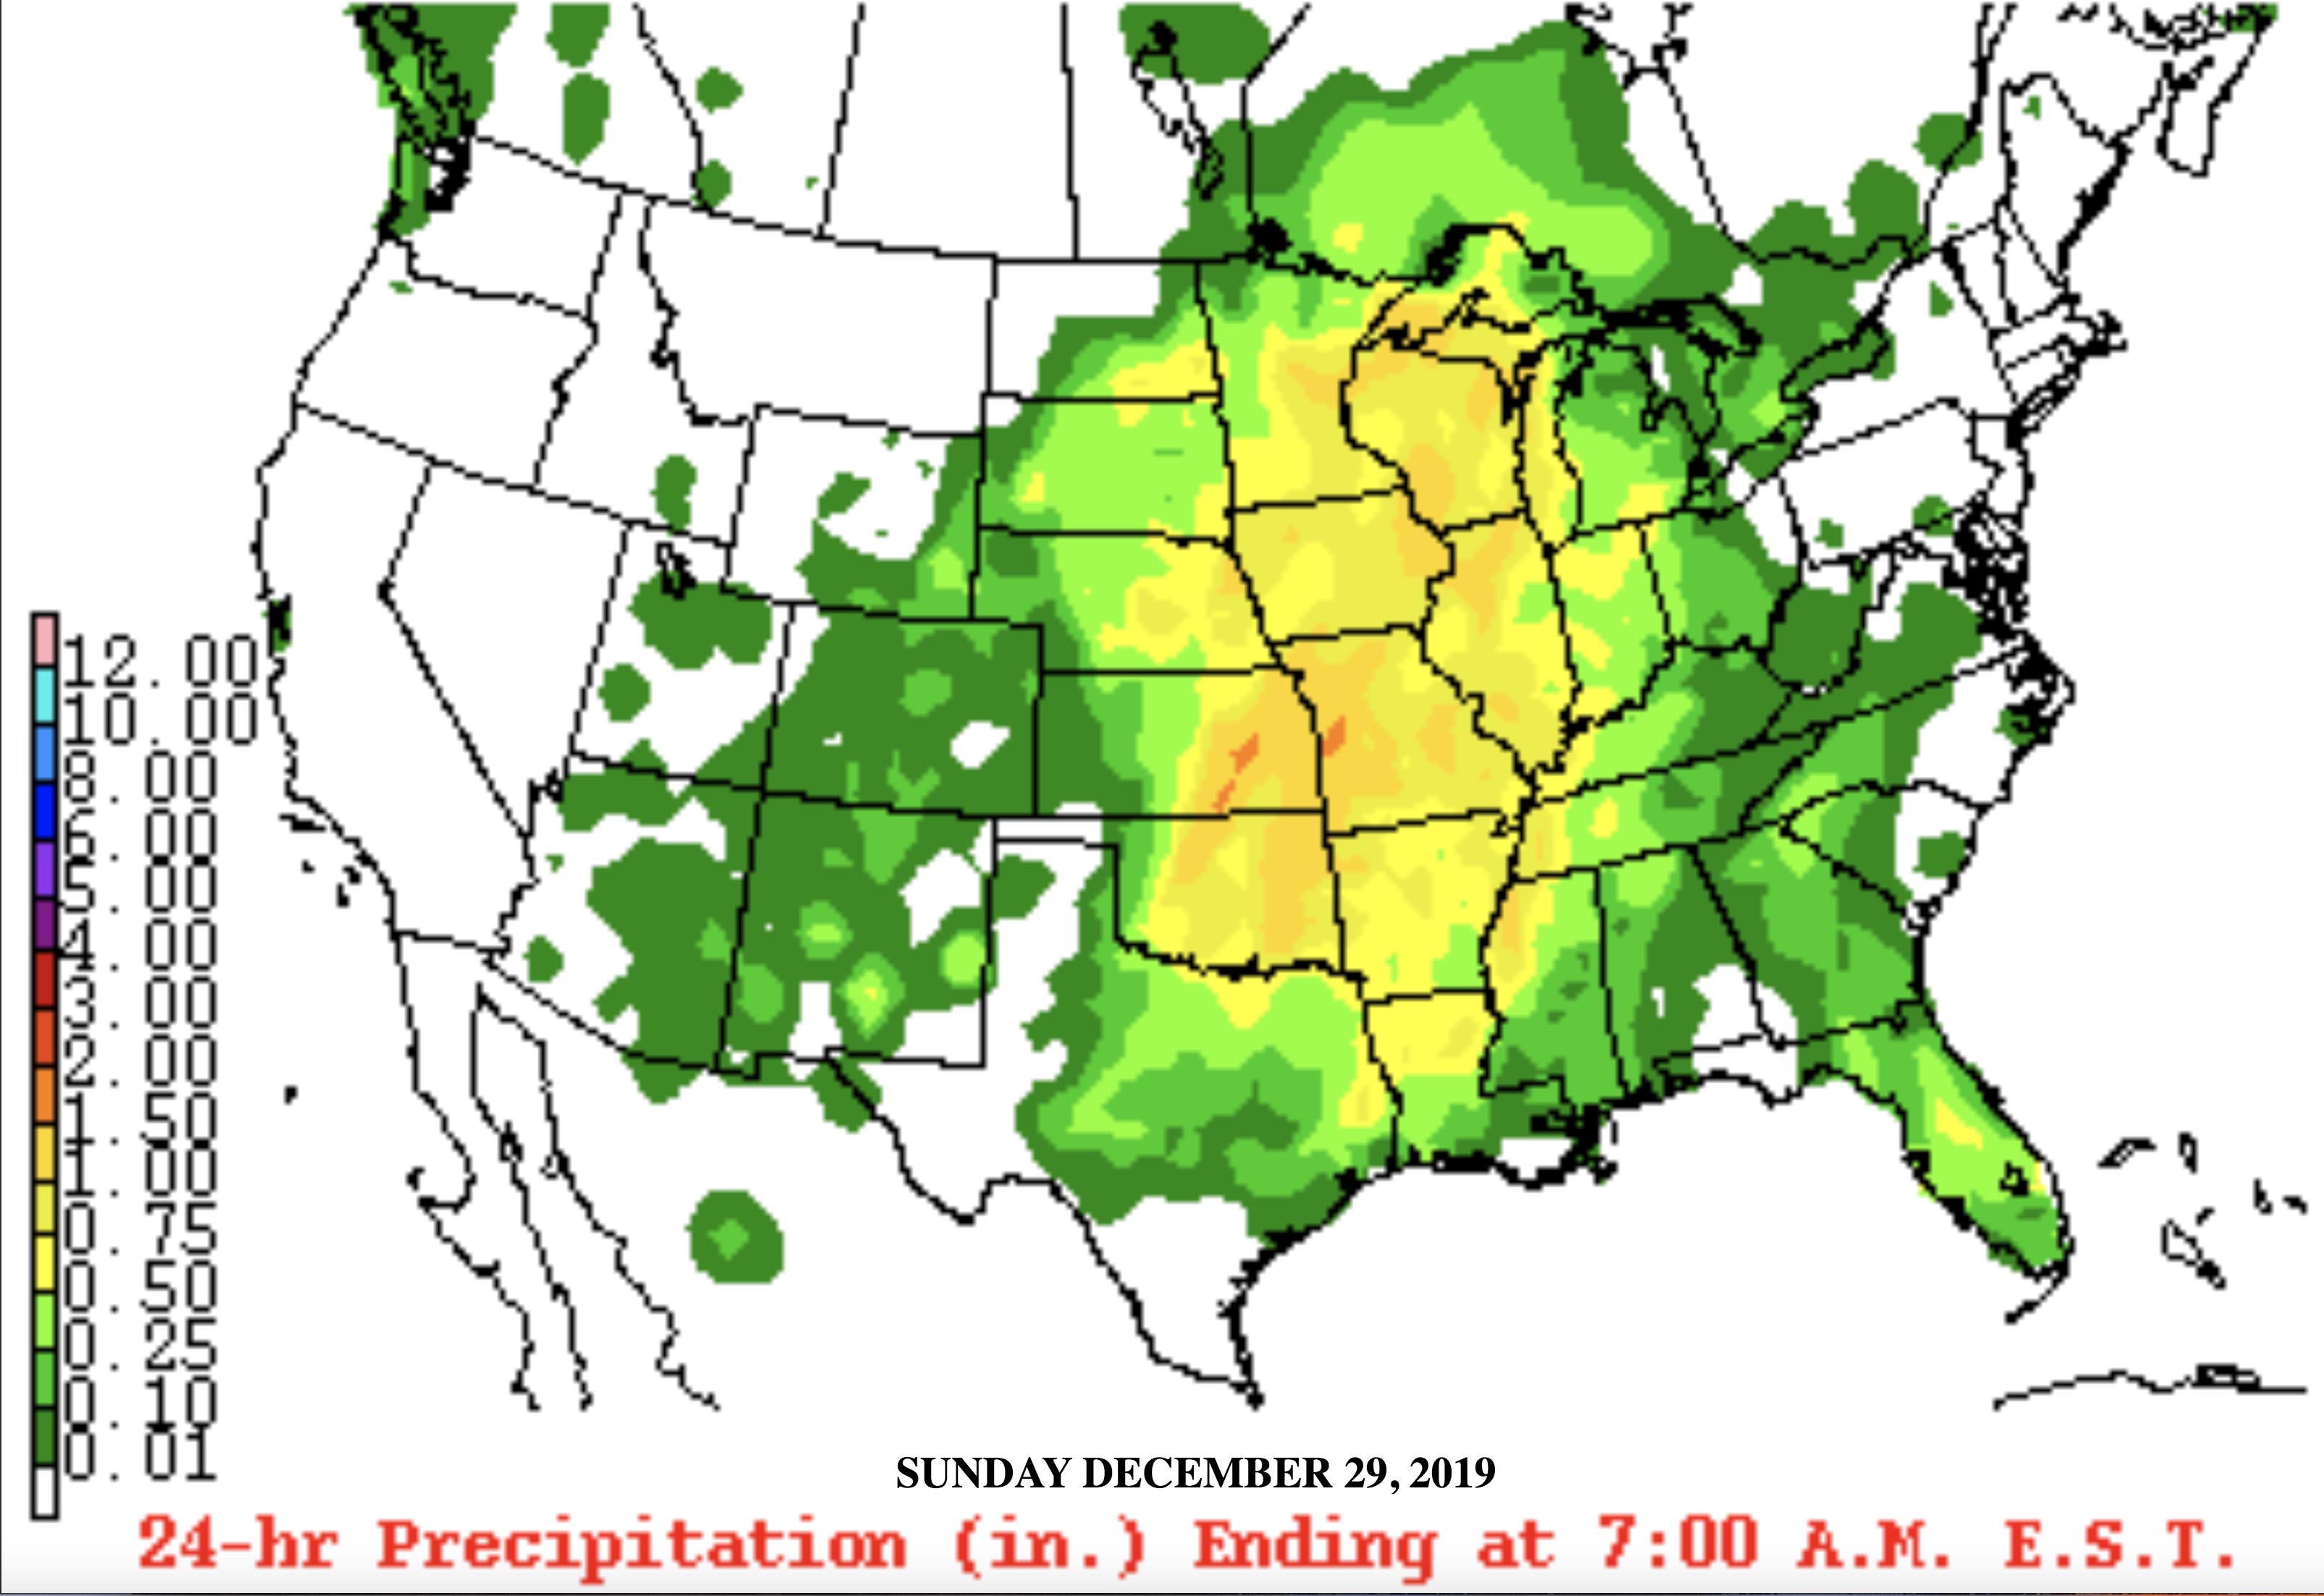
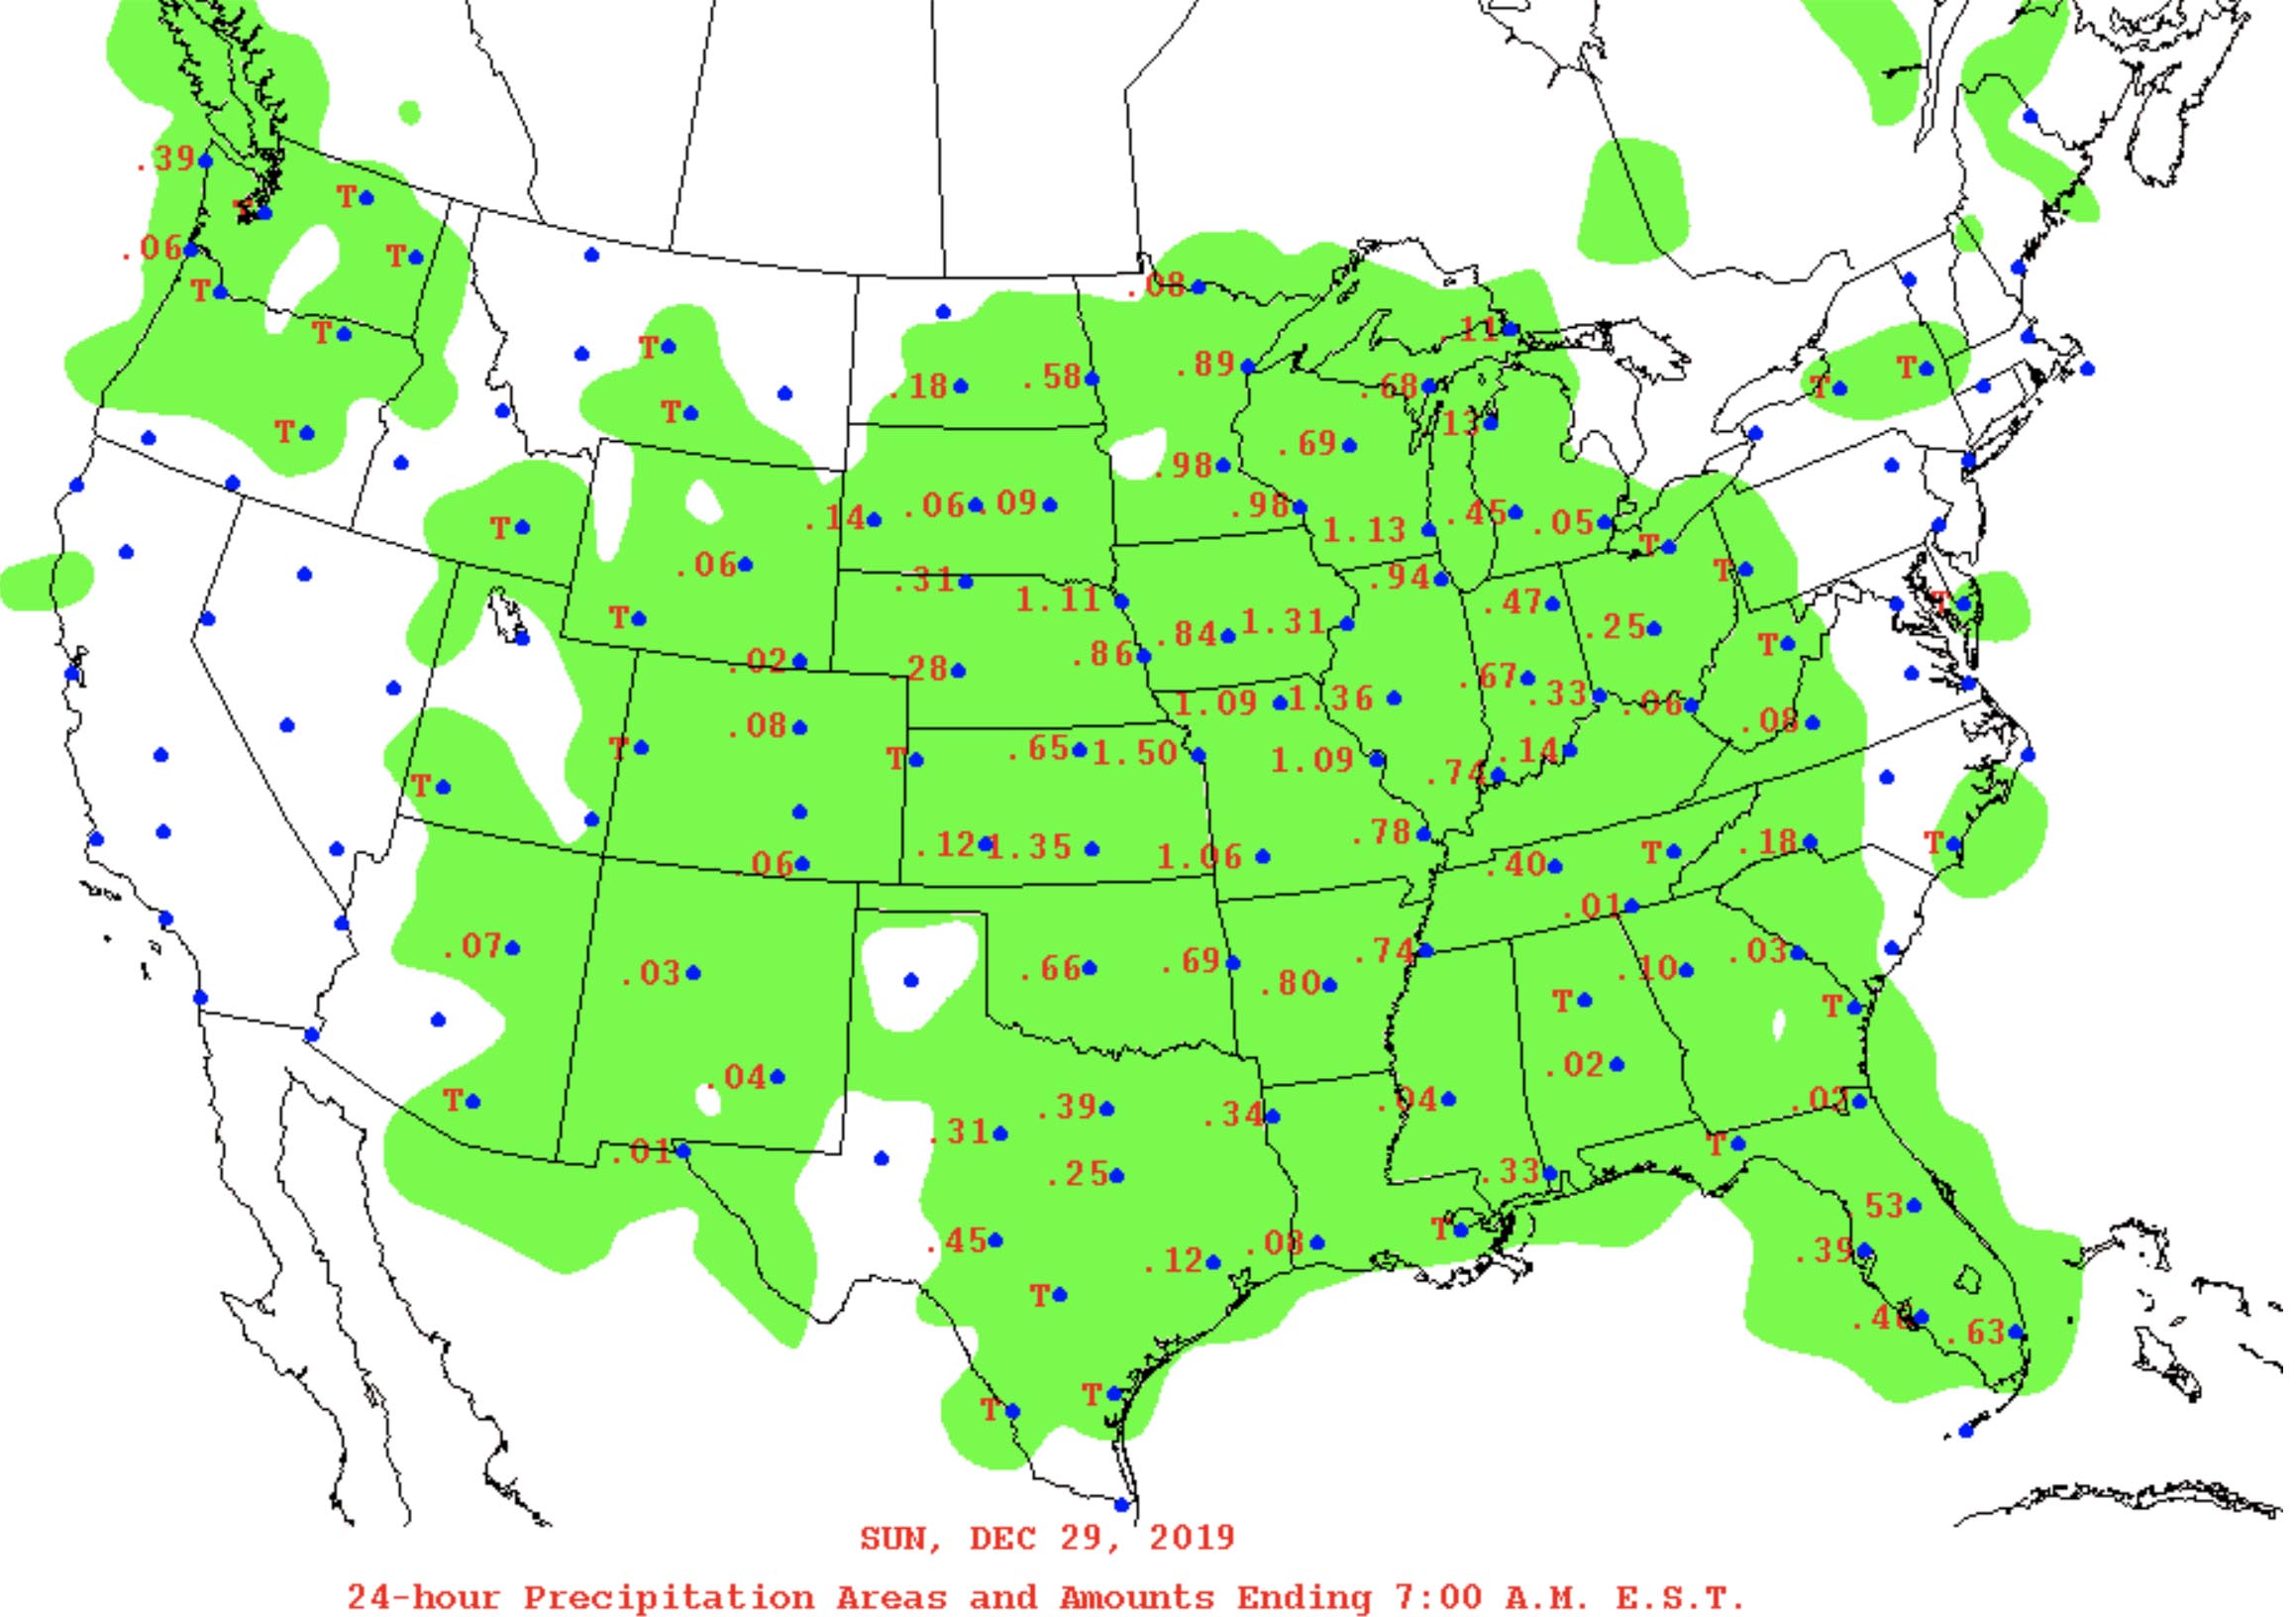
Daily Precipitation
"The Precipitation Areas and Amounts chart shows areas (shaded) that had precipitation during the 24 hours ending at 7:00 a.m., EST, with amounts to the nearest hundredth of an inch. "T" indicates a trace of precipitation." |
 |
 |
Current Weather Graphical Forecast Maps |
NWS National Maps & Graphical Forecast MapsThe NWS provides a variety of maps that show weather patterns and information on an national scale. These include:Graphical Forecasts provide useful information about: ● Short Range Forecasts of 12-, 24-, 36-, and 48-hour intervals ● Medium Range Forecasts (3-6 day forecast) ● Precipitation Forecast Maps (chance or likelihood), amounts, and daily totals (1-3 day) ● National Temperature Map ● Wind Speed and Direction Map ● Surface Analysis (highs, lows, fronts, troughs, squall lines, dry lines for North America) ● Predominant Weather (precipitating and non-precipitating) ● Sky Cover Map (amount of opaque clouds covering the sky) ● Active Alerts (Weather Related Hazards) |
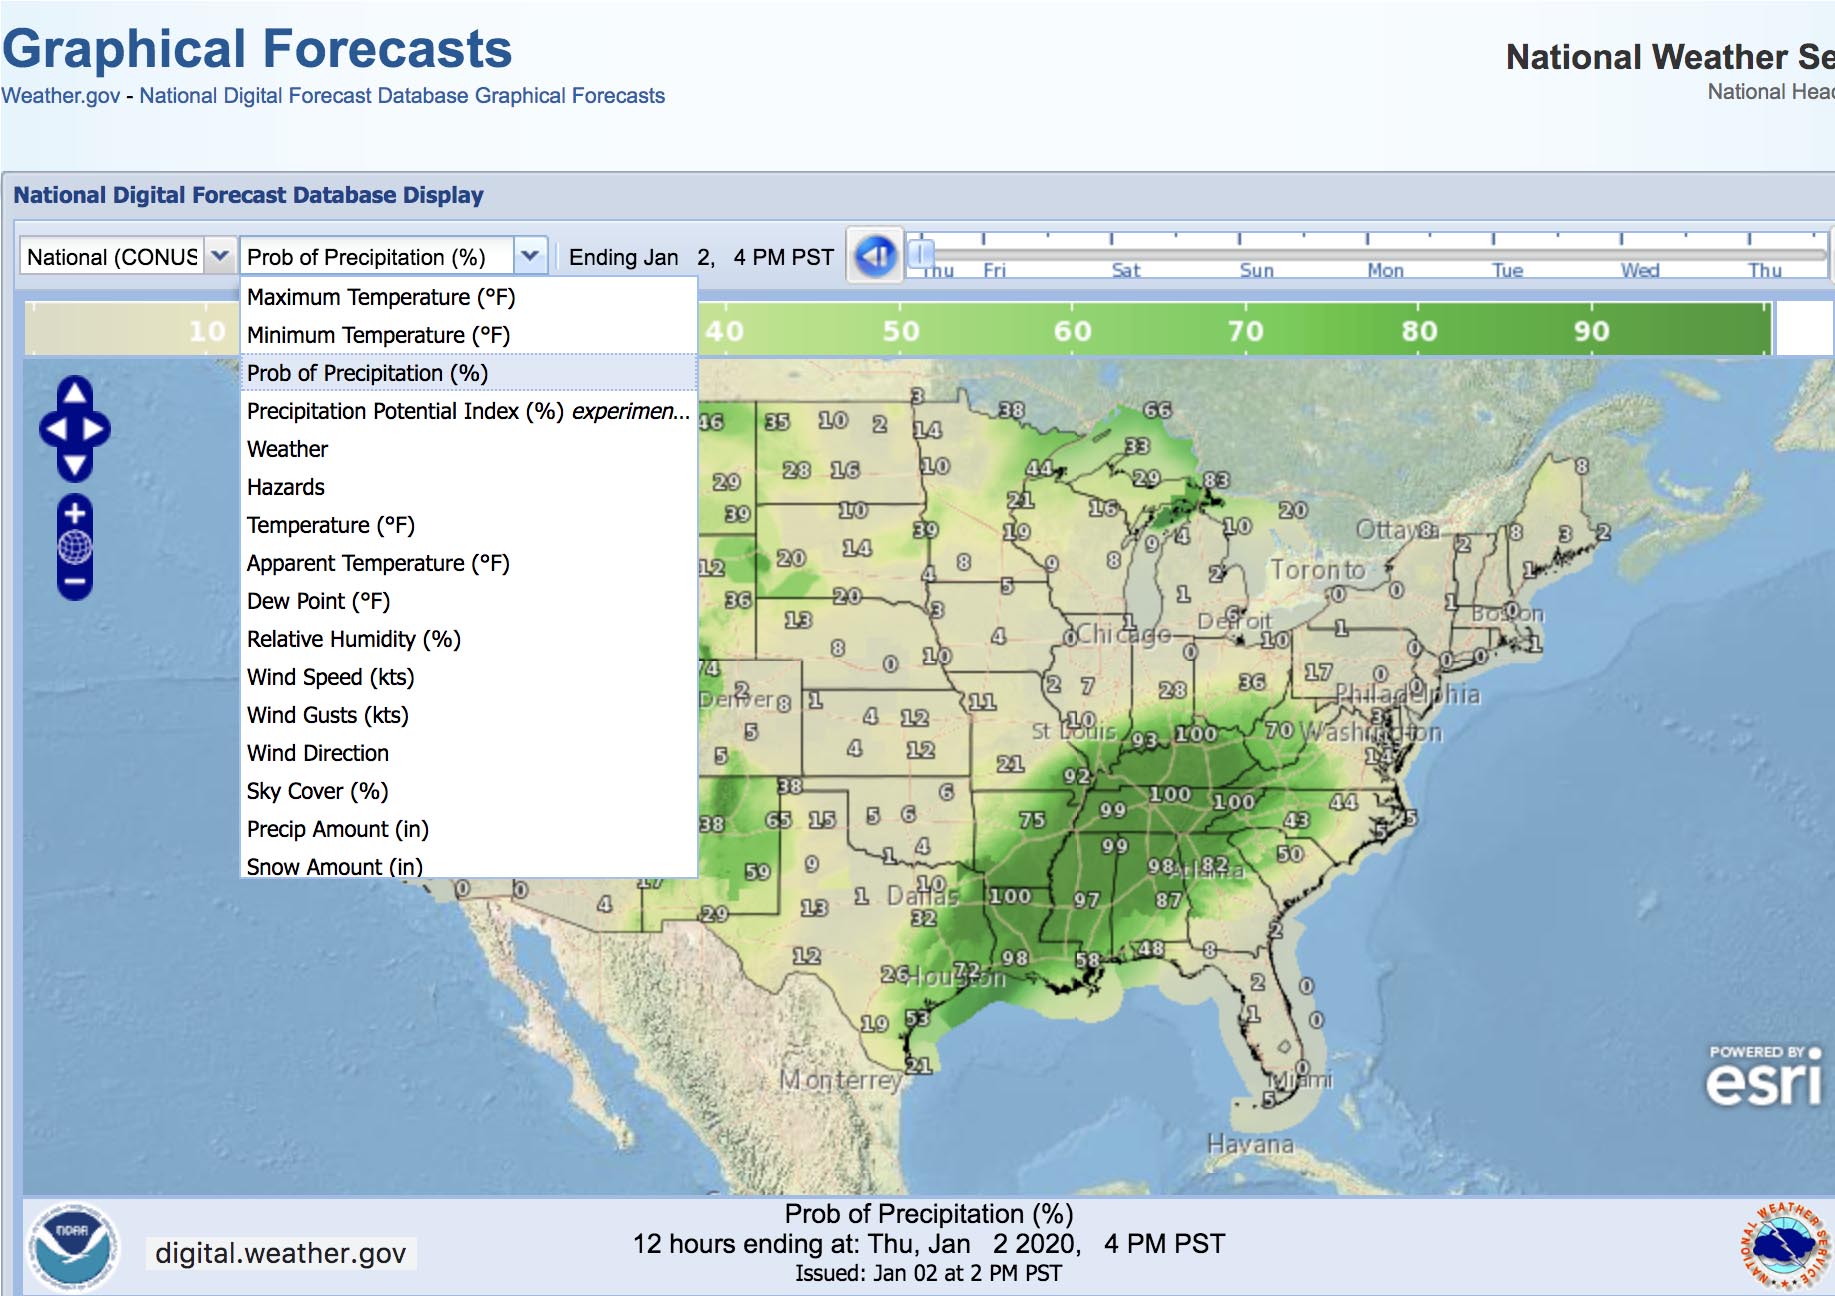 Graphical Forecasts are available on the National Digital Forecast Database Display. Nearly 2 dozen layers are available to access from a web-based geographic information system: digital.weather.gov Graphical Forecasts are available on the National Digital Forecast Database Display. Nearly 2 dozen layers are available to access from a web-based geographic information system: digital.weather.gov |
| Below is a list of Graphical Forecasts Maps with looping animations for the continental United States. Switch between the Forecast Elements with the pull-down menu. Temperature (every 6 hours for 6 days) — Maximum and Minimum (each day) Probable Precipitation (%) (twice each day for 6 days) Amount of Precipitation (every 3 hours for 3 days) Weather (every 3 hours for 6 days) Weather Hazards (every 3 hours for 6 days) Dewpoint Temperature (every 3 hours for 6 days) Relative Humidity (every 3 hours for 6 days) Wind Speed and Directions (every 3 hours for 6 days) Wind Gusts (every 3 hours for 6 days) Sky Cover (every 3 hours for 6 days) Ice Accumulation (twice a day for 3 days) Wave Height (5 days, twice a day) |
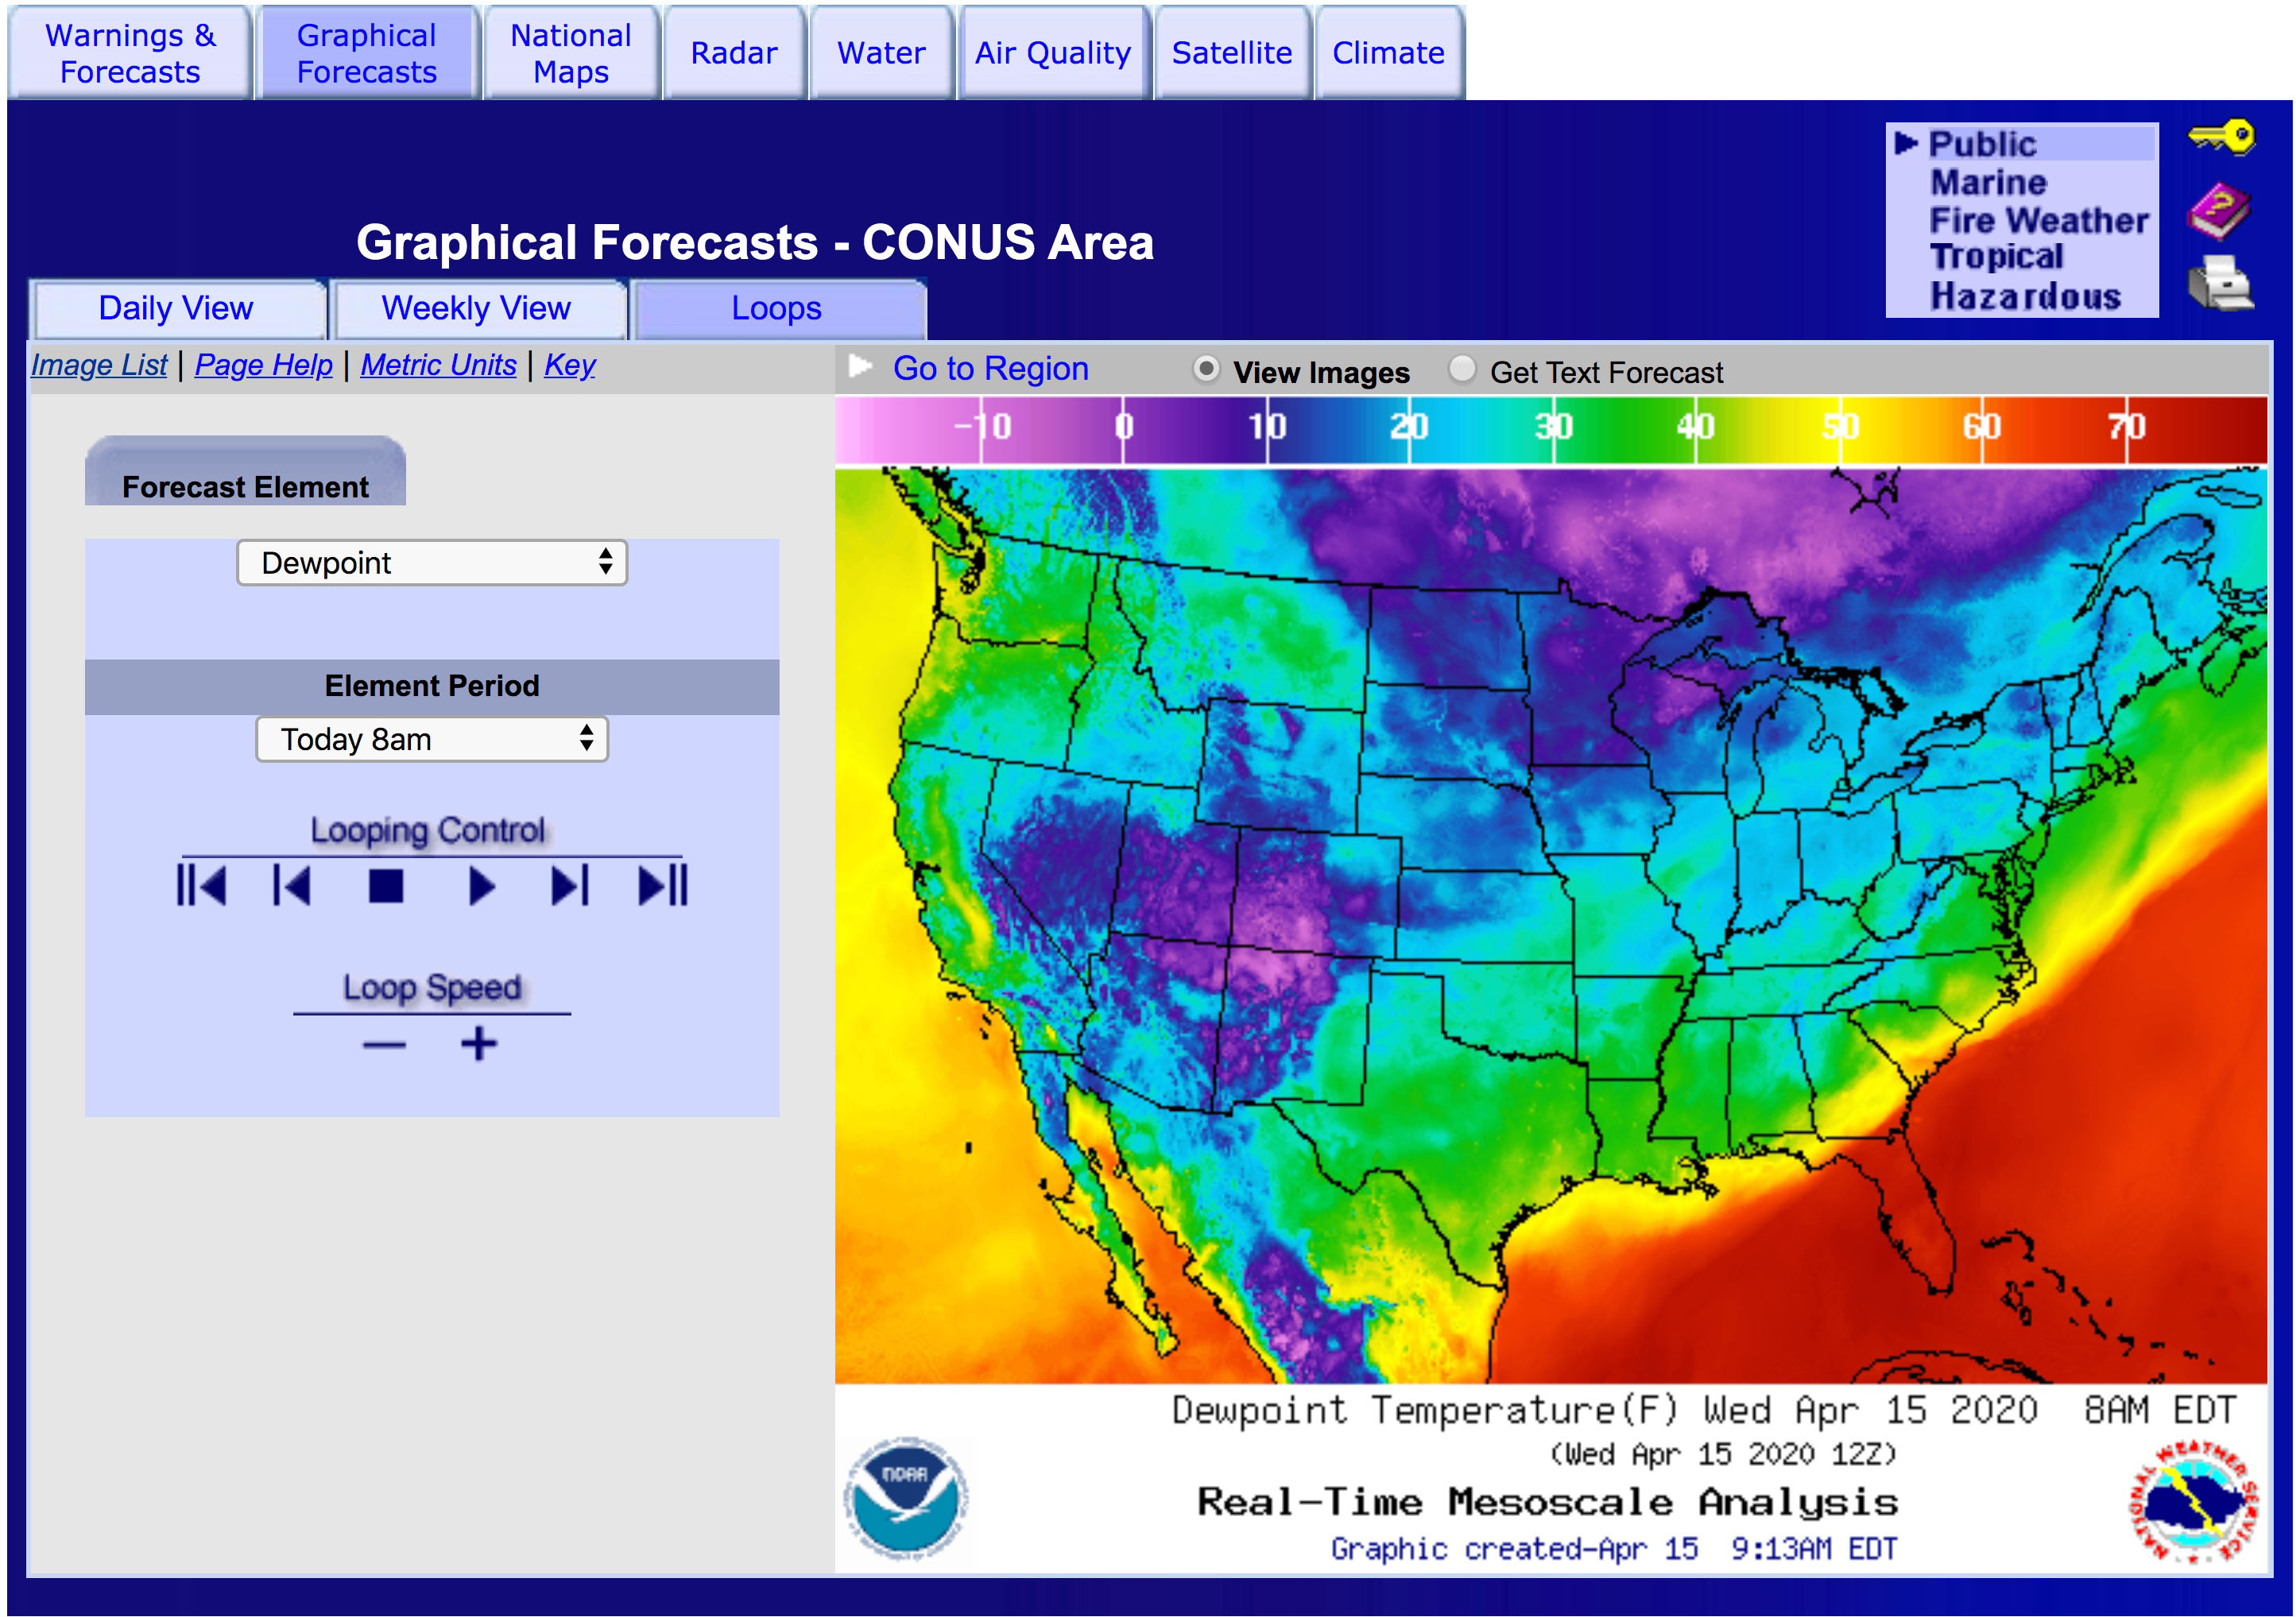 Example of a graphical forecast map, this one shows dew point. The Graphical Forecasts page has a menu that allows you two switch between layers available through NOAA's massive weather databases. |
| A notice on this web page states that will be replaced with the map viewer at https://digital.weather.gov. |
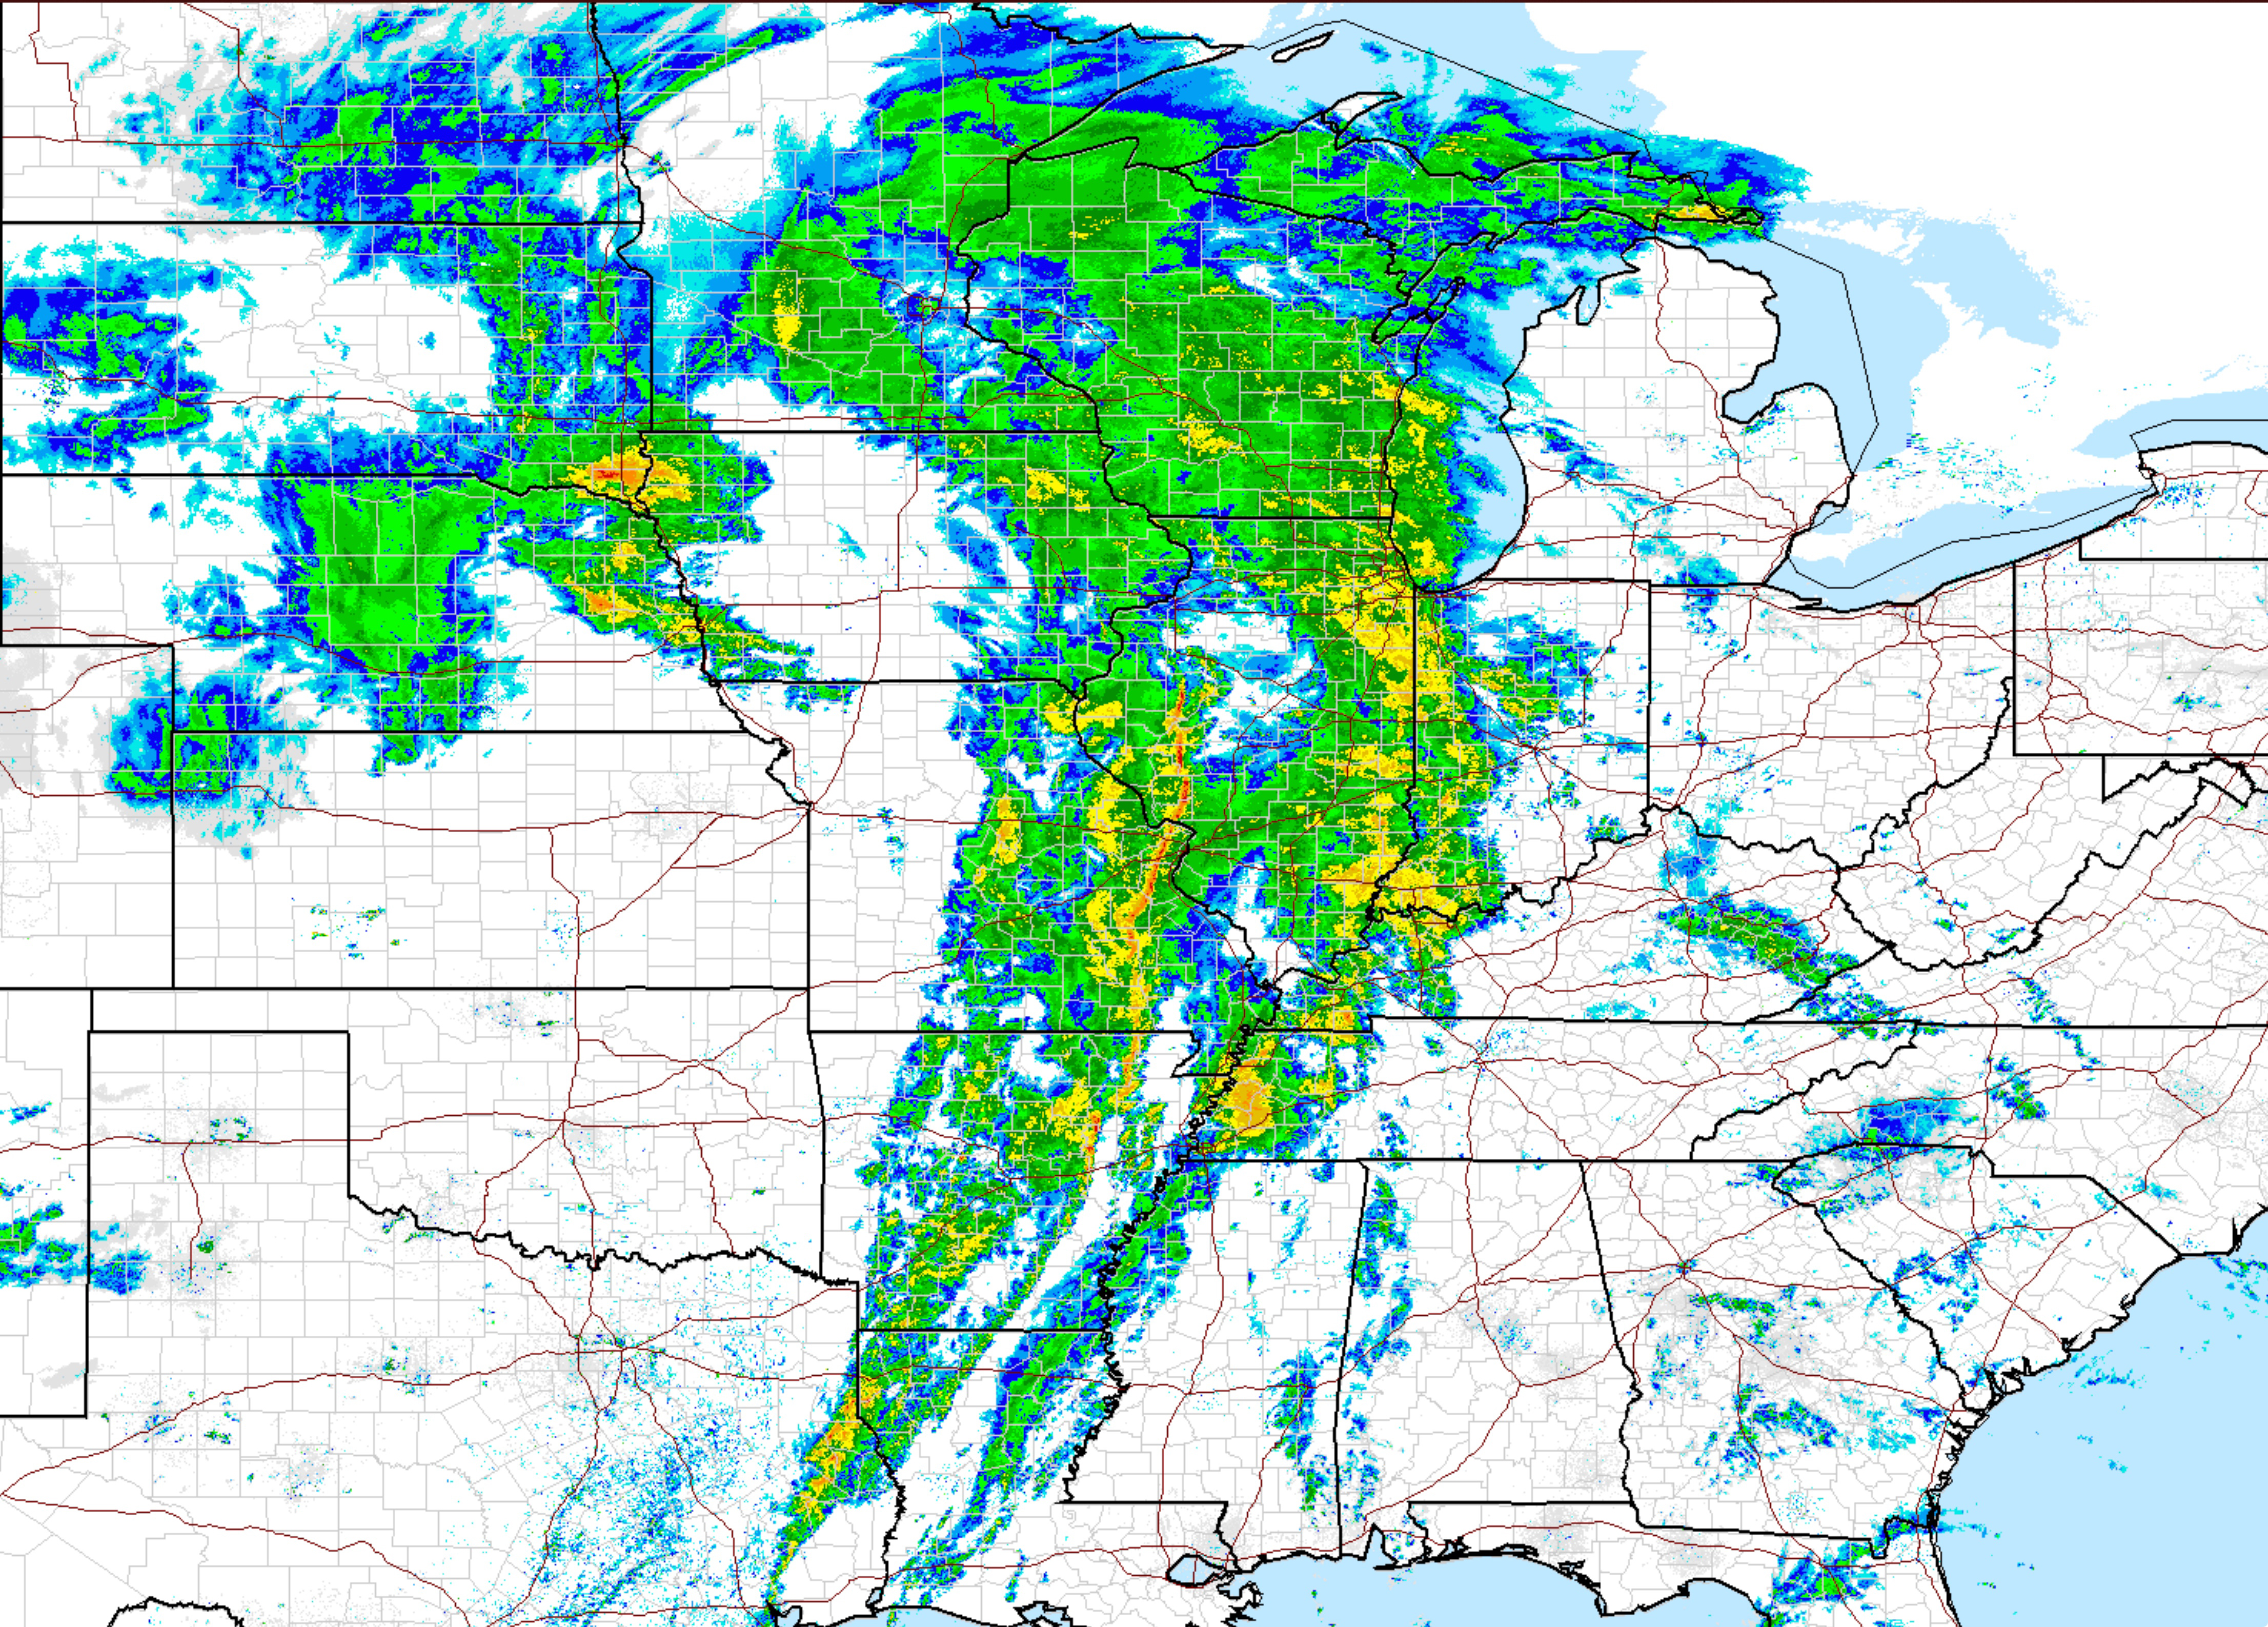
Weather Radar MapsRadar has proven extremely important tool for observing weather. The nation currently has a network of 160 sites. The network, called NEXRAD (for Next Generation Radar) covers all 50 states, Puerto Rico Guam, and military bases in Asia and the Azores. Individual sites cover local regions but overlap with neighboring regions. The view to the right is a snapshot of a weather radar mosaic for the country captured from the website below.National Weather Service Enhanced Radar Image https://radar.weather.gov/ This website also has links to regional sector radar images and and looping animations showing to storm cloud tracks: national and local (SoCal). Zoom in! |
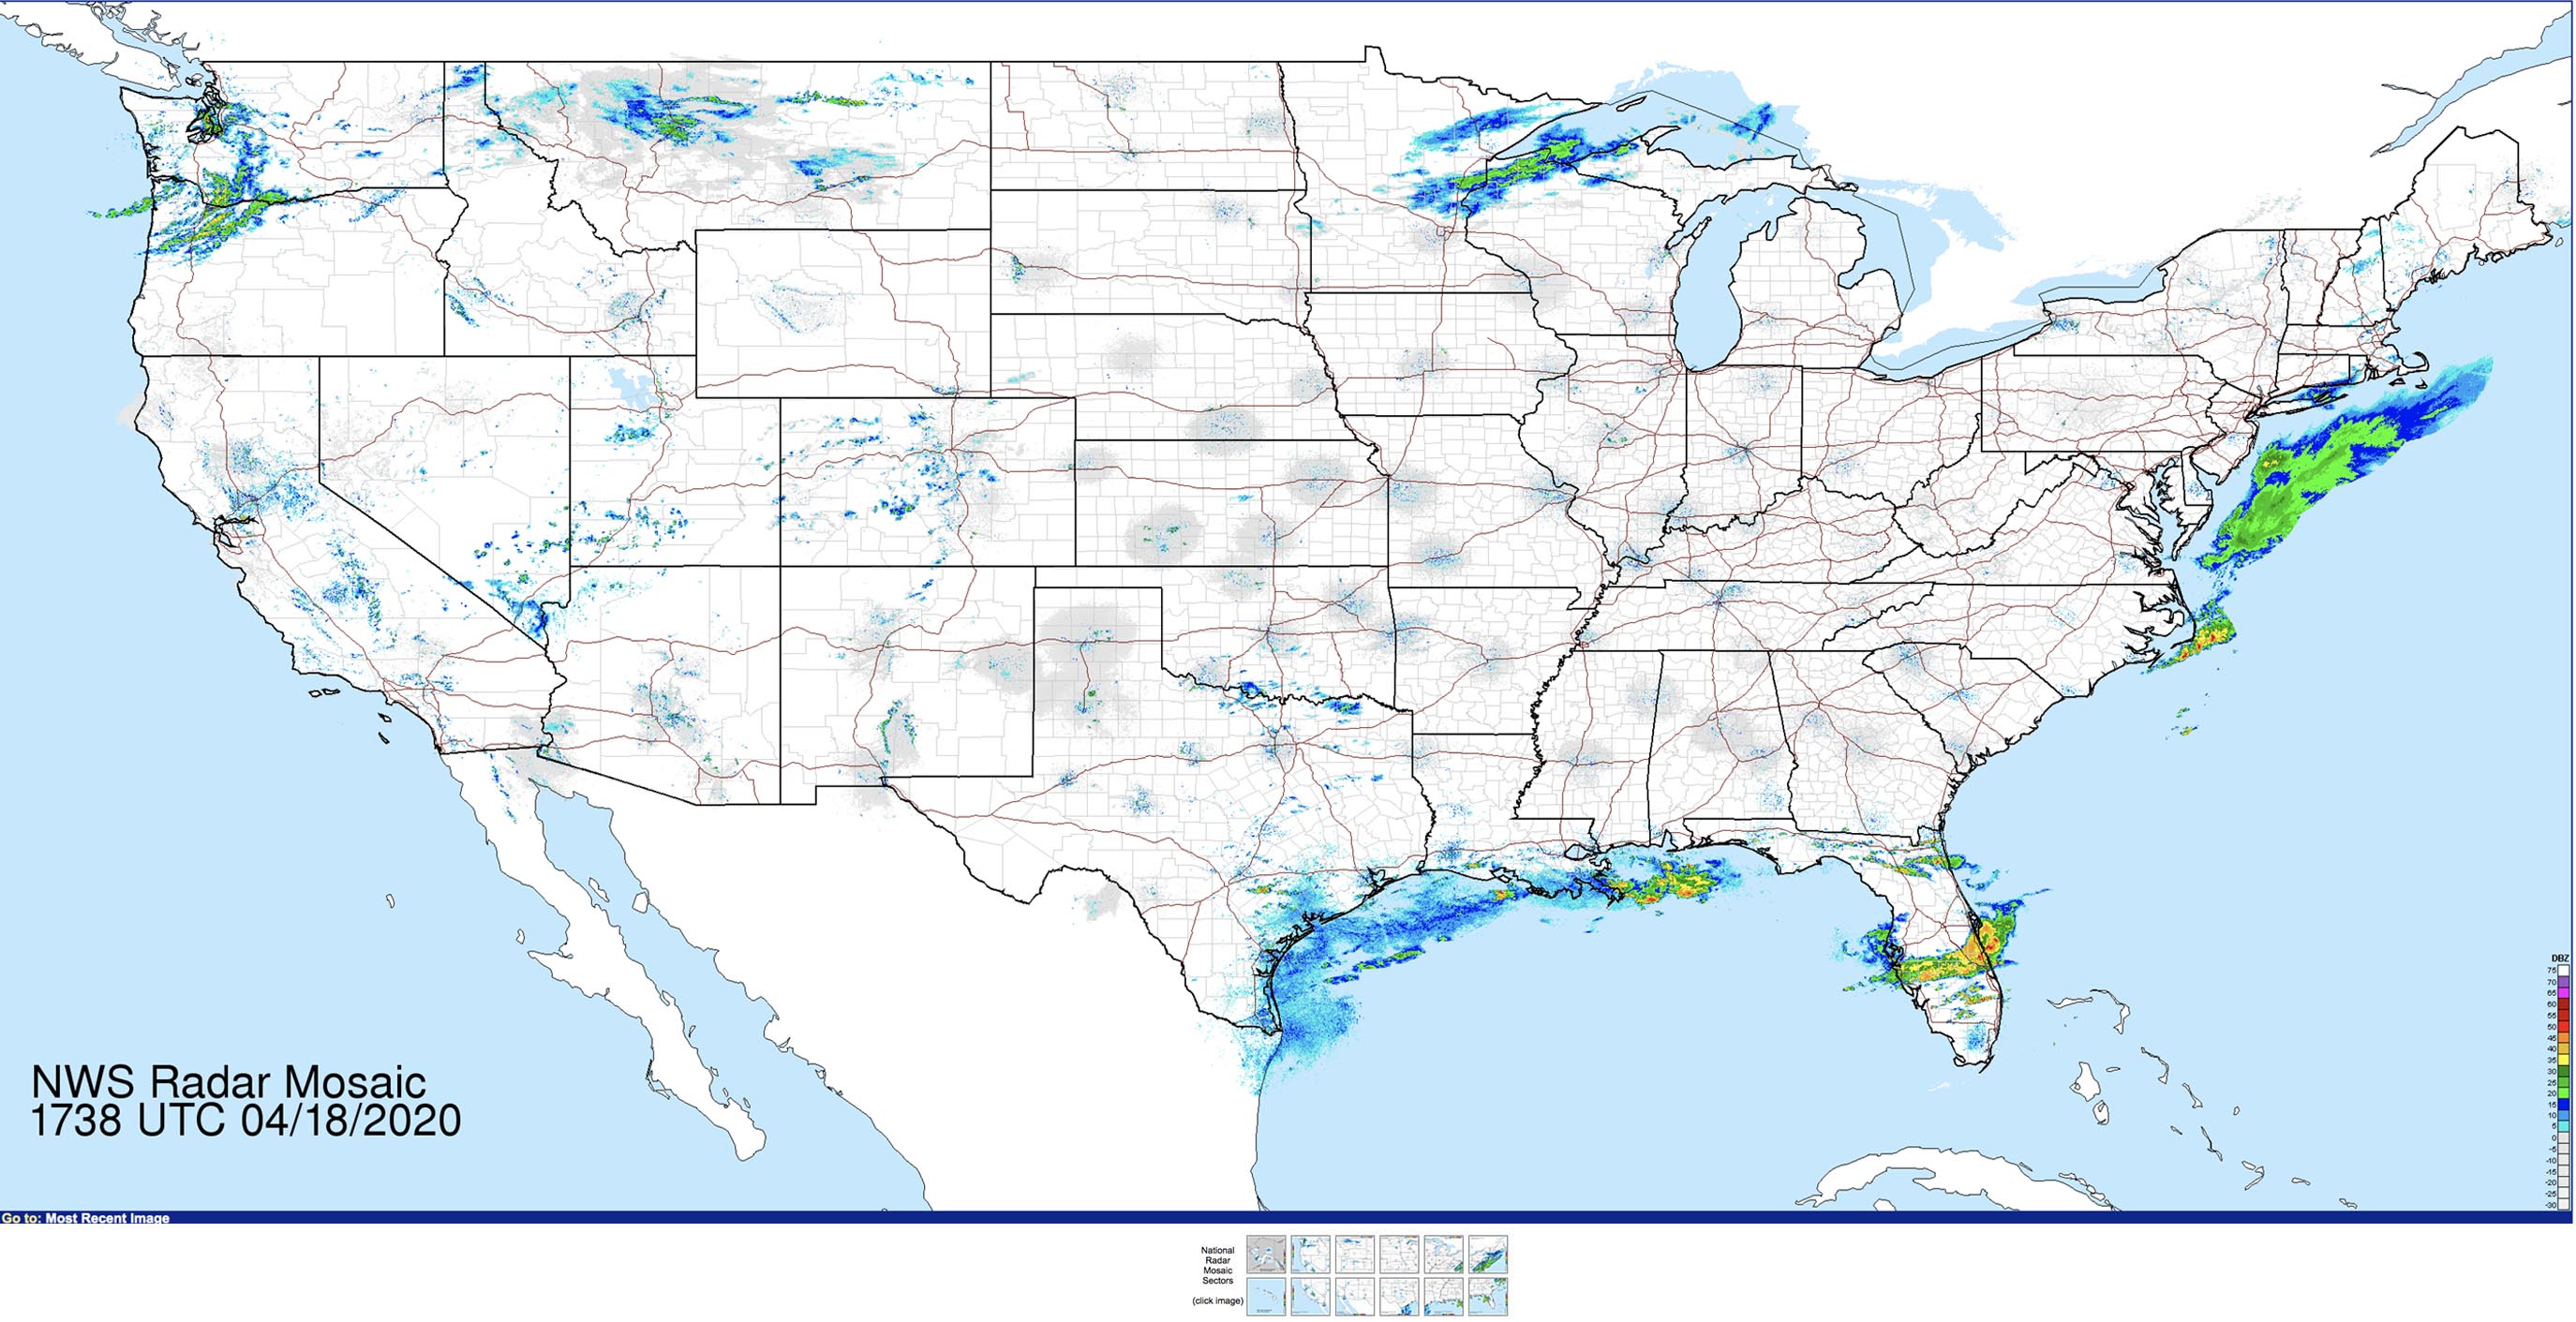 National Weather Service Enhanced Radar Image Loop - National Mosaic - Full Resolution National Weather Service Enhanced Radar Image Loop - National Mosaic - Full Resolution |
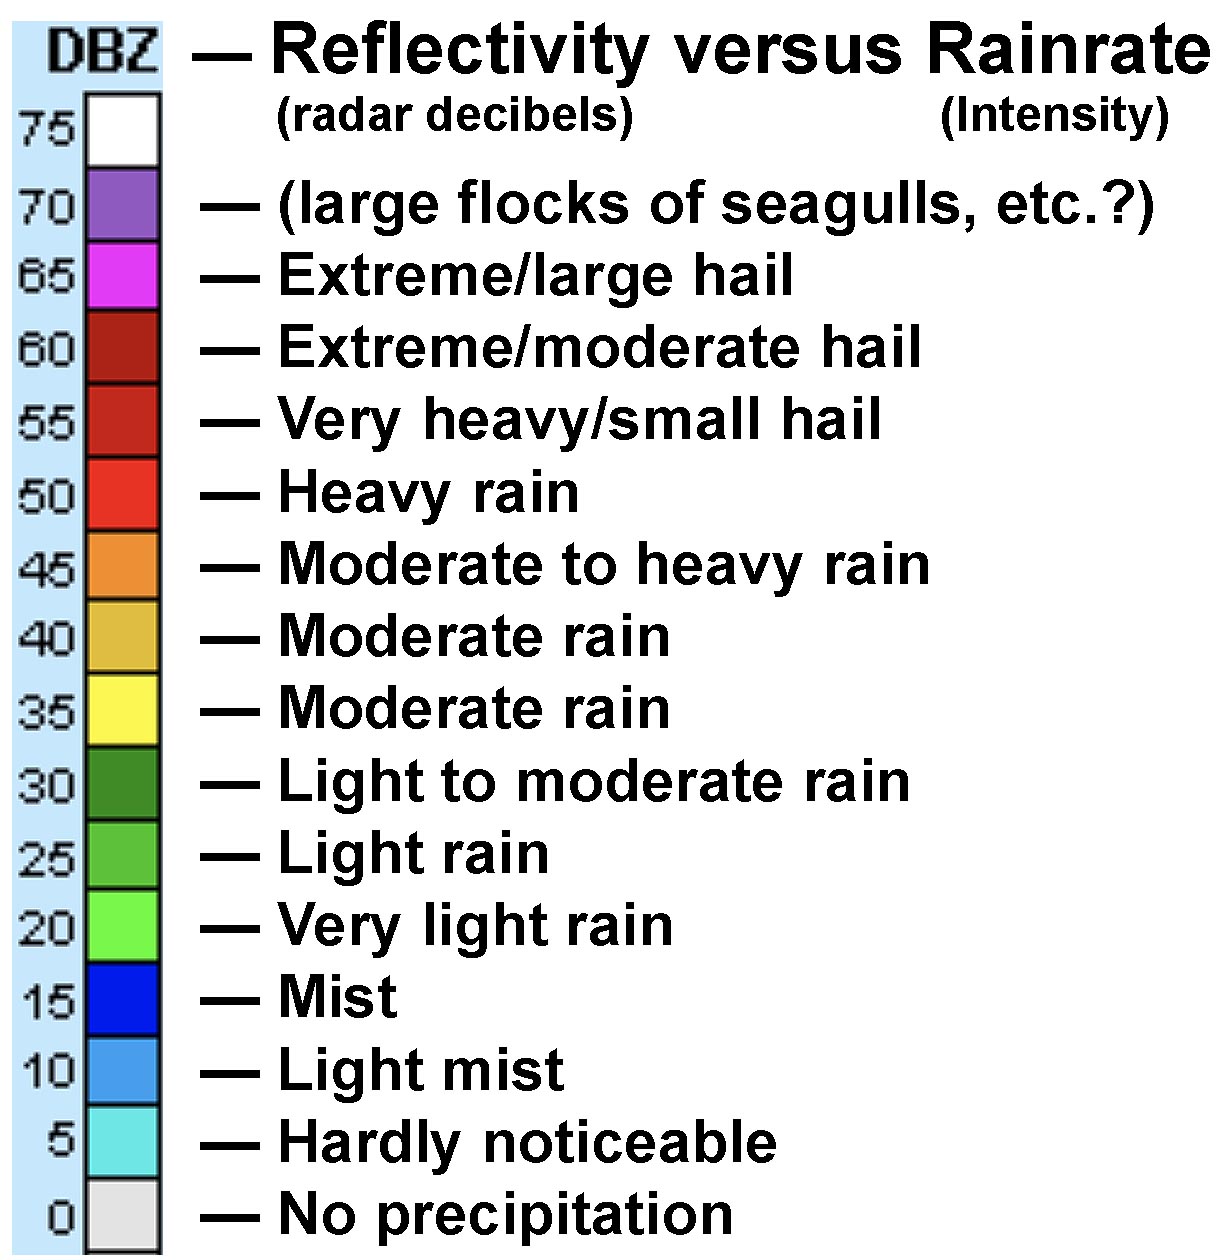
NWS Enhanced Radar MapThe NWS Enhanced Radar Map is a mosaic of weather radar station data collected from all over the nation.Radar is more effective that satellite imagery is some ways because it can see what is lower to the surface where precipitation is falling, whereas satellite imagery may be blocked by upper-level cloud cover. The weather radar equipment uses special reflectivity sensors—they are capable of "seeing" precipitation droplets (or ice/snow/hail, etc.). The radar signal reflected back from the clouds can discern the size classes of droplets or ice or dust particles. The "Reflective versus Rainrate" map legend scale shows variation in intensity of the reflected radar beam. |
 This snapshot of the National Weather Service Enhanced Radar Map Image Loop. This view was taken about 4 hours later than the image shown above. The live version of the map is a looping map view to see the current conditions and how they have changed over the past hour. The legend scale,"Reflectivity versus Rainrate," is on the lower right side of the website map image. |
 |
Modern weather radar systems are extremely useful for studying changing weather patterns and predicting severe weather. Weather radar is used to: |
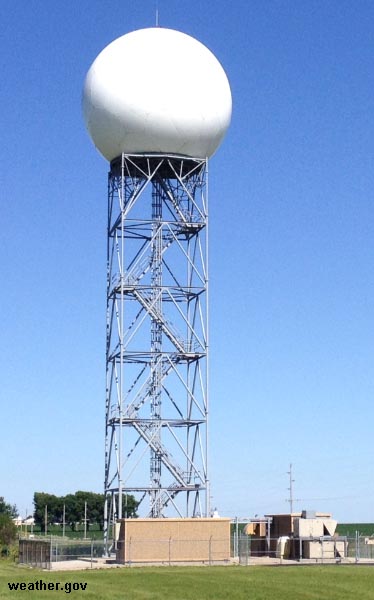 Example of a weather radar station |
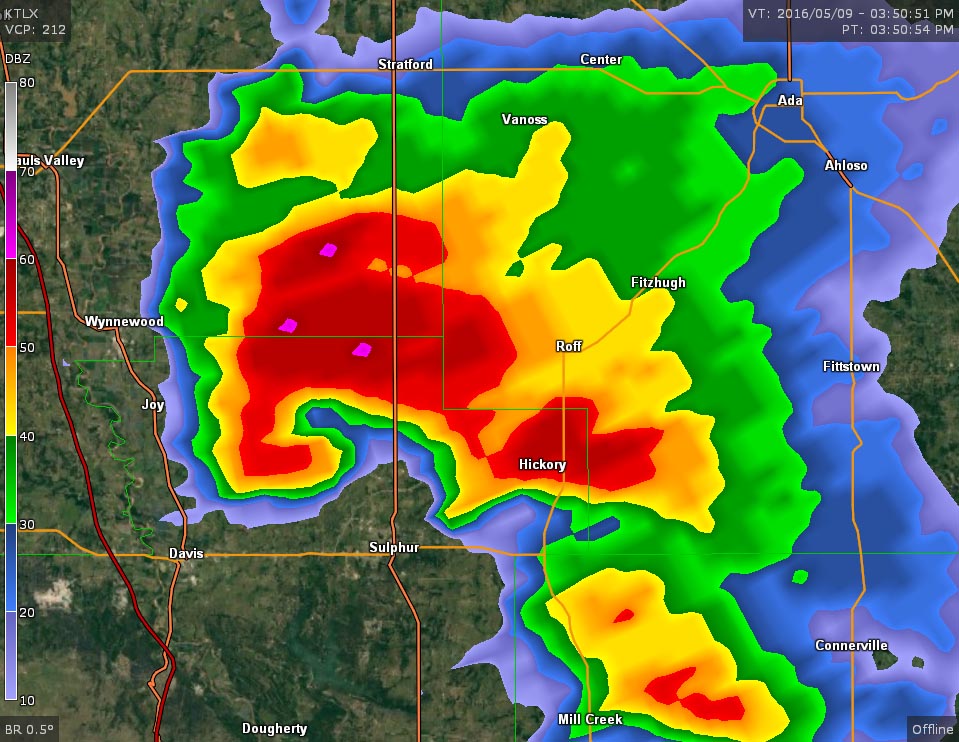 Radar Imagery for the Oklahoma Tornado Outbreak of May 9, 2016 |
Hydrology: Mapping Types of Precipitation and FloodingModern weather radar systems can now fairly accurately predict the type and amount of precipitation compared with spot weather data collection on the ground.Planning ahead for weather conditions, particularly related to rainfall, flooding and drought, have important implications to nearly all aspects of society and the economy, particularly related to agriculture, transportation, water supply, infrastructure and low-lying communities. |
Types of PrecipitationRain is liquid water that falls from the sky as water vapor condenses (releasing latent heat energy). Water droplets start forming as water condenses onto microscopic cloud-condensing nuclei —dust particles, aerosols, and pollutants in the air. Eventually the droplets grow larger as they collect more water, increasing in mass that eventually allows them to fall to the ground as raindrops. Ice Pellets (or sleet) are transparent pellets of ice in round or regular grains consisting of frozen raindrops or melted and refrozen snowflakes. Ice pellets are smaller than hailstones. Frozen drizzle forms smaller snow grains. Hail is precipitation that involves rounded ball of ice (hailstones) that falls from the sky. Hail forms as water droplets freeze and accumulate additional layers of ices as they rise and fall in updrafts in strong thunderstorms. Eventually they become to heavy and fall to the ground, typically along with heavy rain. Most hail is small, pea-to-marble sized, but can reach golf ball to baseball size in strong thunderstorms. are called s Ice crystals sublimate directly from the air and can create crystals in the form of mostly microscopic needles, column, or plates. Ice crystals can grow to become snowflakes. Ice crystals and can contribute to forming an ice fog. High cirrus clouds are typically composed of a fog of ice crystals. Ice crystal that grow on cold surfaces are called frost. |
 Snapshot of the National Weather Radar Mosaic (above) and a daily precipitation map projected for the same storm event (below). 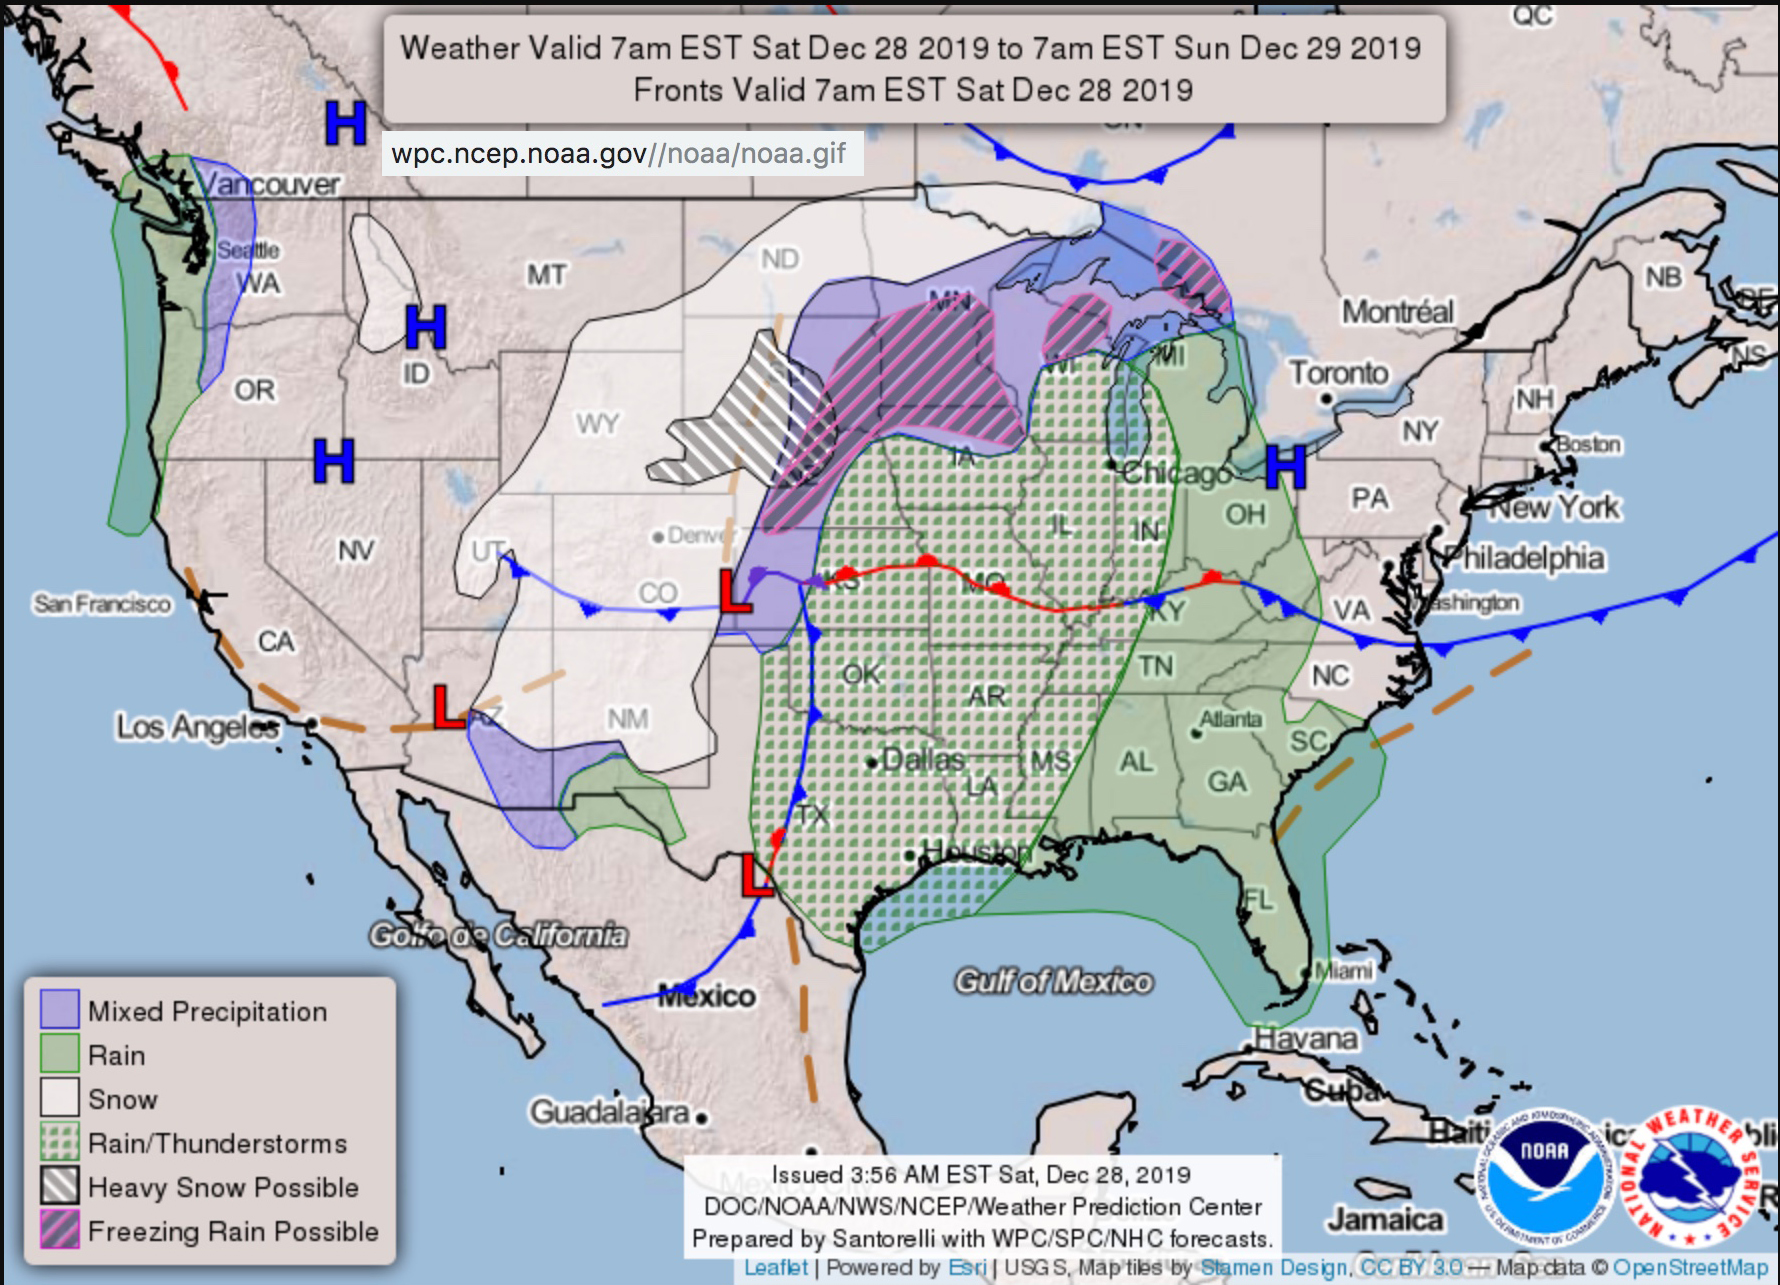 The Weather Prediction Center generates National Forecast Charts that provide current-day and short-range weather forecasts for to the next three days. |
Weather Forecasts and Climate Predictions |
Short Range ForecastsThe National Weather Service—Climate Prediction Center (CPC) attempts to provide longer range forecasts and changing climate conditions outlooks for the country. A typical short-range weather forecast is only for 5 days. However by combining historical data with climate models involving the global weather/climate system, longer-range forecasting is being attempted. The CPC's mission is to predict and describe climate variations on timescales from weeks to years thereby promoting effective management of climate risk and a climate-resilient society.The Daily Weather Charts described above (in Sections 1-7 to 1-13) illustrate the current weather conditions (fronts, barometric pressure, temperature and precipitation). All weather data is archived. This data used to create forecast models and to evaluate long-term weather patterns. Forecast maps show the weather conditions projected into the future. Because weather systems are complex, the accuracy of forecasts general diminish in accuracy further out. Forecast maps are cyclically revised as new data is compiled. |
Sea Level Pressures and Fronts
Short Range Weather Forecast Maps 12 Hour | 24 Hour | 36 Hour | 48 Hour 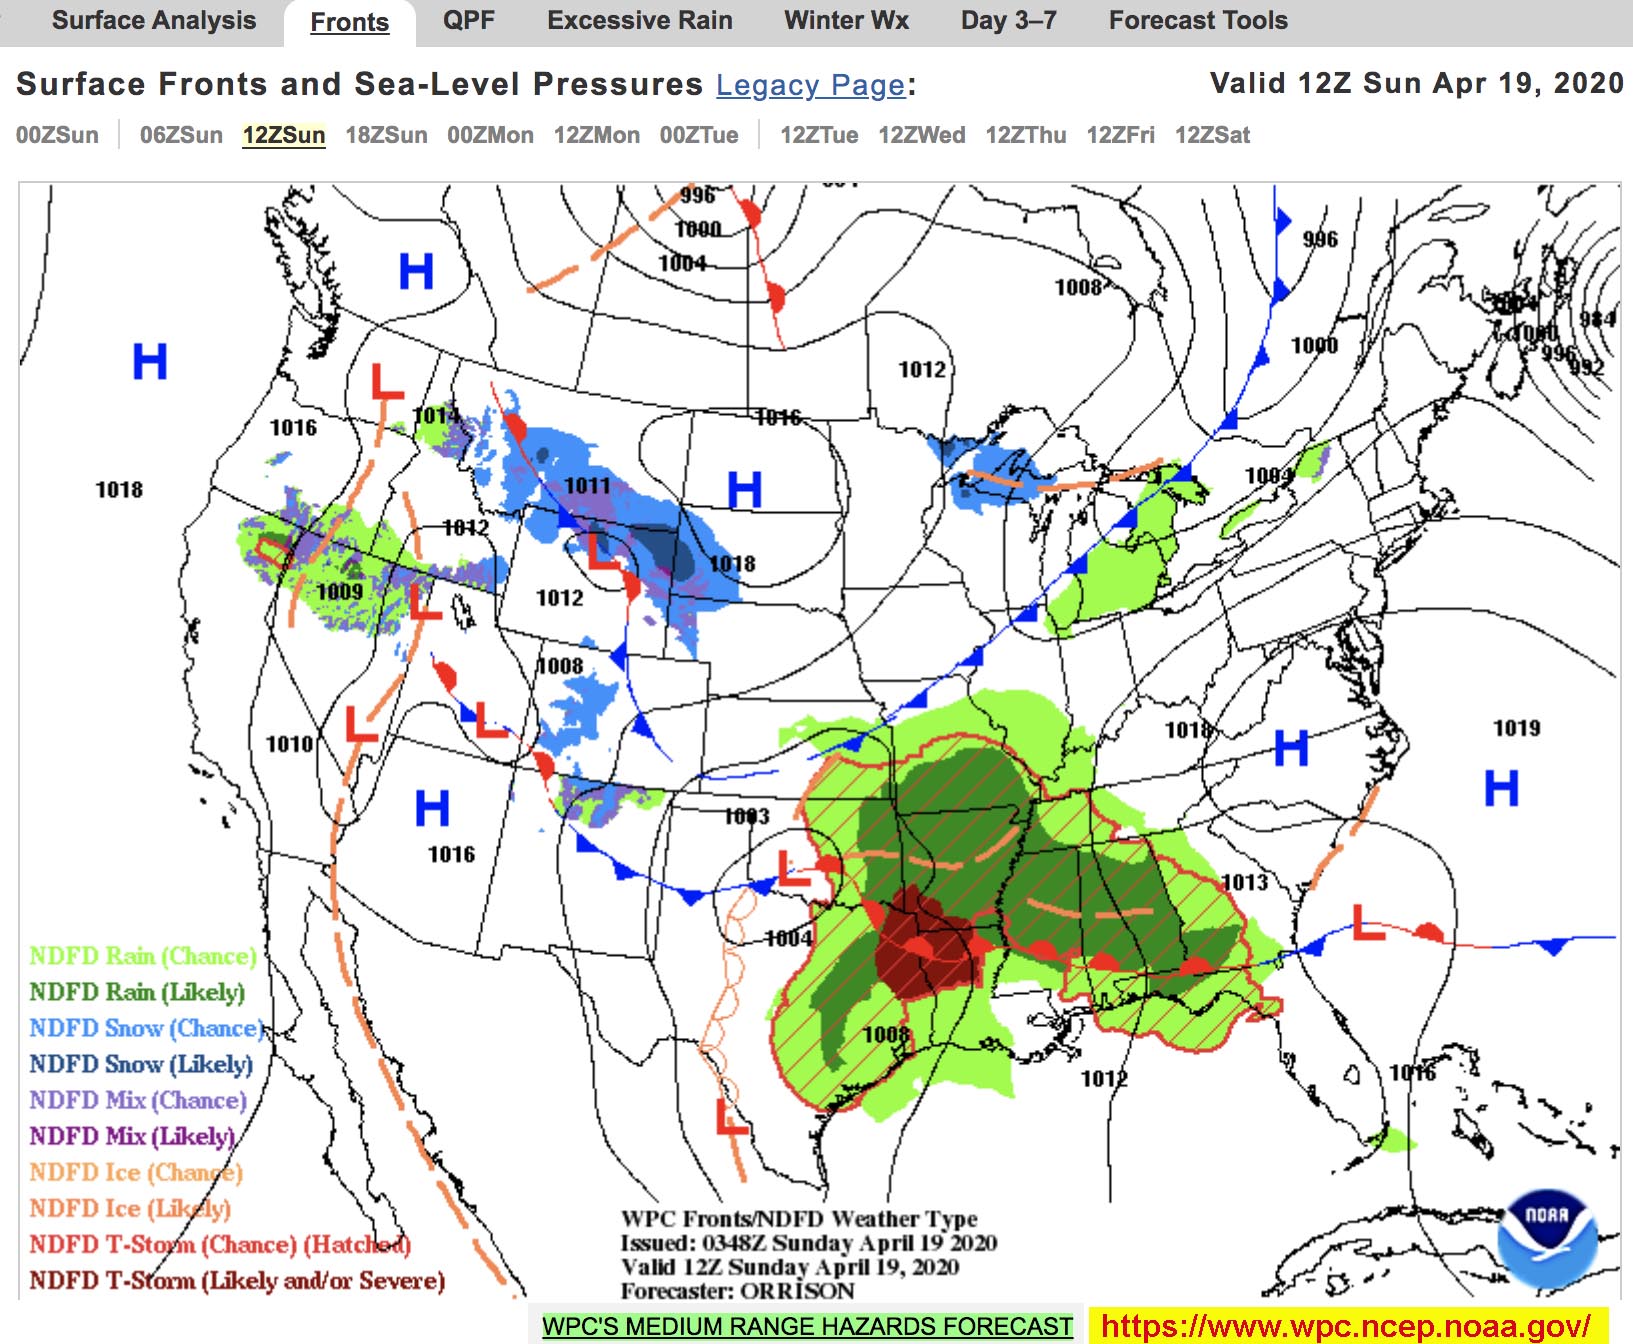 See the looping version of the forecast maps. |
Long Range/Seasonal ForecastsExtended-range weather forecast and outlooks are extremely useful for planting and harvest planning, and regional water supply management (filling or draining reservoirs, groundwater pumping, and more).Temperature and precipitation forecasts offered for 6-10 days and 8-14 days in the future. Long-range outlooks are made for 1 and 3 months into the future. Weather hazards are predicted for 3-7 days or 8-14 days into the future Note that the maps provided are not weather maps, but rather are probability predictions maps on the temperatures, precipitation, and weather hazards that regions may experience. See: Weather forecasts versus climate outlooks: what's the difference? (climate.gov website). |
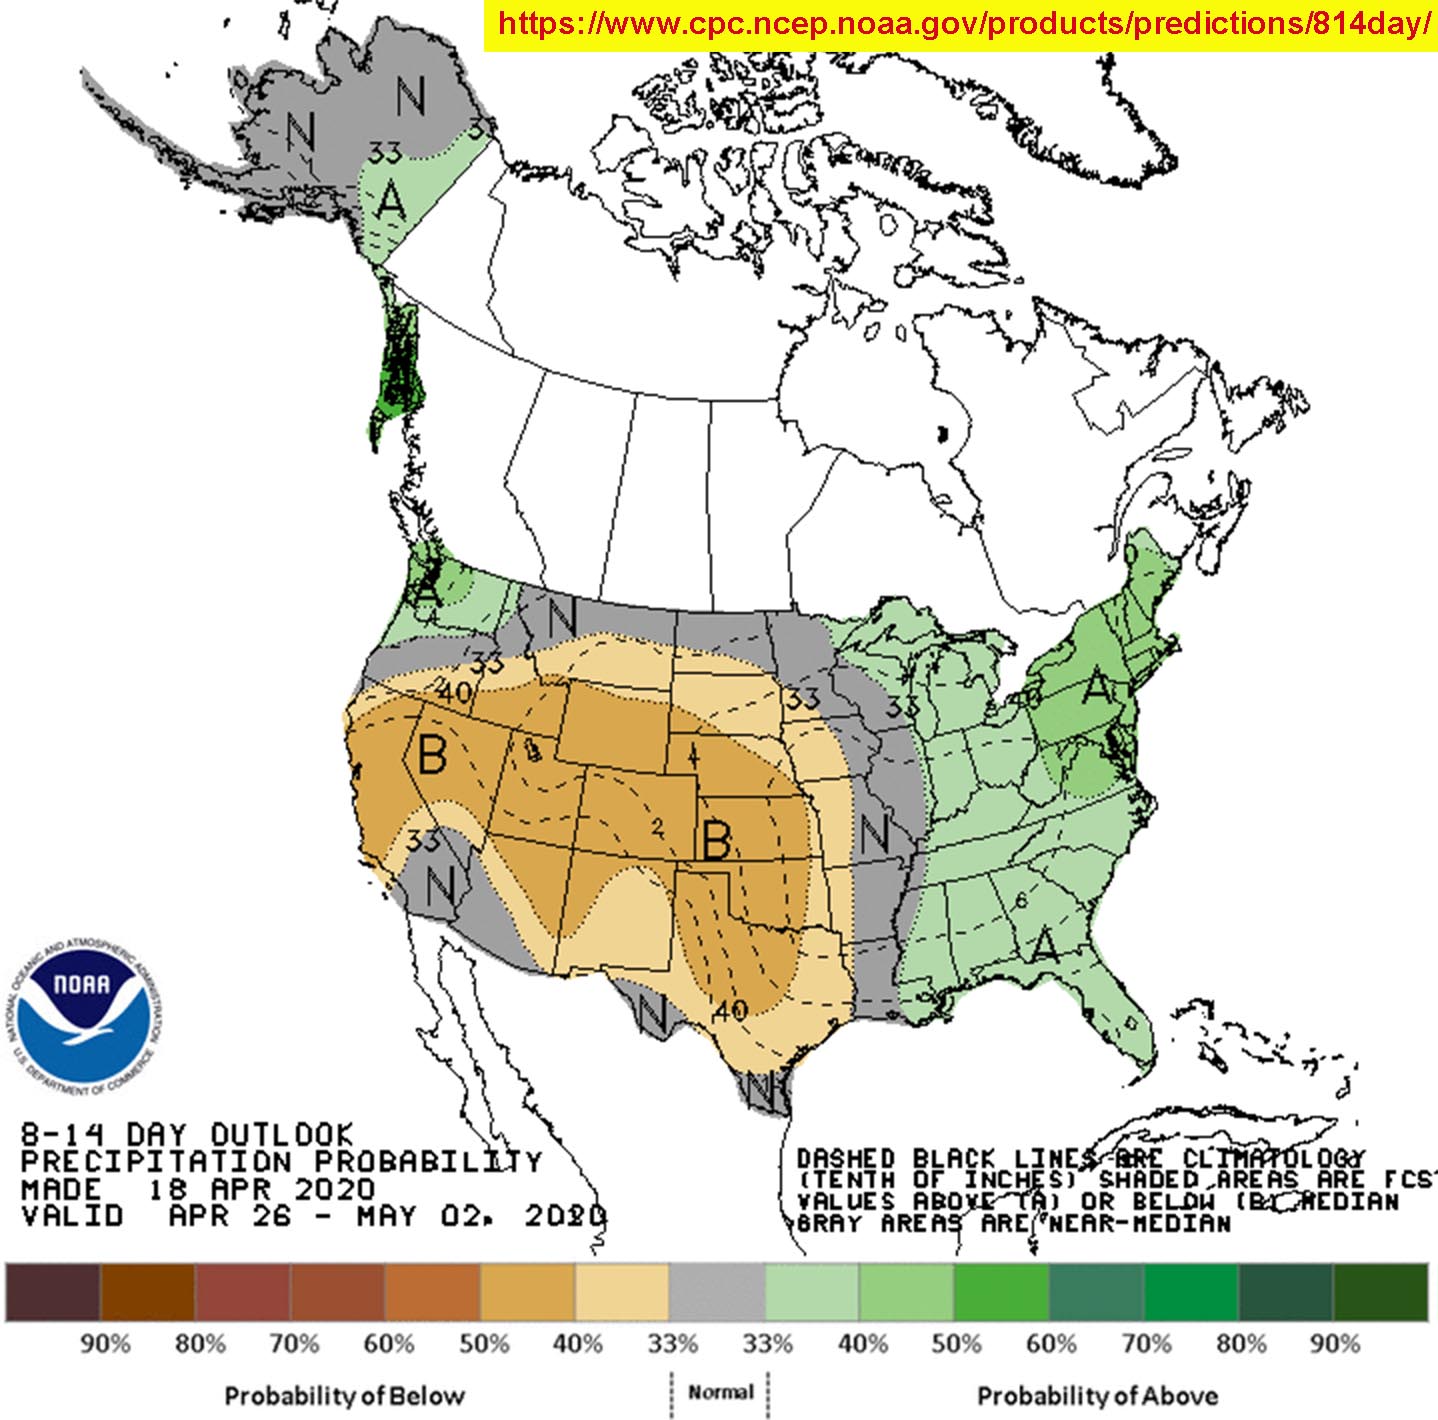 8-10 Day Outlook for Precipitation Probability |
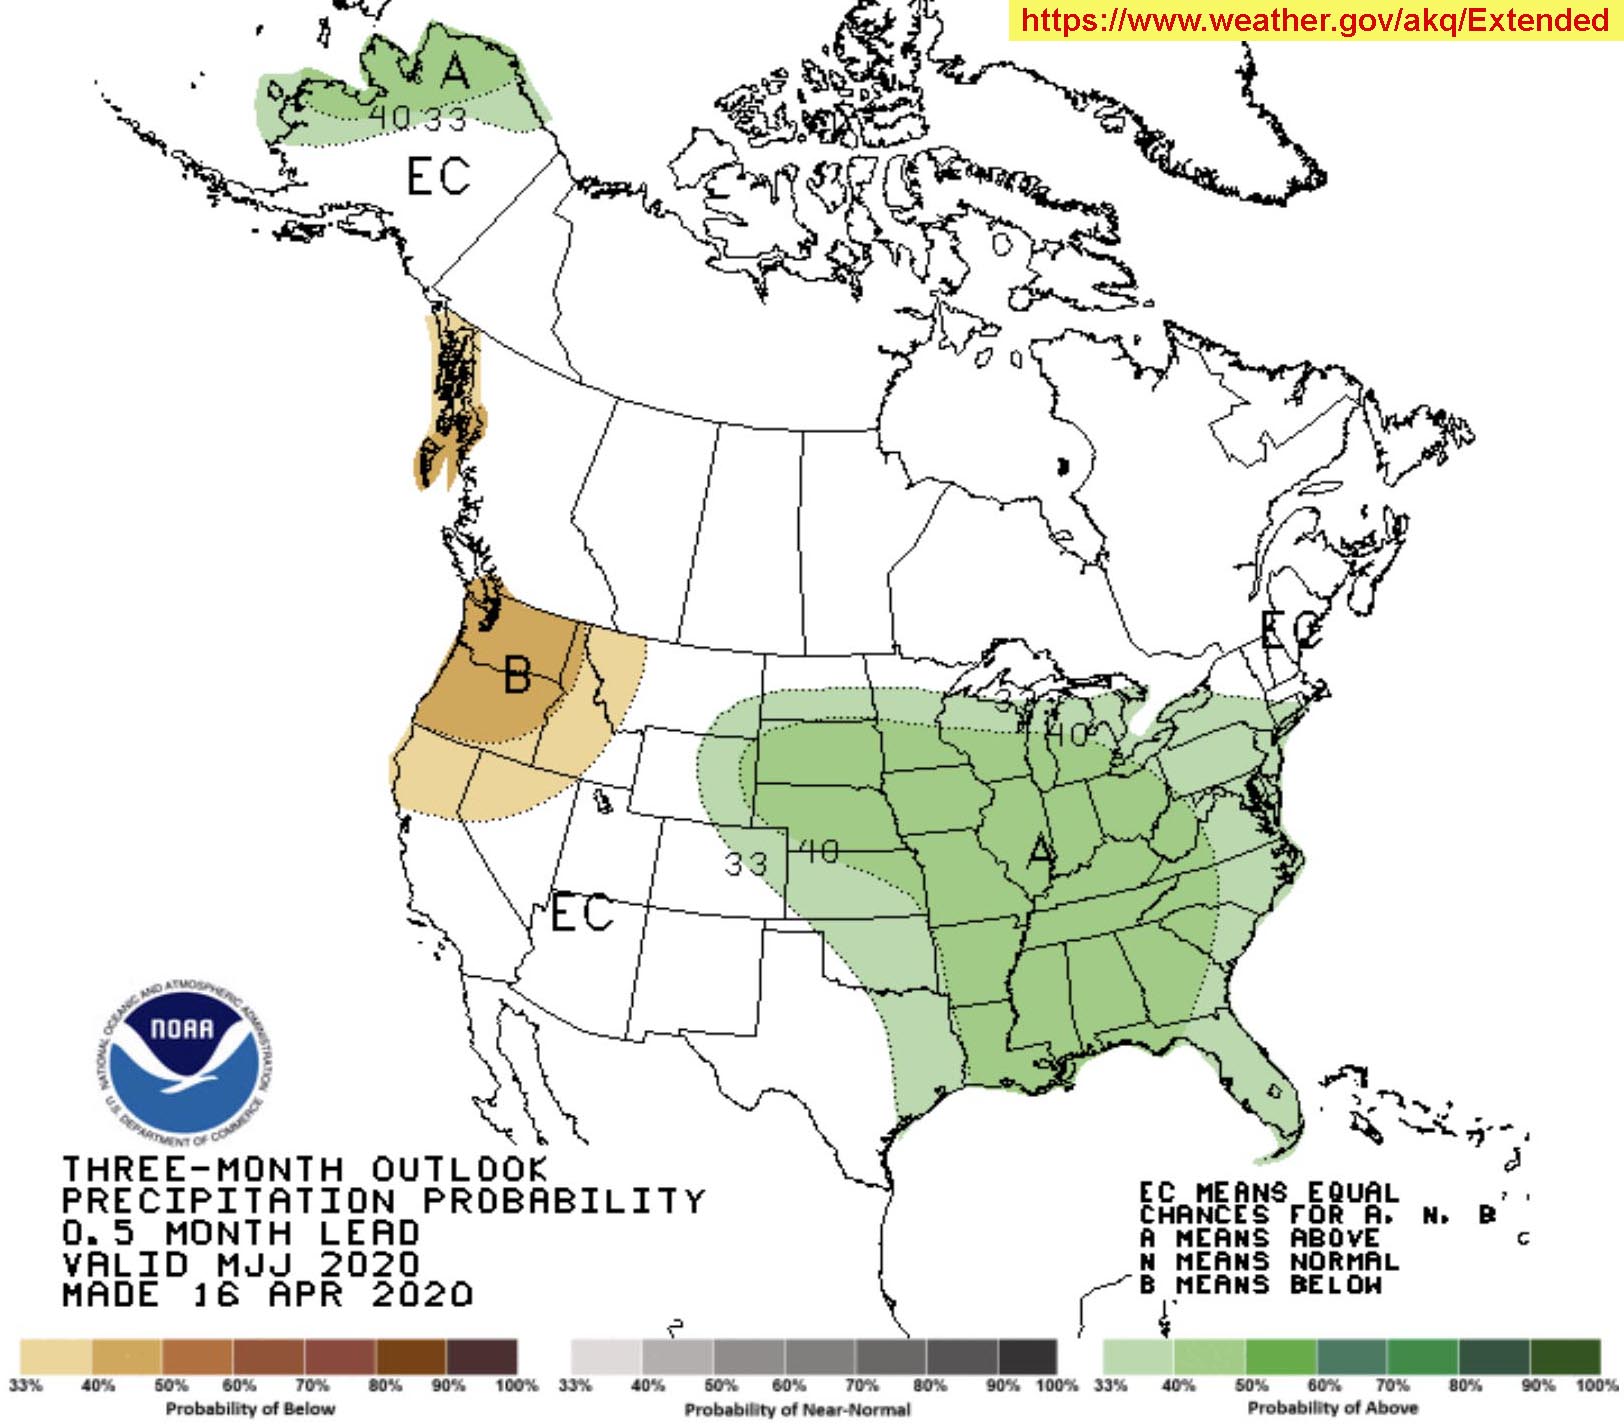 3-Month Outlook Precipitation Probability |
The NOAA Climate Prediction Center (NEPC) also provides regional drought monitoring forecasts and outlook and weekly Crop Moistures Index (showing is soil is too wet, to dry, or just right to plant crops. 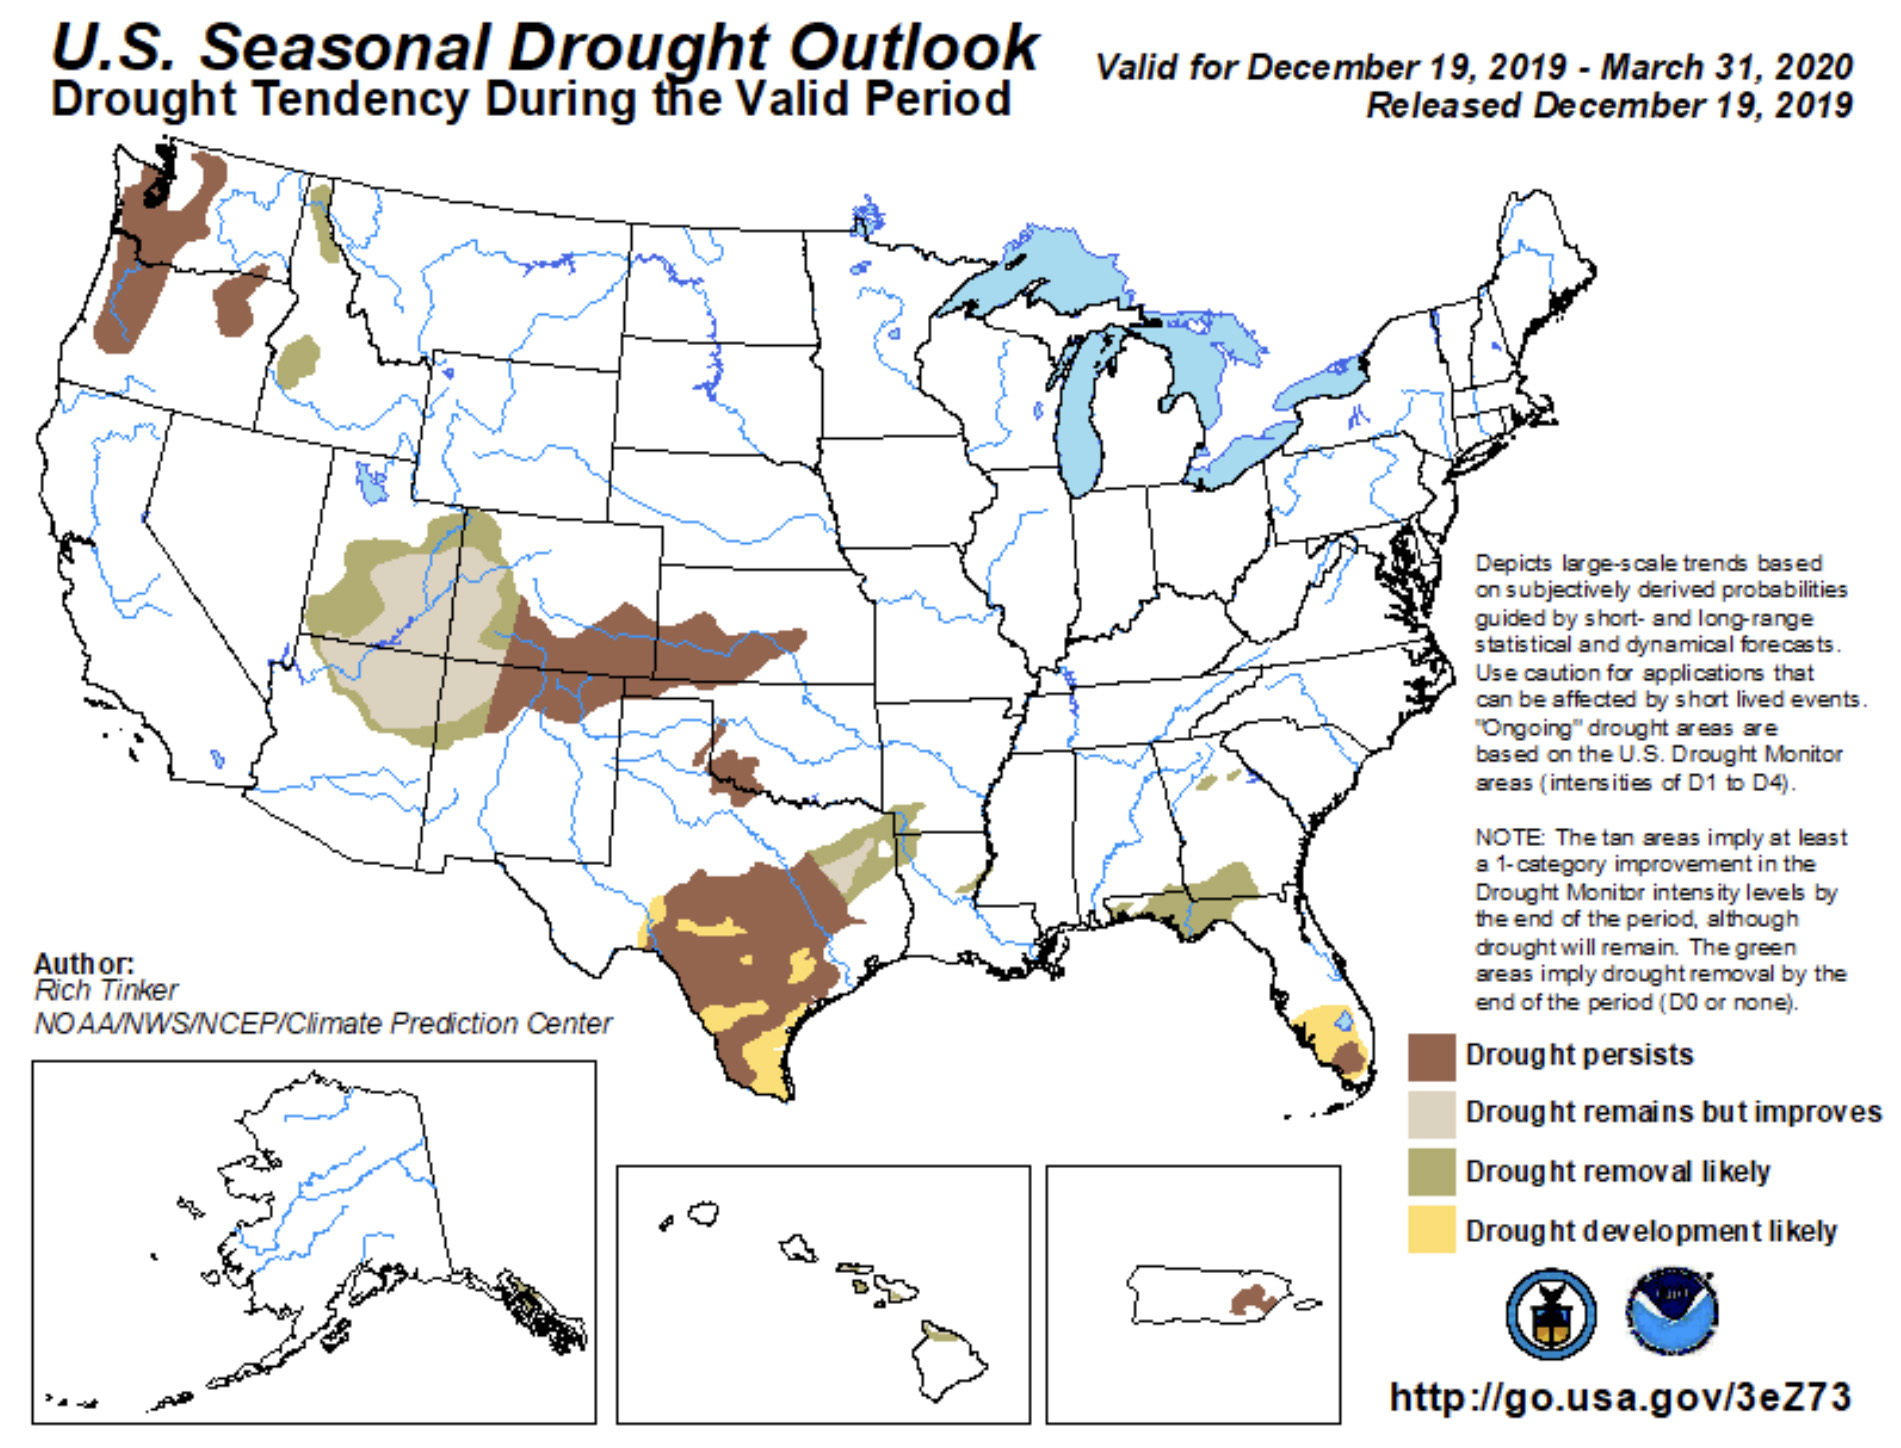 3-month Seasonal Drought Outlook map (website) |
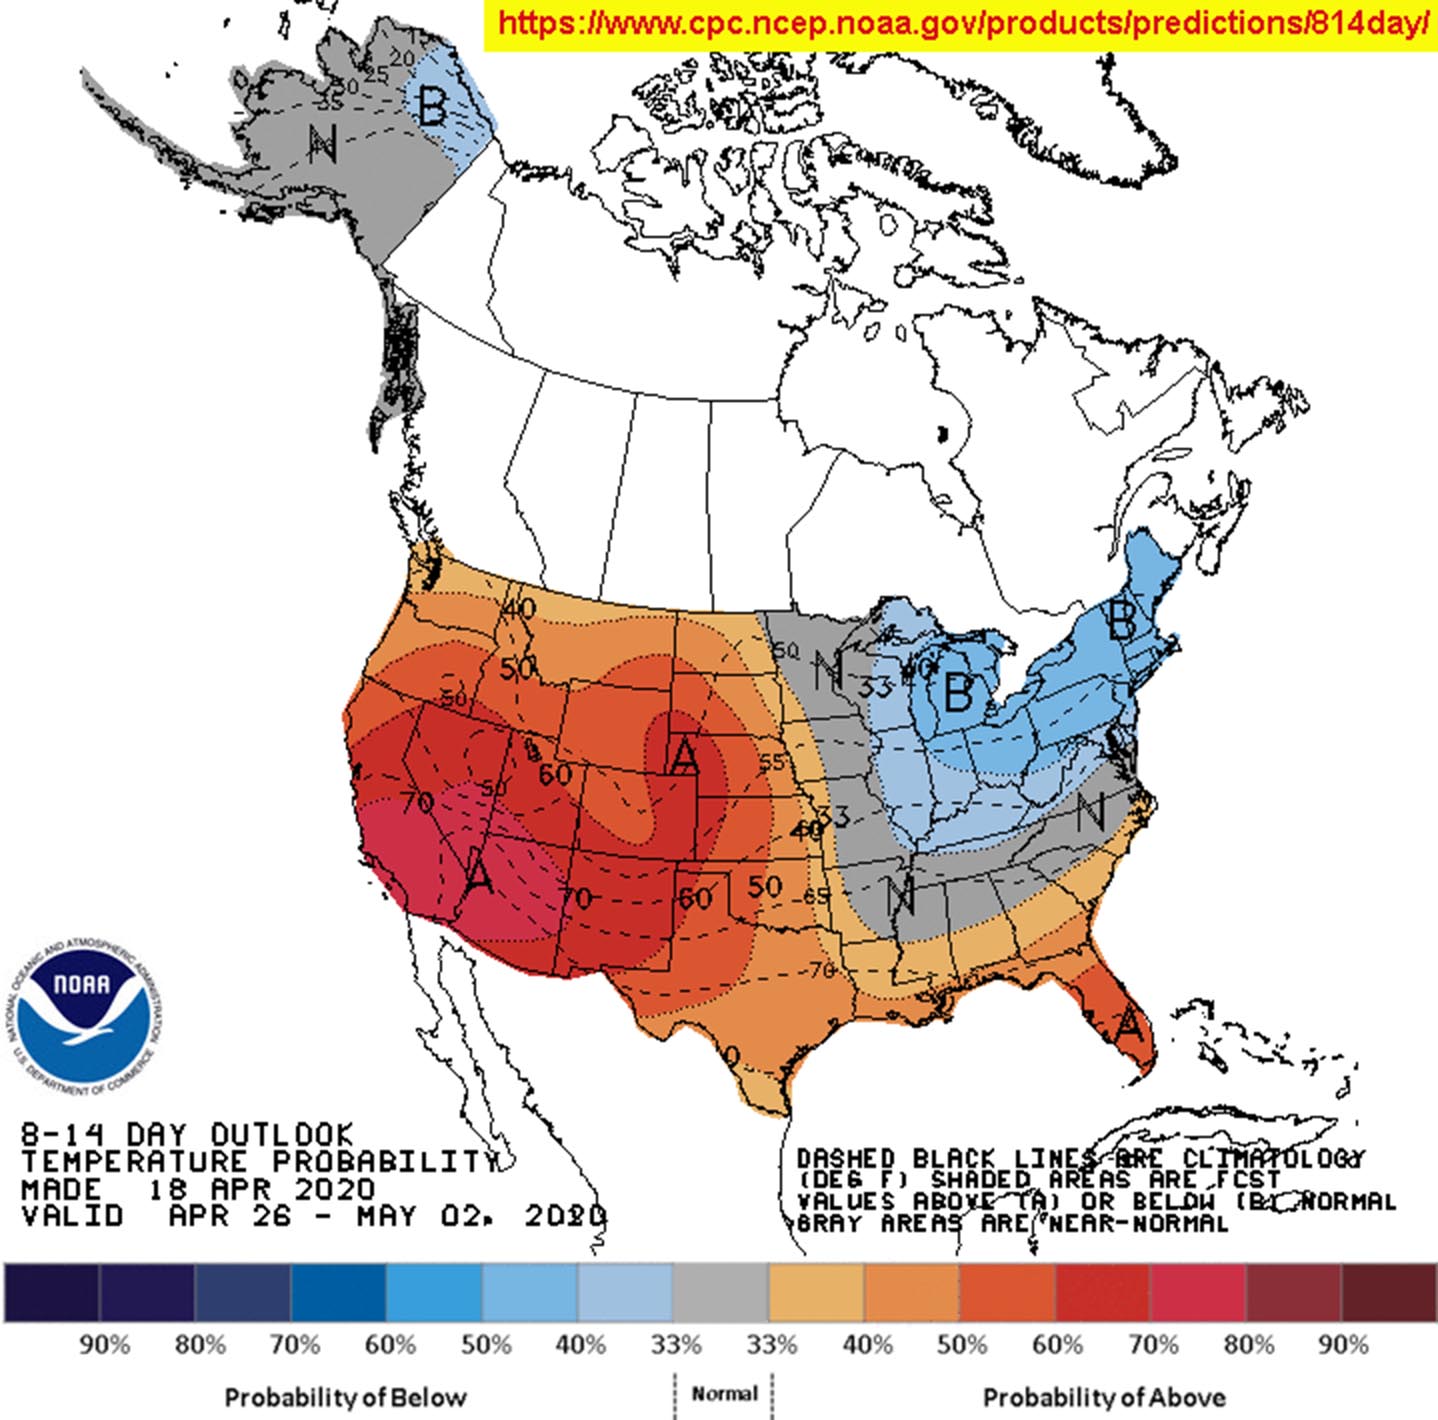 8-10 Day Outlook for Temperature Probability |
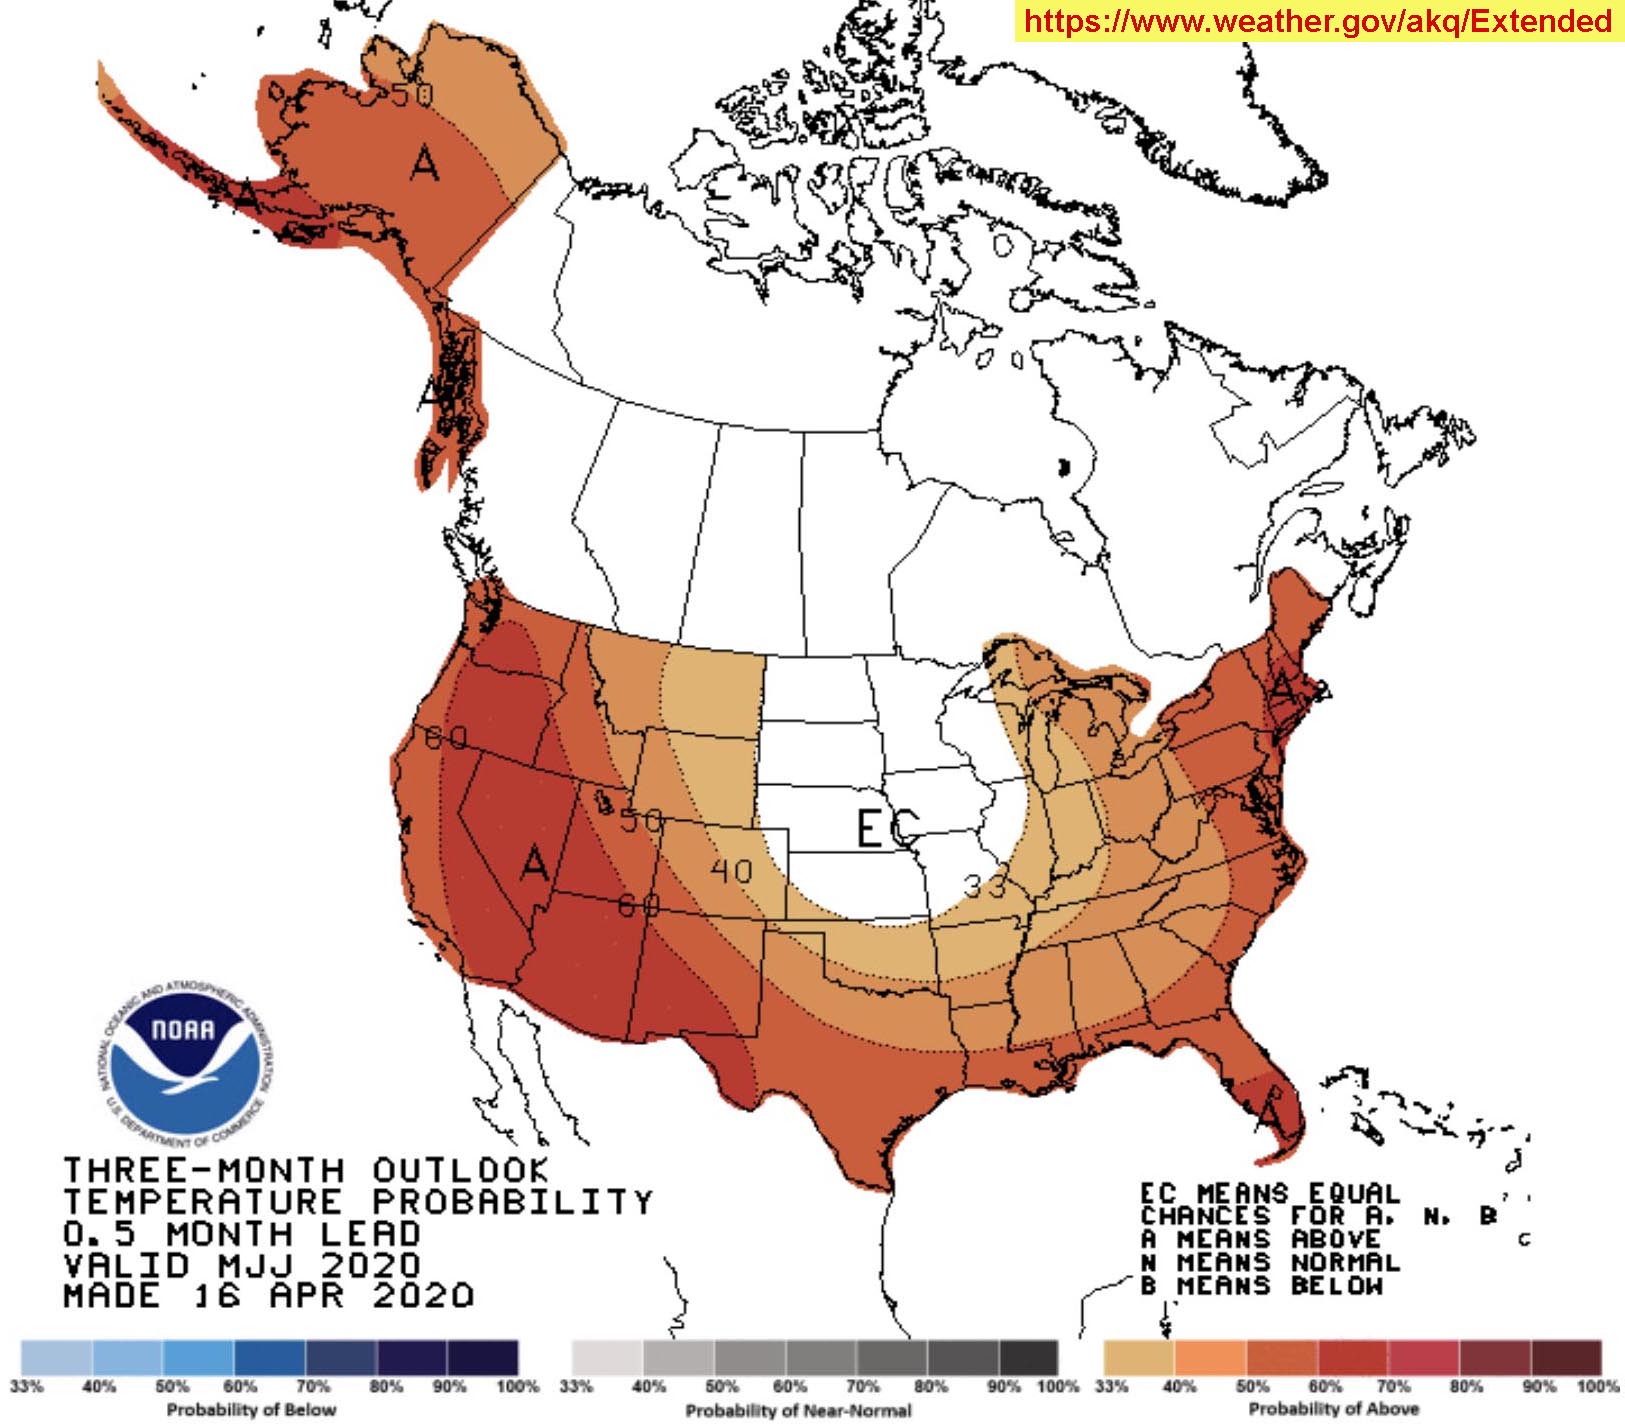 Three -Month Outlook Temperature Probability |
Precipitation Totals and ForecastsThe National Weather Service records 24-Hour rainfall totals and multi-day storm totals. They also record past monthly, seasonal, and annual precipitation data.Each NWS Local Forecast Office records daily rainfall totals from weather stations scattered across their area of coverage . All forecast offices archive their daily, weekly, seasonal, and annual weather data. For example, the San Diego Forecast Offices recorded rainfall totals for a 24 hour period for a storm on that impacted the area on Valentines Day, Feb. 14, 2019. This rainfall data is compared with radar and satellite data to create forecast weather forecast models. Examples include the Quantitative Precipitation Forecasts (QPF) maps. These are short- to medium- range forecast maps —1 to 7 days). |
|
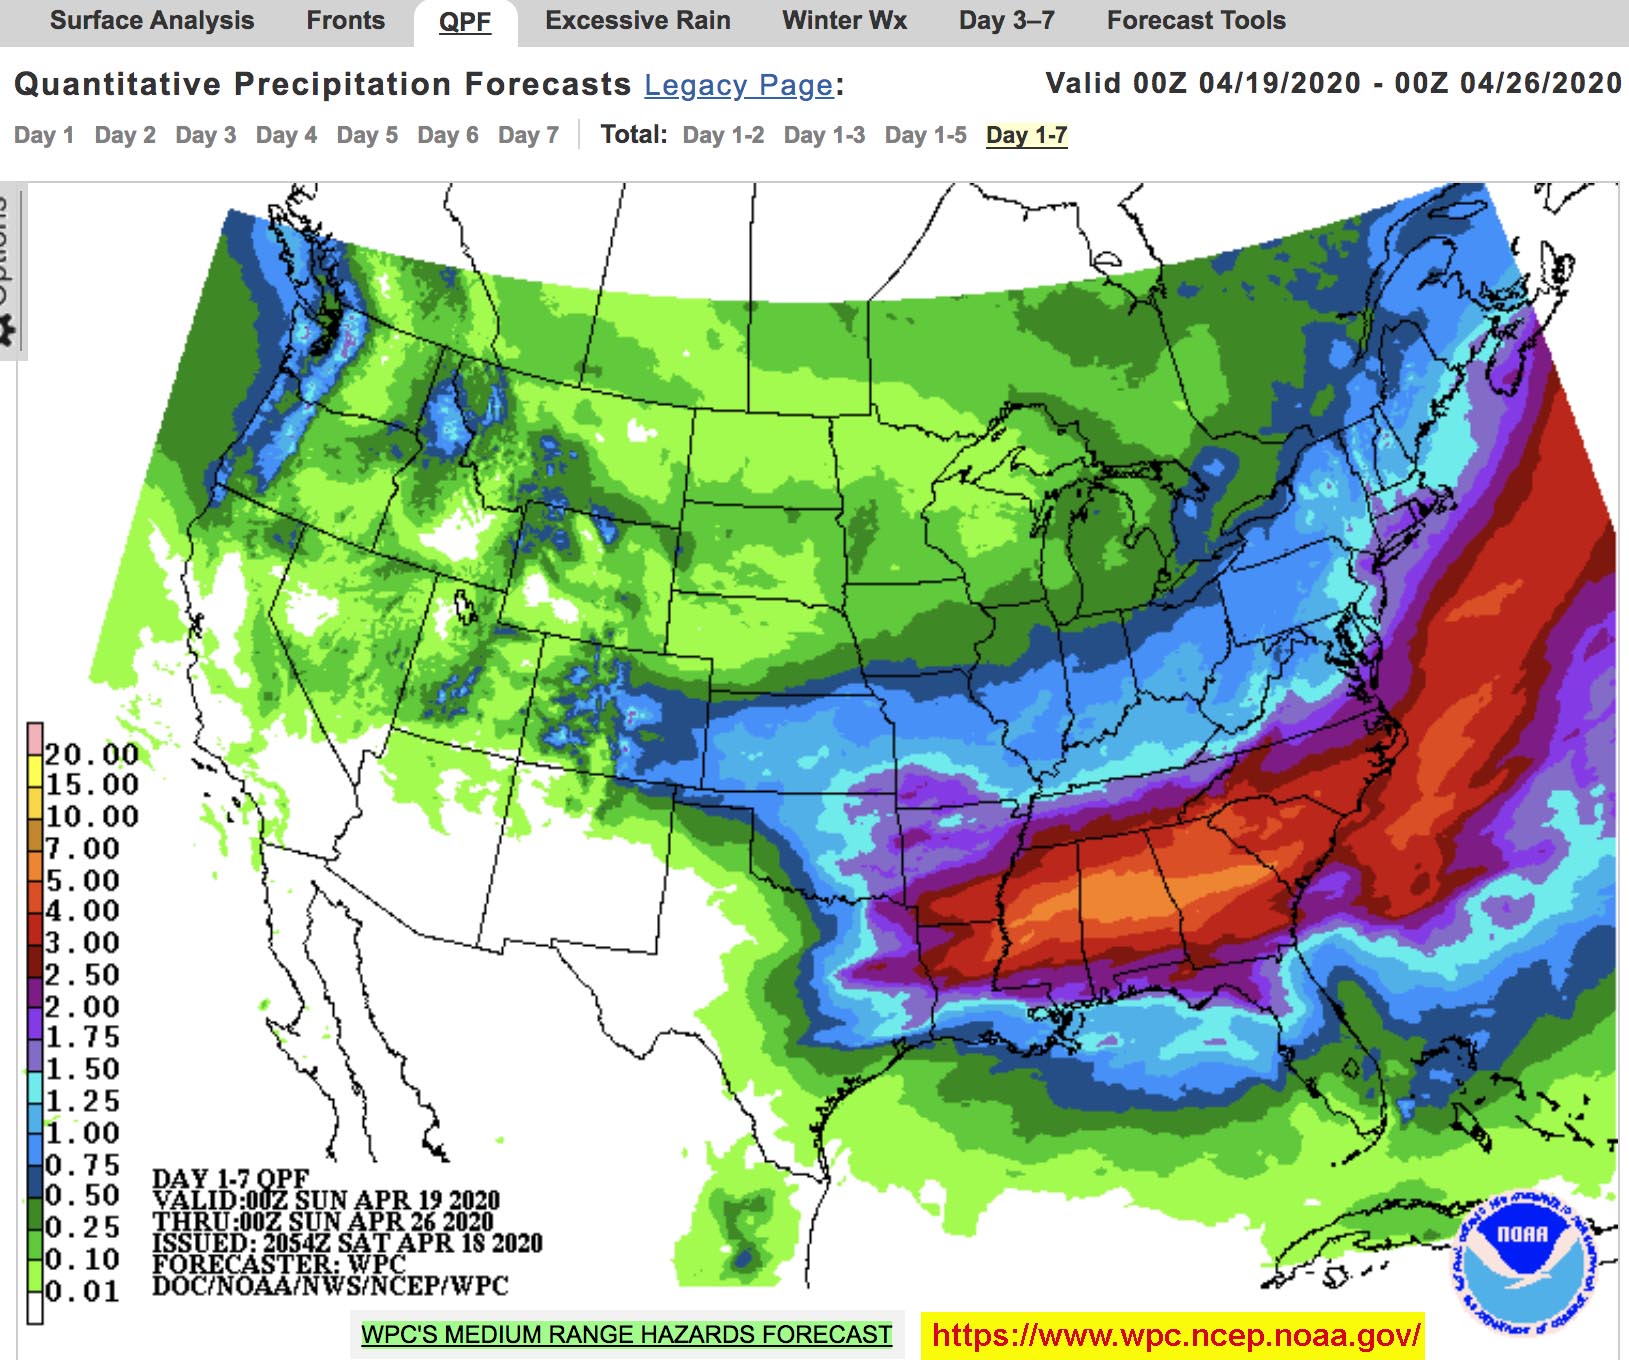 Quantitative Precipitation Forecast (QPF), Day 1-7 Medium Range-Precipitation Totals. The QFP map web page shows the progress of a storm system from 1 to 7 days in the future, showing anticipated daily and week-long totals. |
Flood Predictions and OutlooksPrecipitation data from many sources (including weather stations, radar, satellite, etc.) used to create forecasts for excessive rainfall and potential flooding. including:Excessive Rainfall Forecasts are short range (1 to 3 days) that show where abundant rainfall could lead to flash flooding and river flooding, possibly impacting farming and other social and economic activities. Significant River Flood Outlooks show river and stream areas where enough rain has already fallen and/or is predicted to fall that flood conditions are either "occurring, likely to occur, or possibly could occur." |
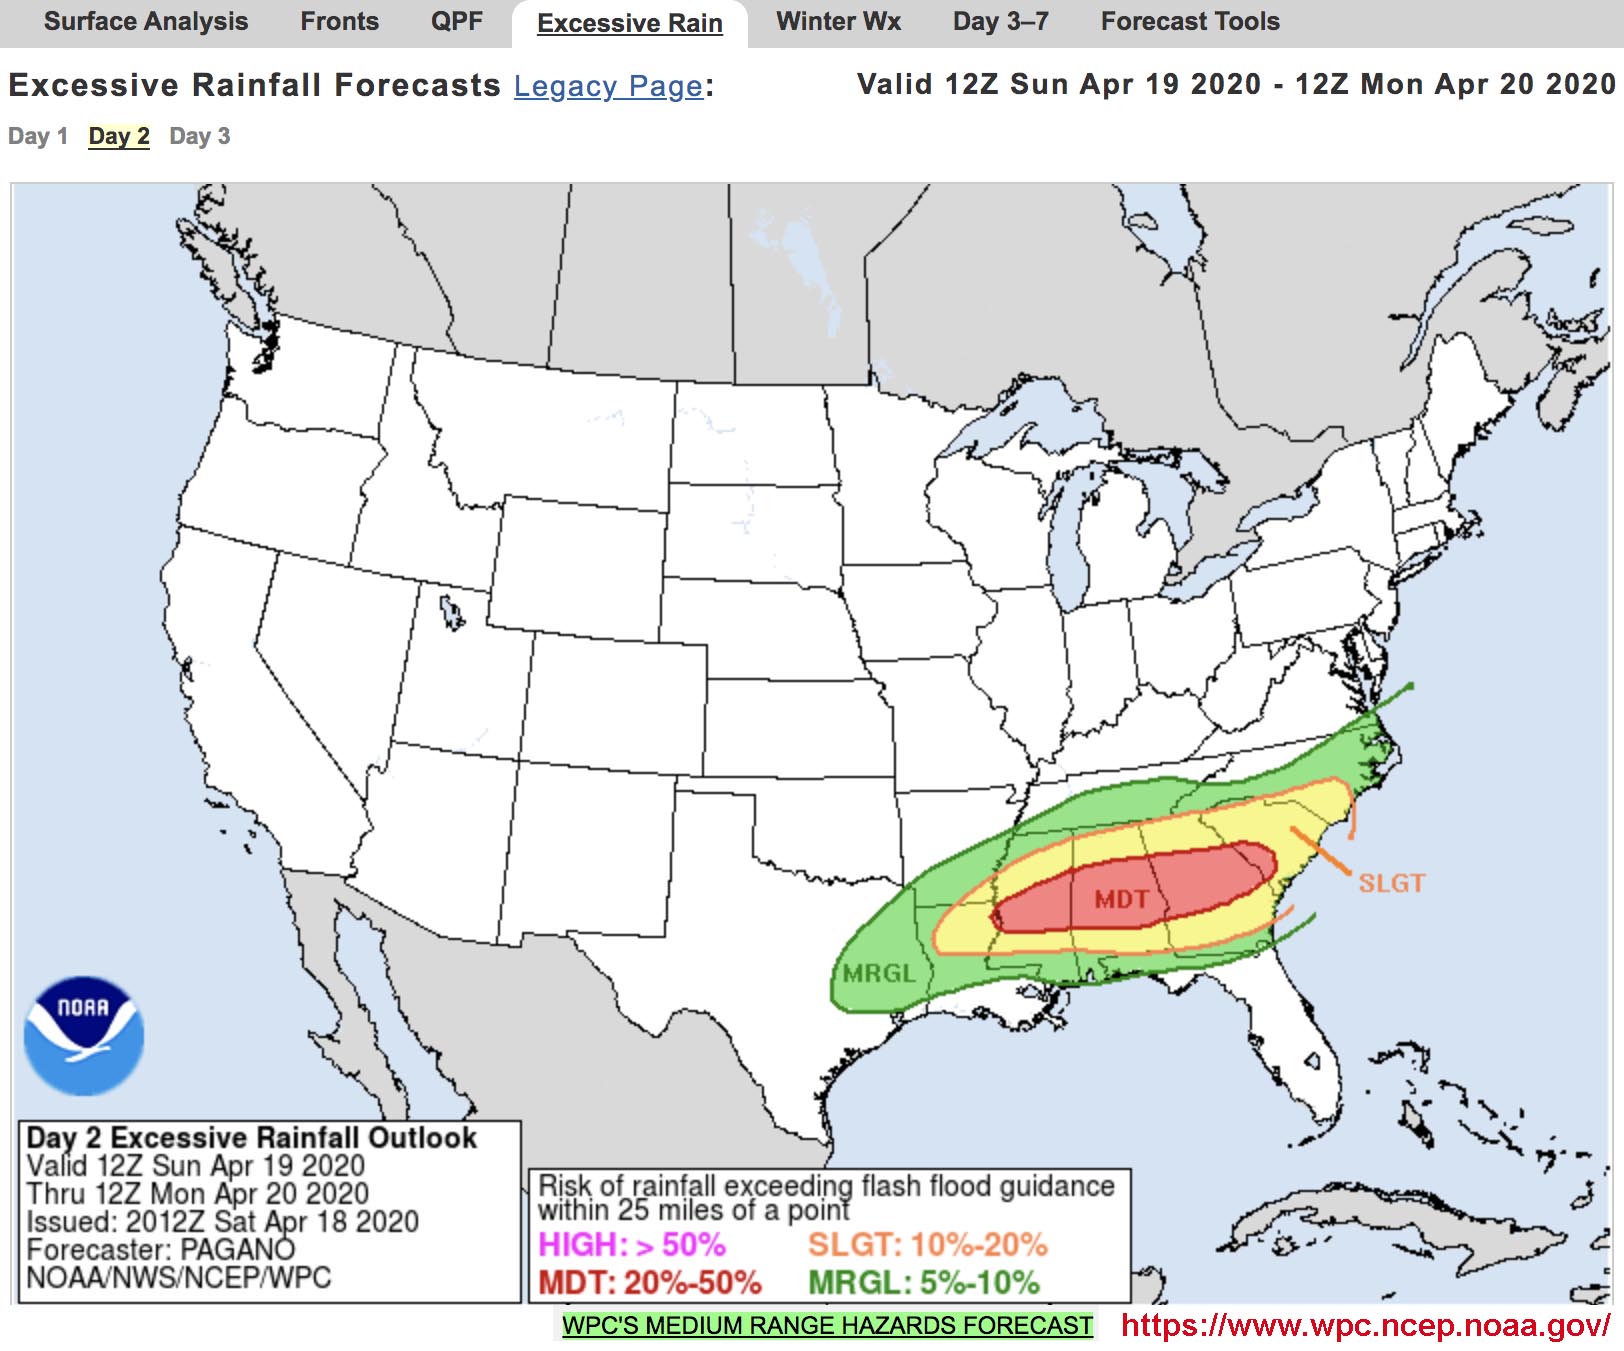 Excessive Rainfall Forecasts Short Range - 1-3 Days |
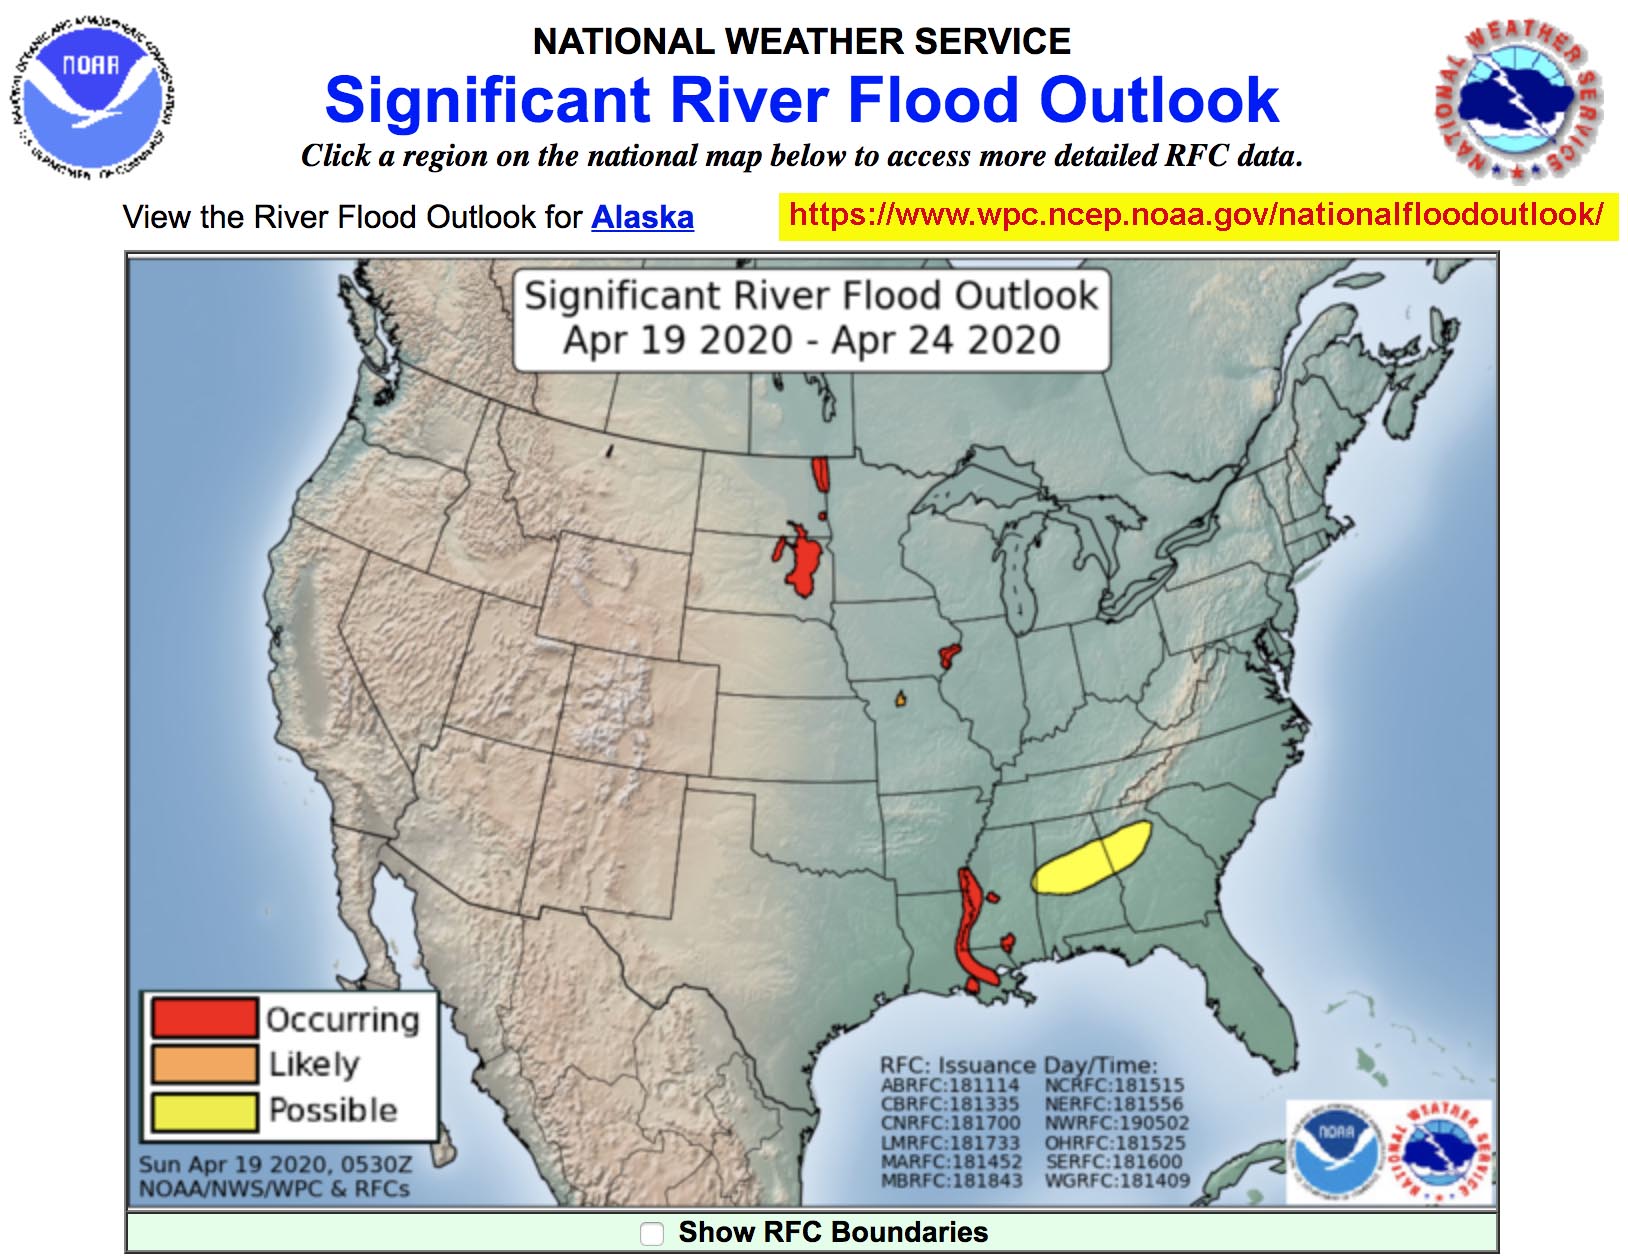 Significant River Flood Outlook Short-Range Outlook Map |
Flood Gauge InformationPrecipitation leads to the flow of water into streams and rivers. The U.S. Geological Survey, Water Resources Division maintains over 9,000 https://www.usgs.gov/mission-areas/water-resources around the country to monitor stream flow. All the stream gages are calibrated to determine projected flood levels. Flood stage is the water level, as read by a stream gauge or tide gauge, for a body of water at a particular location. Flood stage is measured from the level at which a body of water (stream, river, lake, or ocean-source storm surges threatens lives, property, commerce, or travel. Each stream gauge has a predetermined flood stage measurements given as a height above or below the zero level. |
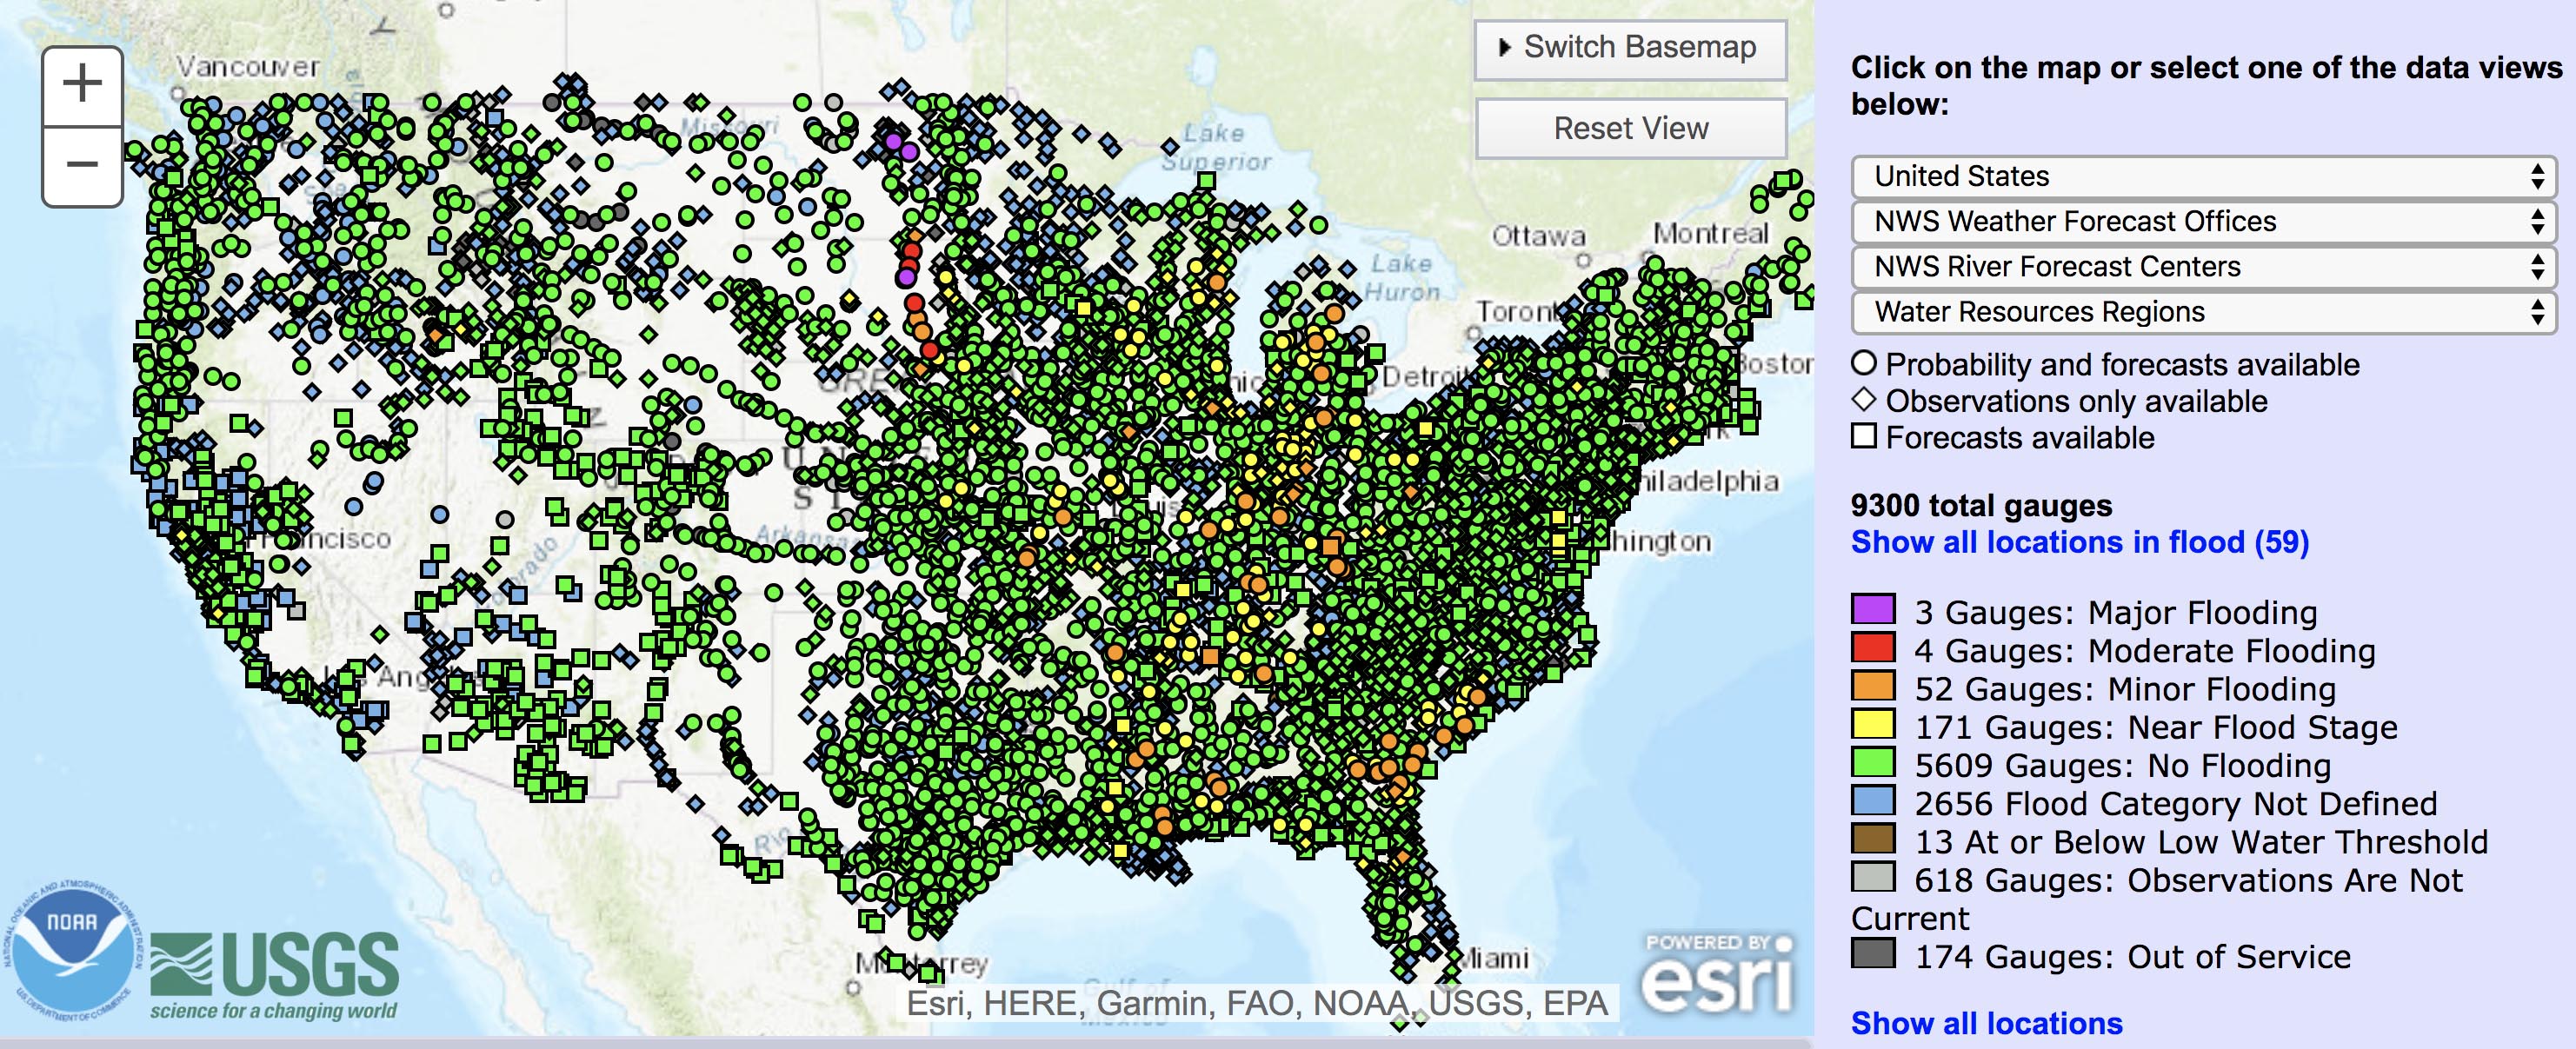 The NWS/USGS River Observations website provides links to stream level conditions (flood stages). |
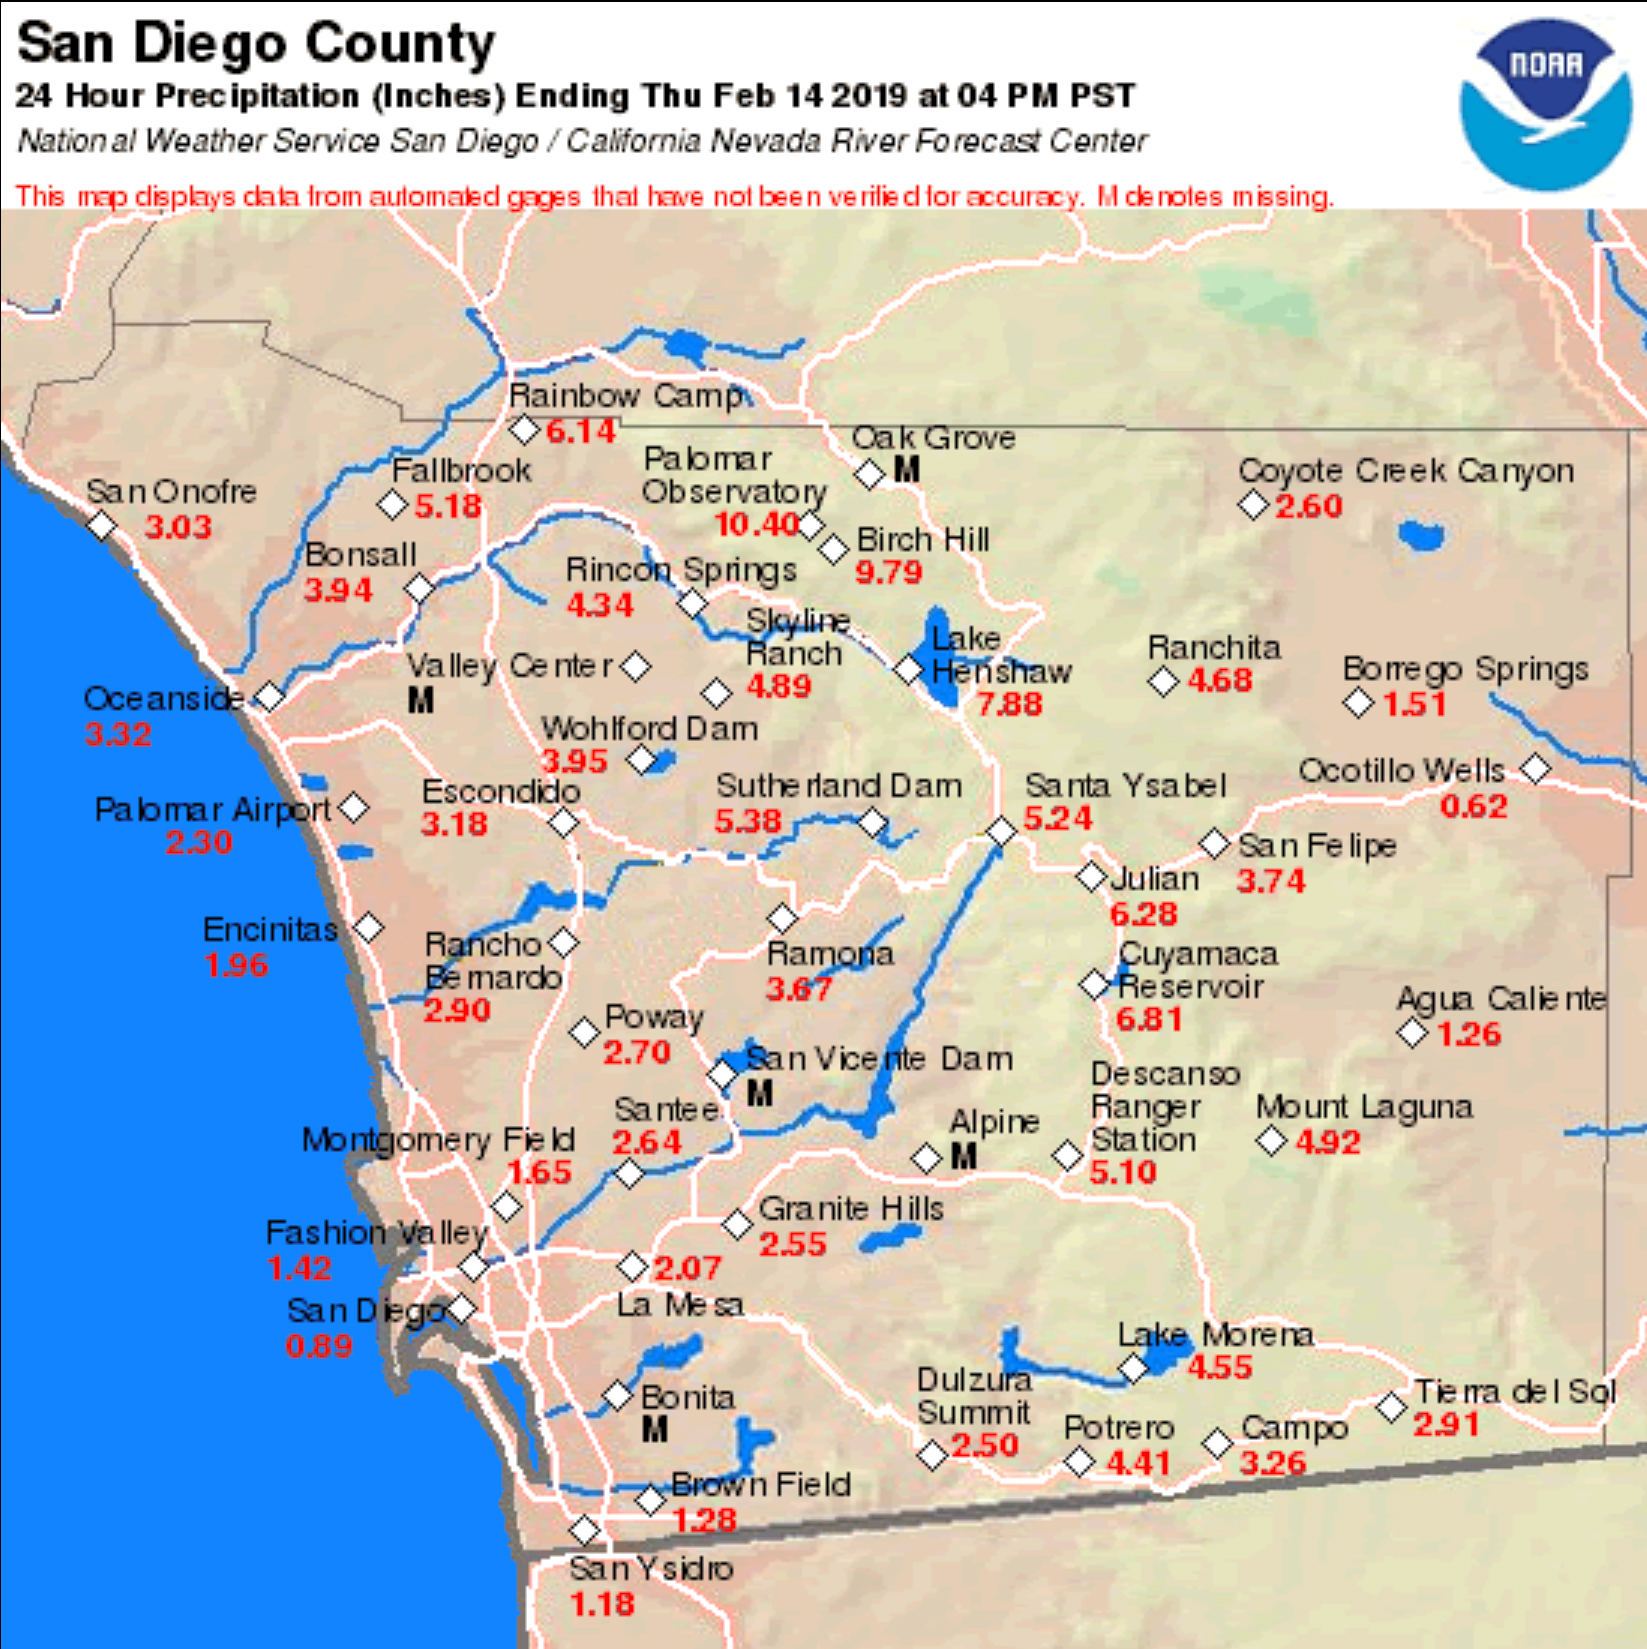
| Example of a flood gauge record: Early April, 2020 was a very rainy period in San Diego County. The region got nearly its annual amount of rain fall in the first two weeks of the month. Between April 5th and 10th was a period of the heaviest rainfall with much of the county receiving 6 inches along the coast to about 10 inches in the mountain region. The resulting flood on the San Luis Rey River peaked just before midnight on April 10th. The stream gauge data shown here was captured on April 11, about 2 hours after the picture of the river was taken. Based of previous observed floods on the river and the recorded rainfall of past storms, a computer-generated forecast of stream flow is added to the plot. Plots like this are used to predict flash flooding and flooding of low-lying areas along rivers throughout the country. |
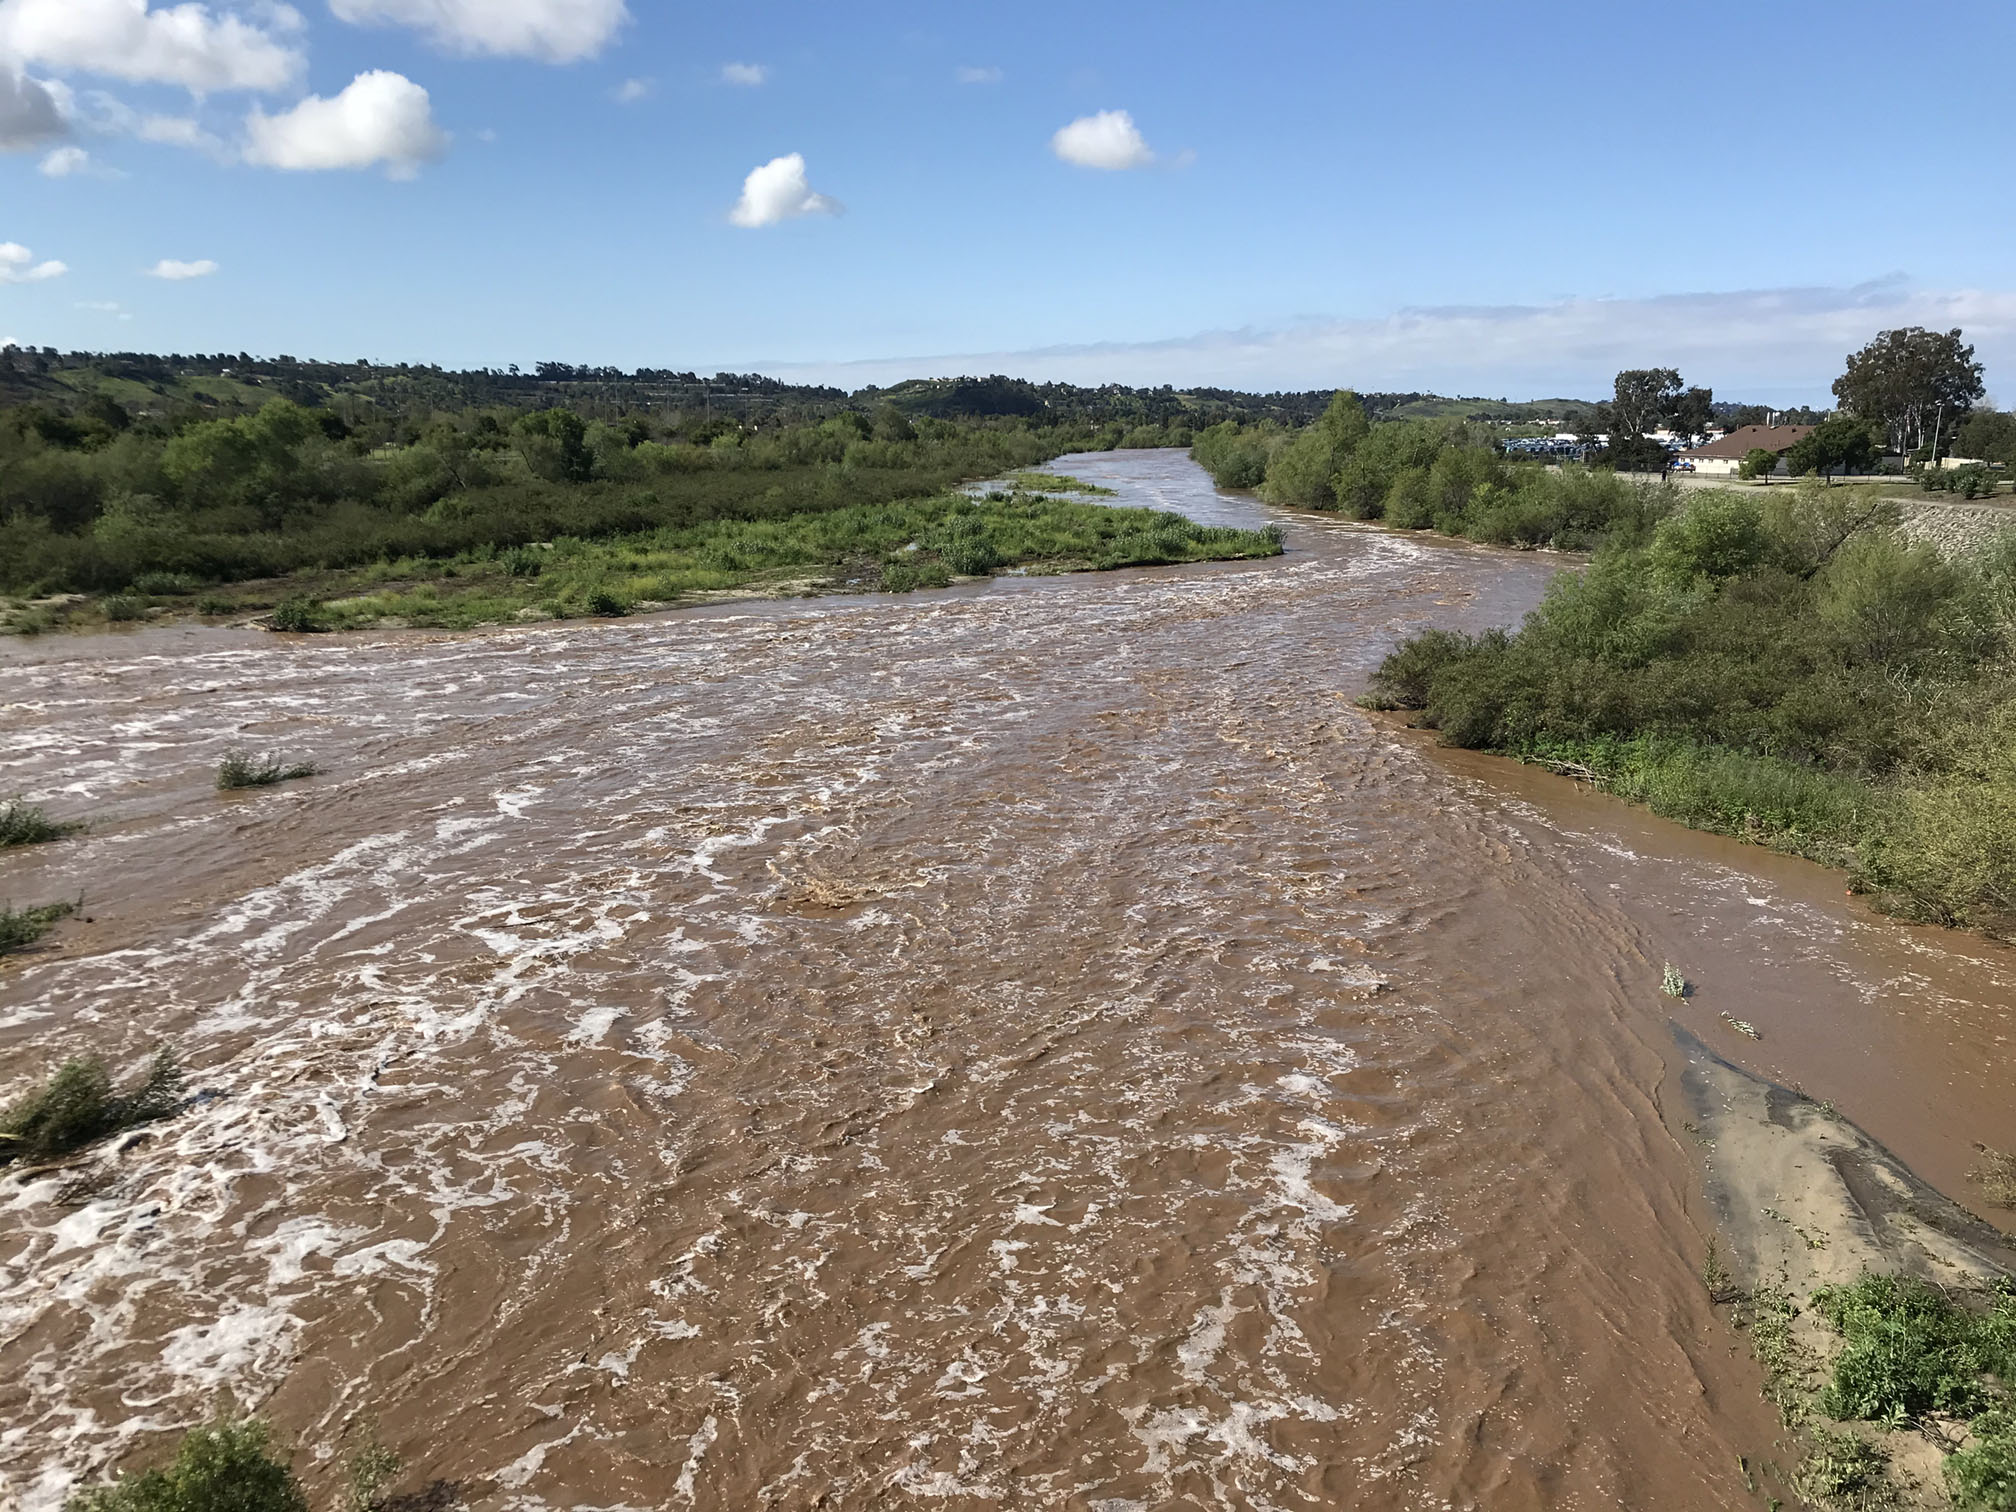 Flood on the San Luis Rey River in Oceanside, CA near peak flow on April 11, 2020. |
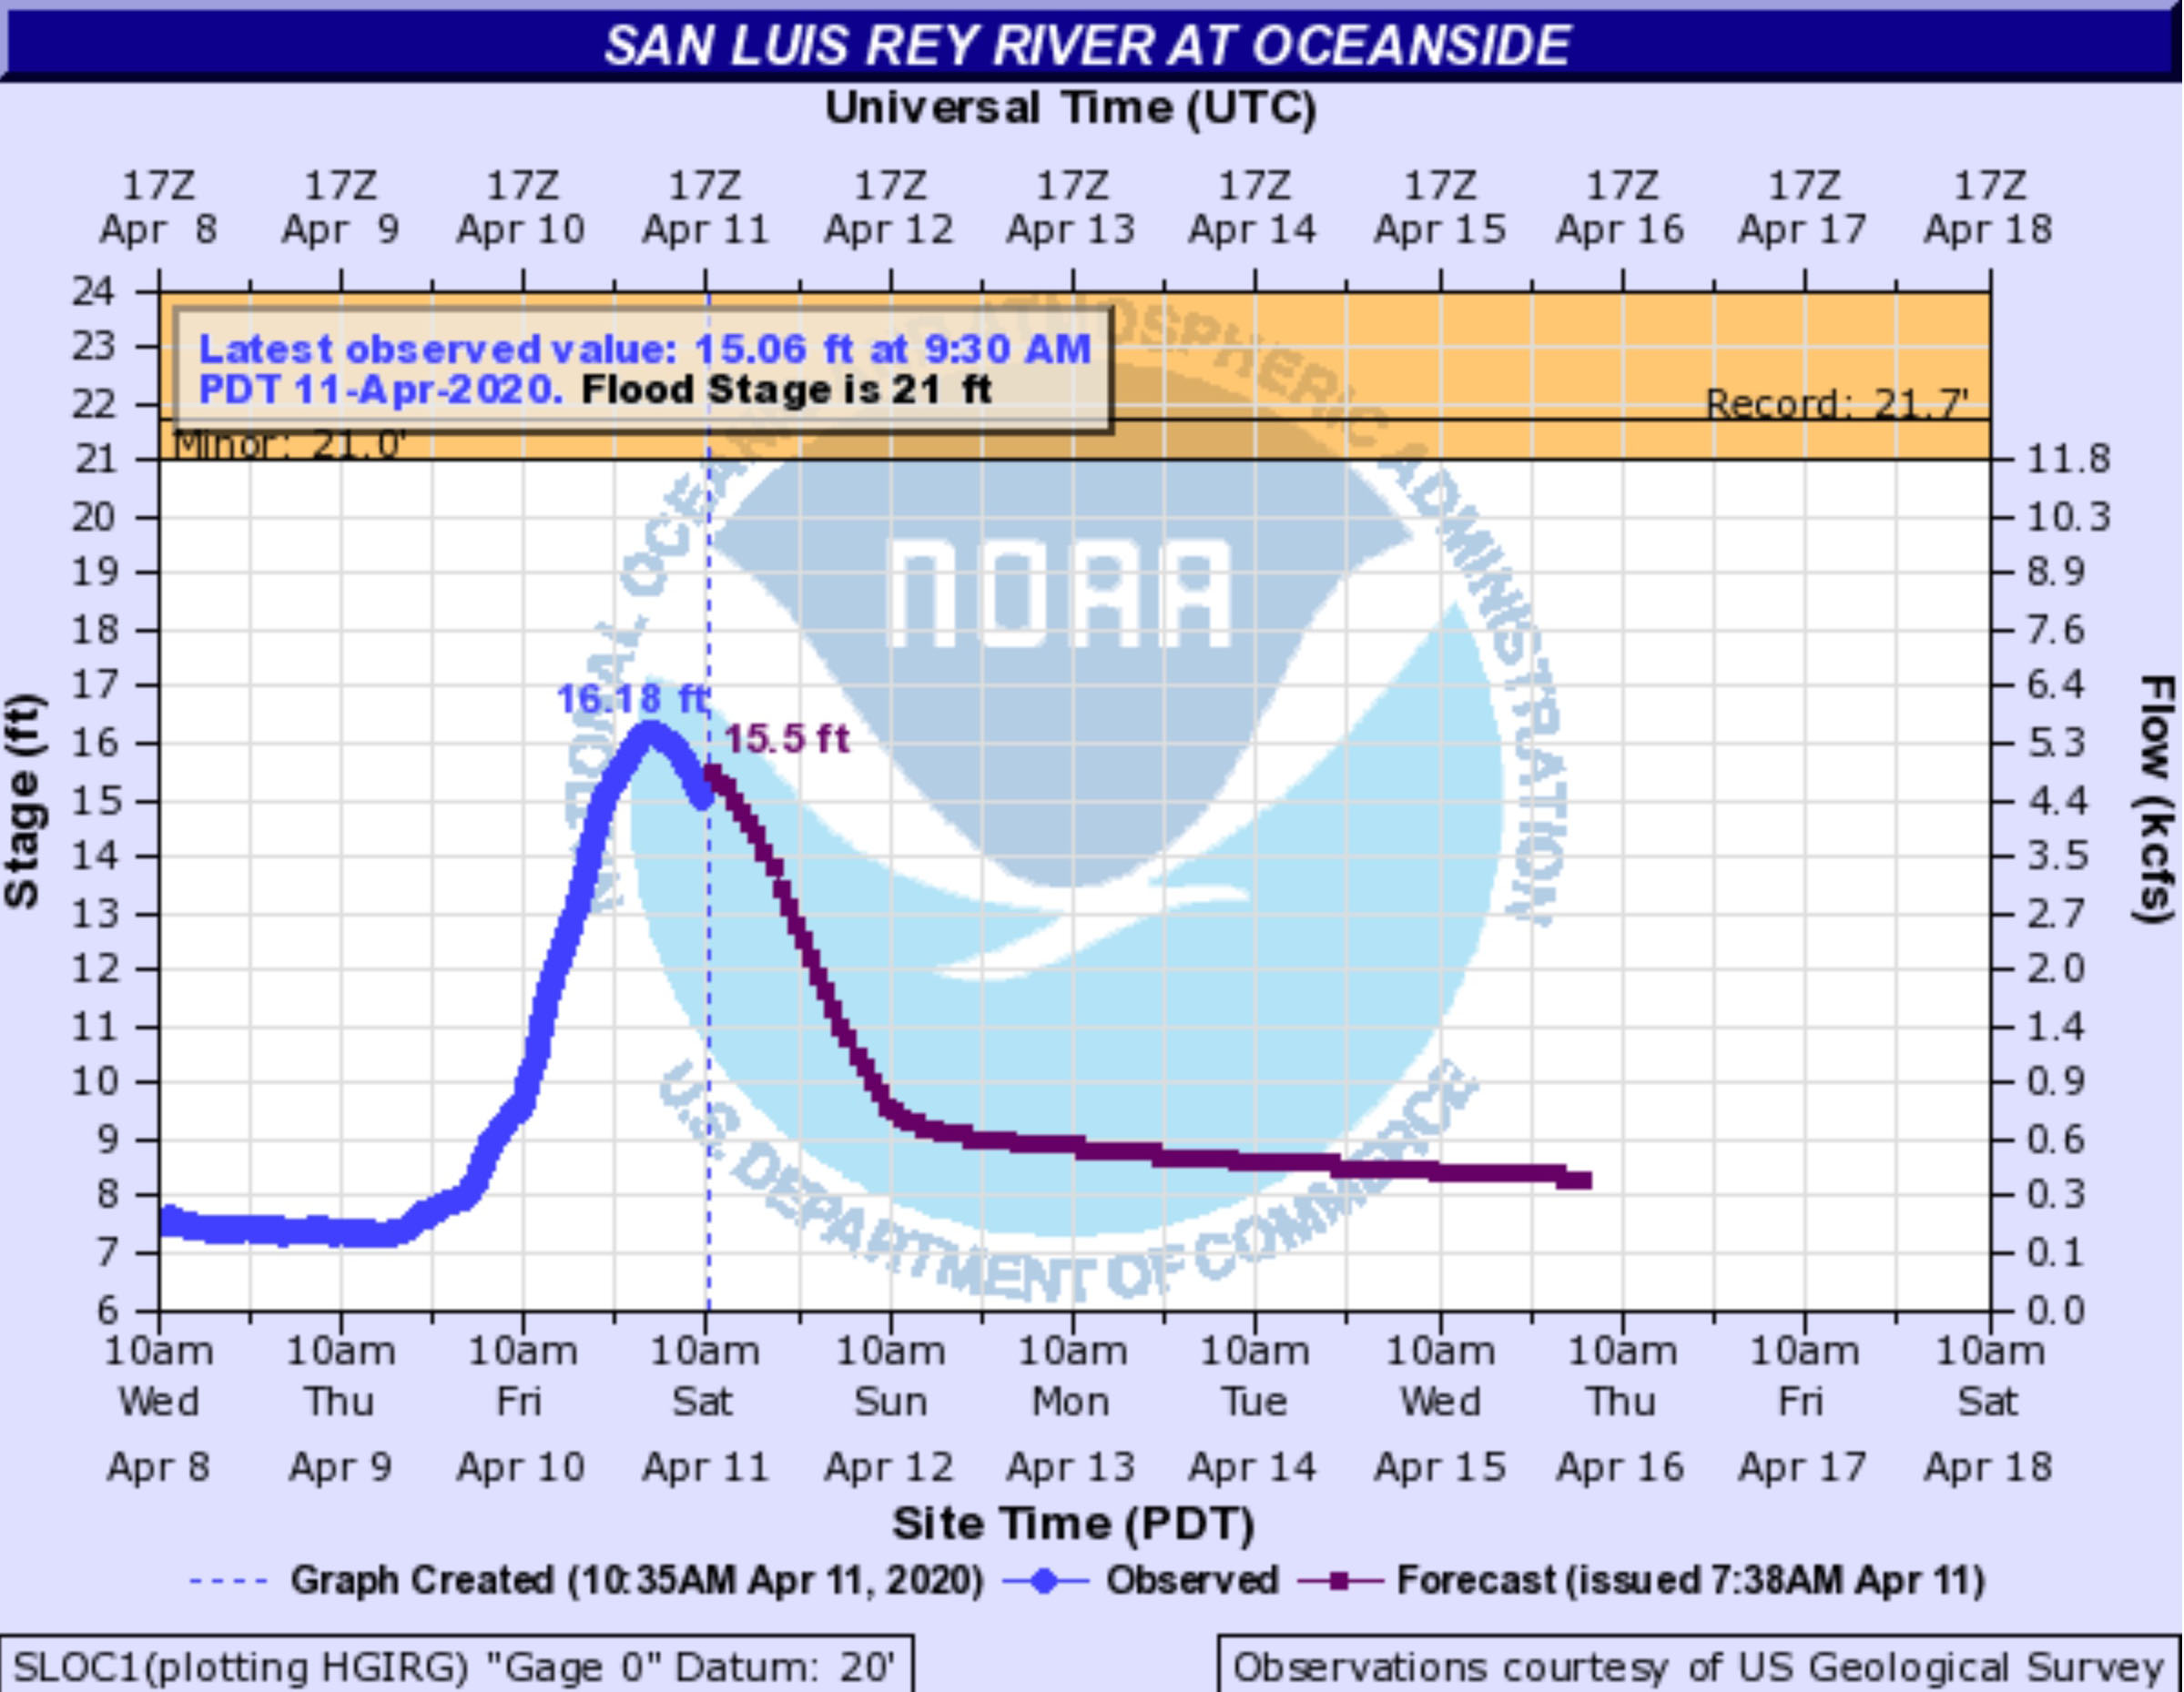 Example of a flood-gauge plot showing observed flow (blue) and predicted flow (purple). |
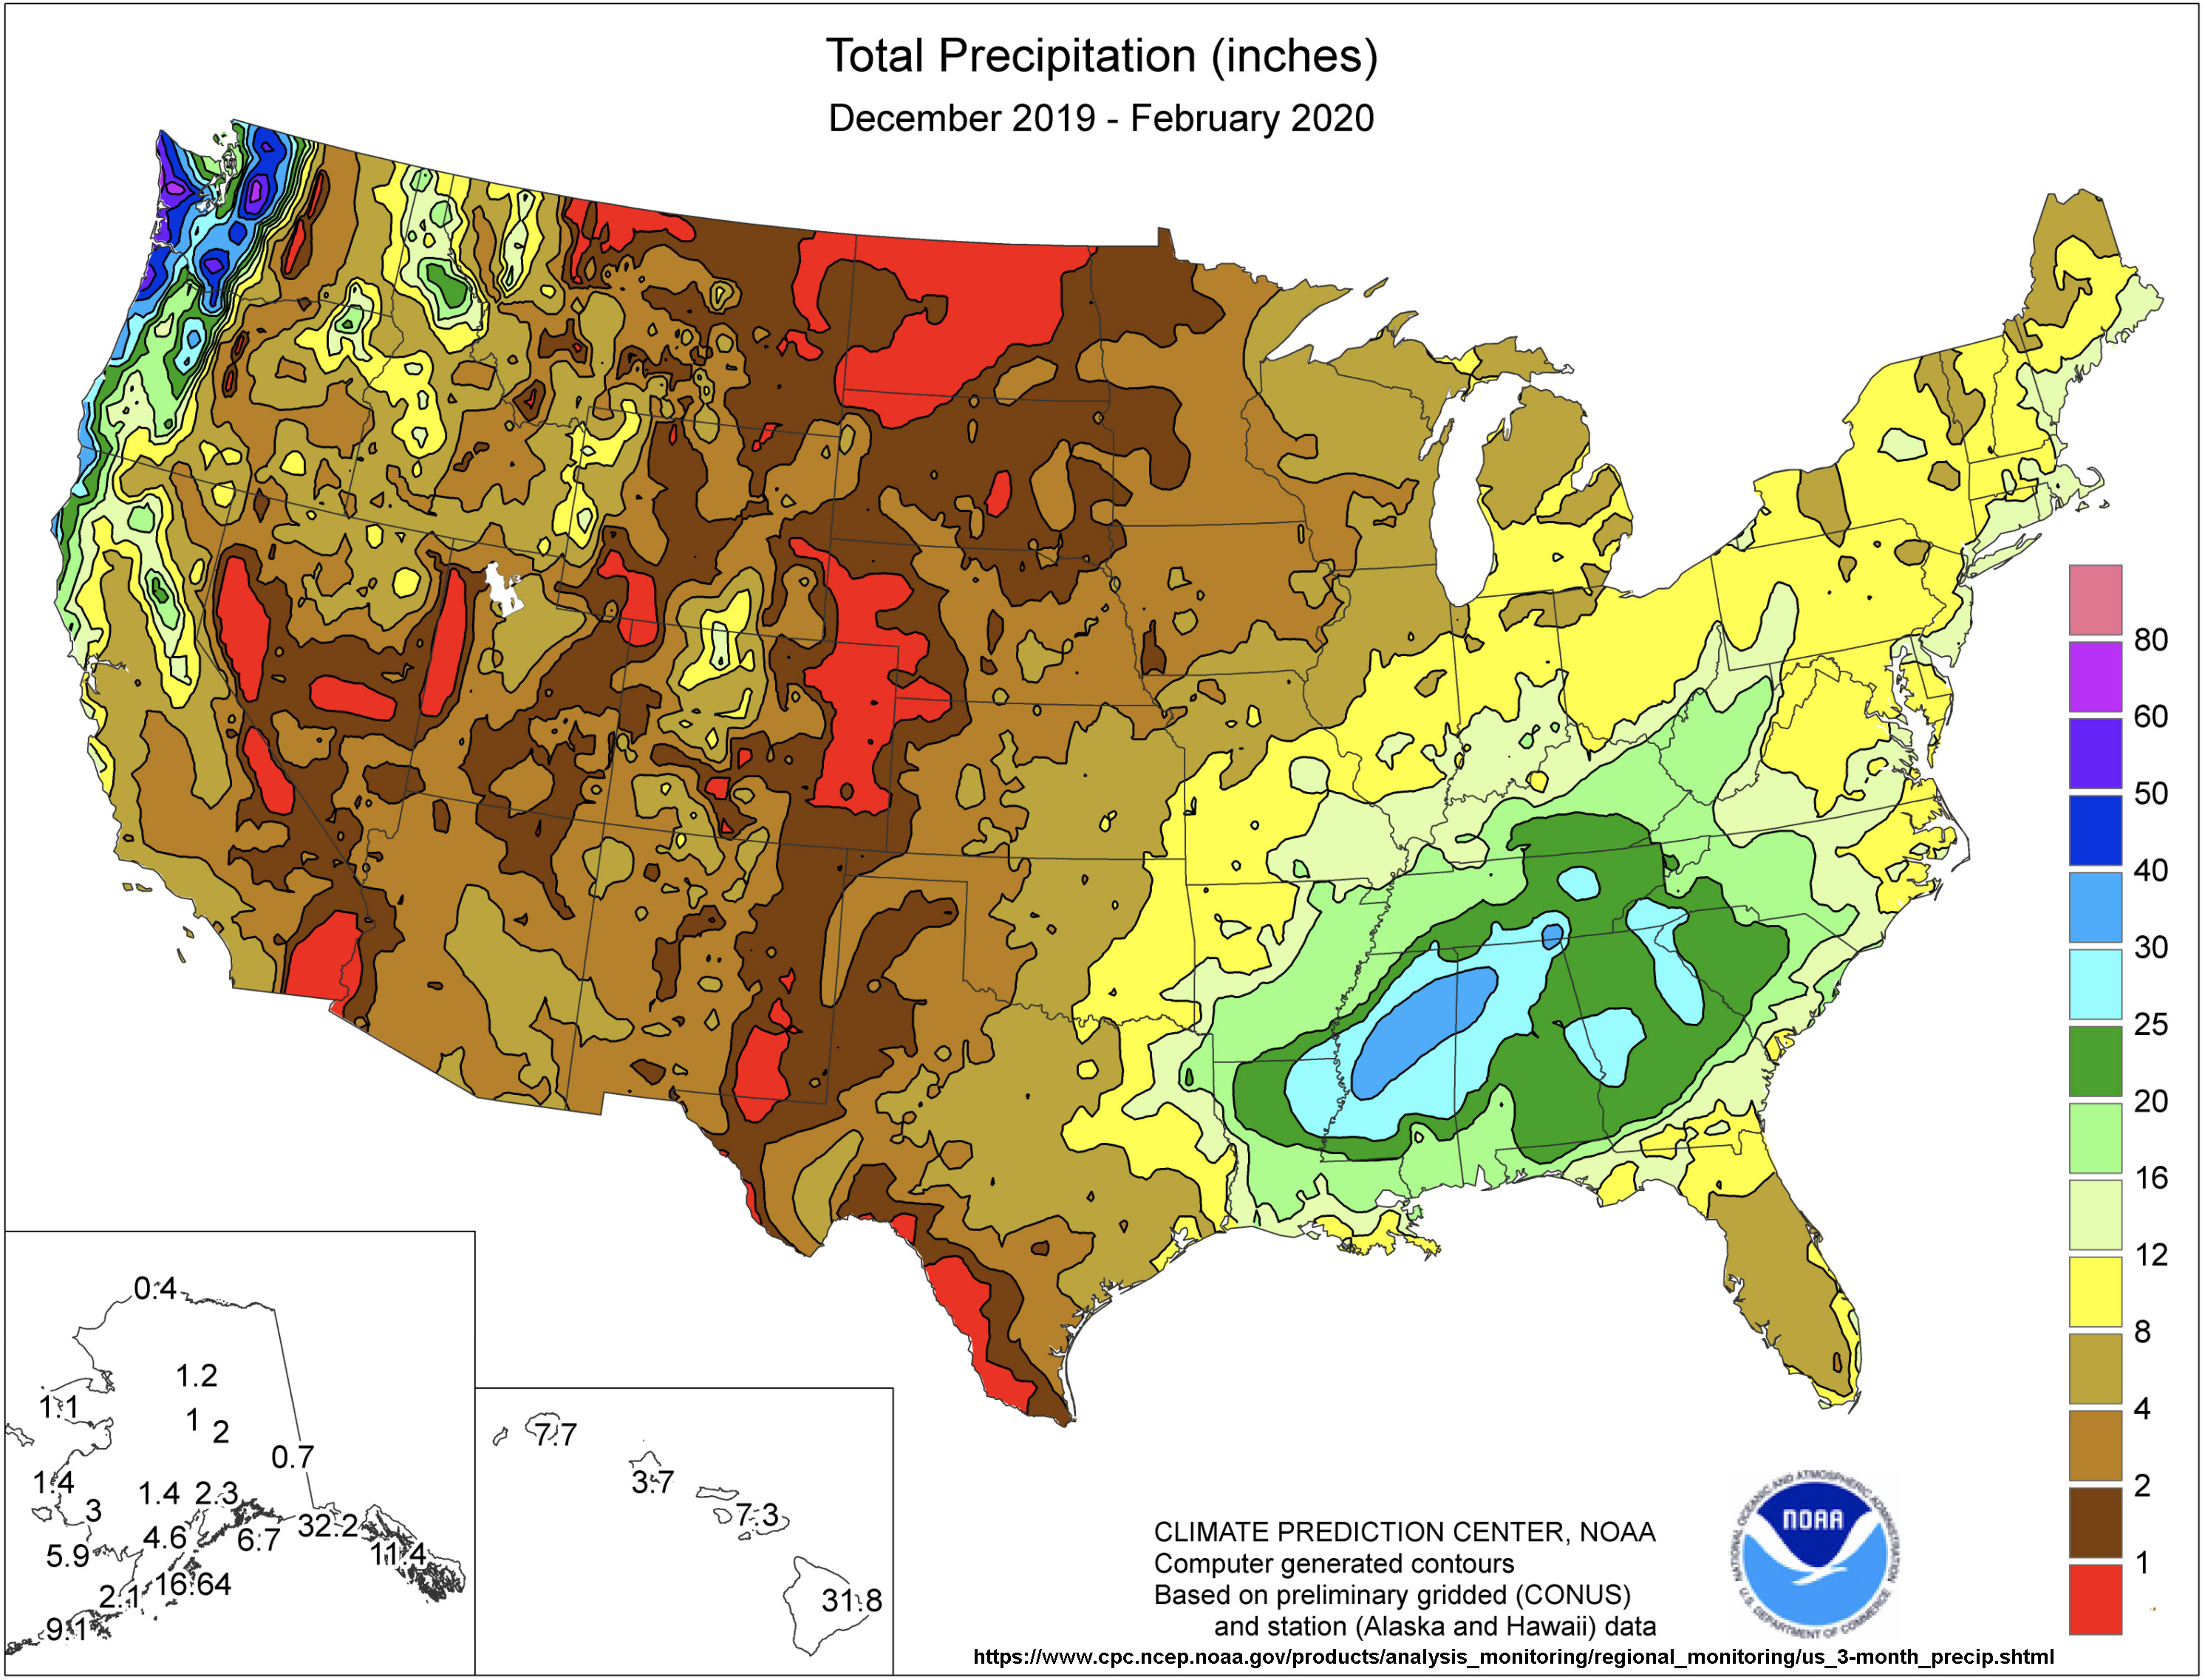
Changes in Rainfall PatternsStudying how rainfall patterns have changed for a season or one year to the next is extremely important for many reasons. Changes in precipitation can reflect potential drought or flood conditions happening in a region. The NWS compiles databases of temperature and precipitation data from weather stations and satellite data for manipulation for long-range forecasting. The top two maps show here show the total amount of rainfall that occur in a recent year and the next one shows the average amount of rainfall for the same period of time from previous years (in which precipitation data is available).The bottom maps show the percentage of change in the amount of rainfall that regions have received and the next one shows the departure from normal amounts of rainfall for that 60 day period of rainfall. The 60-day precipitation maps data show regions that may be susceptible to flooding or drought conditions. This is very important information for agriculture, supply management concerns, and flood advisory for low-lying communities. Note that the links below each of the maps show the current weather map data. |
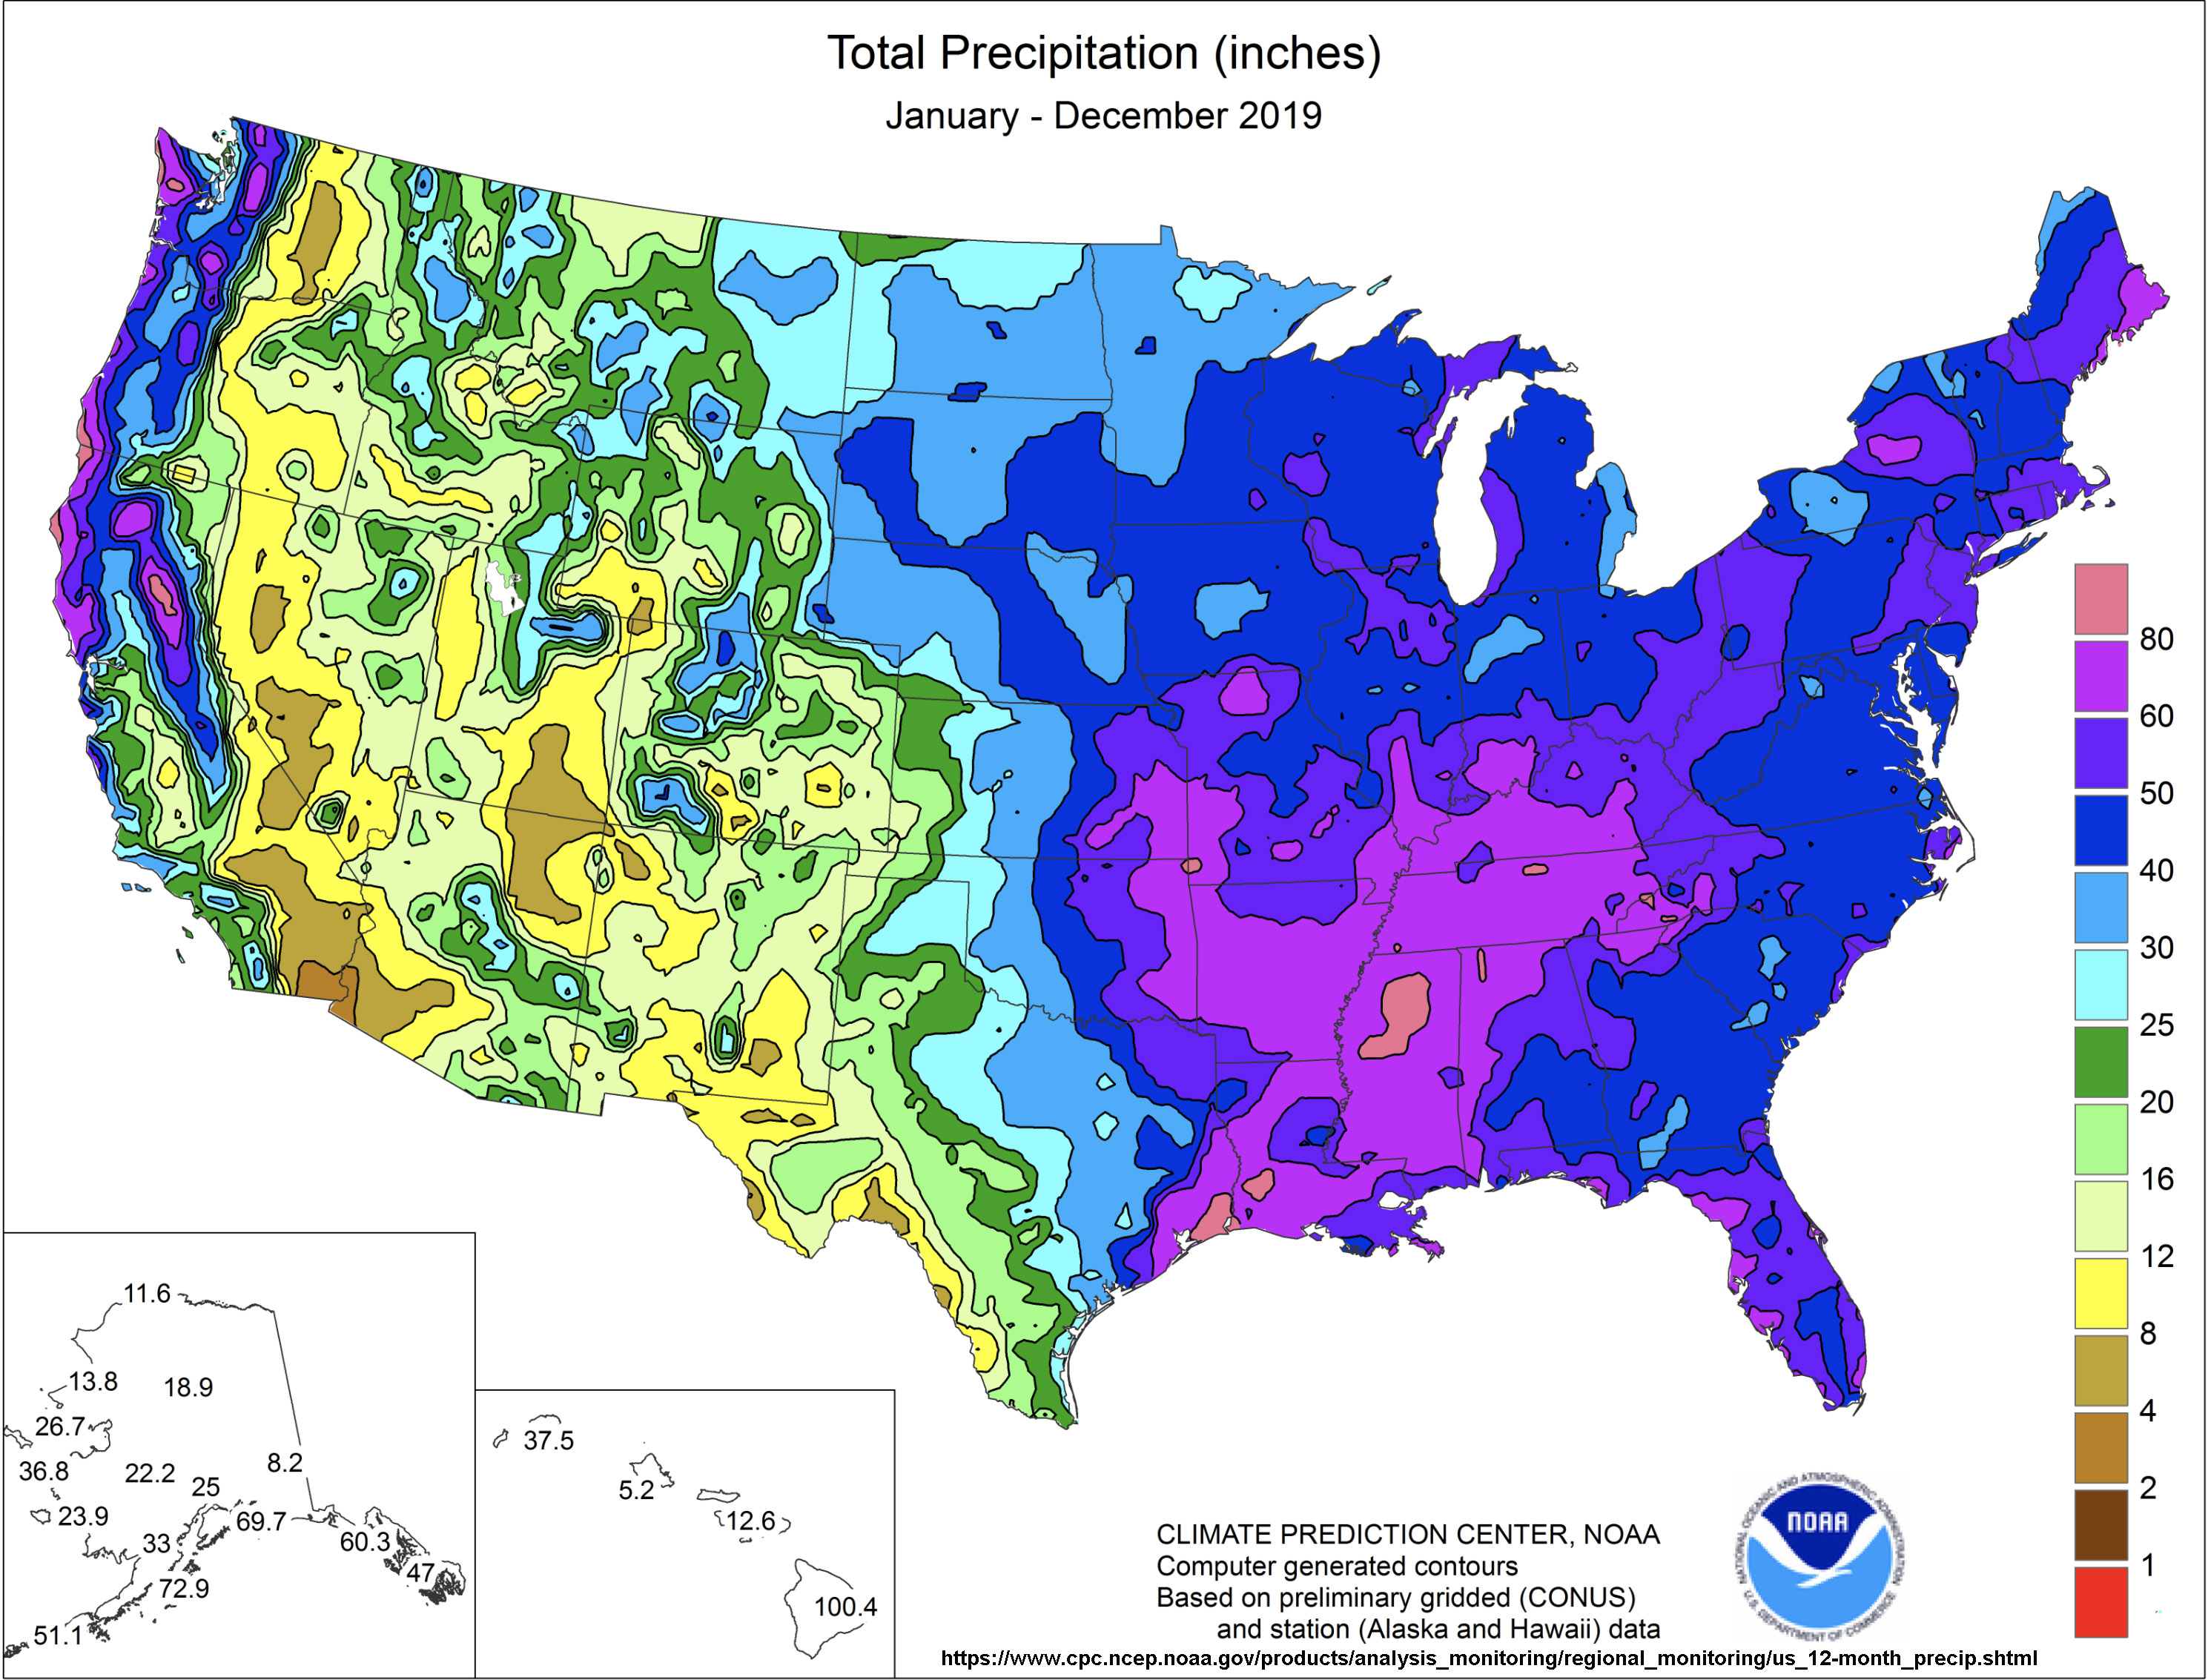 Total Precipitation (inches) |
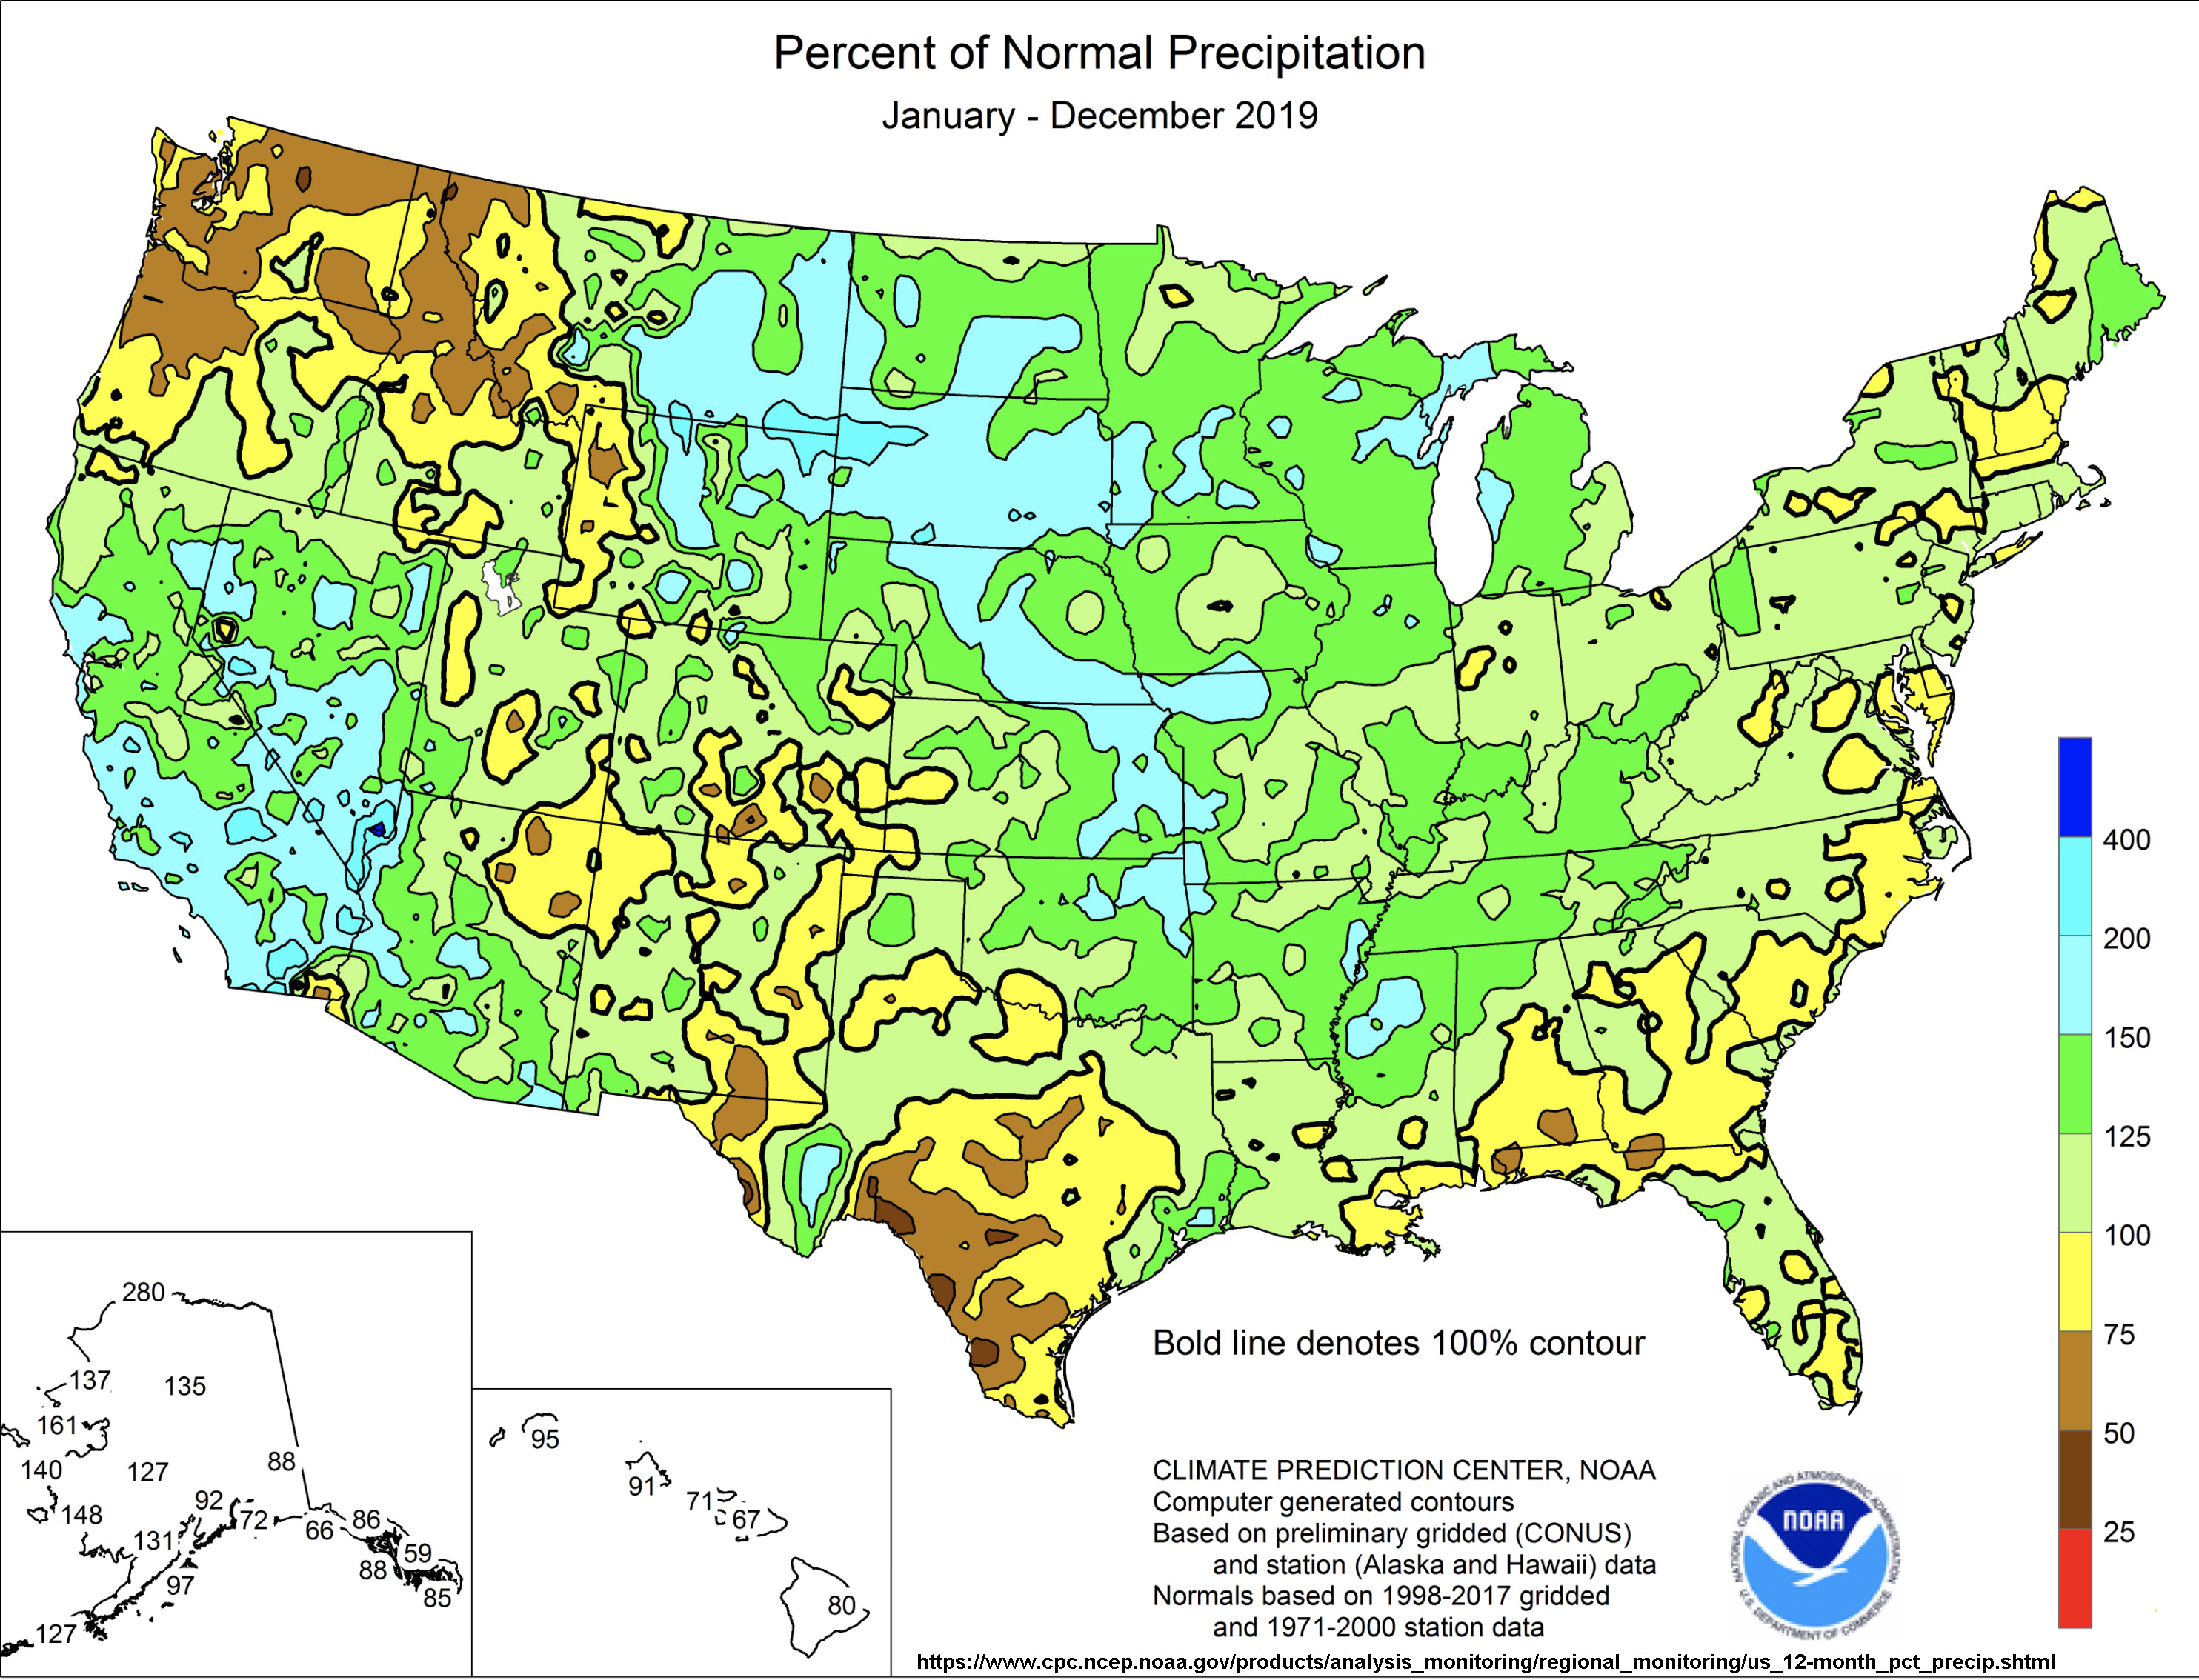 Percentage of Normal Precipitation |
 3-Months Precipitation |
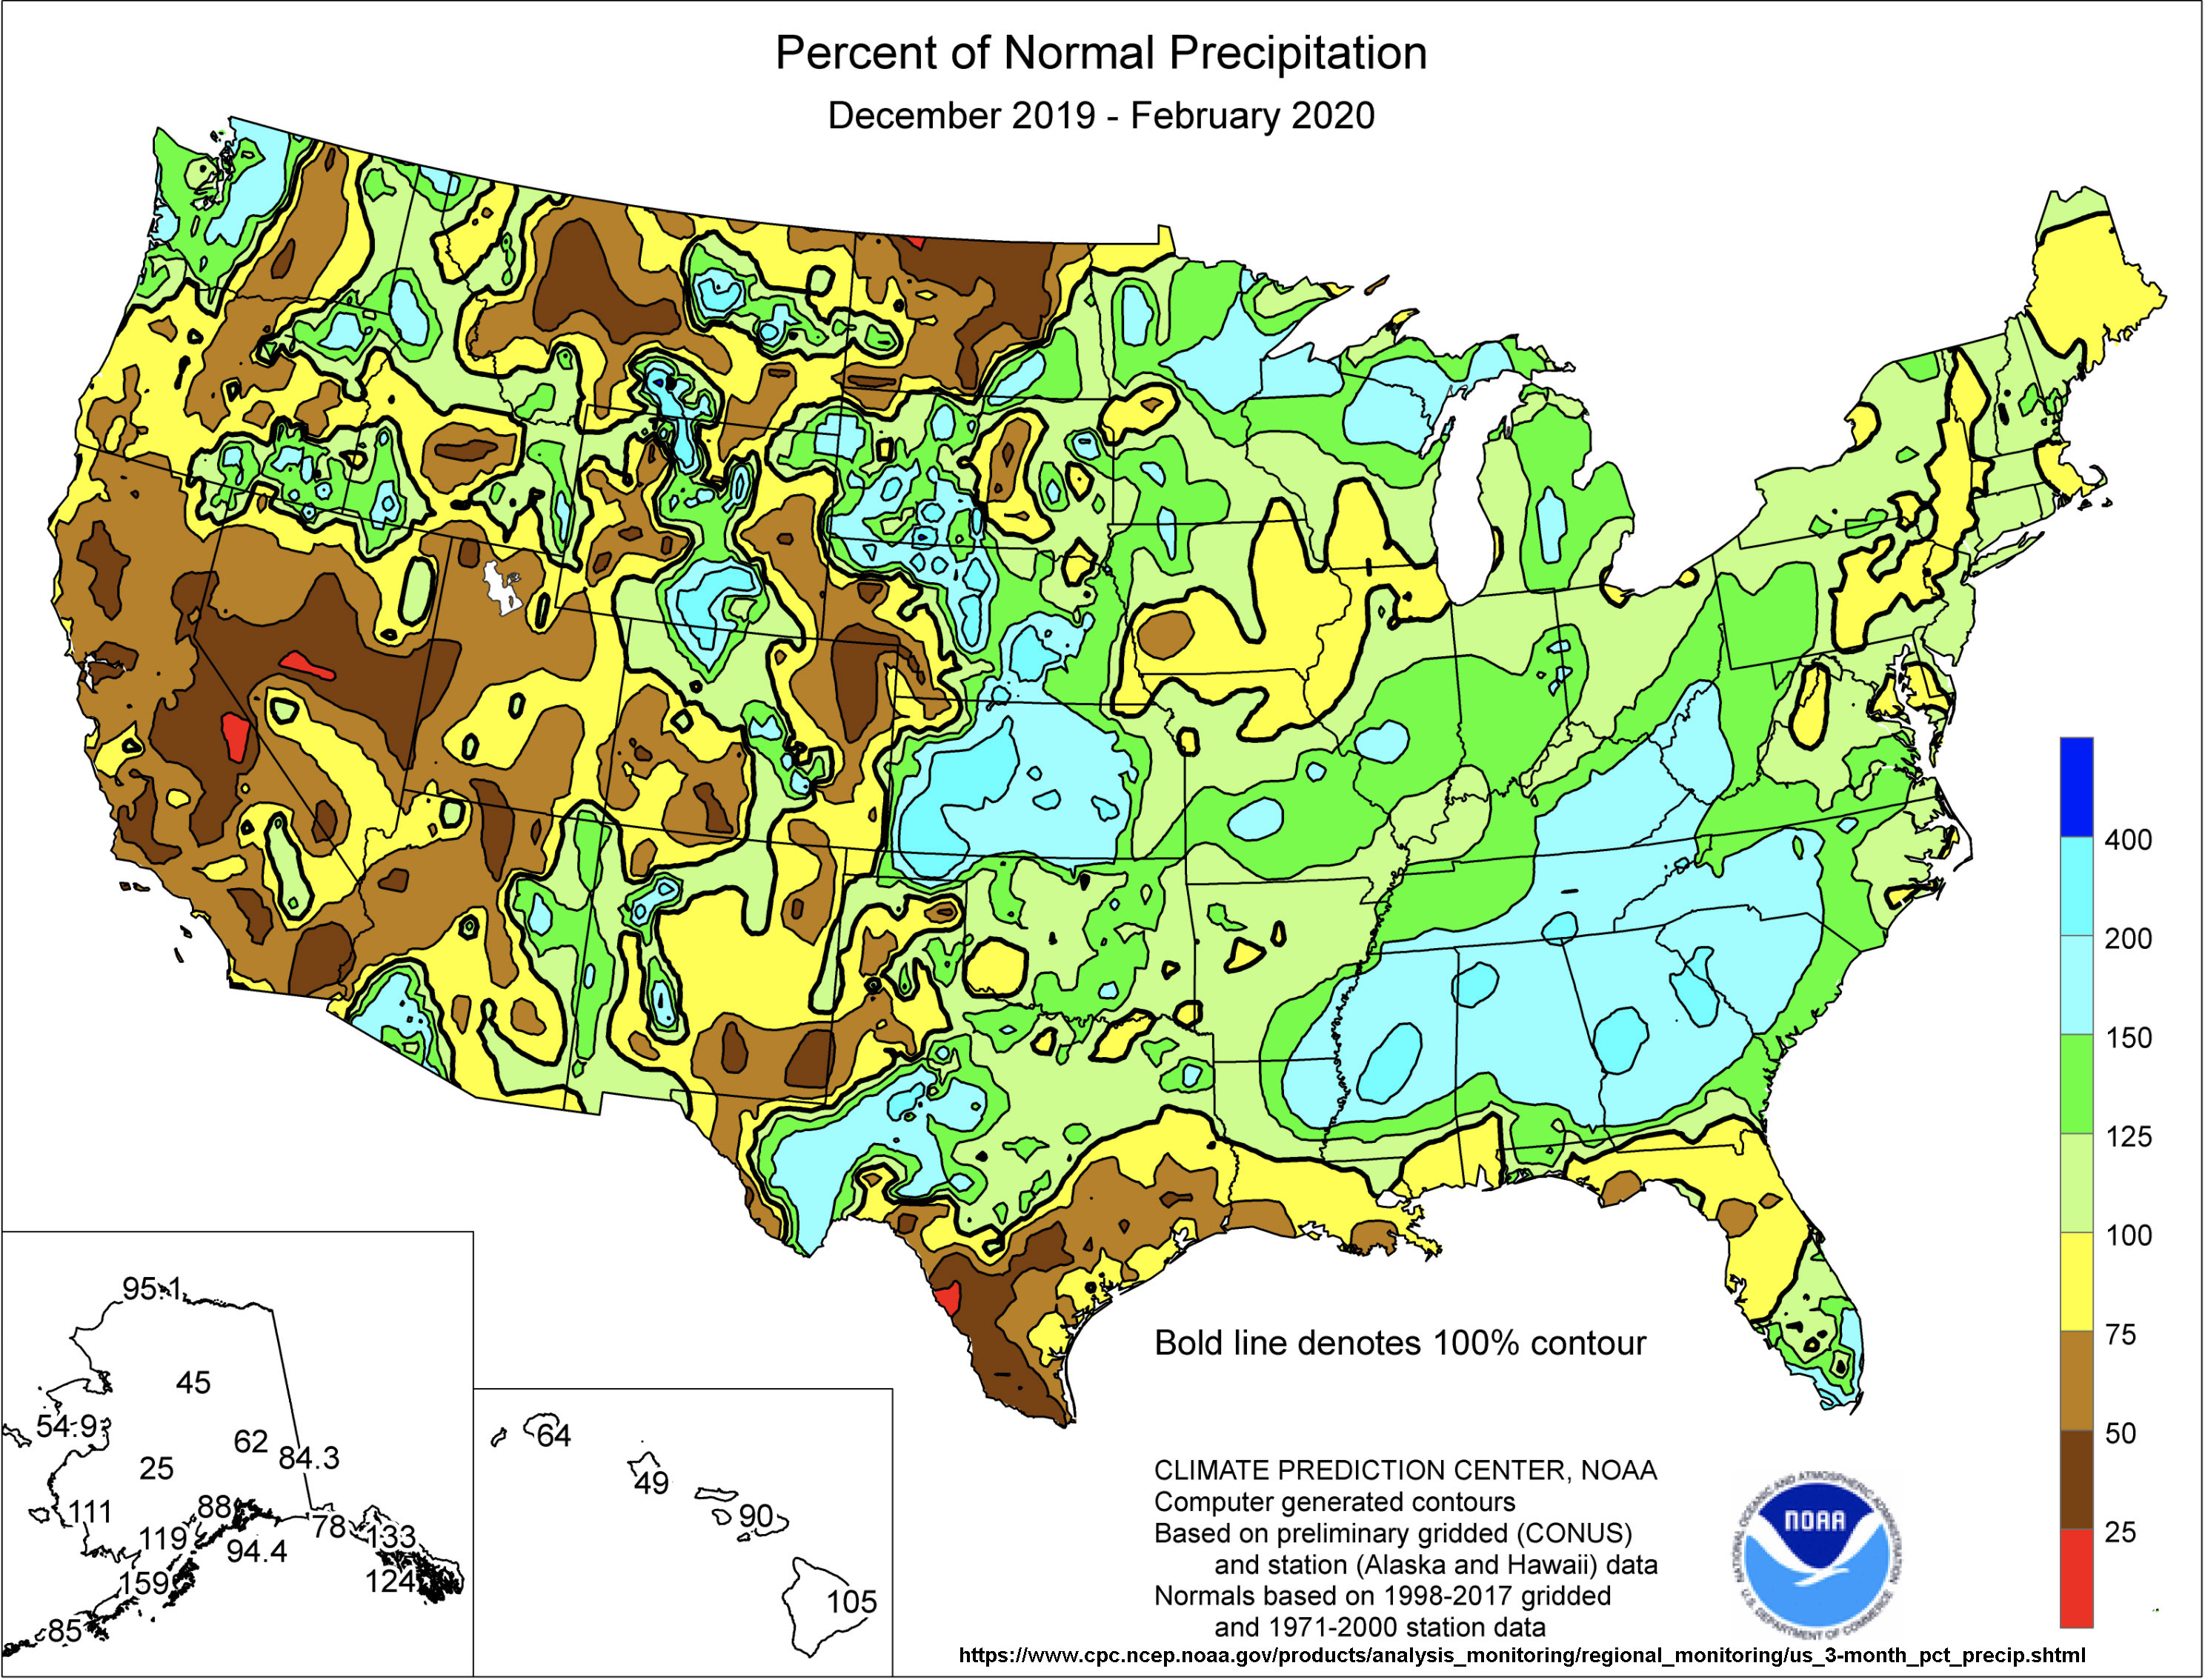 3-Months Percent of Normal Precipitation |
Weather Satellite ImageryThe United States has supported a robust program for putting weather-observing satellites into space. The overall effort has cost billions in tax dollars, but that cost has been a tiny fraction of the payback it has offered to society in relation to weather and environmental monitoring. NOAA and NASA have collaborated on the development of the Geostationary Operational Environmental Satellites (GOES) series of satellites. The first satellite GOES satellite was launched into space in 1975. As of 2020. seventeen satellites have been launched with 2-3 being operational at any point in time. The geostationary position of the satellites roughly 22,000 miles above the planet allows for weather satellite coverage of the entire United State and vicinity. Click here to learn more about the GOES satellite program. |
 |
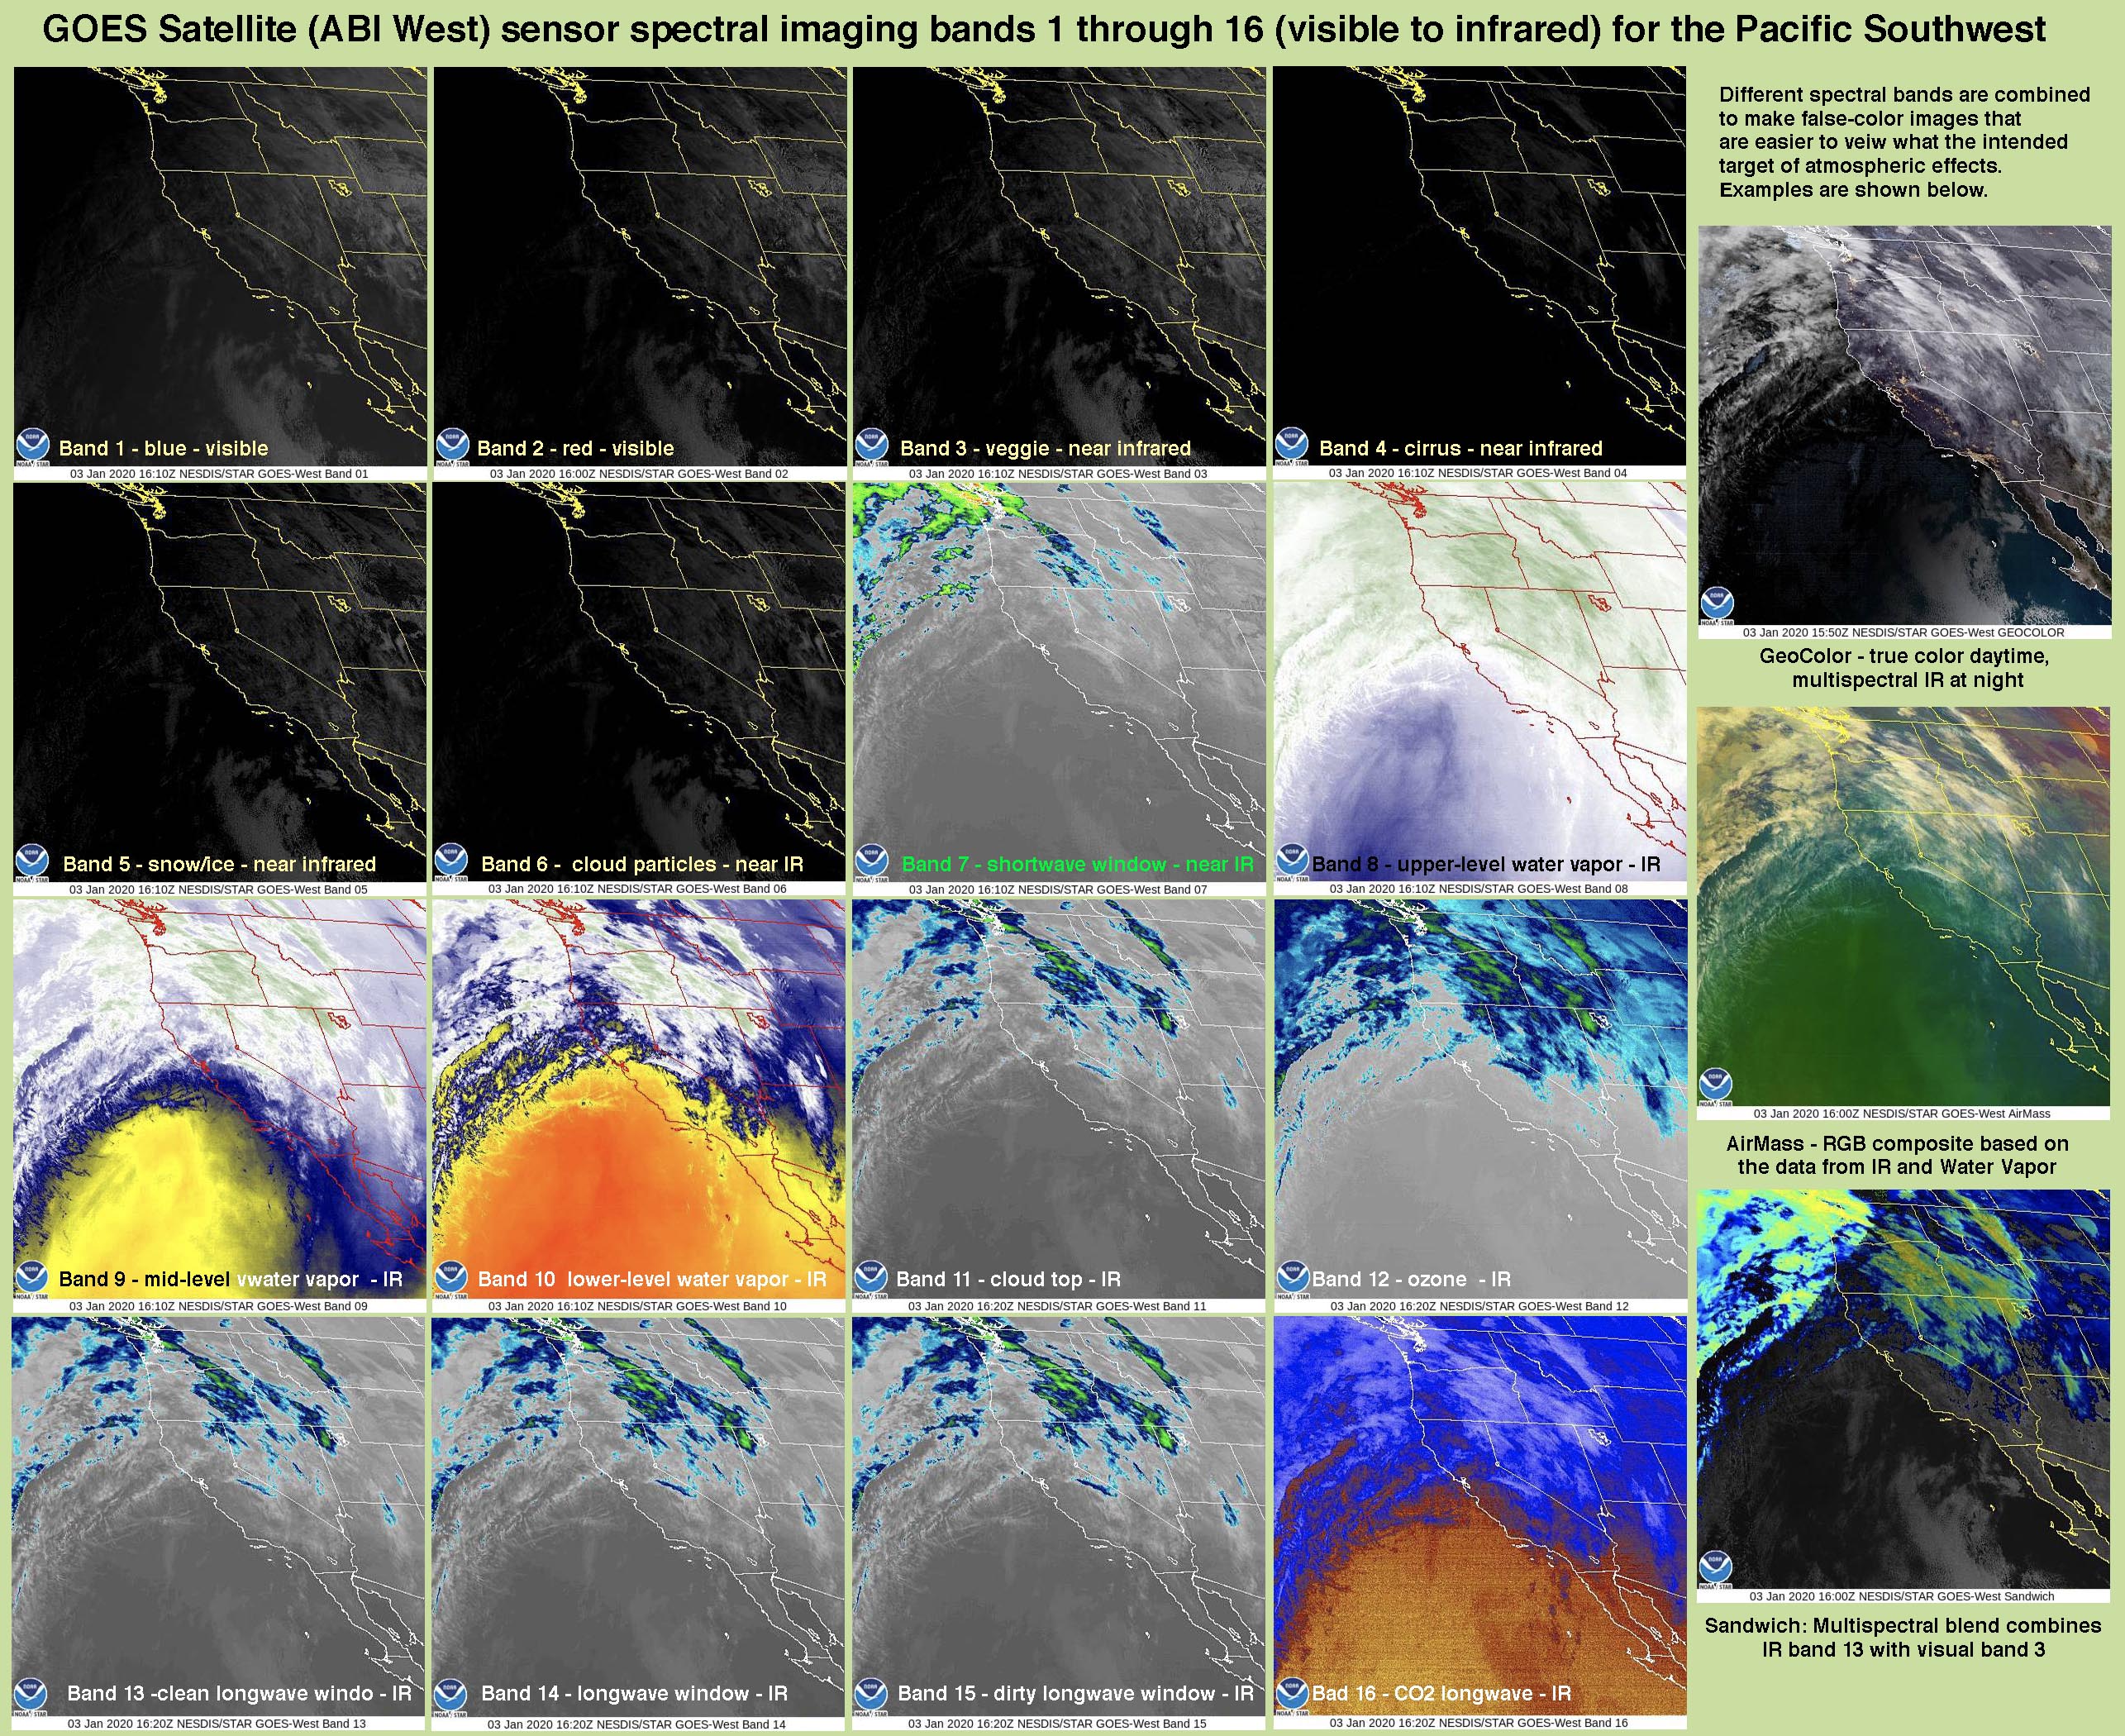
GOES Satellite Advanced Baseline ImagingSatellite imagery can be used in conjunction with weather station and radar information to create a more comprehensive view of storm systems as they move across the country. GOES stands for "Geostationary Operational Environmental Satellite." The GOES-R series satellite has ABI (Advanced Baseline Imaging sensors) can capture 16 different spectral bands (illustrated to the right), with two bands in the visible part of the electromagnetic spectrum, four in the near-infrared, and ten in the far infrared (longer wavelength frequencies of IR). These different spectral bands can be used to differentiate different types of precipitation (fog, rain, snow, ice), dust and pollutants (including ozone and smoke), cloud cover, cloud tops, and water vapor in different levels of the atmosphere.Satellite data is constantly streaming, so the satellite views can be watched in looping animations. Check out the GOES Image Viewer. (You can see live images like those shown here for other regions.) See the GOES-R ABI Bands Quick Reference Guide. |
 |
Observing Large Scale Weather EventsMegastorms are a grave concern and can impact any part of the country. It is difficult to estimate the value of hurricane and severe weather forecasts in saving lives and mitigating some of the economic destruction caused by hurricanes. Satellite imagery is used in conjunction with radar and other weather data collection conducted by NOAA/National Weather Service scientists. All things related to severe weather prediction are presented on the Storm Prediction Center website. Satellite and radar images of approaching hurricanes or thunderstorms producing tornadoes that are projected on television provide powerful motivation for people to prepare and flee for safety in advance of an approaching storm. |
Hurricane Prediction and TrackingBecause hurricanes are so large and usually develop far offshore, observing them with satellite imagery is the best way to track them. Once they start to approach land, aircraft, radar, and other means are used to study their progress. |
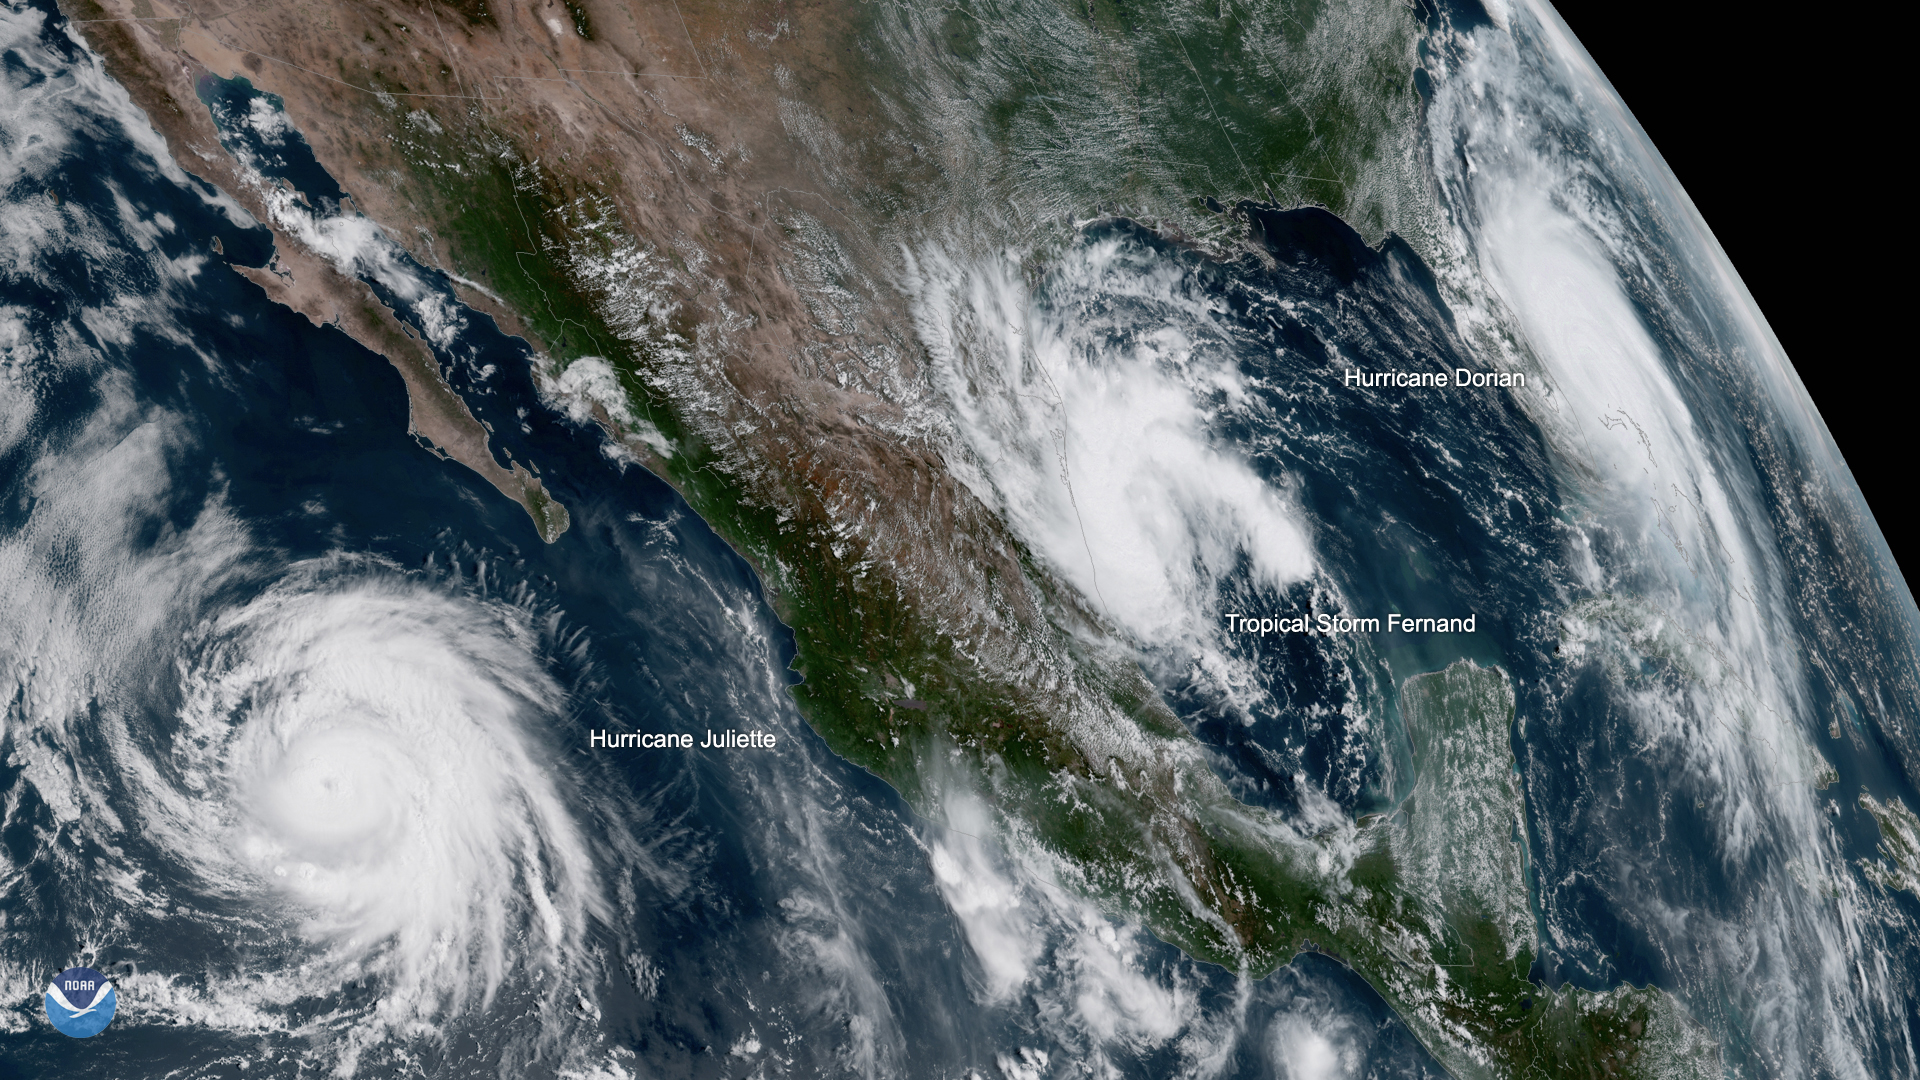 Three hurricanes—GOES satellite view on 9/3/2019 |
Lightning ImageryLightning is a major cause of storm-related deaths and injuries here in the United States and around the world. Fishermen, golfers, and bicyclist are among the most at risk. Lightning strikes also causes forest fires, building fires, and can harm or demolish electricity grids, communications, and unprotected electronics of many kinds. Lightning detection is conducted with space-based systems, and lightning detectors on aircraft, mobile vehicles, and ground-based antenna systems.Check out the NWS Satellite Radar Lightning Loop Map! It shows active storm systems with lightning taking place in regions all around the world. Check out this NOAA satellite video on lightning associated with Hurricane Dorian. Notice the pattern of lightning strikes in the vicinity of the storm's eye and in the outer bands. |
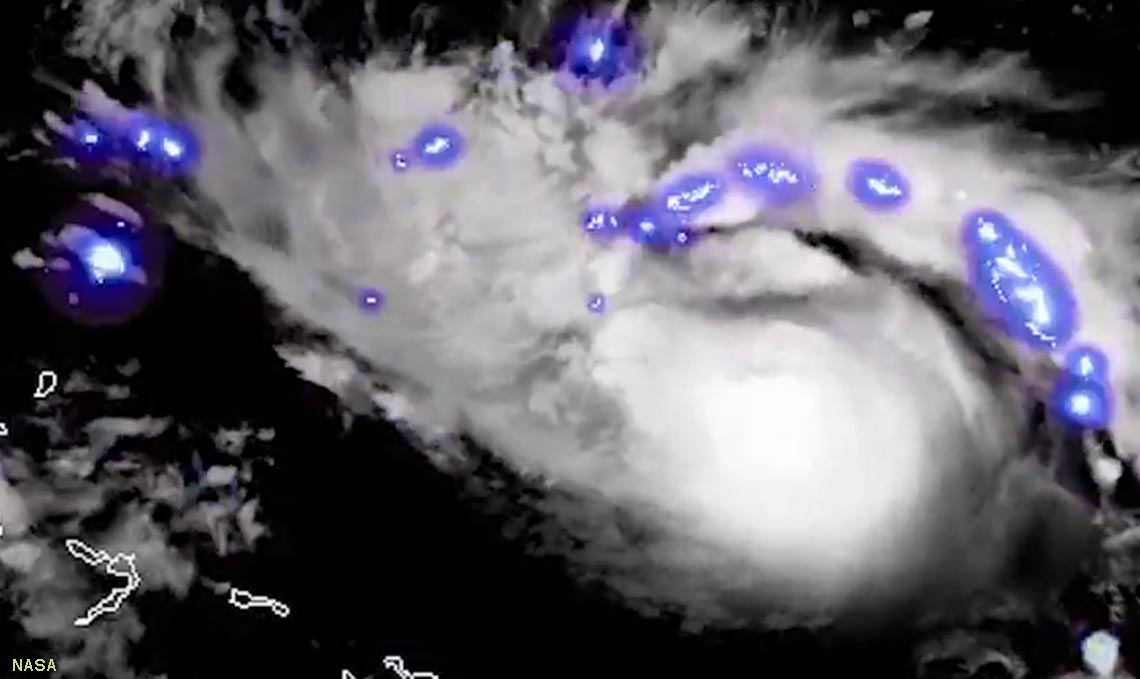 Satellite image showing lightning (Hurricane Dorian) Satellite image showing lightning (Hurricane Dorian) |
Air Quality MapsThe GOES satellite sensors are able to collect data on changing conditions in air quality based on selected pollutants and particles in the air. Pollutants and particles sources include both natural and man-made (directly or indirectly) including atmospheric ozone, smoke (from wildfires), pollution (from agricultural activity, transportation, burning fuels, and man-made catastrophes), and natural particulate matter (dust from dust storms and airborne ash from volcanic eruptions).Maps, forecasts, and warnings relating to air quality are accessible form the NWS Air Quality website. |
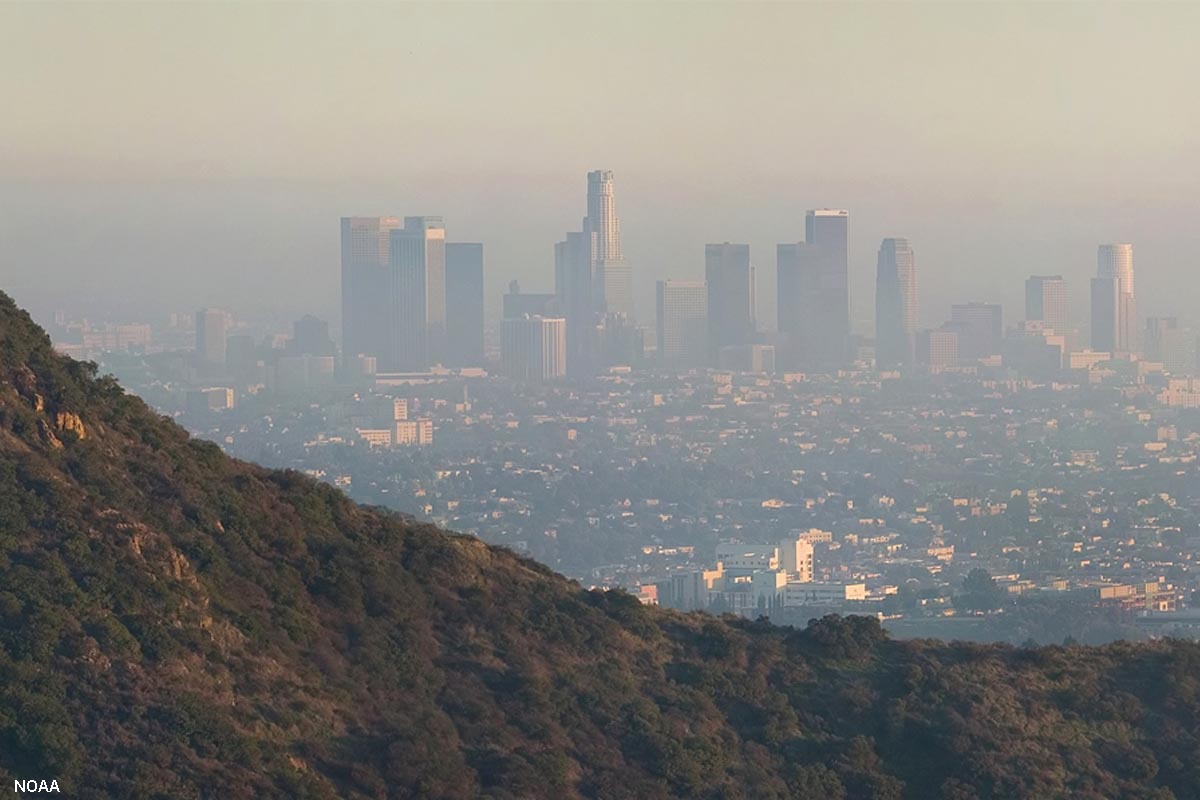 View of a cloud of smog over Los Angeles. Cities in valley regions are prone to thermal inversions that trap cooler polluted air below a stable warm air layer above. These conditions can persist for days or weeks. |
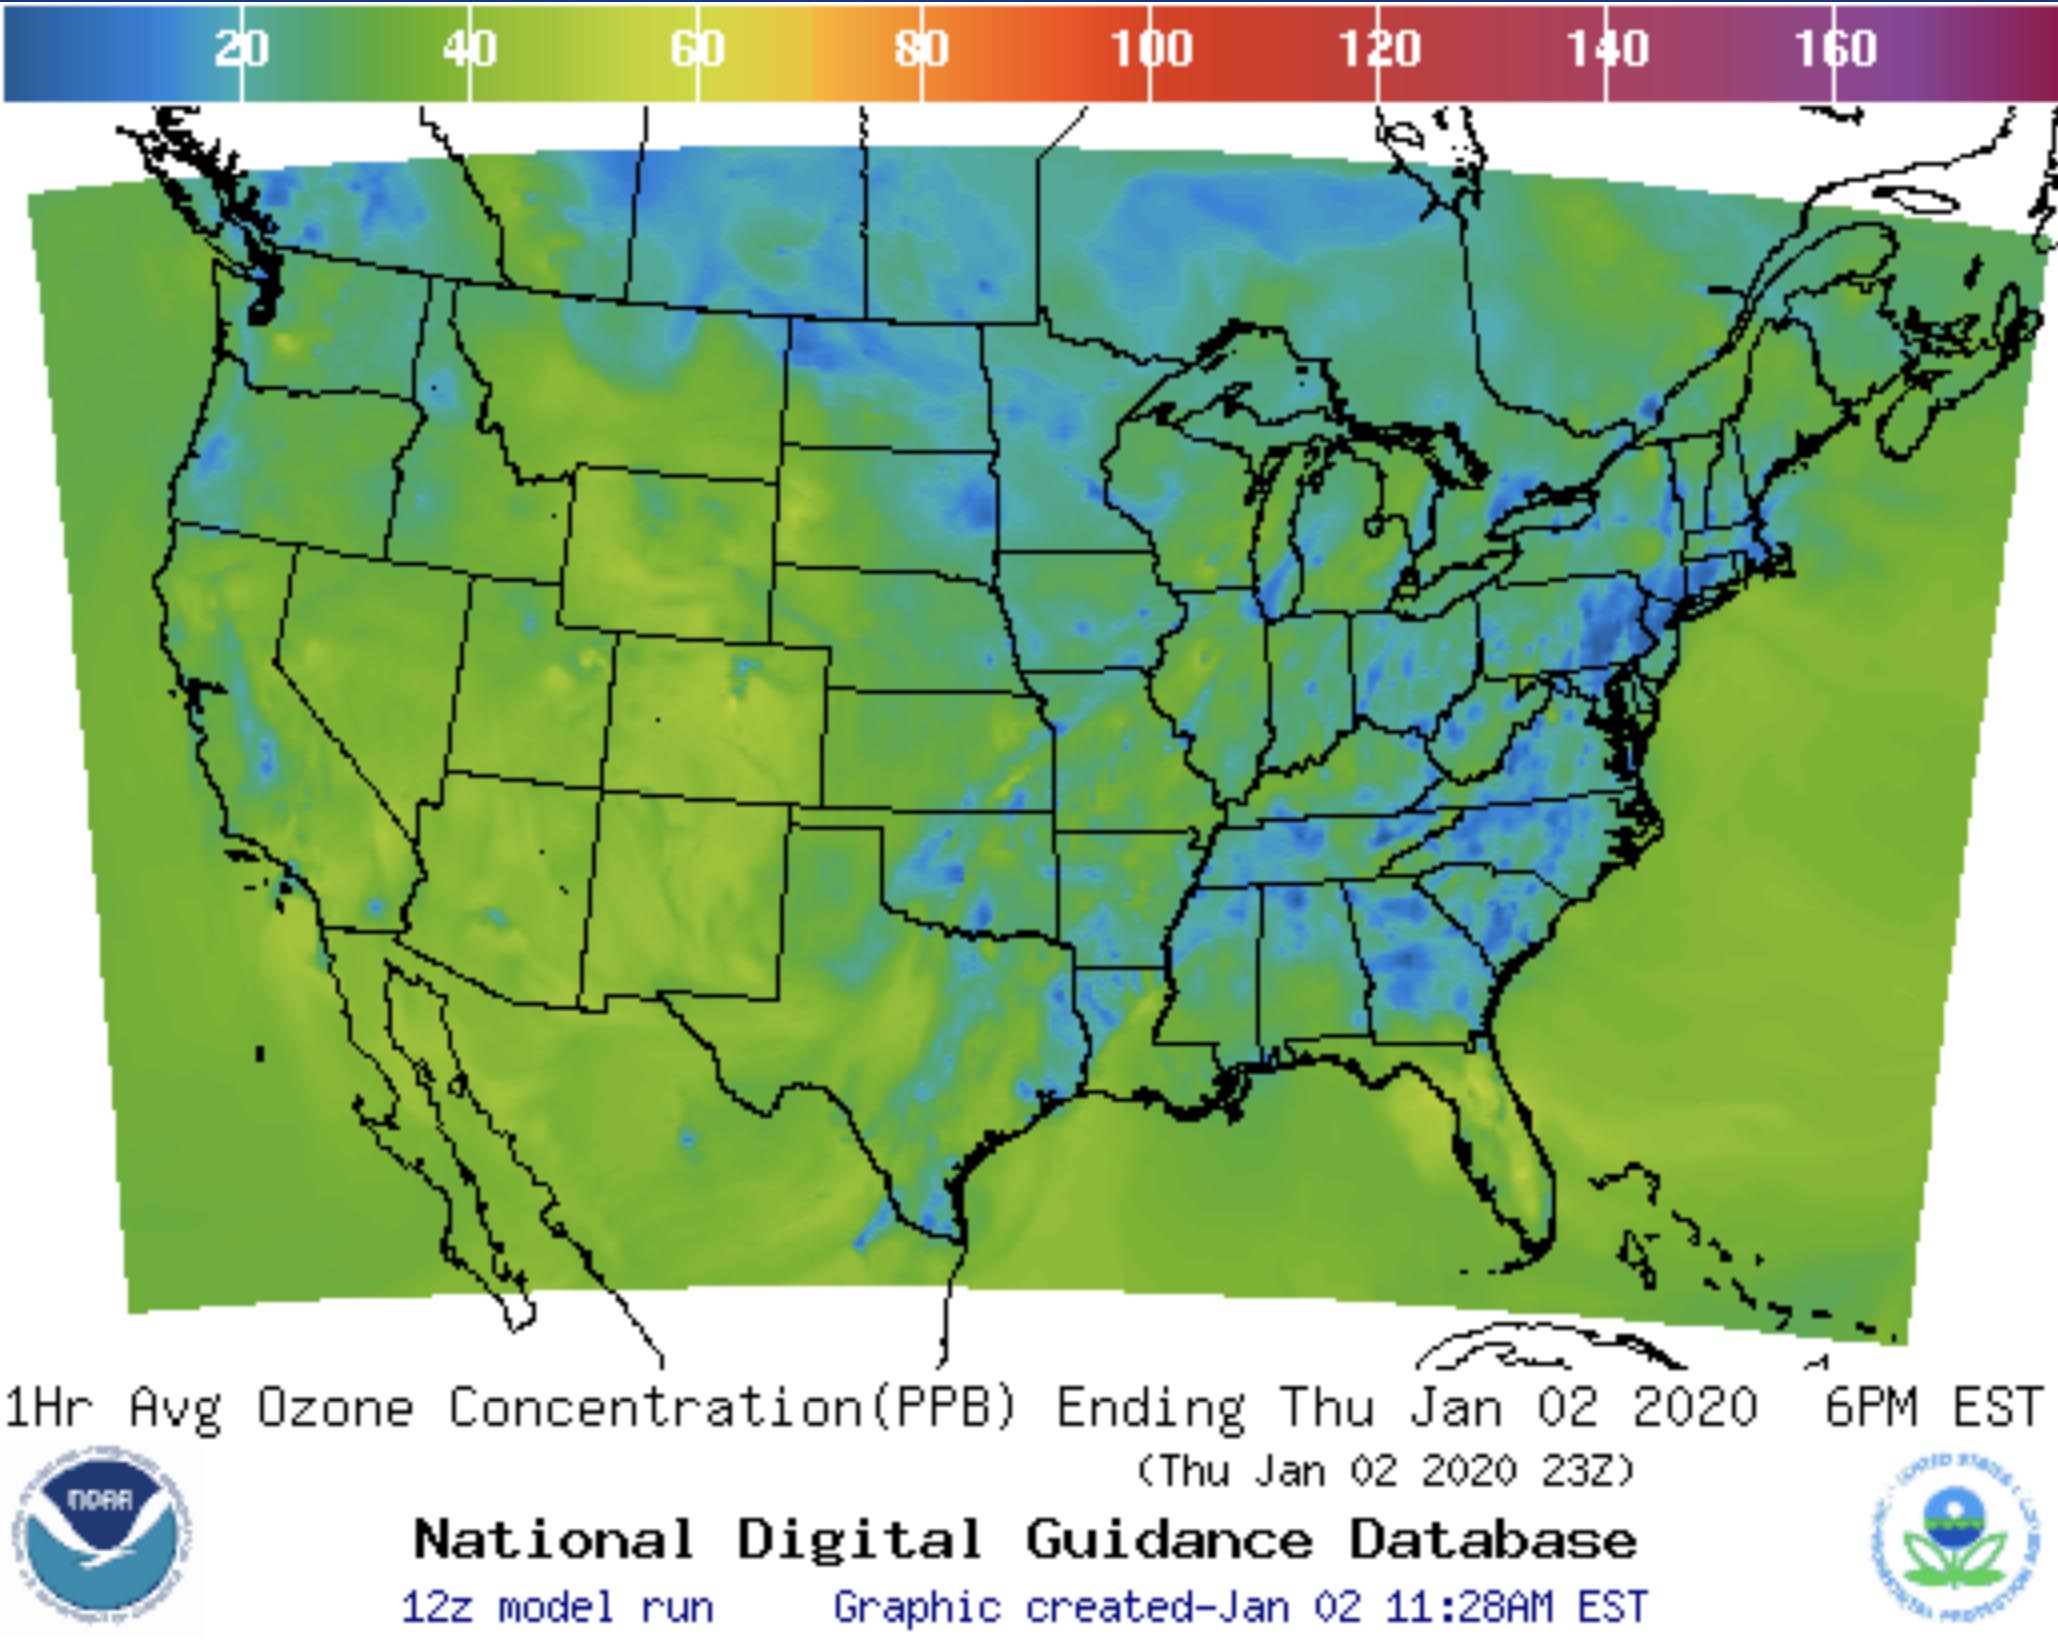 Ozone concentrations (PPB) map for Jan. 2, 2020 |
Wildfire and Smoke MonitoringThe NOAA Storm Prediction Center prepares Fire Weather Outlooks (short term to long range forecasts). National Weather Service local forecast centers also issue Fire Advisories, Watches and Warnings. NOAA scientists use satellite and ground-based observations to monitor conditions favorable for potential wildfires. Weather conditions that contribute to wildfire hazard conditions include strong winds, dry conditions (low relative humidity and drought), warm to hot temperatures, and dry fuels (vegetation), and lightning from "dry" thunderstorms. NOAA GOES weather satellite imagery is extensively used to monitor active wildfires. |
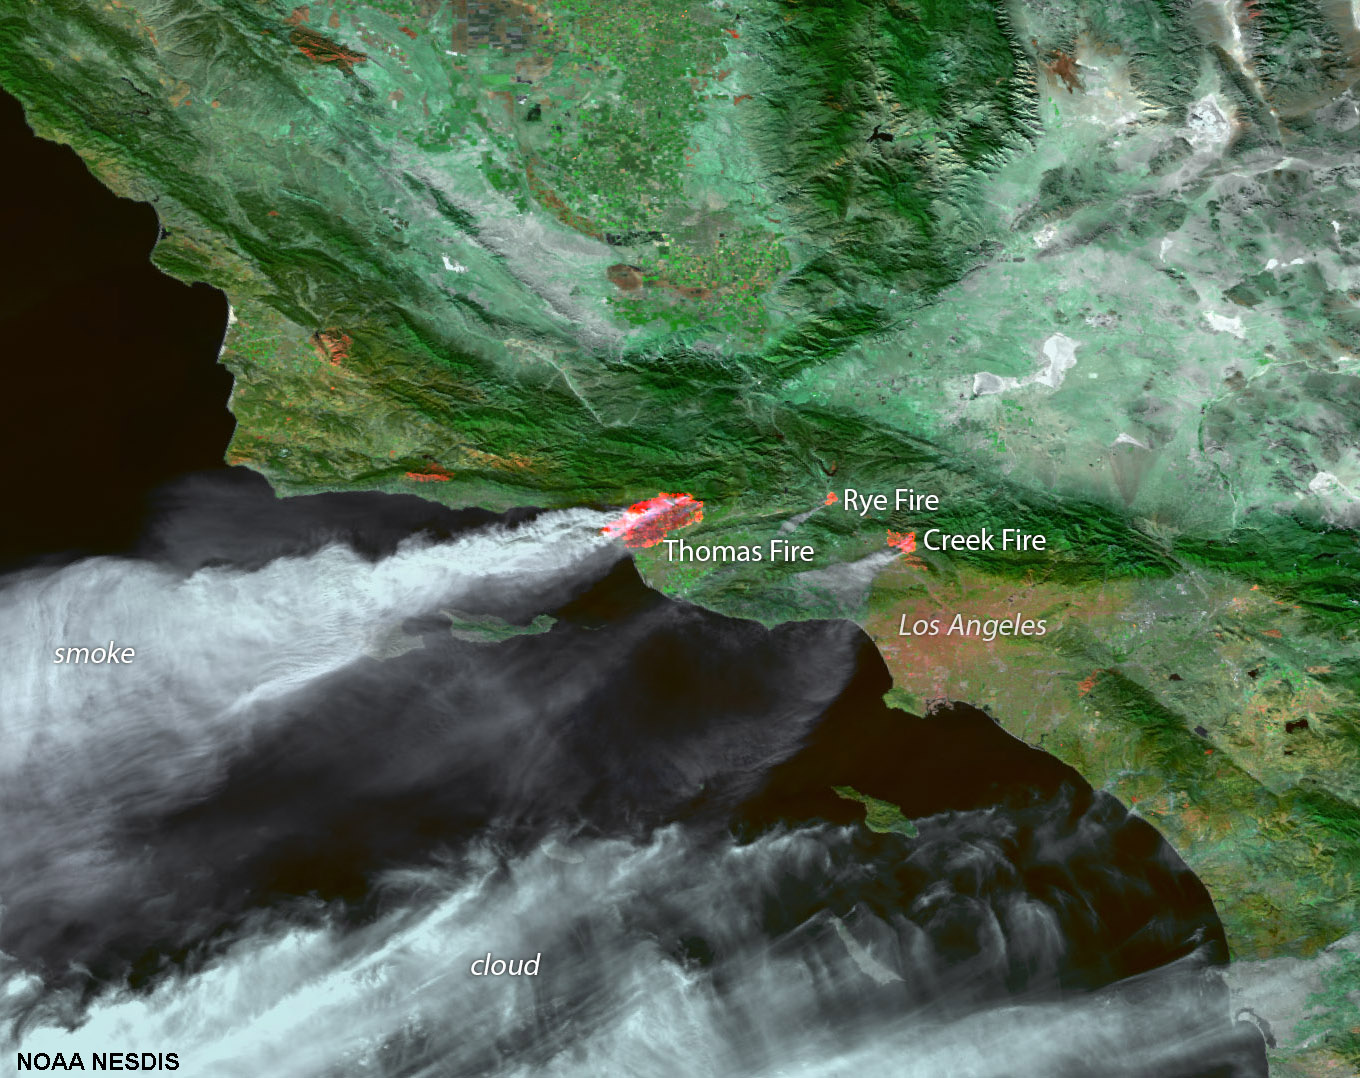 Satellite view of SoCal fires of December, 2017. Satellite view of SoCal fires of December, 2017. |
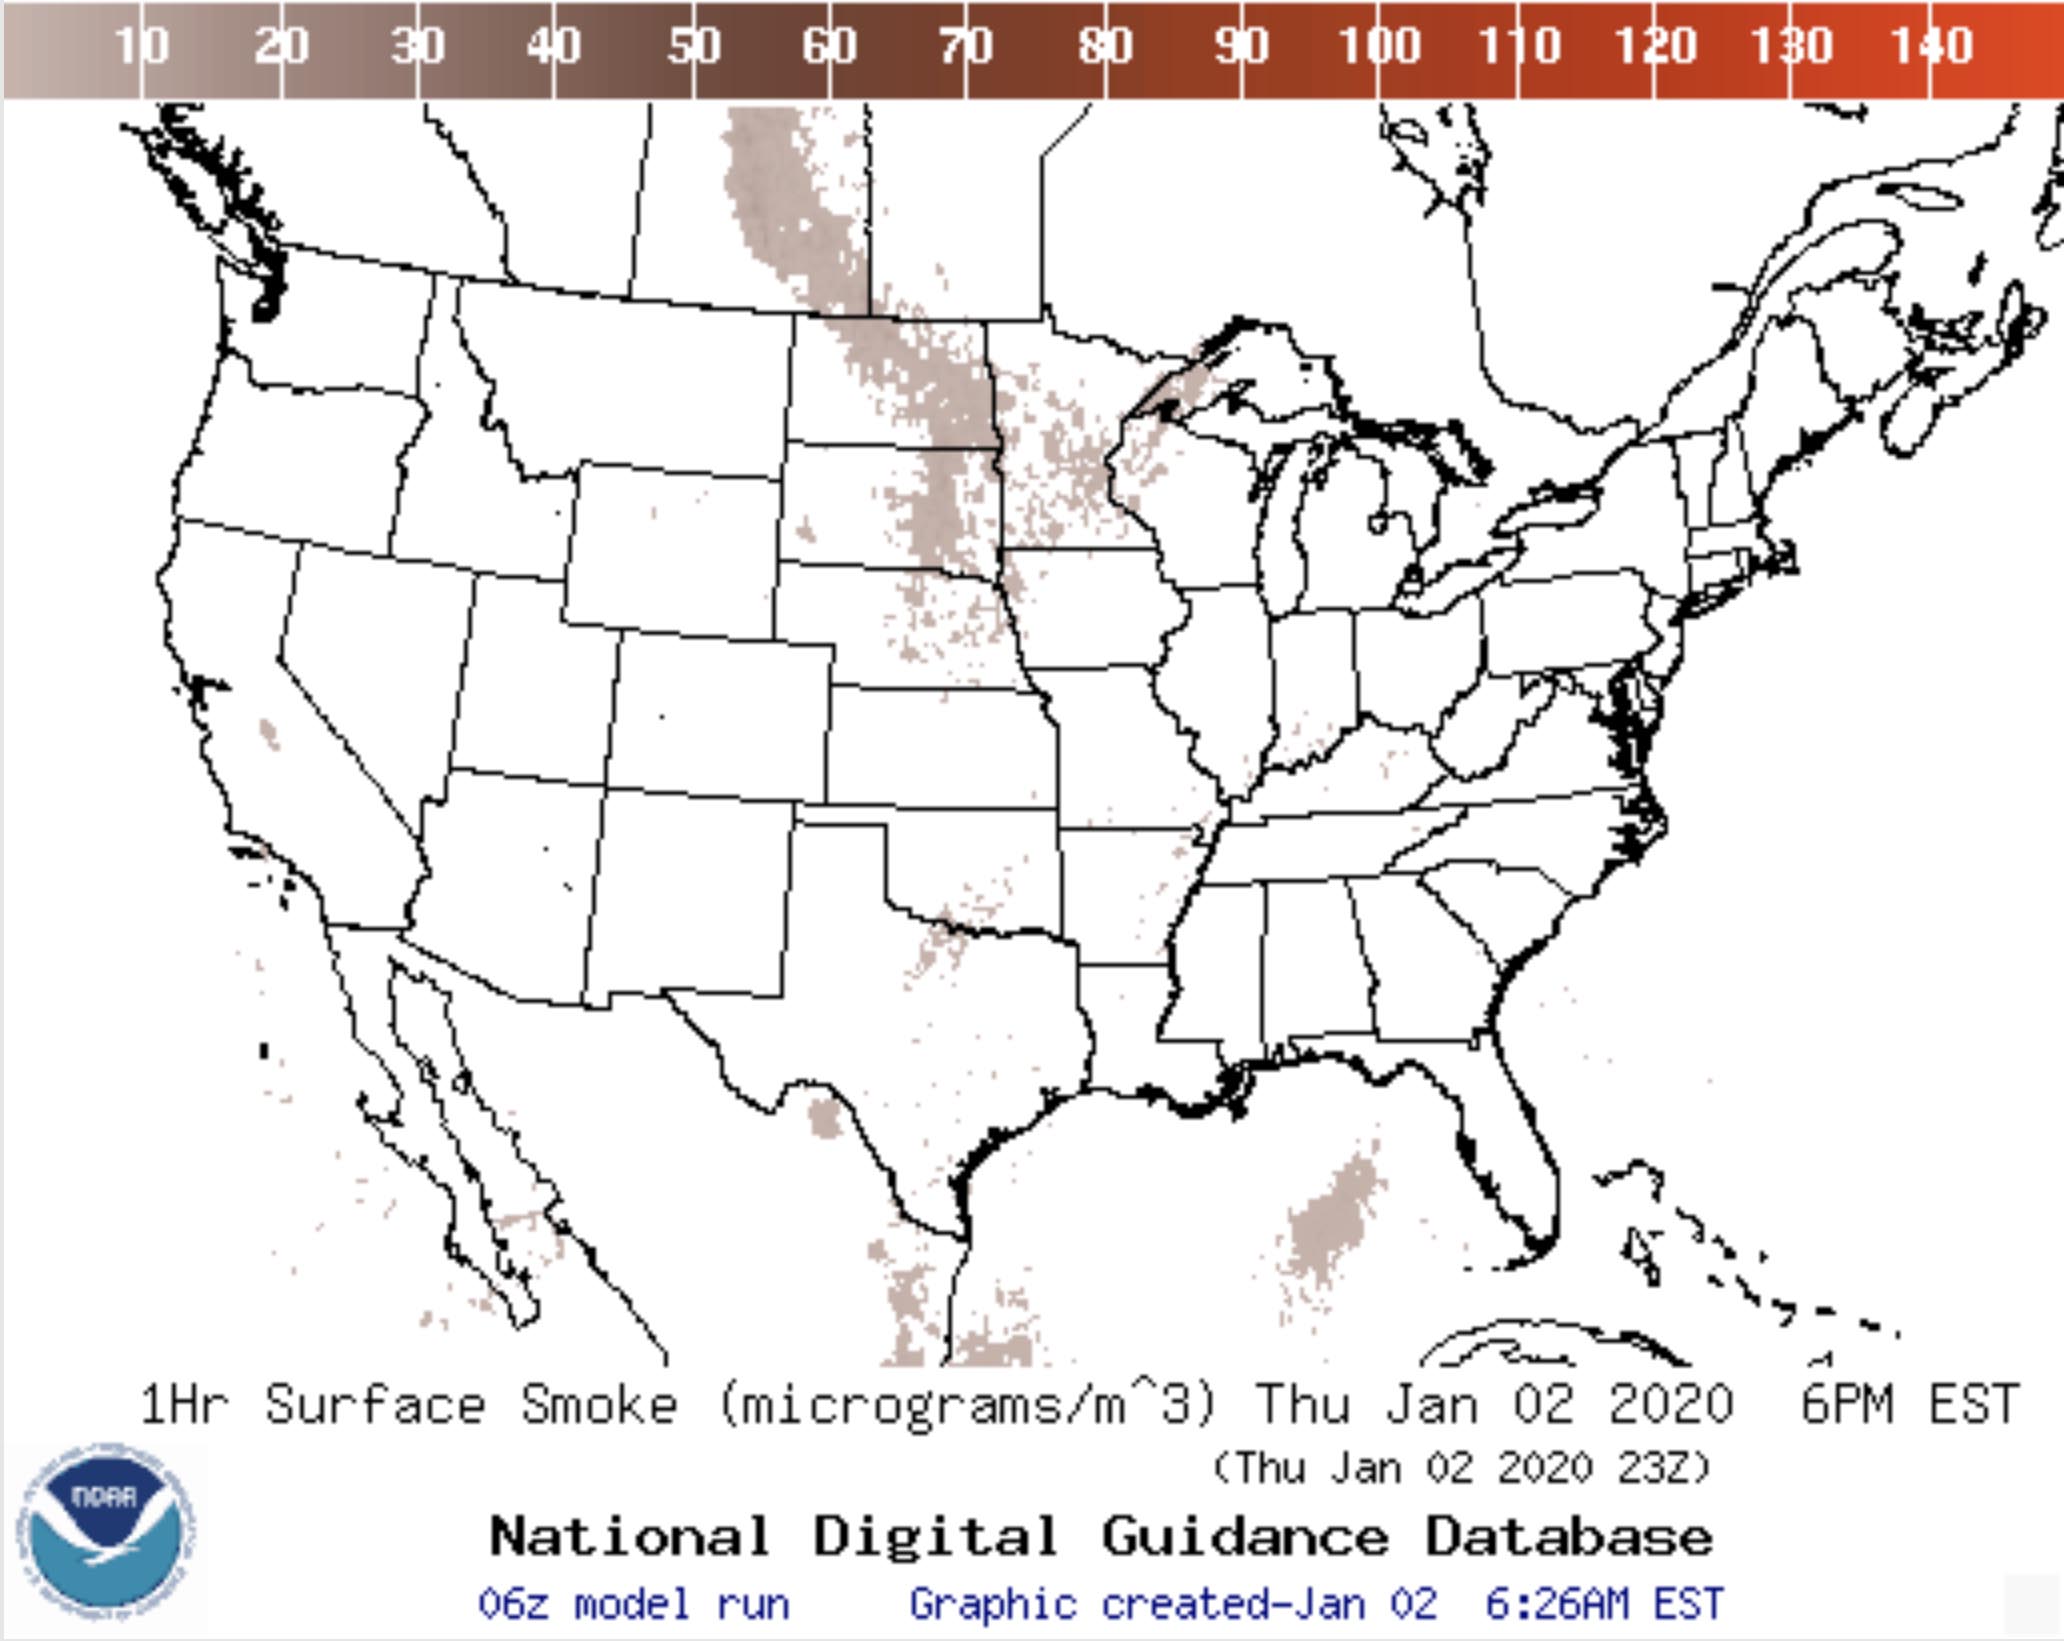 1-hour surface smoke map, Jan 2, 2020. |
Monitoring Dust StormsThe Desert Southwest is notorious for having dust storms; in Arizona they are called haboobs. Drought conditions set the stage for potential dust storms. Dust storms occur when when a cold and unstable air mas moves quickly across the surface, allowing gusty winds to lift loose fine-grained sediments (sand, silt, and clay).In the Desert Southwest, dust storms are most common in the summer season and associated with strong down drafts associated with intense monsoonal thunderstorm activity. The region typically has about 3 haboobs a year during the months of June to September. |
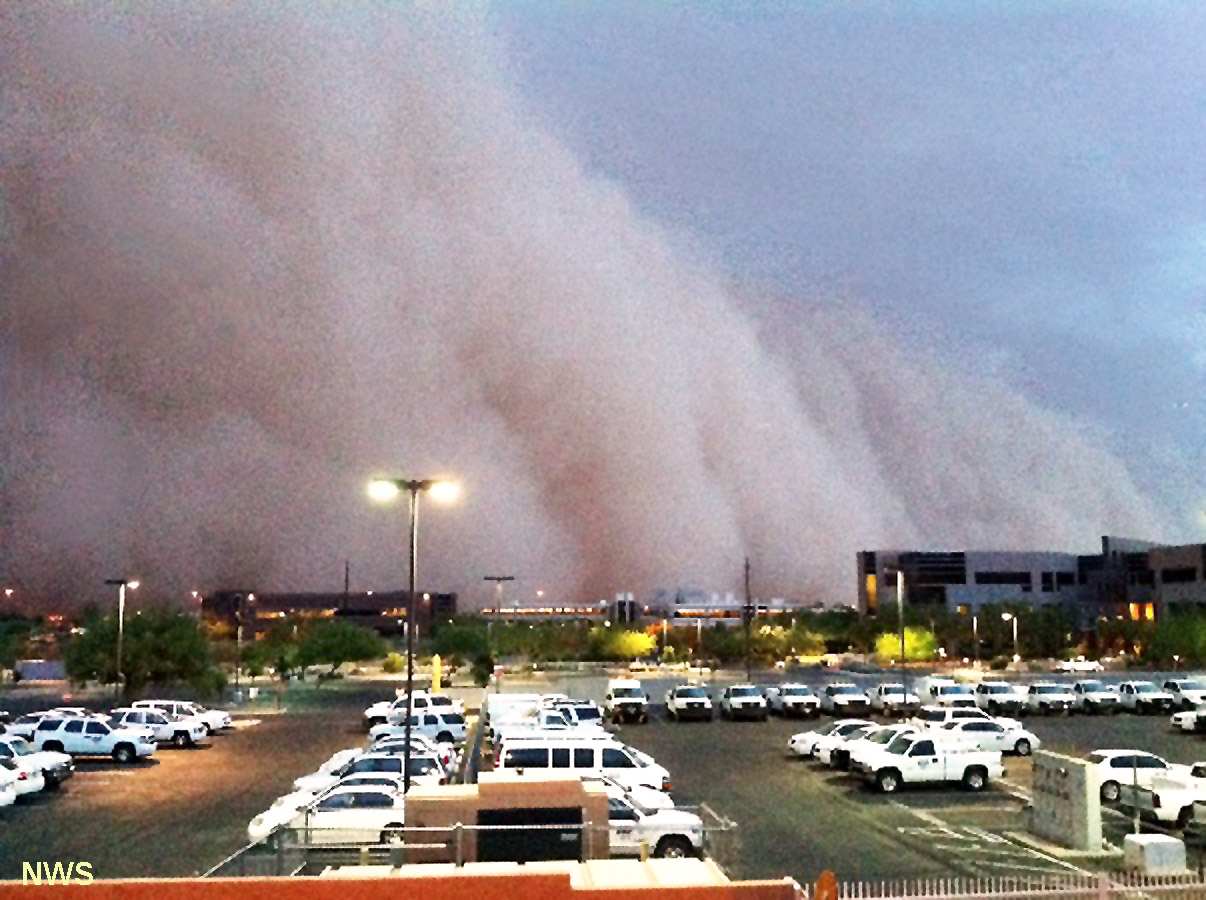 A violent dust storm (or Haboob) advancing as an ominous squall into Central Arizona College, Arizona. |
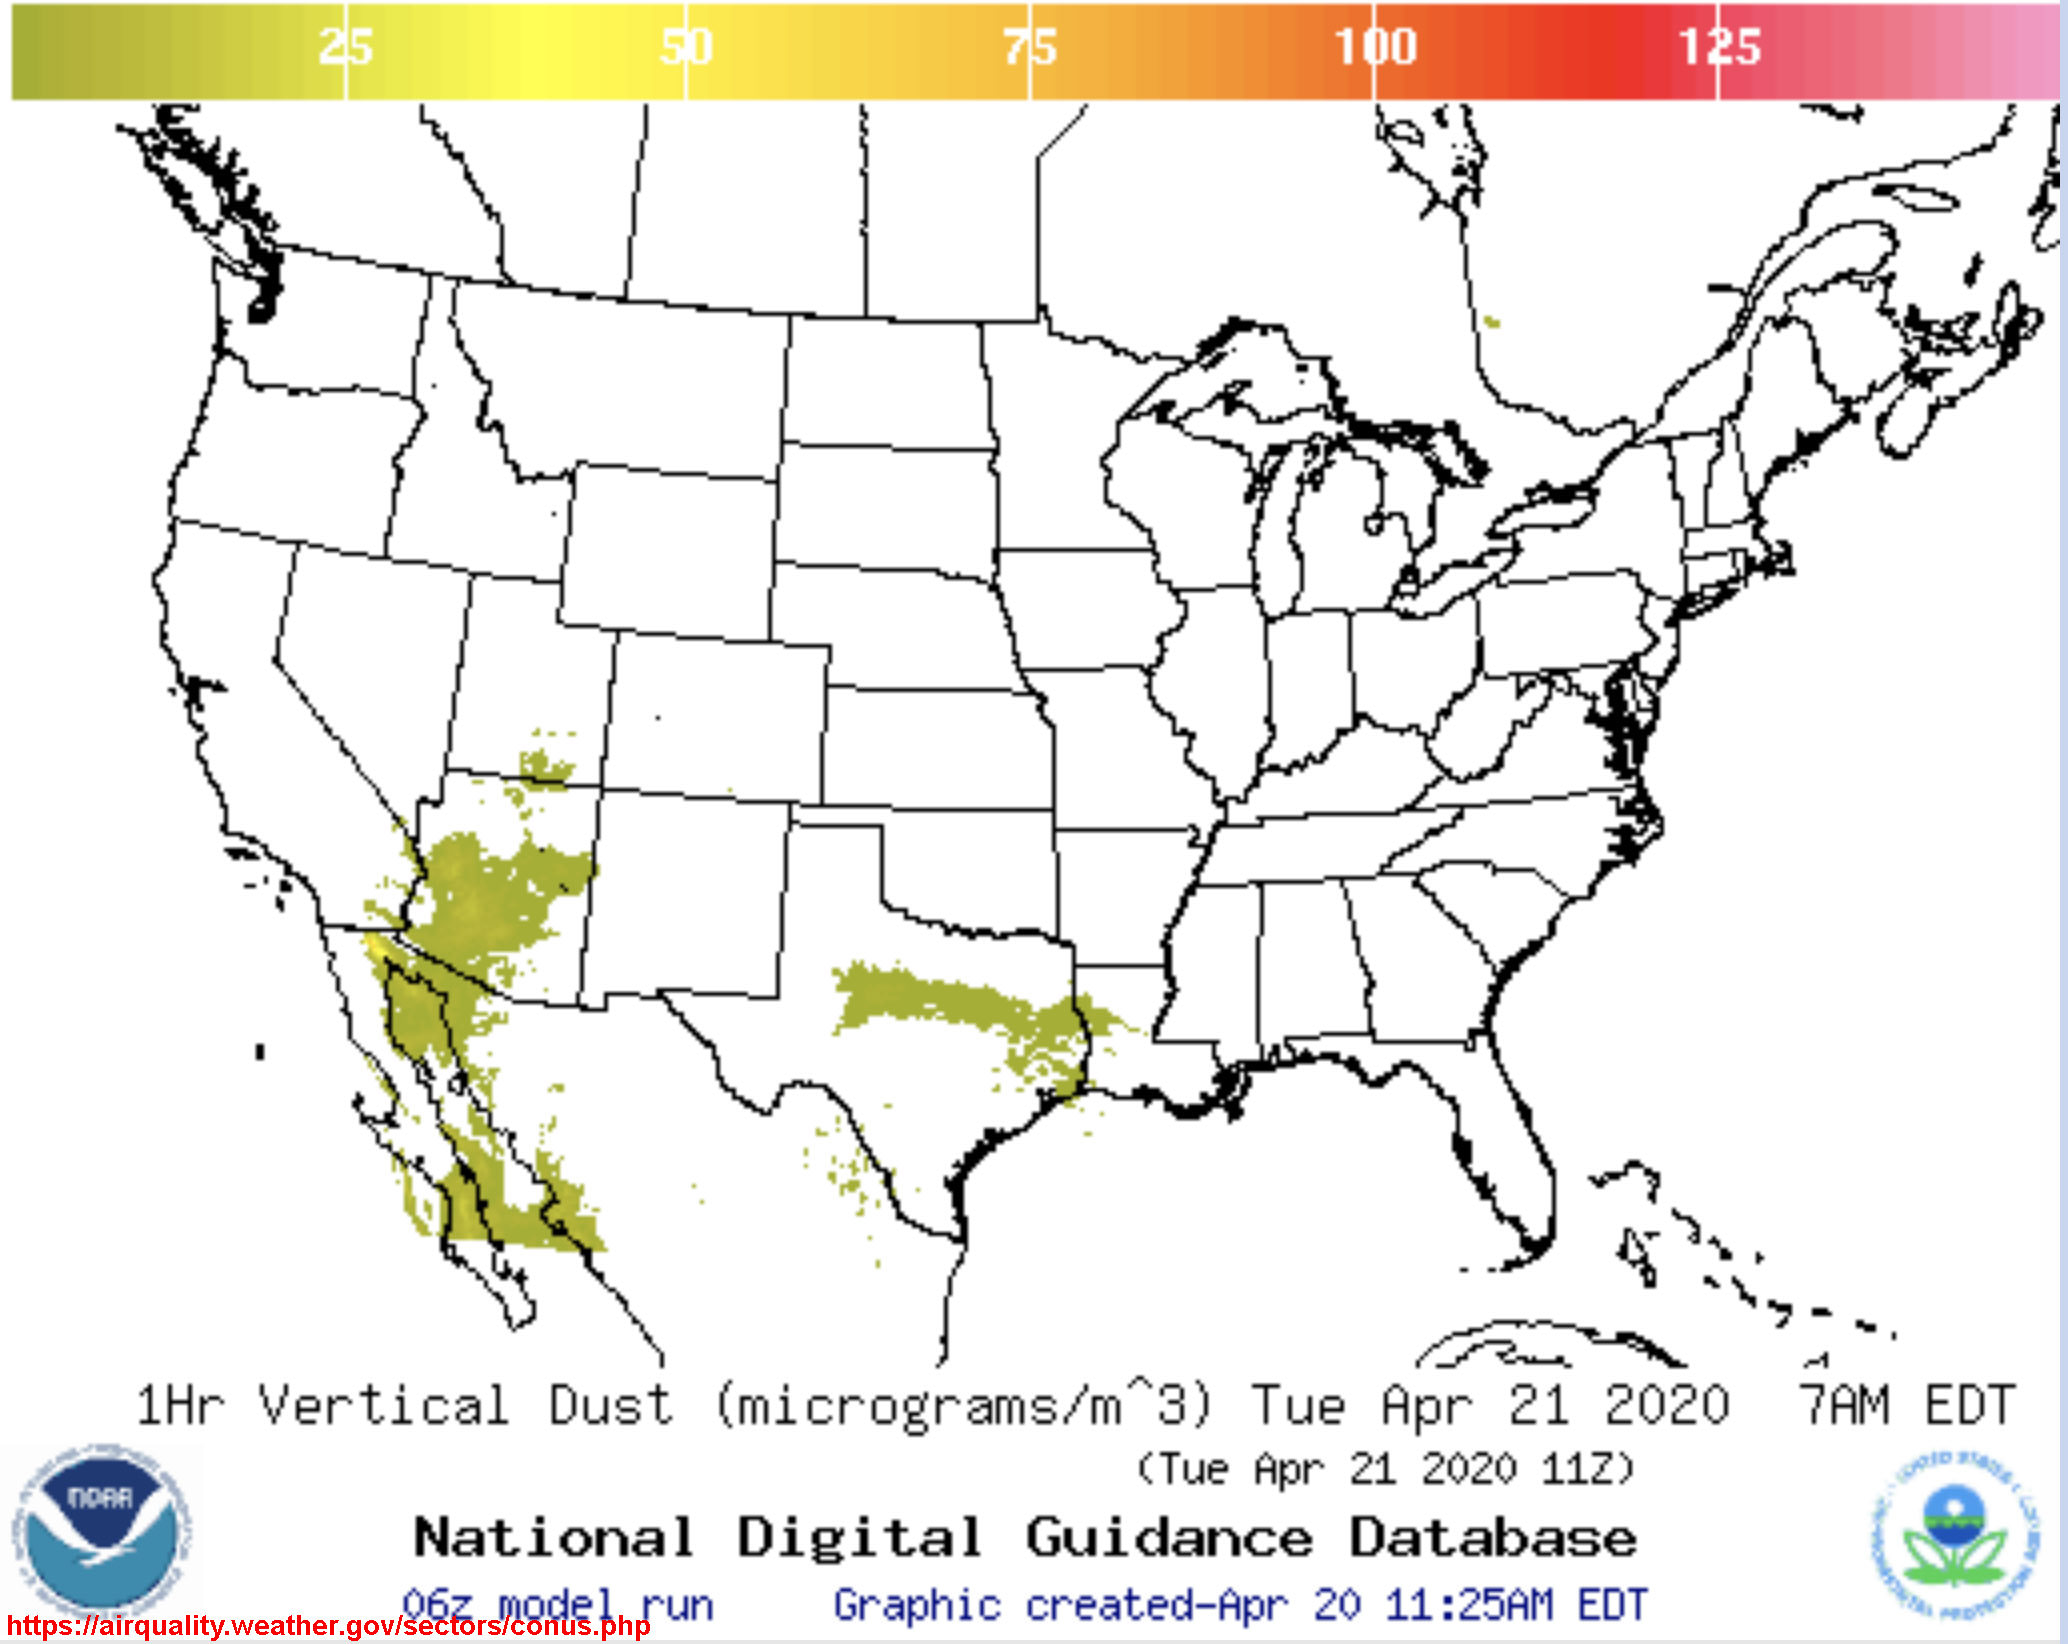 Dust Concentrations (Air Quality Forecast) |
Volcanic Eruption MonitoringThe USGS Volcano Hazards Program and the Smithsonian Institution - Global Volcanism Program monitor volcanic eruptions of the world's volcanoes. Volcanoes ash eruptions are a global threat to aviation. On any day there are typically several volcanic eruptions taking place around th world. Most of North America's volcanoes are located in remote regions, ash from volcanic eruptions can travel log distances. These organizations collaborate with NOAA's Volcanic Ash Advisory Centers (VAAC) located in Seattle, WA and Anchorage, AK (air traffic to these cities are most impacted by eruptions). The VAAC websites has links to satellite imagery highlighting ash clouds and provides SO2 imagery maps.Volcanic eruptions in Alaska's Aleutian volcanic chain have disrupted air travel in the region many times. For example, Redoubt Volcano (shown here) in Alaska's Aleutian Chain has erupted 1902, 1966, 1989-1990 and 2009. Hawaii's volcanoes are notorious for generating vog (volcanic air pollution) which is considered a major health hazard in Hawaii. |
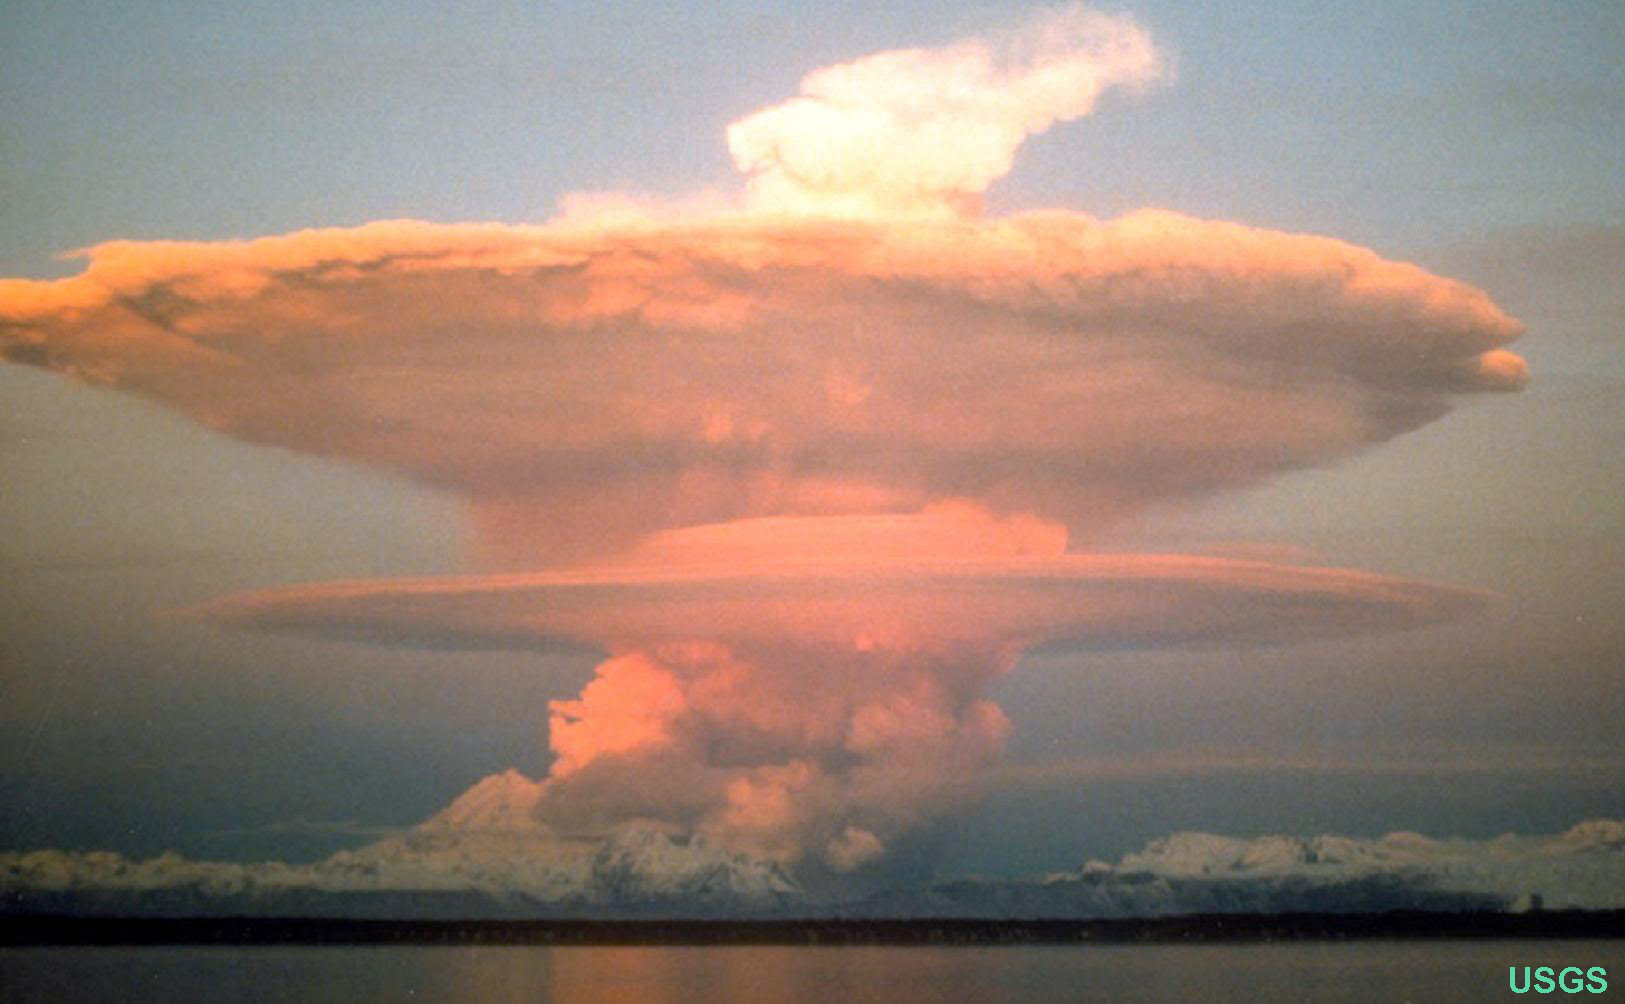 View of the massive eruption ash cloud from the Redoubt Volcano in Alaska in 2009. The eruptions halted air traffic for weeks in the region. |
Earthquake Weather?According to the USGS: "There is no such thing as 'earthquake weather.' Statistically, there is approximately an equal distribution of earthquakes in cold weather, hot weather, rainy weather, etc. Very large low-pressure changes associated with major storm systems (typhoons, hurricanes, etc) are known to trigger episodes of fault slip (slow earthquakes) in the Earth’s crust and may also play a role in triggering some damaging earthquakes. However, the numbers are small and are not statistically significant."Weather may not cause earthquakes, but there is some earthquake-weather related phenomena. For example, in 1994, the Northridge Earthquake (M.6.7) cause a great deal of landslides in the mountains surrounding the San Fernando Valley region of Los Angeles County. The landslides created a large amount of dust that spread across the region. Shortly afterward, there was a significant spike in Valley Fever. Valley Fever is a fungal infection caused by coccidioides (types of fungi) found in soil in the SoCal region. Landslides were what probably what released the fungi into the air. Valley fever is also linked to strong dust storms in the Desert Southwest region, particularly during Santa Ana winds events (discussed below). The USGS Earthquake Hazards Latest Earthquakes to see where earthquakes are happening near you. |
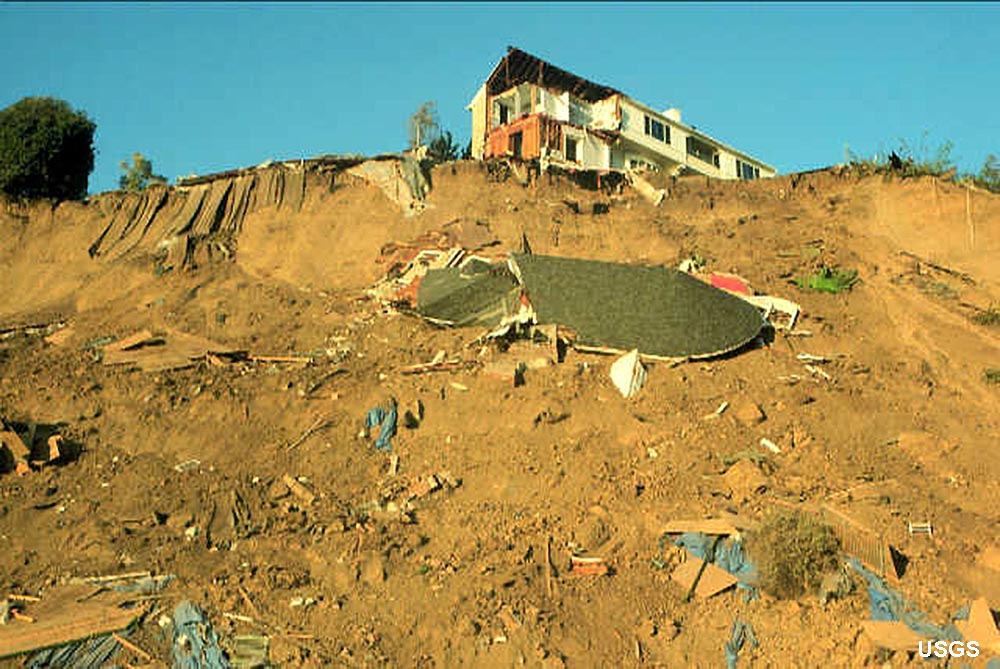 View of a landslide from the Northridge Earthquake. Landslides are often triggered by strong earthquakes. Earthquakes have been observed to generate dust clouds and start fires. Lightning has also been observed during strong earthquakes in Japan. |
Oceanographic Information |
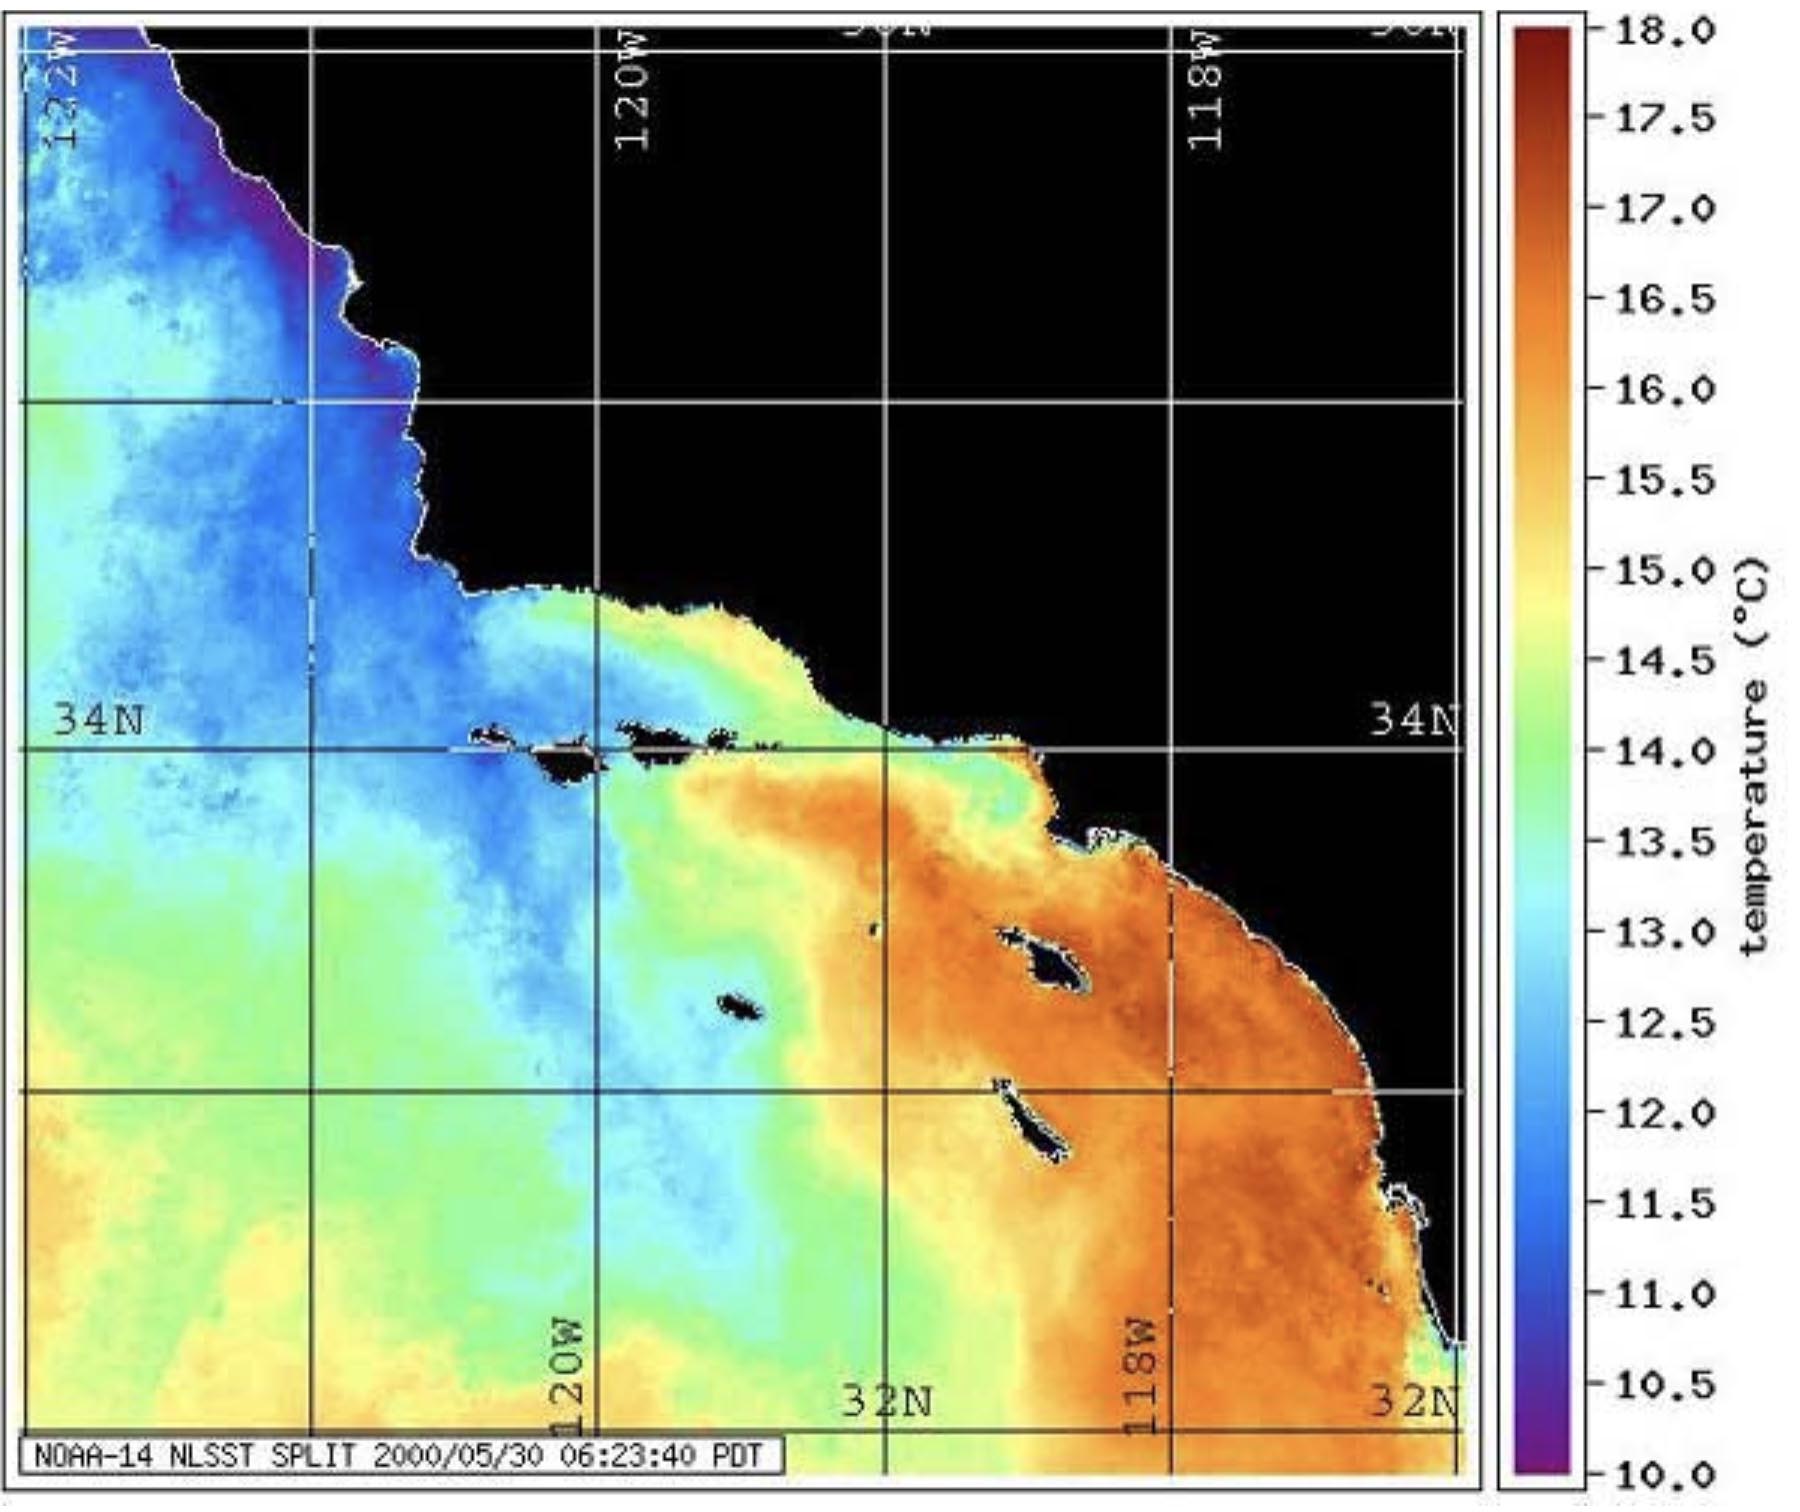
Sea Surface Temperatures (SST)NOAA also uses satellites to collect sea surface temperatures (SST). SST data is extremely important for weather forecasting, particularly related to hurricane formation in tropical regions. SST is evaluating the global El Niño & La Niña (Southern Oscillation) climate cycles, monitoring changes, sea ice and polar water conditions, impacts on sea life, and many other factors related to climate change studies.Sea surface temperature information is obtained by satellite microwave radiometers, combined with infrared (IR) radiometers, and data collected from in situ moored and drifting buoys, and ships collecting data when and where opportunity to collect data. To see global and regional SST charts see: Sea Surface Temperature (SST) Contour Charts (NOAA website) This website lets you access real-time data for regions around the world. This view is is an example for the Pacific Ocean offshore of California. The website also provides looping animations of sea surface temperatures for parts of the globe over the past 6 months. |
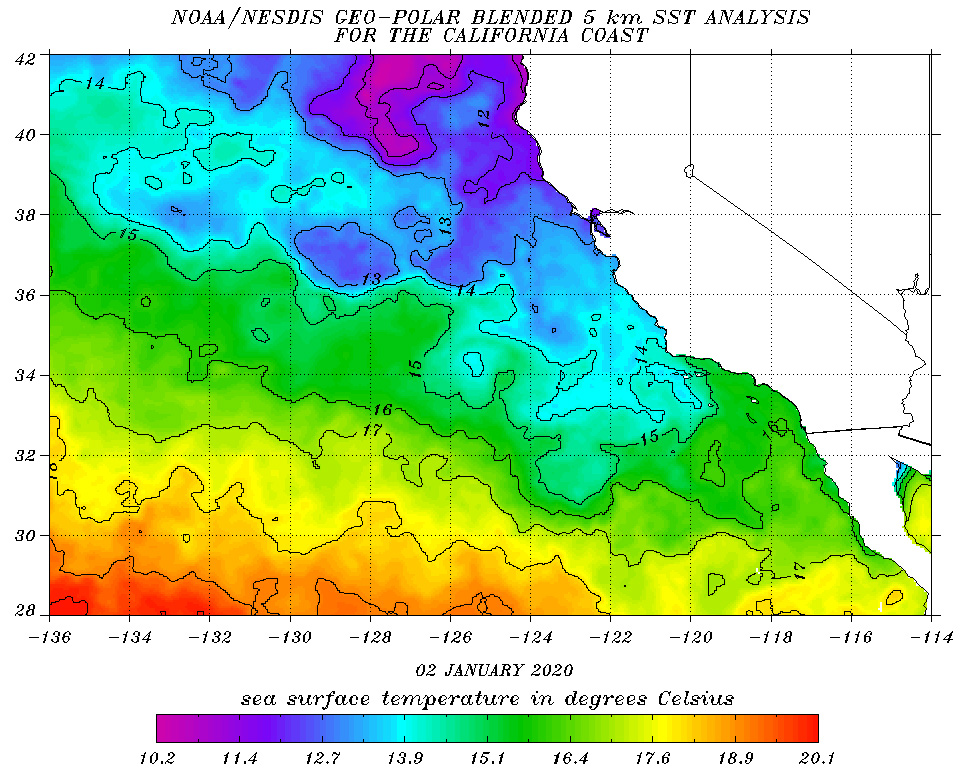 |
| Sea surface temperature (SST) data reveals clues about the movement of surface water currents. The SST map of the Southern California region shown here show cold sea water (blue) upwelling along the coast northwest of Los Angeles where winds move the surface waters offshore. Downwelling is occurring south of Los Angeles where surface wind are pushing warm surface waters onshore where they displace the colder waters below. The El Niño Anomaly Loop is a six-month looping animation that shows the changing sea surface temperature associated with equatorial upwelling and the seasonal buildup of warm sea-surface waters (thermocline) in the tropics and temperate regions of the globe. Learn more the current status of El Niño/La Niña (El Niño-Southern Oscillation). |
 |
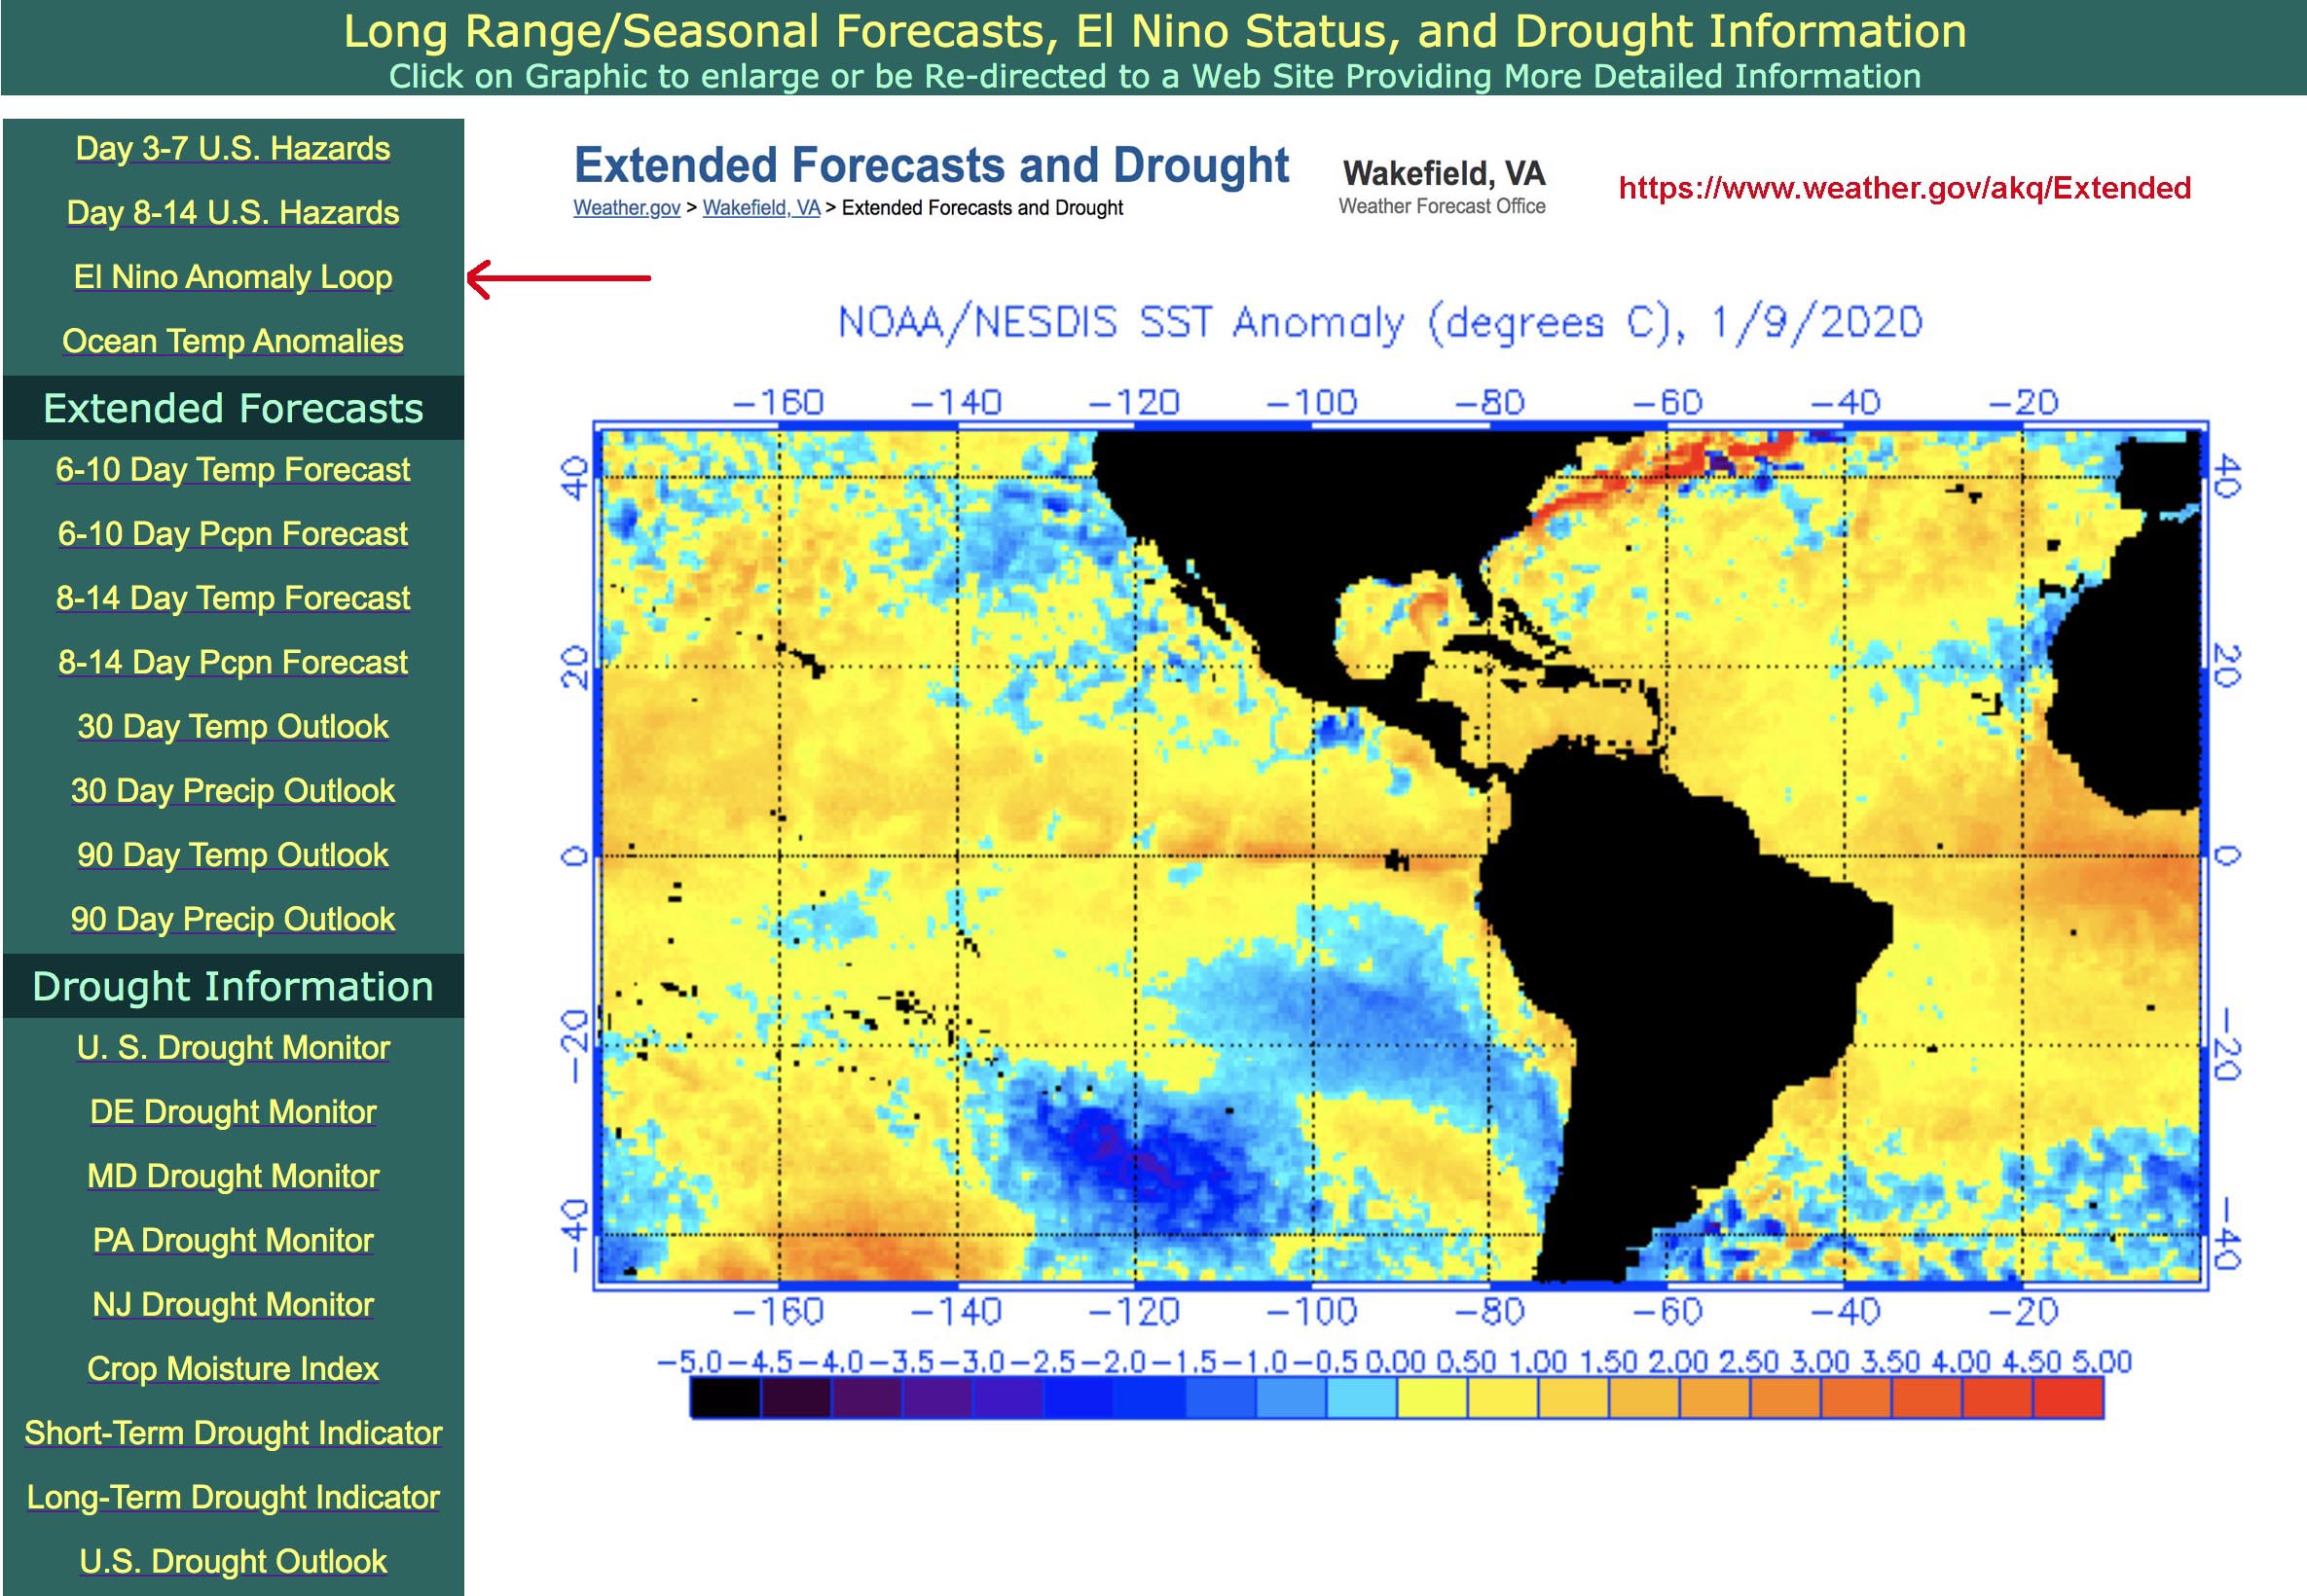 El Niño Anomaly Loop (click link on left to see loop) https://www.weather.gov/akq/Extended |
Tides & CurrentsNOAA maintains 41 tidal current reference stations where daily observations are recorded. This data is used in conjunction 2200 additional tidal monitoring stations around the world. Because tidal patterns are constant, it is possible to predict tidal cycles (highs and lows) accurately well into the future. See https://tidesandcurrents.noaa.gov/. This website provides “access your local water levels, tide and current predictions, and other oceanographic and meteorological conditions” recorded at tidal stations (see example for the La Jolla Tidal Station ). The information provided from each station may include current and predicted water levels (tides, floods, storm surges, etc.), winds, air temperature, water temperature, and barometric pressure. |
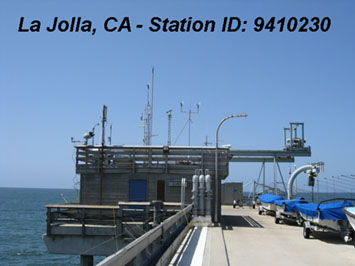 See the example of current data for the La Jolla Tidal Current Reference Station on the Scripps Pier in La Jolla, California. |
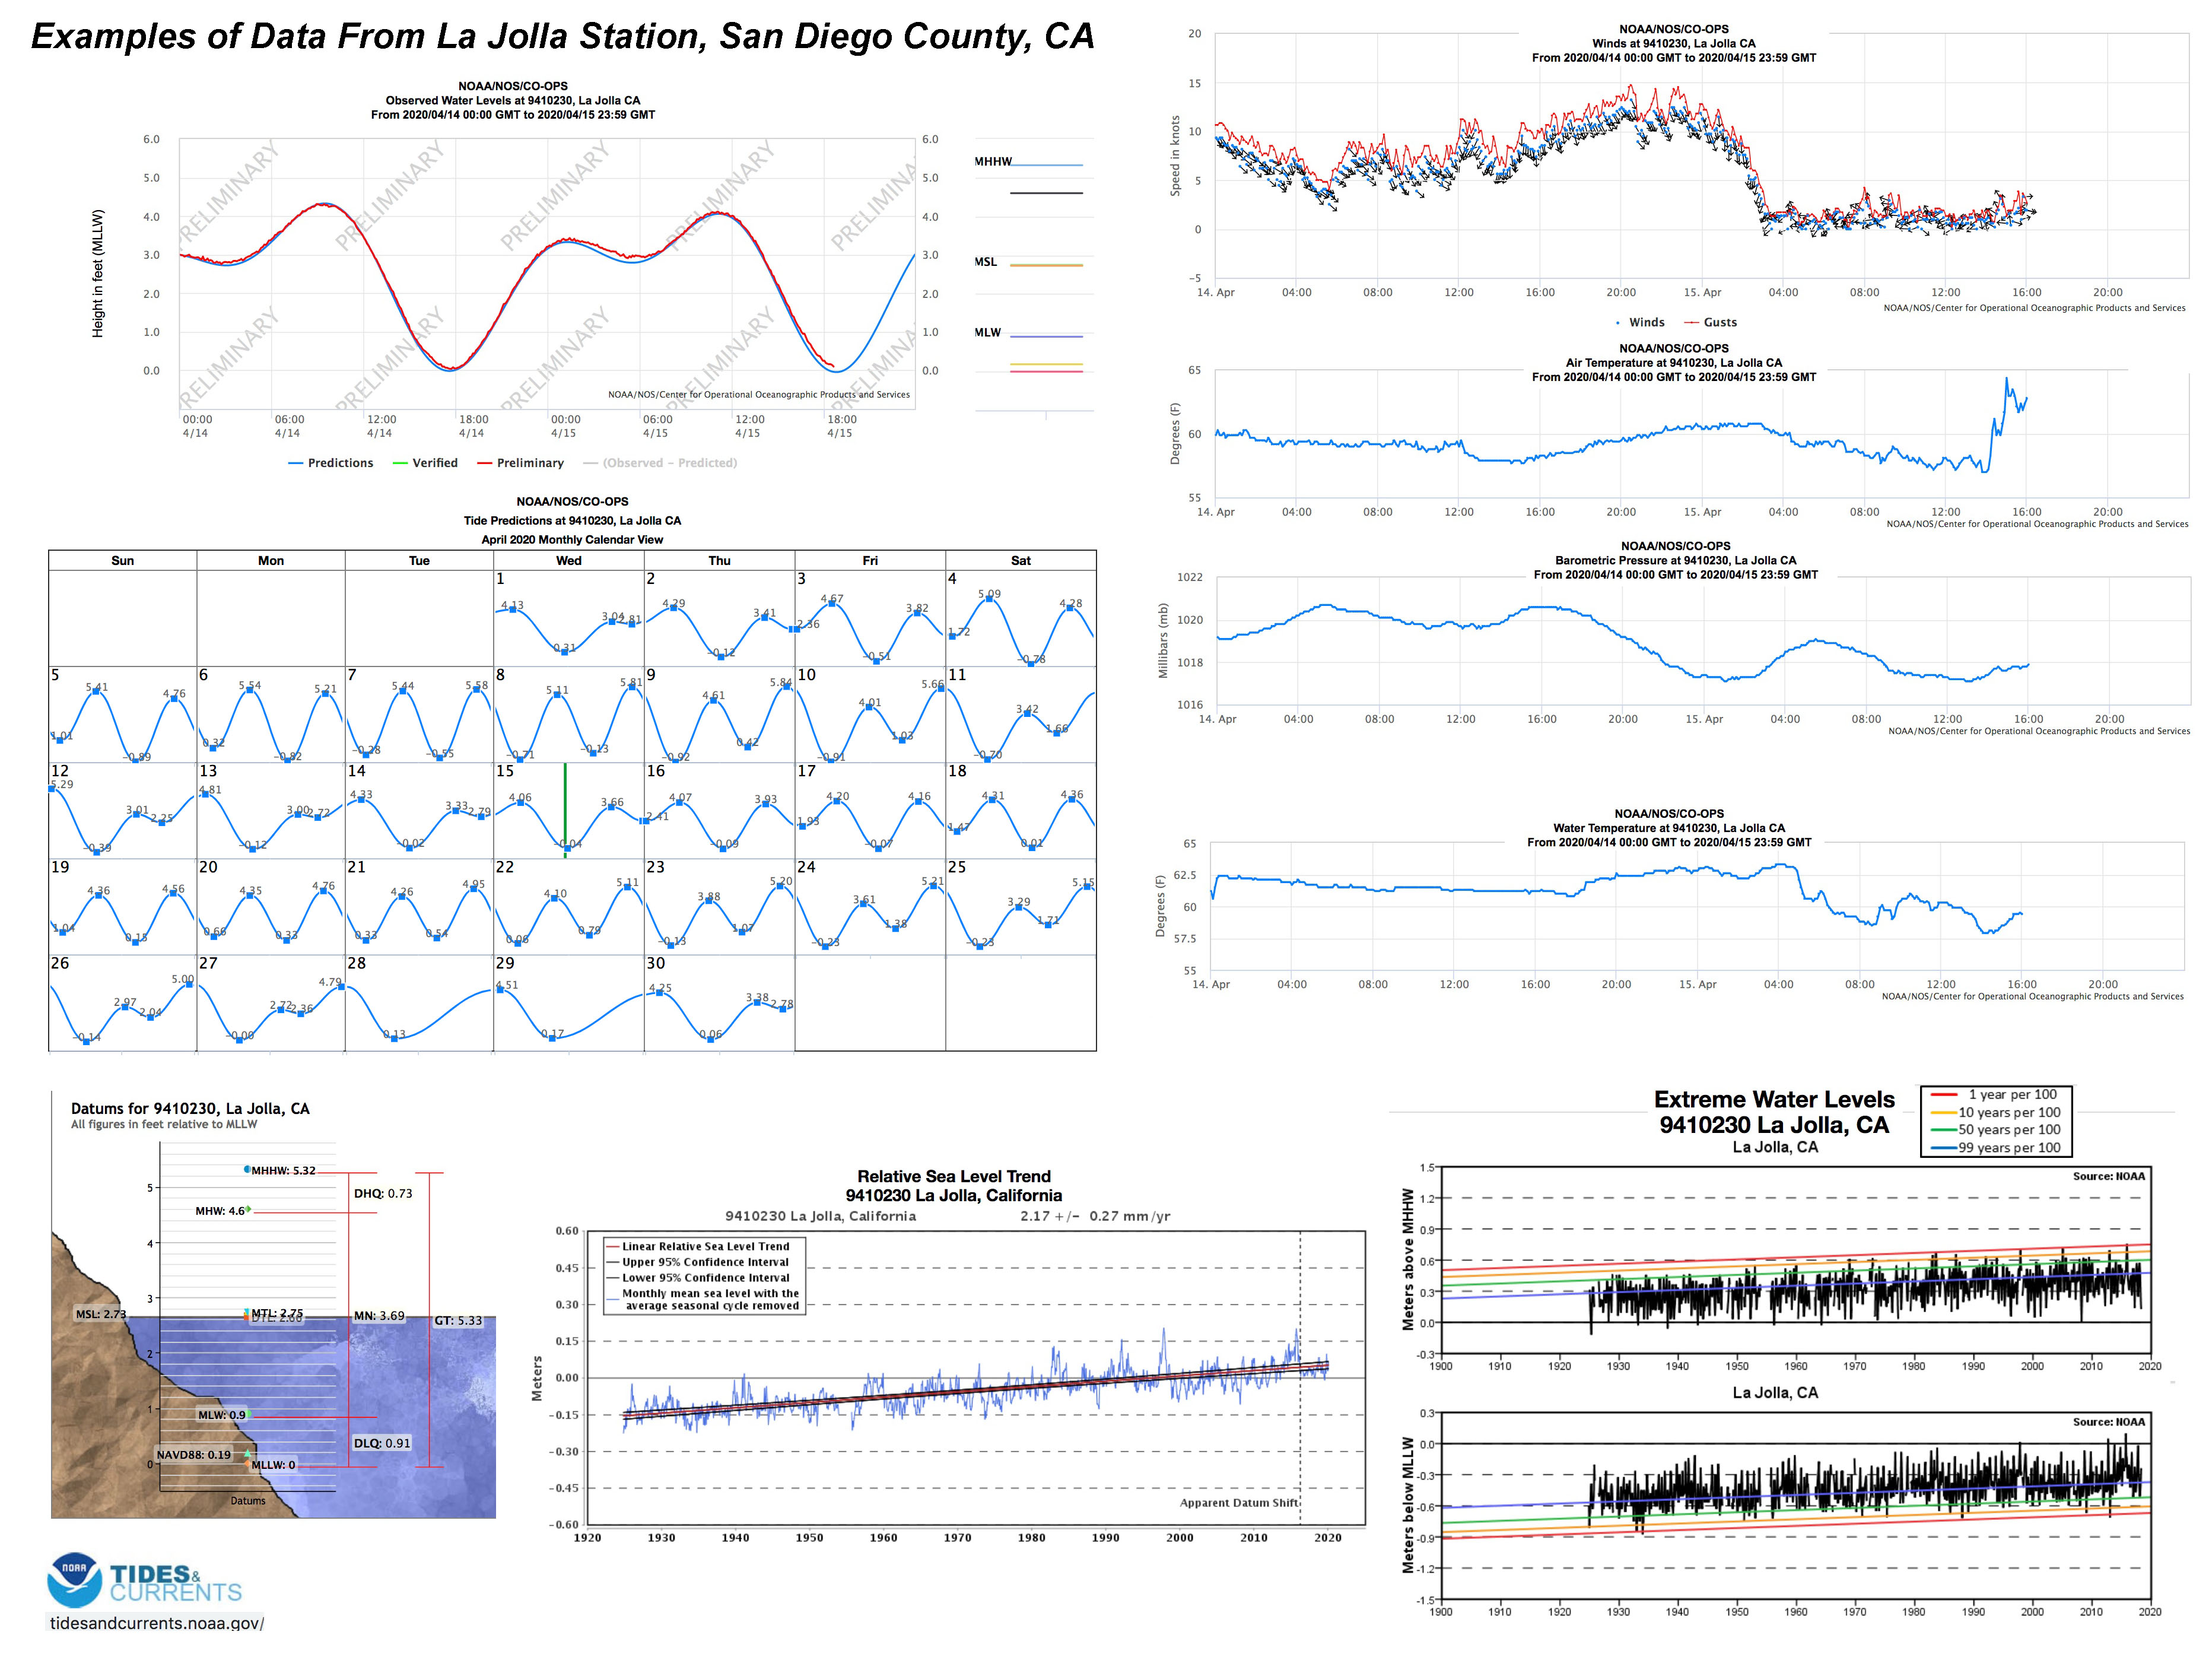 Examples of data from the La Jolla Tidal Current Reference Station. See current data for La Jolla Tidal Station. Examples of data from the La Jolla Tidal Current Reference Station. See current data for La Jolla Tidal Station. |
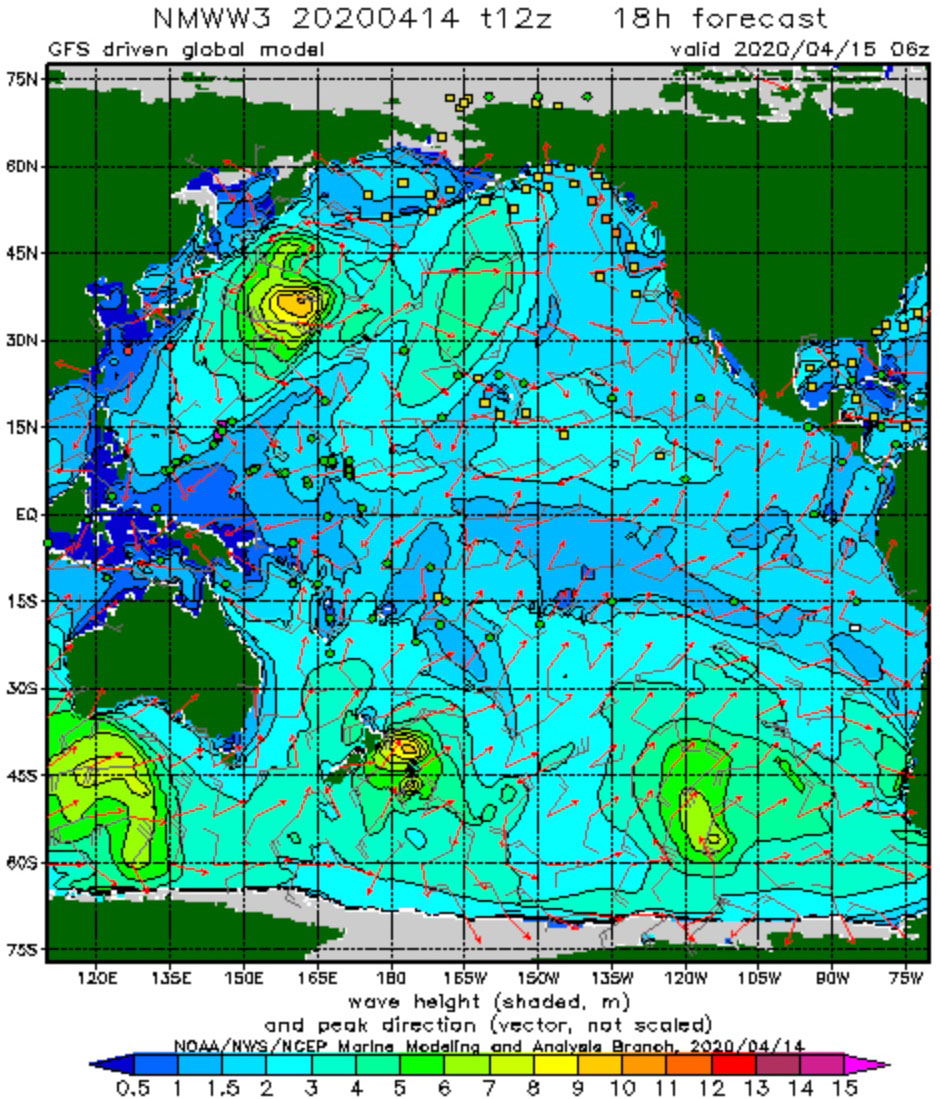
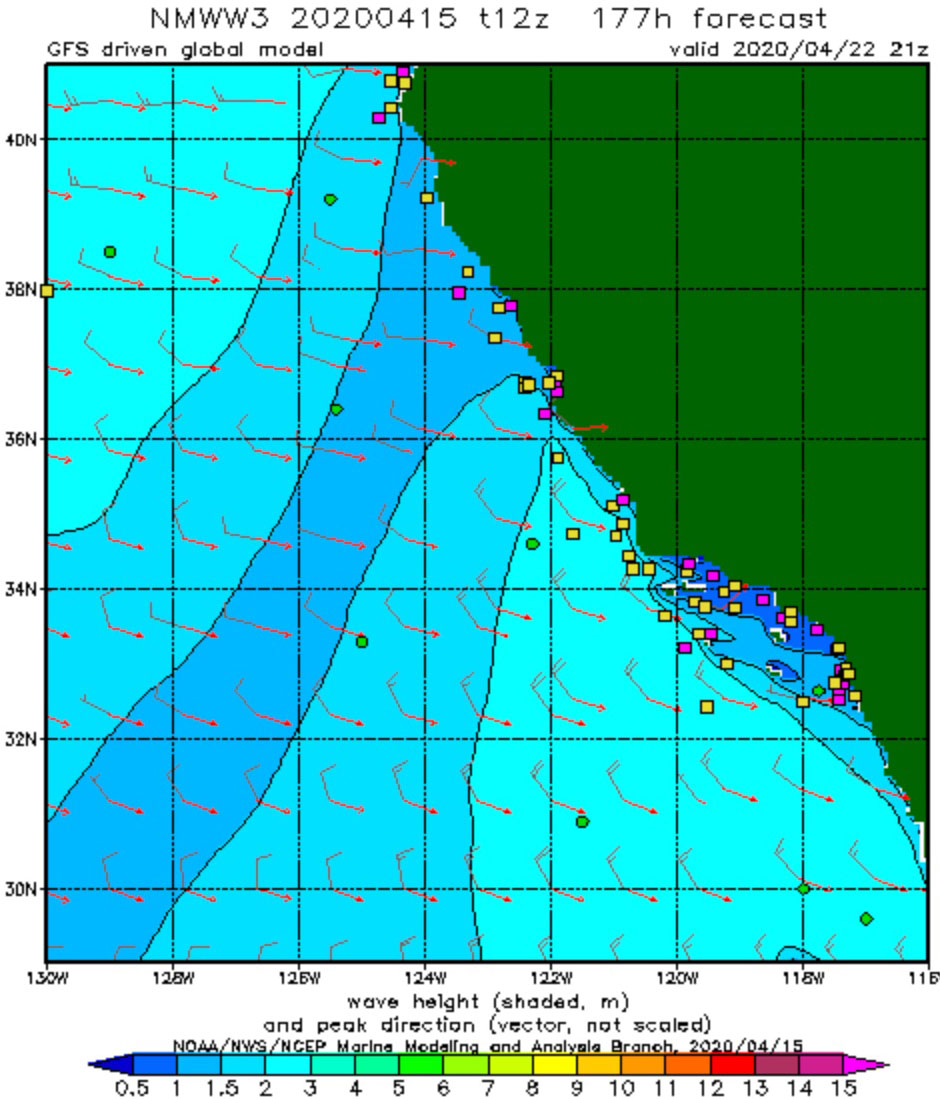
Wave and Swell DataNOAA maintains a system called Wavewatch III that provides global coverage of wave height an peak direction. This website provides current conditions and forecasts for ocean wave height and wave periods combined with wind speed and direction data derived from NOAA wave buoy real-time data. This data is important to any ships traveling at sea, vulnerable ports and harbors, and, of course, surfers hoping to catch the best waves. The database provides world-wide coverage. The website provides looping images of the different regions of the world. Maps are looping animations that show current and 100 hour forecast conditions.The view on the left shows wave and peak direction for the Pacific Basin region. The view on the right shows detail for the California region. The small colored dots show the location of buoys that are collecting information that is fed into the computer model for the NOAA Wavewatch system. |
 |
 |
The nowCOAST Web Mapping PortalNOAA has released a interactive website designed with a focus on coastal and marine weather conditions. It is called the nowCOAST Web Mapping Portal to Real-Time Coastal Observations, Forecasts, and Warnings. This on-line geographic information system (GIS) including:
|
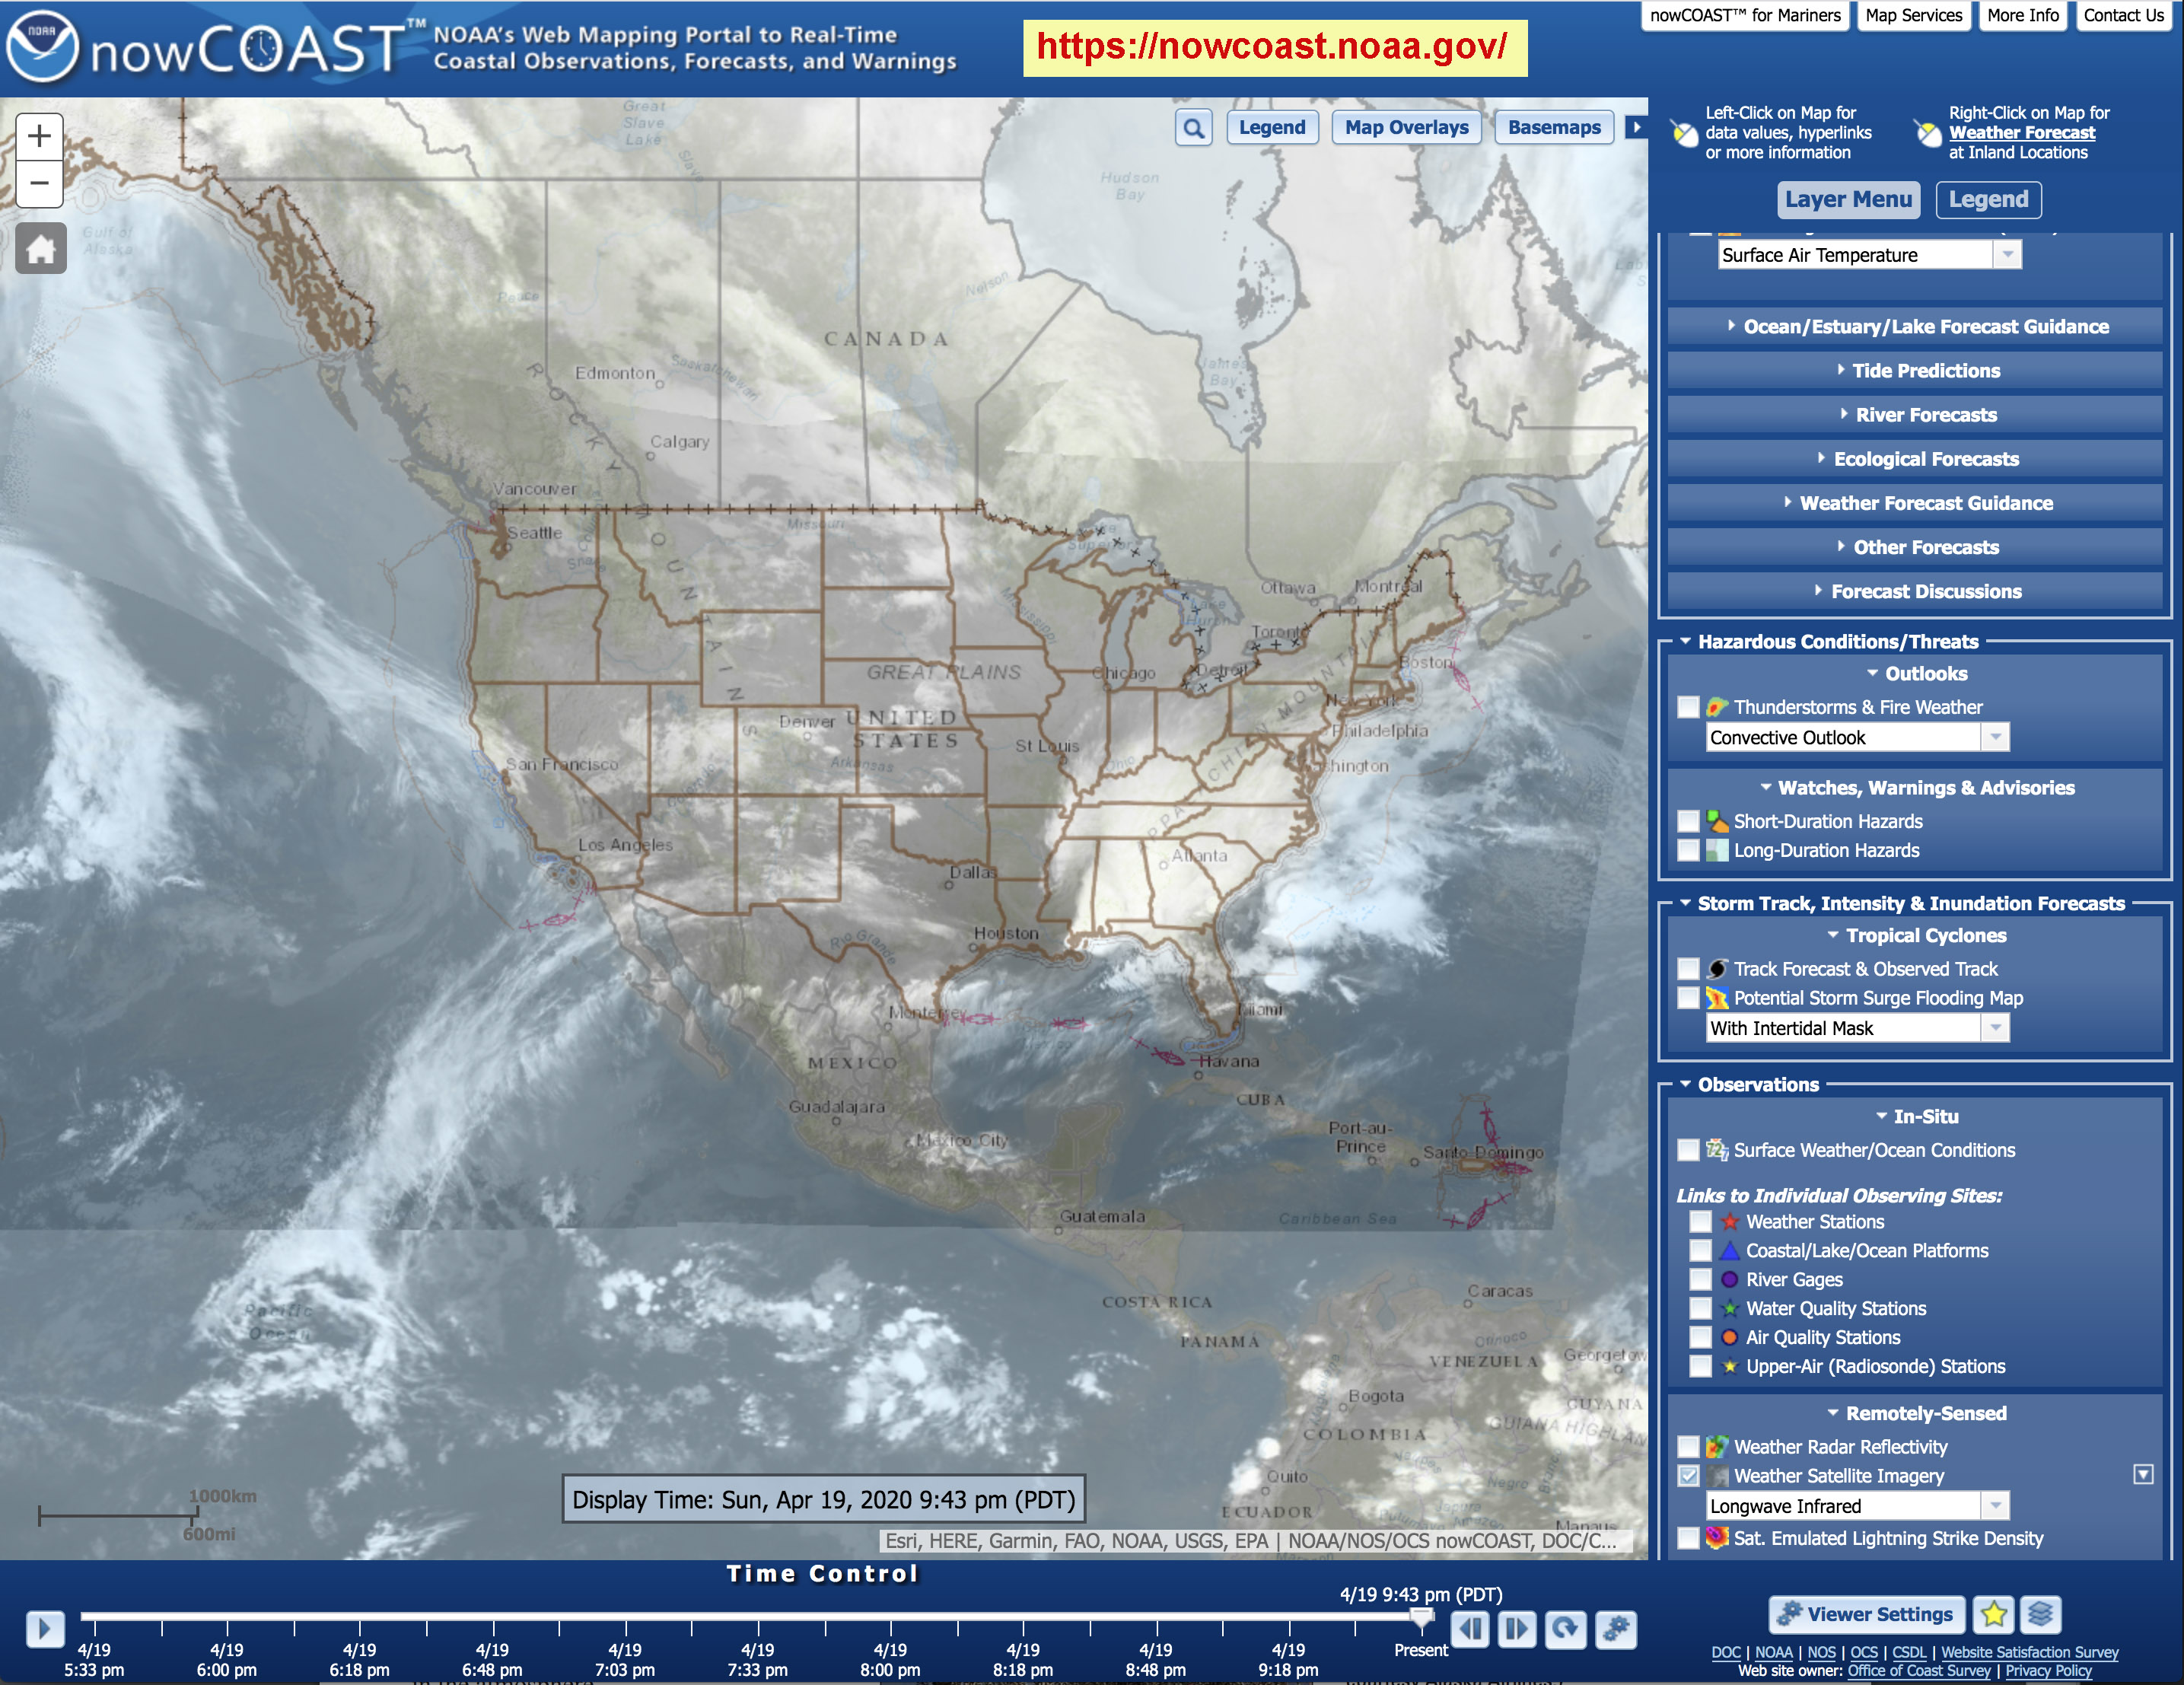 nowCOAST Web Mapping Portal
|
Space WeatherAs our modern society has grown and diversified, it has become vulnerable to the impacts of space weather. The Sun undergoes small changes during solar cycles (averaging 11 years). This changes the amount and variety of radiation the Earth receives from the Sun, impacting weather and climate. Coronal mass ejections create the solar wind that collides with Earth's magnetic field (magnetosphere), causing "solar storms." The magnetosphere traps and deflects the incoming ionized particles, some of which streams into the atmosphere causing the aurora. This energy can also disrupt radio transmissions and damage power grids, and damage satellite systems with ripple effects throughout society. Learn more about Space Weather (NOAA), |
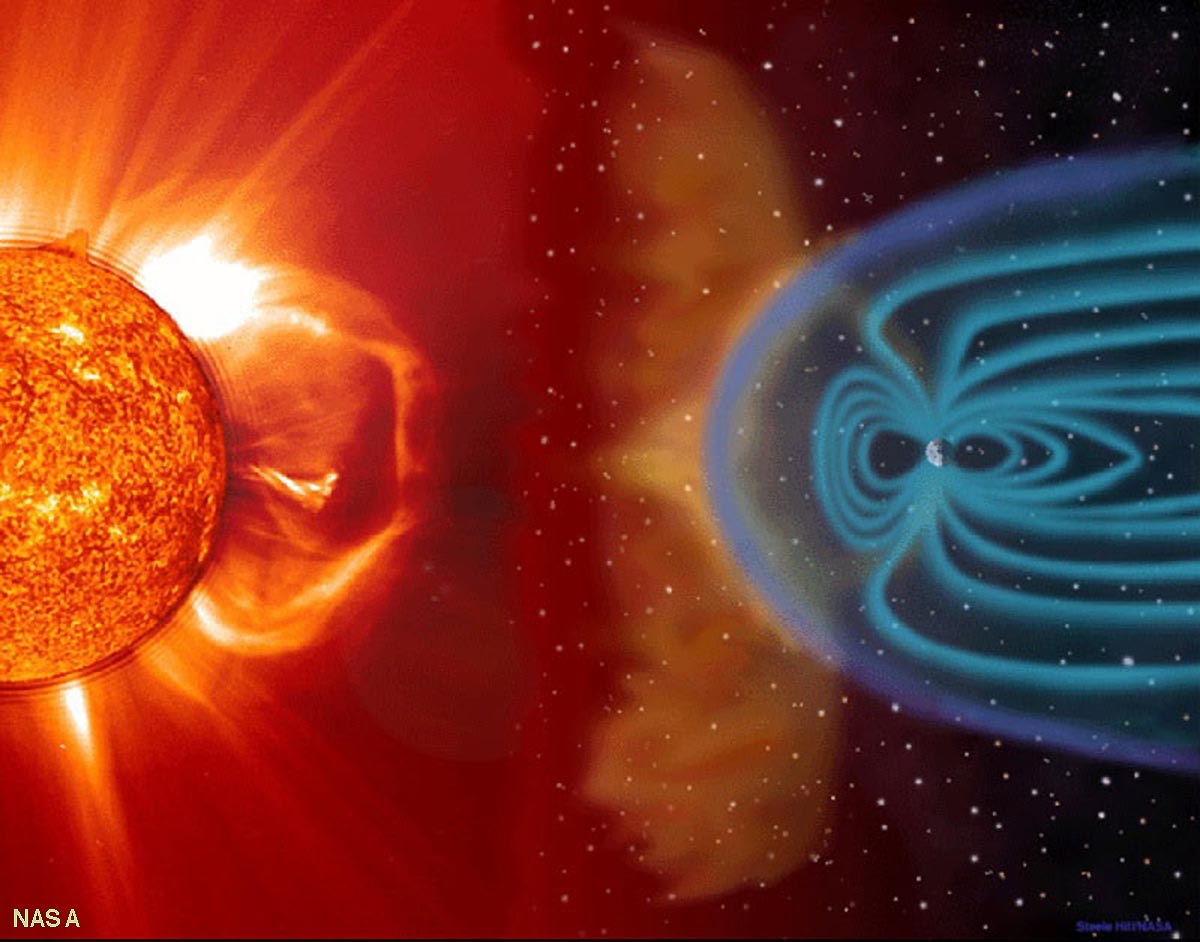 Coronal mass ejections from the Sun create the solar wind that can build in intensity to become solar storms. Coronal mass ejections from the Sun create the solar wind that can build in intensity to become solar storms. |
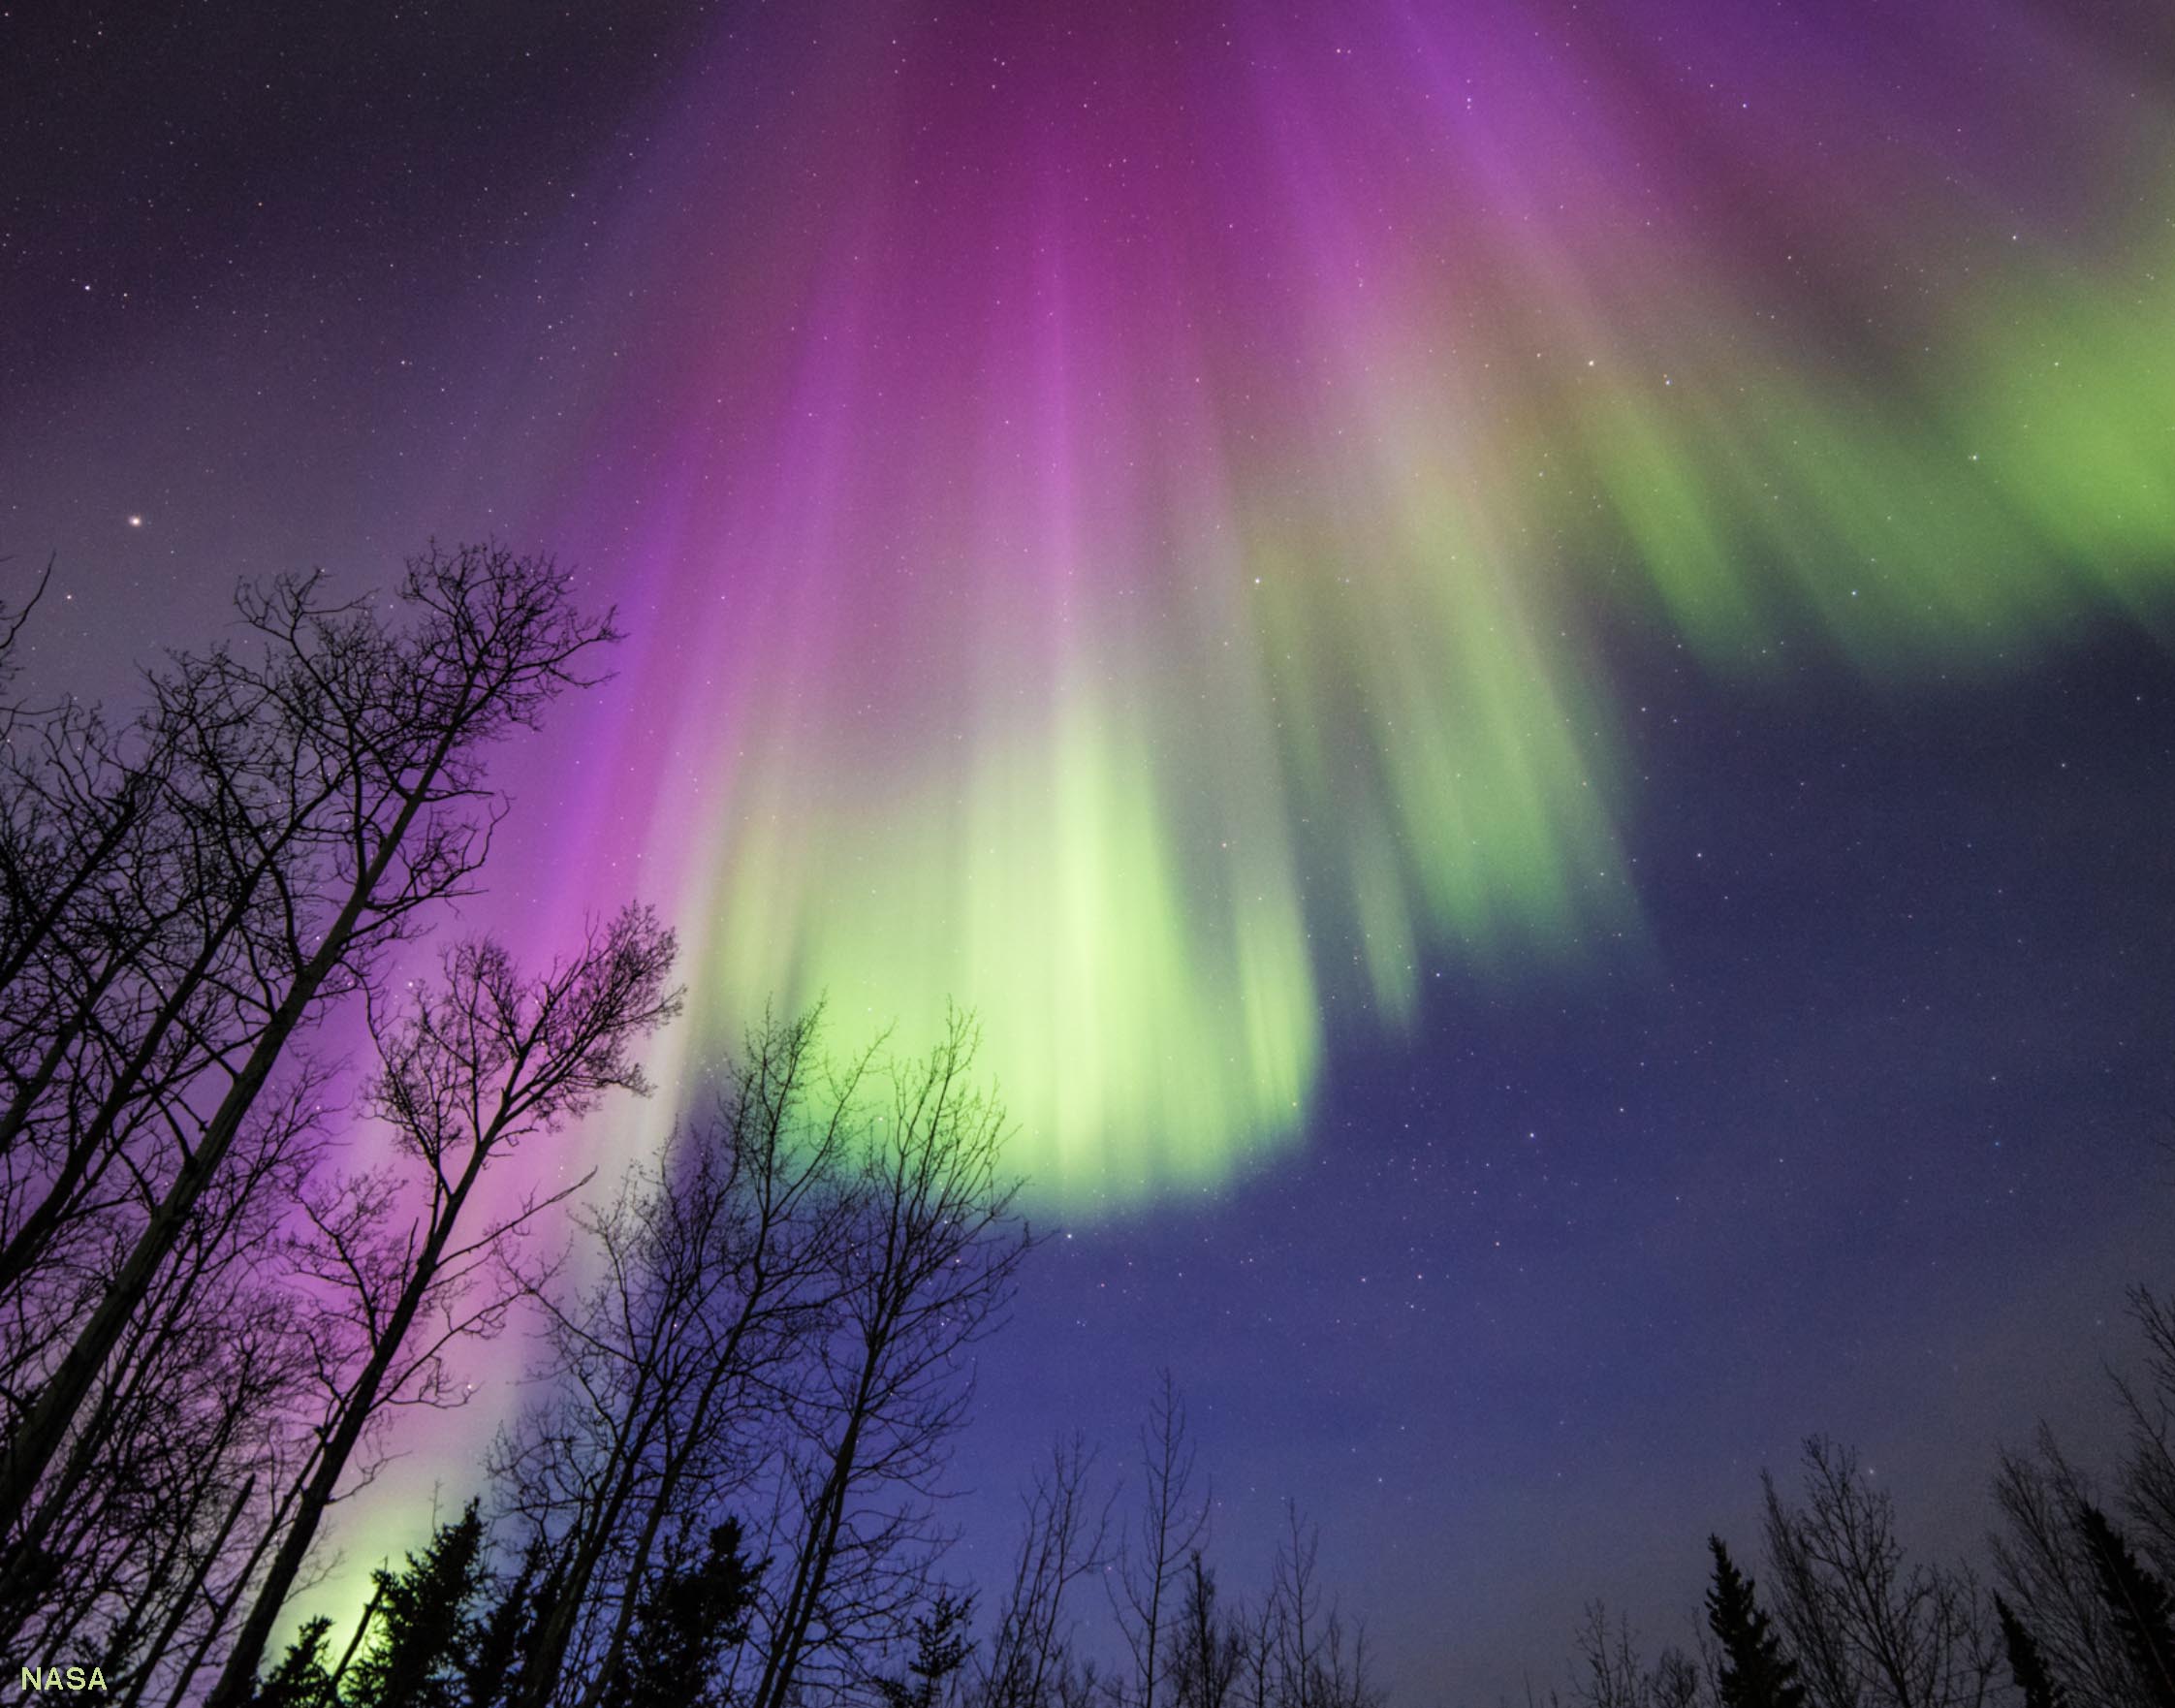 Example of the aurora borealis (northern lights) or aurora australis (southern lights) Example of the aurora borealis (northern lights) or aurora australis (southern lights) |
Local Weather/Climate Phenomena In Southern California |
| Southern California has a unique climate relative to the rest of the United States—arguably the best weather! Coastal regions in Southern California (south of San Francisco) have a Mediterranean climate. A Mediterranean climate is distinguished by having warm, wet winters under prevailing westerly winds and calm, hot, dry summers. Other regions with Mediterranean climate (besides the Mediterranean Sea region) include parts of Chile, South Africa, and southwestern Australia. It is the proximity of warm temperate zone settings adjacent to cooler, stabilizing influence of the nearby ocean. One of it's unique factors is reflected by its historical record of barometric changes since air pressure records started being collected in the San Diego region. ● Highest air pressure: 1033 millibars (February, 1883) ● Lowest air pressure: 987 millibars (January, 2010) This range of 46 millibars is the lowest barometric pressure range anywhere in the United States. Local weather phenomena in Southern California include a sea & land breezes, a marine layer (coastal fog), mountain/valley local breezes, orographic weather, seasonal monsoons, and Santa Ana winds. |
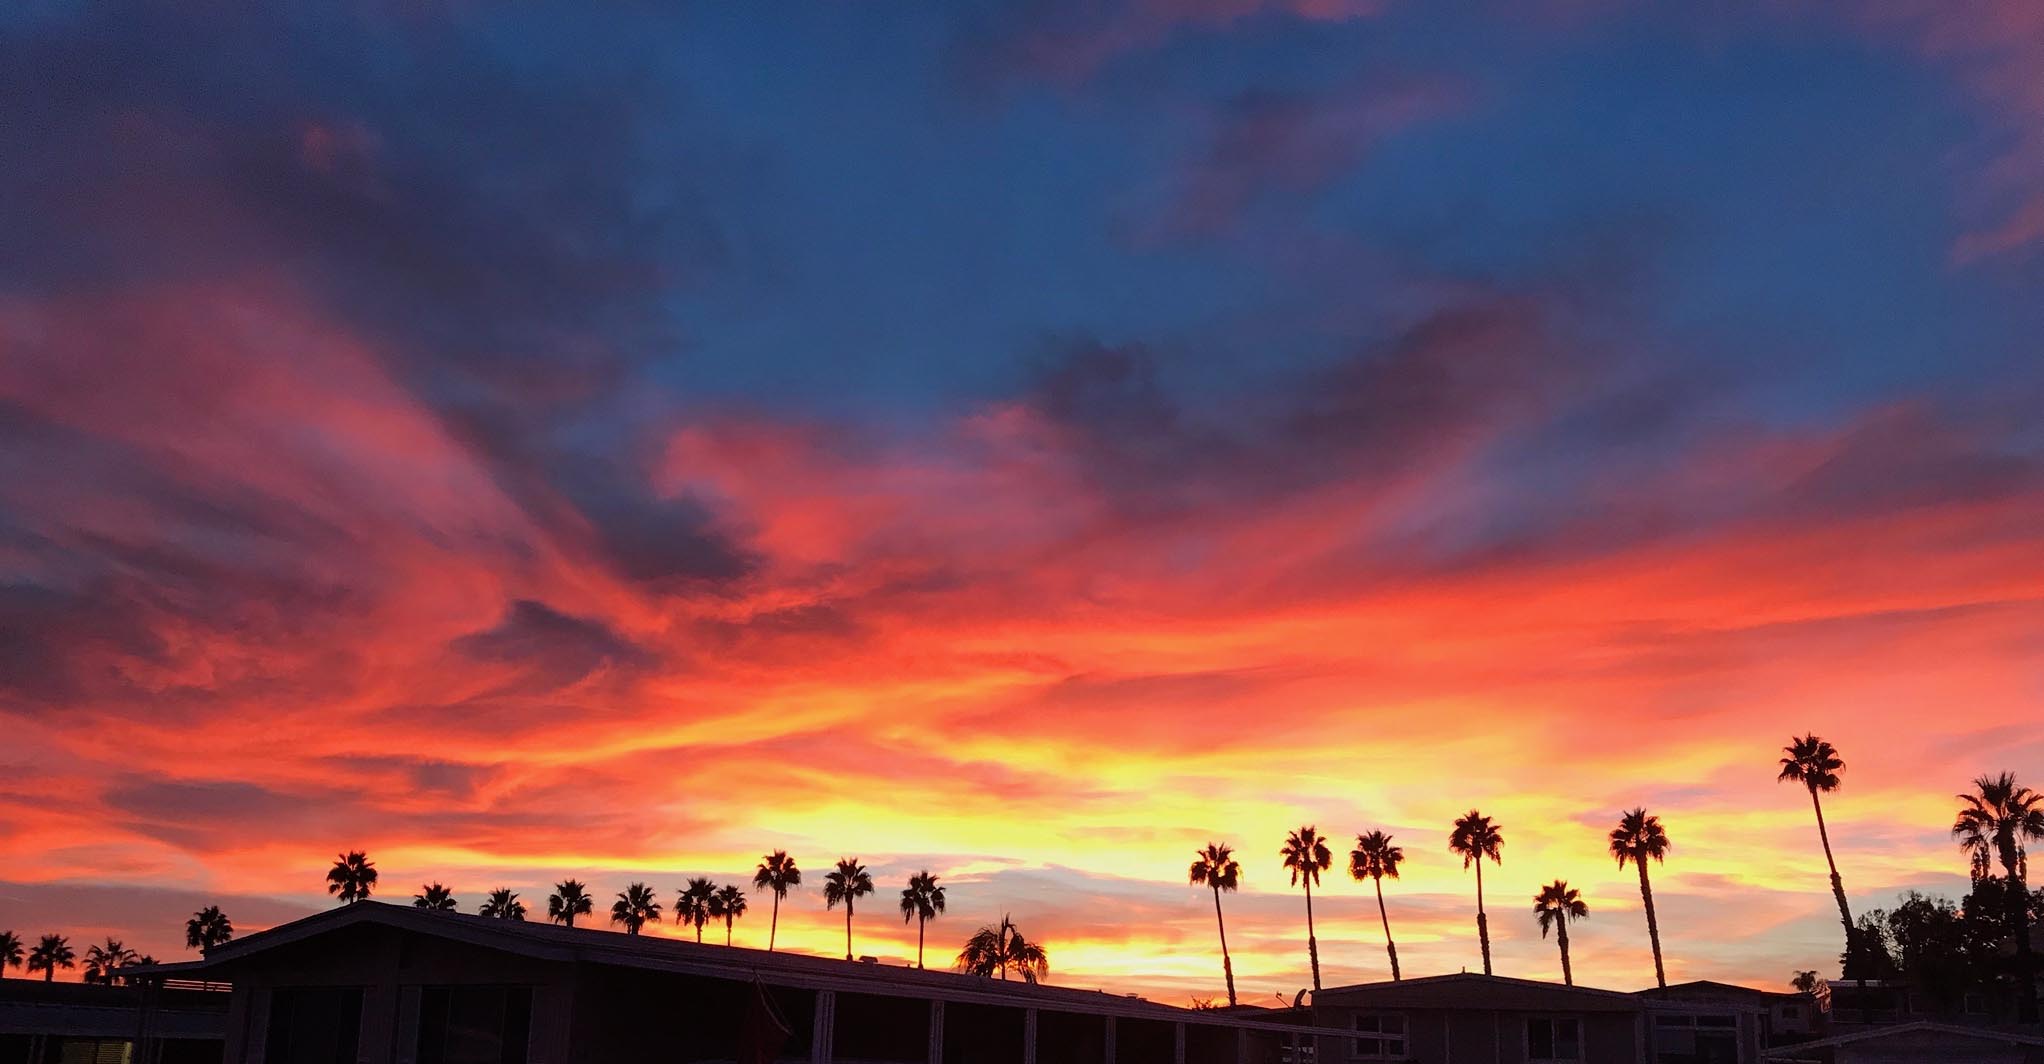
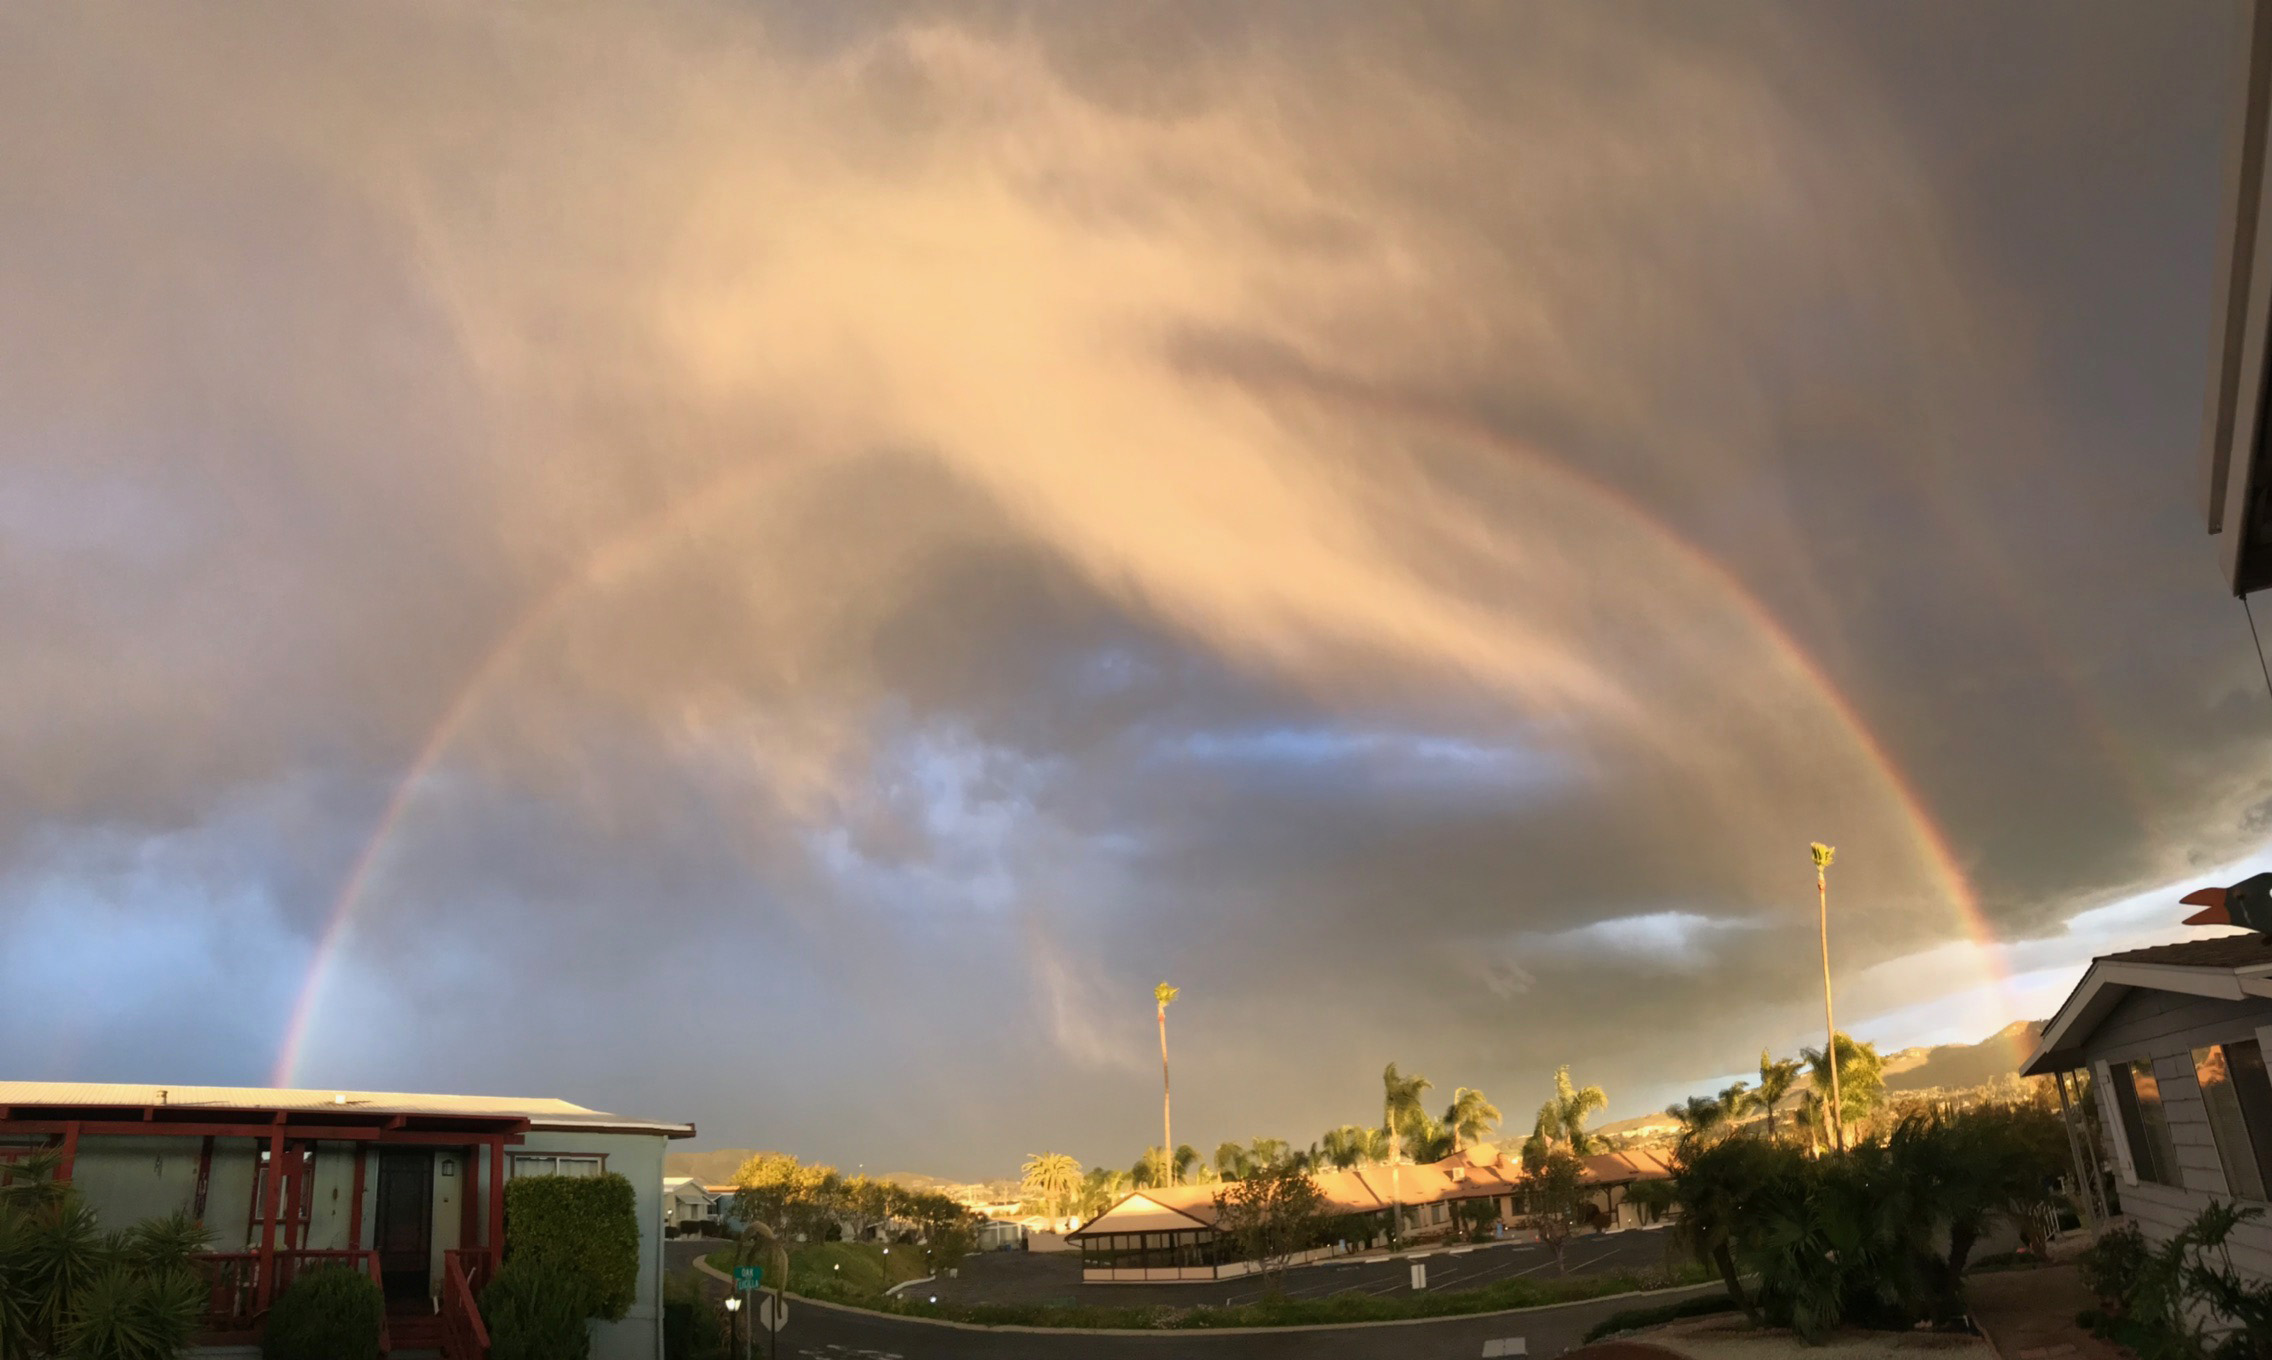
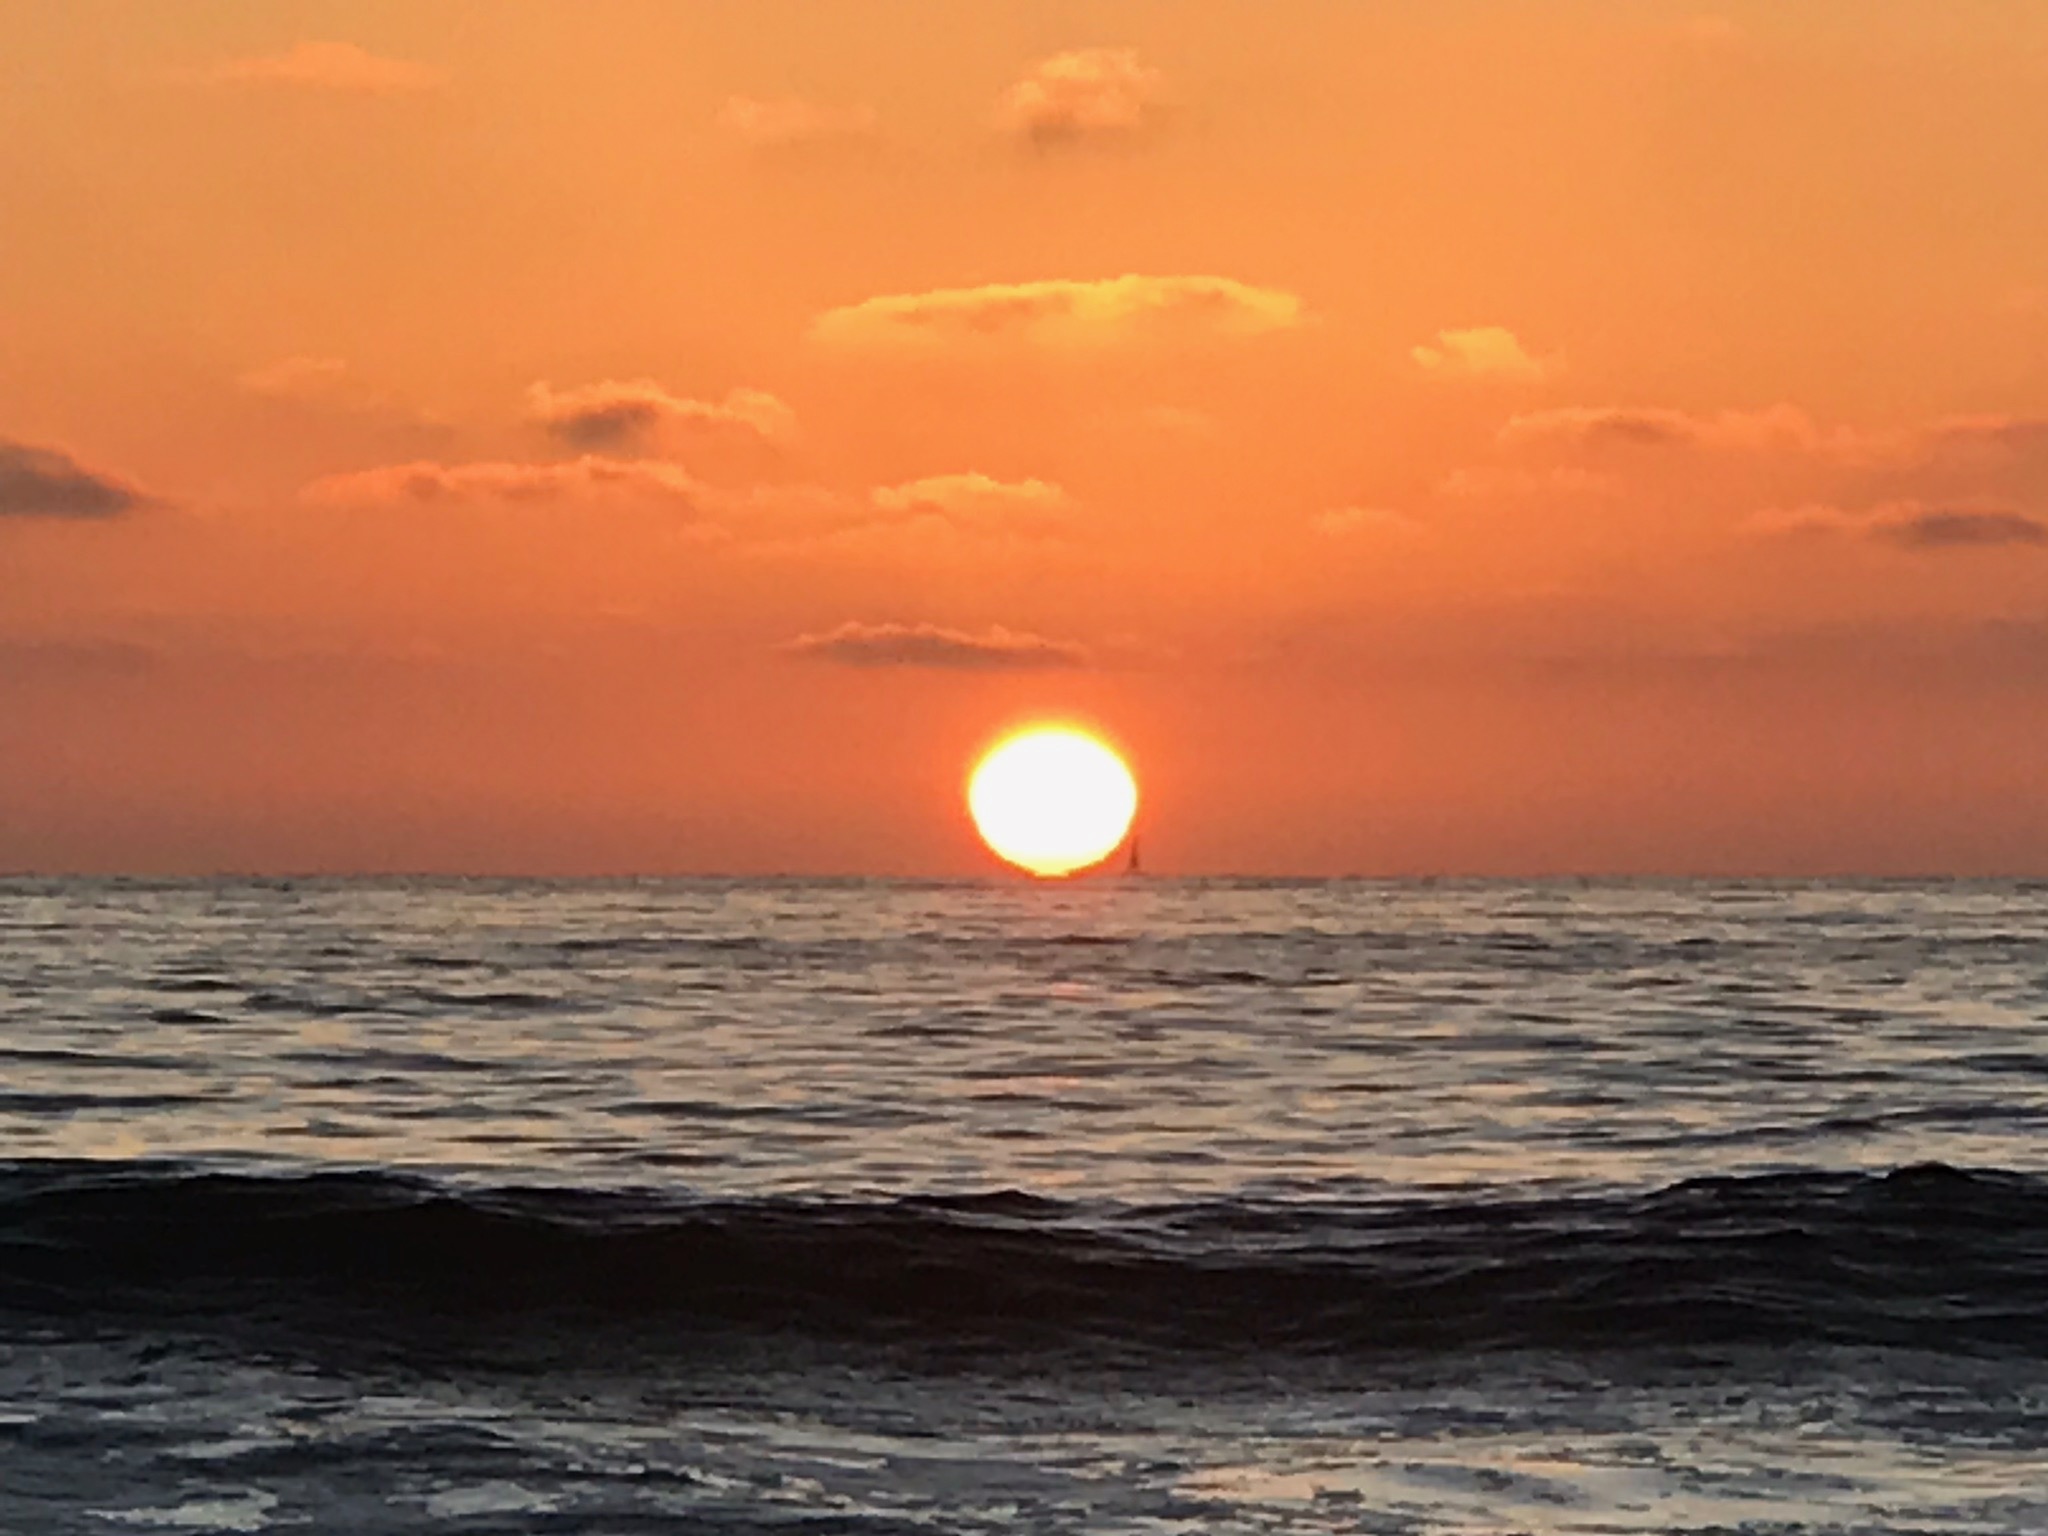 A San Diego beach sunset after a perfect weather day. |
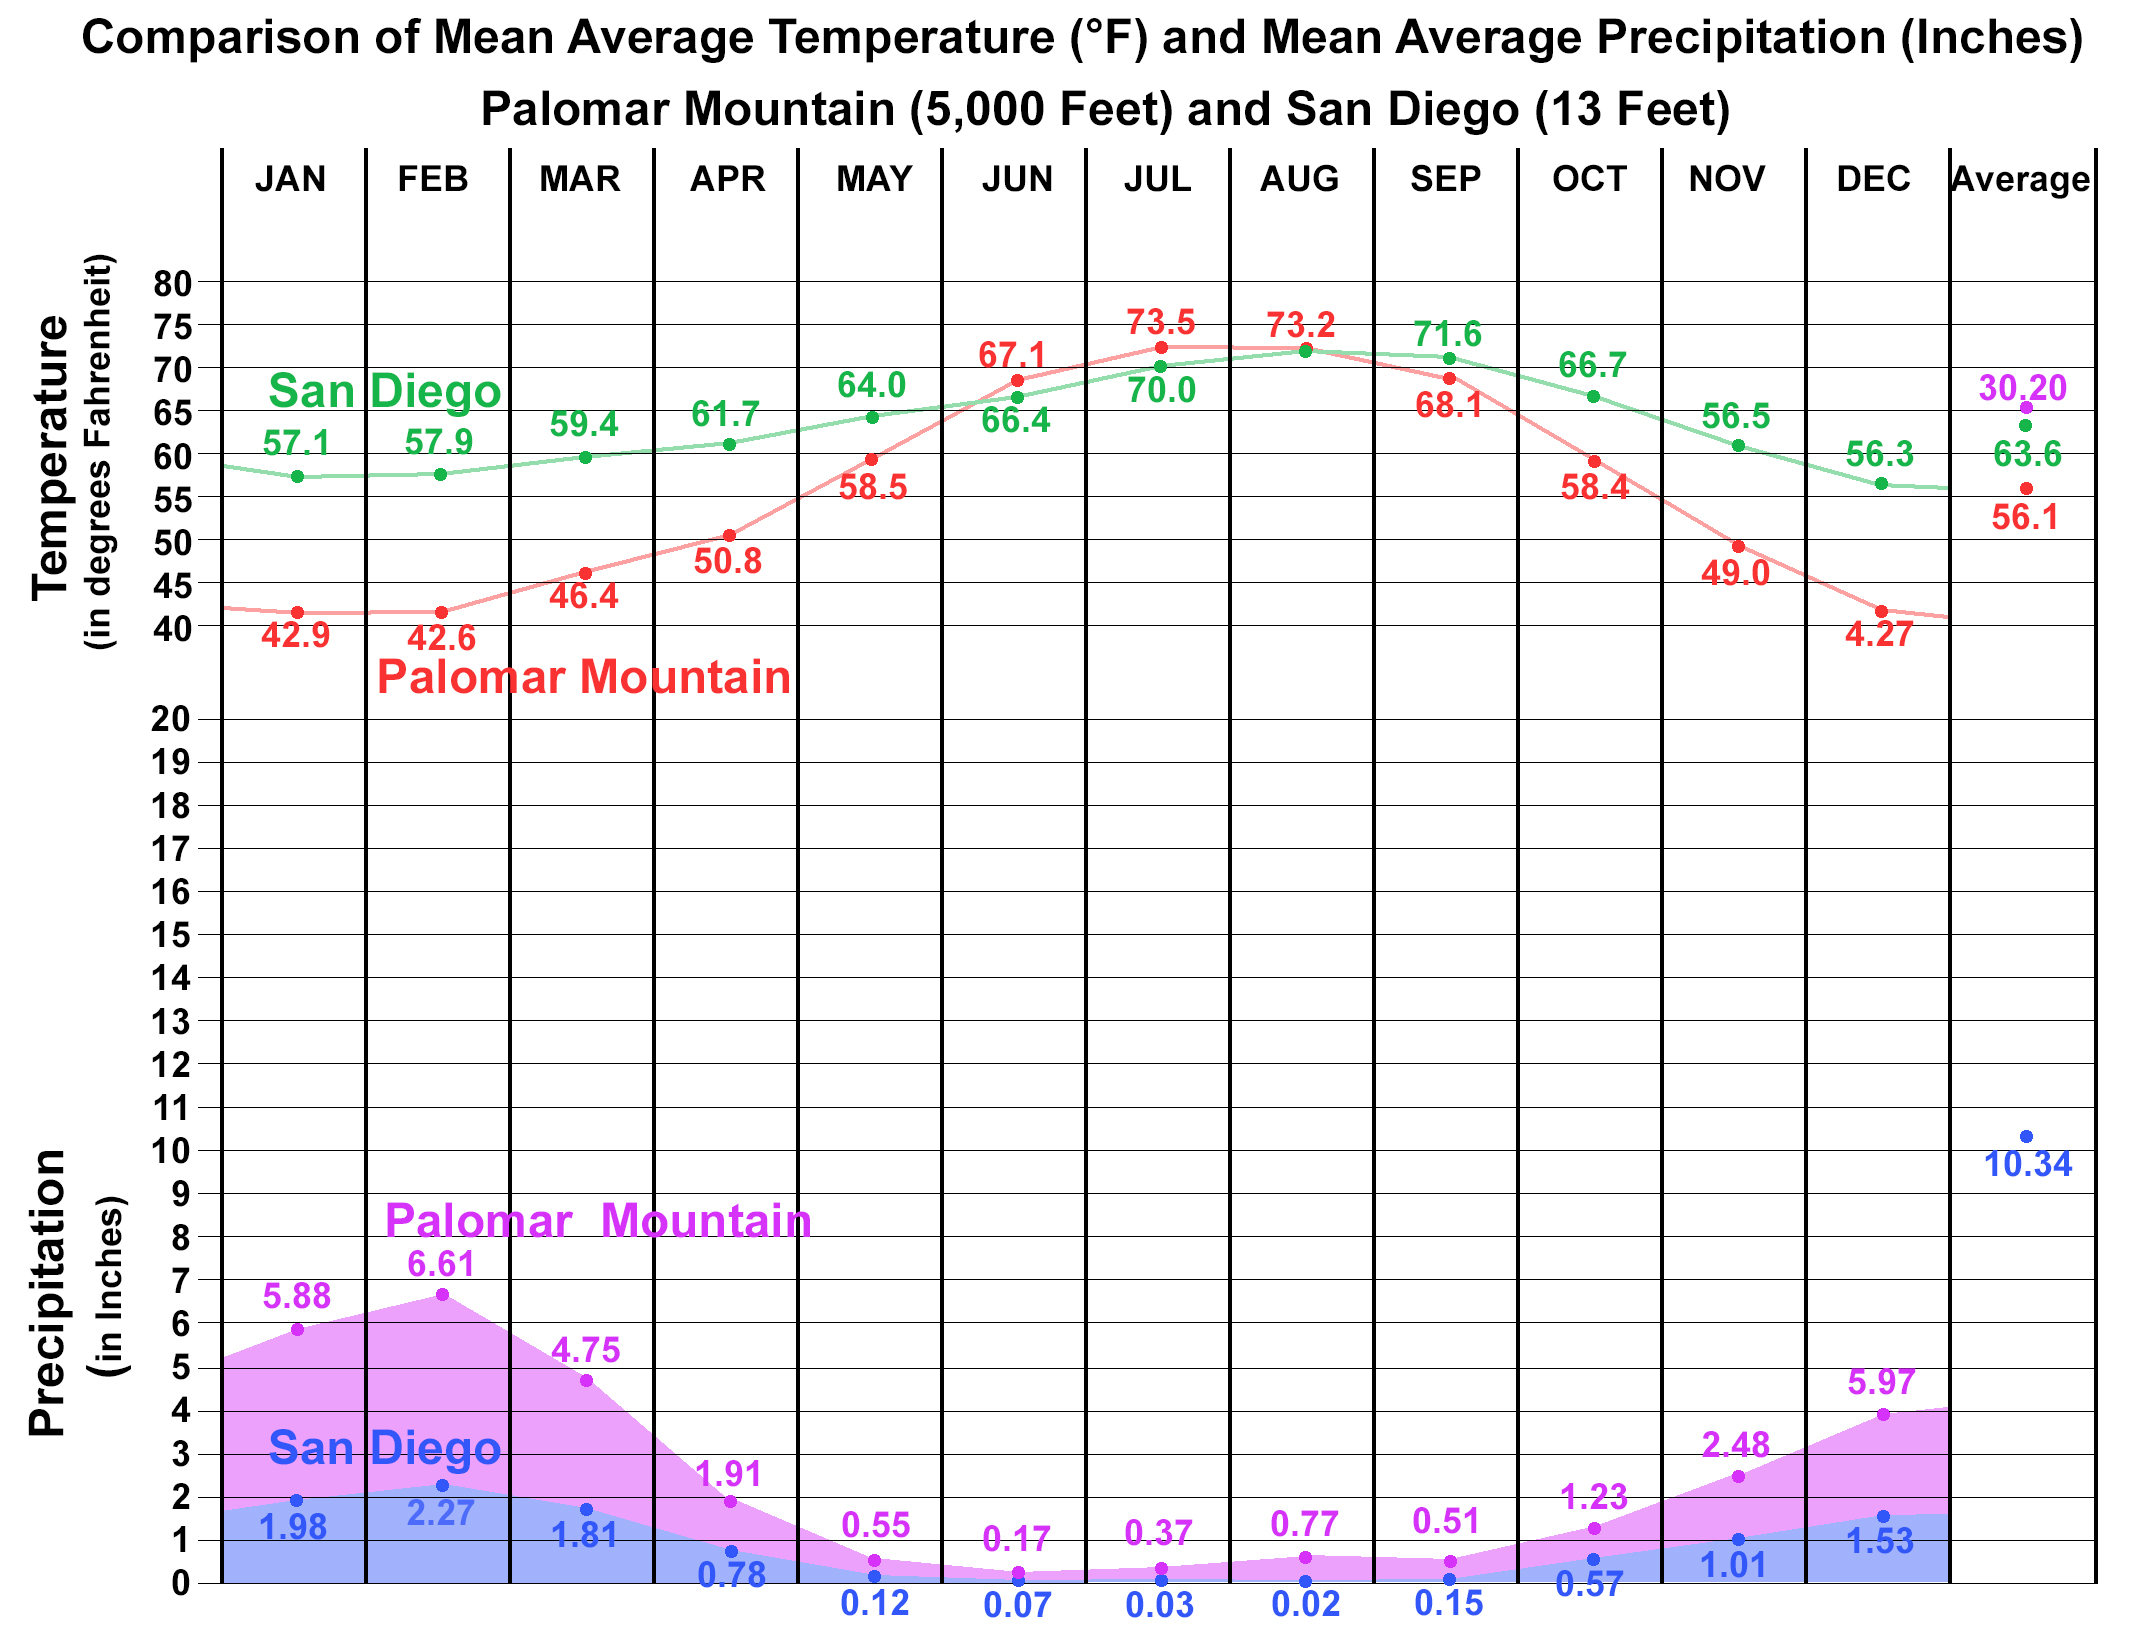
San Diego Seasonal Temperature and Precipitation PatternsIt is difficult to fairly describe the average temperature and precipitation totals for a region the size of San Diego County. The weather conditions along the coast are different than the mountains, inland valley, and the desert east of the mountains. However, data from weather stations around the region can give a useful view of the overall trends in precipitation from seasonal storms.The chart shown here compares 50 years of data from weather stations for San Diego International Airport (a low coastal area) and Palomar Mountain (about 5,000 feet and 30 miles from the coast.) The chart shows the mean average temperature (average of highs and lows) and the total precipitation for each month (with annual totals). The data shows how the low San Diego Airport area climate is moderated by it proximity to the ocean. Whereas Palomar mountain is higher, typically cooler, and therefore receives more precipitation when seasonal storms systems move southward in to the region. The temperature and precipitation differences are greatest in the winter months, but are quite similar in the summer months when arid condition prevail. |
 |
Sea Breeze and Land BreezeCoastal regions experience sea breezes when the regional atmospheric conditions are relatively stable (when no major weather fronts are moving through). Sea breezes build up during daylight hours, typically peaking in the late afternoon when inland heating is at its peak. Using the sea breeze diagram: |
Sea Breeze Conditions (Day Time)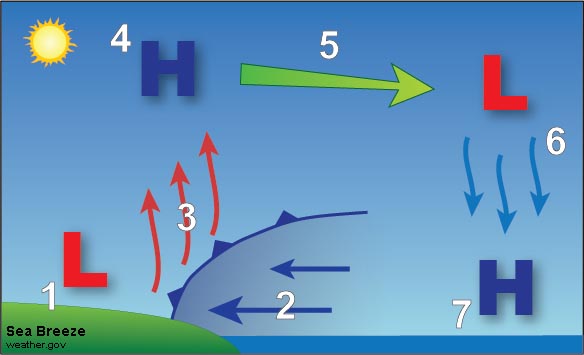 Land Breeze Conditions (Night Time) 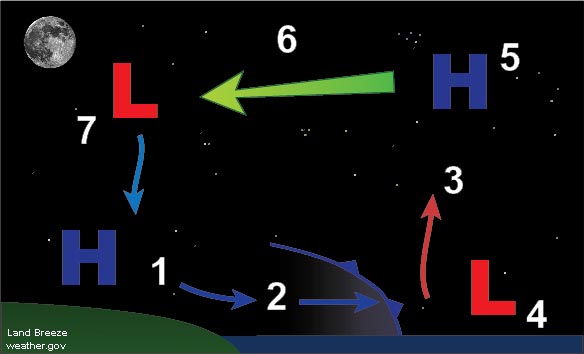 |
Marine LayerA marine layer is the name given to typically low-level stratus clouds associated with an air mass which develops over the ocean or a large lake in the presence of a temperature inversion. An inversion forms when the cold water cools the air near the ocean (or large lake) surface. This increasing the air density near the water surface, creating a layer of cool air stratified below warmer air above. If the air is cooled below the dew point, stratus cloud will form, fog if the clouds form at or near the surface.In Southern and Central California, strong marine layer conditions typically develops in the late spring to early summer. With seasonal stable air masses common at that time of year, a persistent marine layer (with clouds and fog) can develop in coastal regions. The condition is locally referred to as May Gray and June Gloom. During any part of the year, sea breeze conditions can draw a marine layer onshore, again starting typically toward the late afternoon to evening hours. Marine layer clouds typically dissipate with daylight warming and atmospheric convection and turbulence associated with regional winds. |
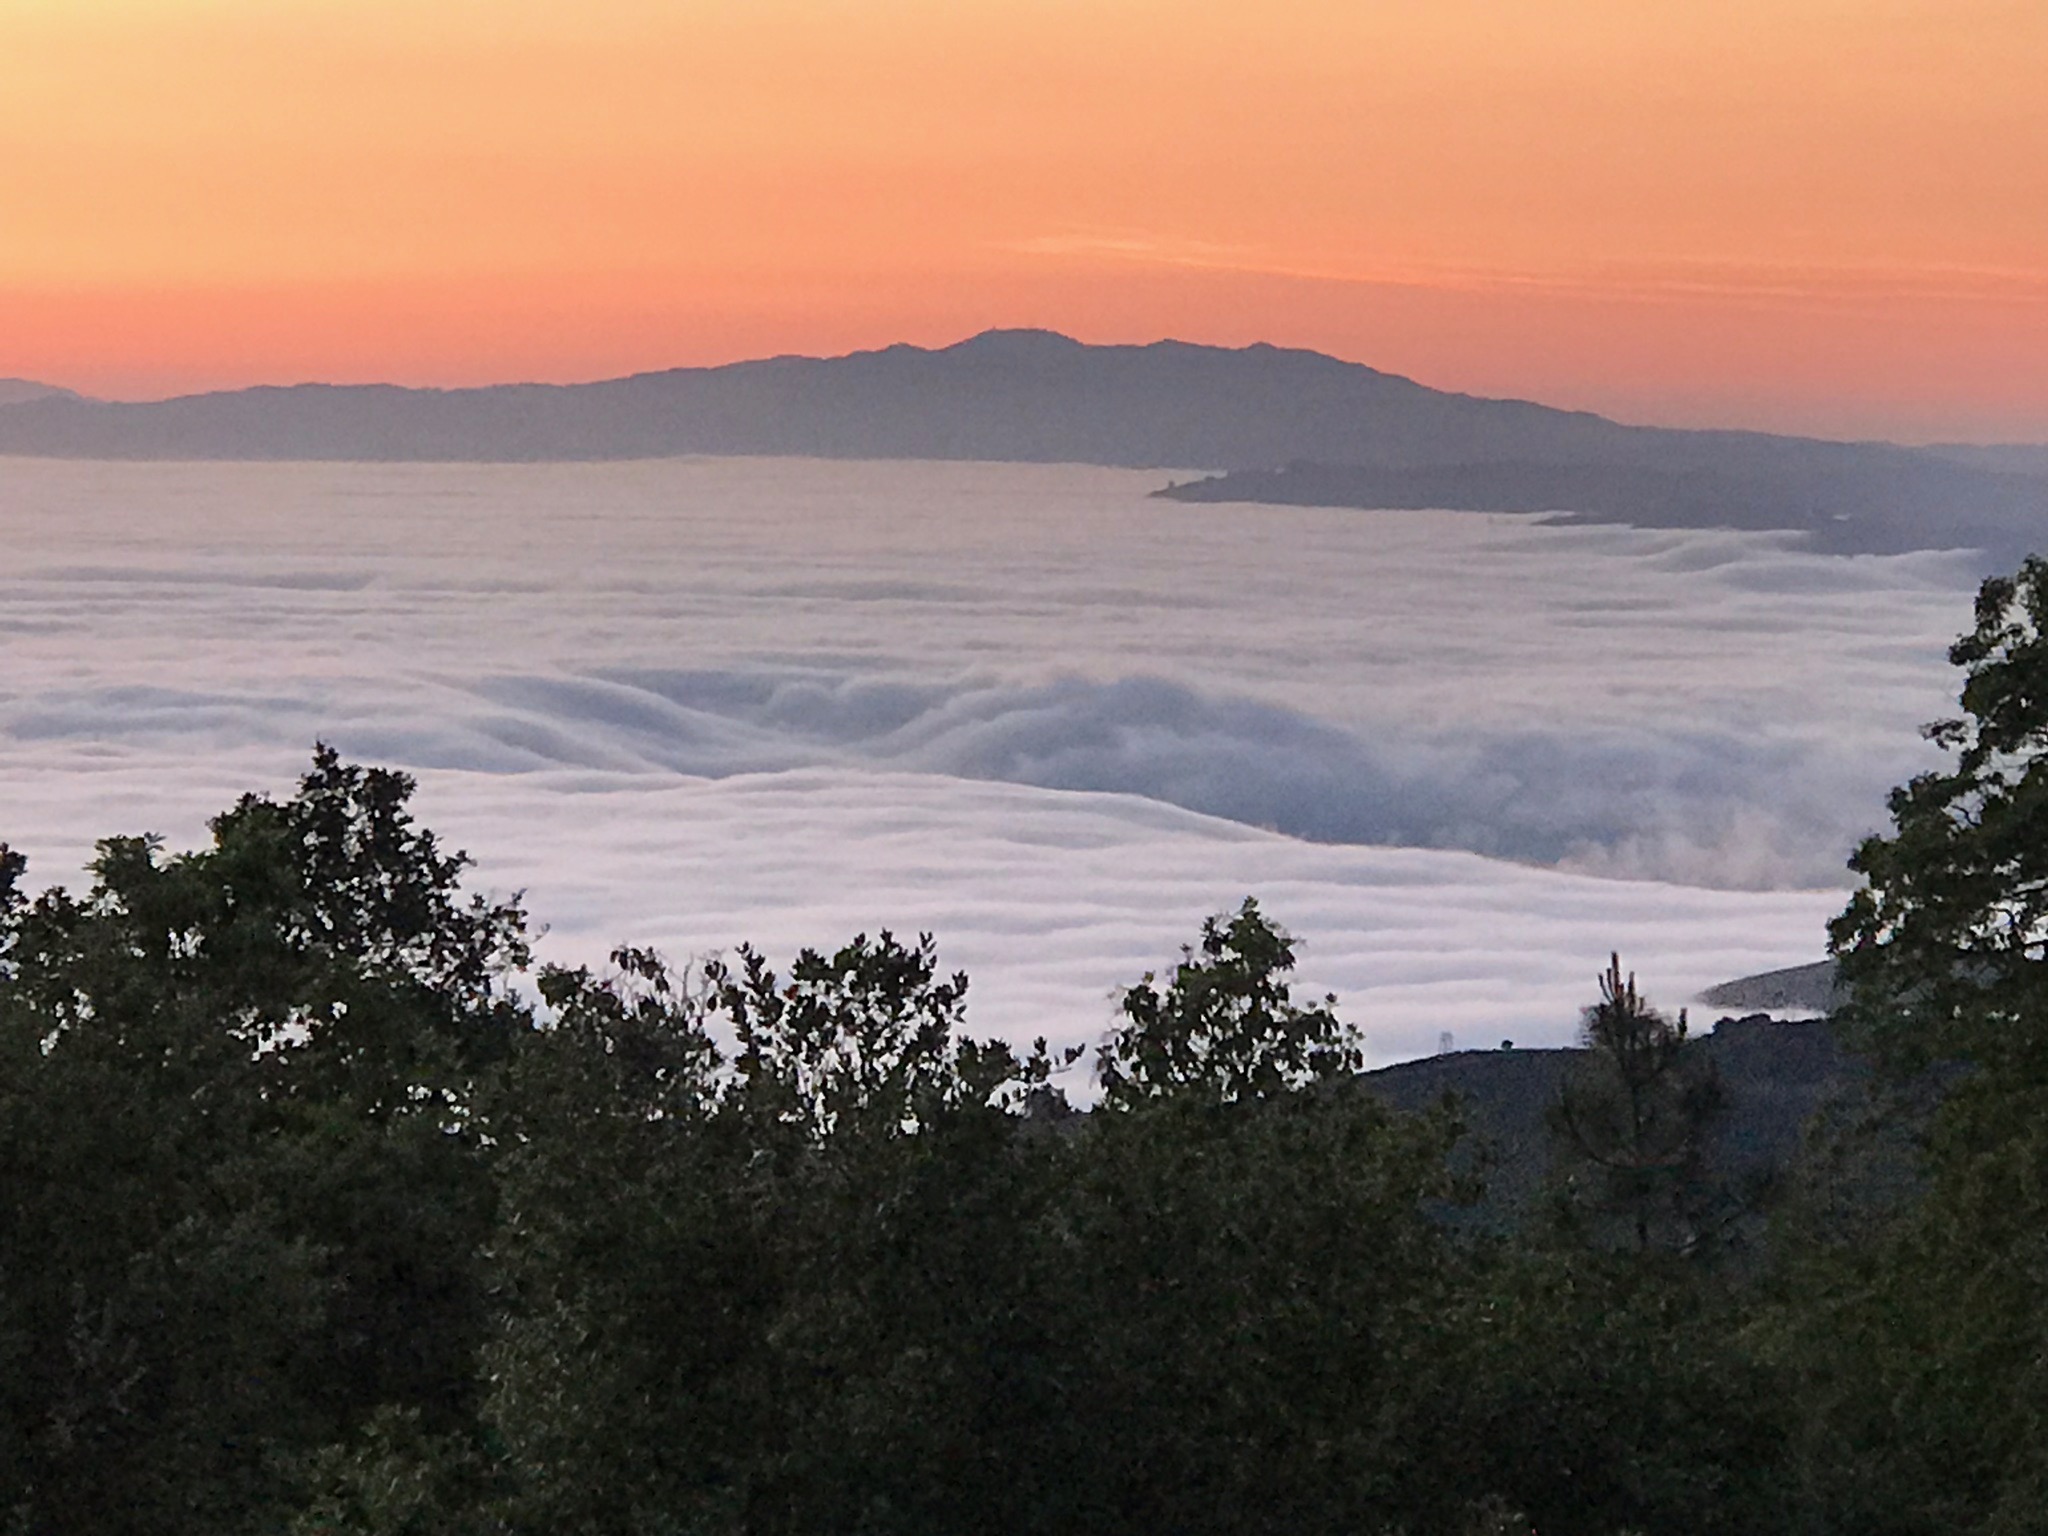 A marine layer in the Monterey Bay region. |
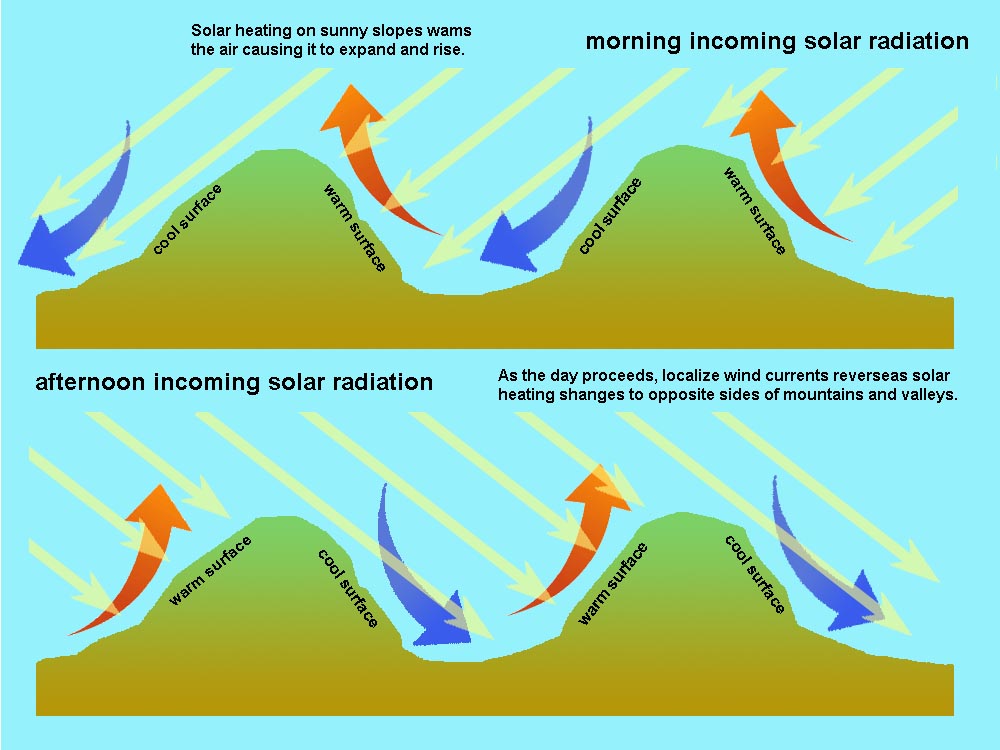
Solar Heating and Mountain/Valley Local BreezesIn inland regions, daytime solar heating and nighttime radiative cooling can create localized air currents. Slopes facing the sun receive more intense sunlight, resulting in more solar heating. South-facing slopes in the northern hemisphere receive more solar heating than north-facing slopes. Also, morning sunlight heats east-facing slopes and afternoon sunlight heats west-facing slopes. The warmer surfaces cause the air near the surface to heat up and rise as local air currents. These air currents will change direction as time passes through daylight hours. Cooler air from cooler slopes sinks into the valleys displacing warmer air in the valleys. During night-time hours, cool air settles into the valleys and eventually stabilizes before the next day's solar heating cycle begins. These localize air currents are impacted by regional prevailing wind patterns and disrupted by moving storm systems. |
 |
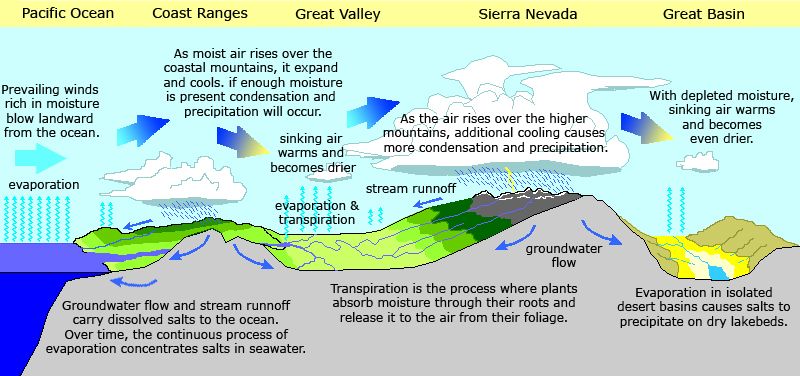
Orographic Clouds Over Coastal Mountain RangesHere in Southern California, it it quite common to have clear or fair weather conditions along the coast, but off to the east there may be thunderstorms (cumulonimbus clouds) building over the mountains to the east along the mountain ridges in peaks of California's Coast Ranges, Transverse Ranges, and Peninsular Ranges, and the higher Sierra Nevada and other ranges of desert regions further inland. Moist air moving eastward off the Pacific Ocean is forced to move upwards, forcing it it expand and cool. The moist are eventually cools below the dew point and clouds form. If enough moisture is present it results in the buildup of thunderstorms. |
 |
Summer MonsoonThunderstorms are not uncommon in the late summer in Southern California, particular in the late afternoons over the coastal mountain ranges. Starting in mid June, Southern California begins to experience summer monsoons when moist air masses stream northward out of the tropical regions (including from the Gulf of California region). Monsoon season typically ends in late September. Prior to the onset of the monsoon, temperatures across the Desert Southwest are extremely hot and humidity levels are quite low. Monsoonal thunderstorms can result in lightning that starts wildfires, particularly in forested upland regions. |
 |
Santa Ana WindsSanta Ana winds are strong, dry wind that originate when a cool, dry high pressure airmass moves into the Great Basin region (southwestern interior of the US). The anticyclone rotation of wind around the high pressure center creates downslope winds that heat up as they move toward low-pressure centers or troughs in the coastal regions or offshore. Santa Ana wind are most common in the fall, commonly the warmest time of the year in the region. The Santa Ana winds can create high winds and the lowest relative humidity conditions of the year in Southern California. The combination of high temperatures, high winds, and low humidity result in high fire risk condition. |
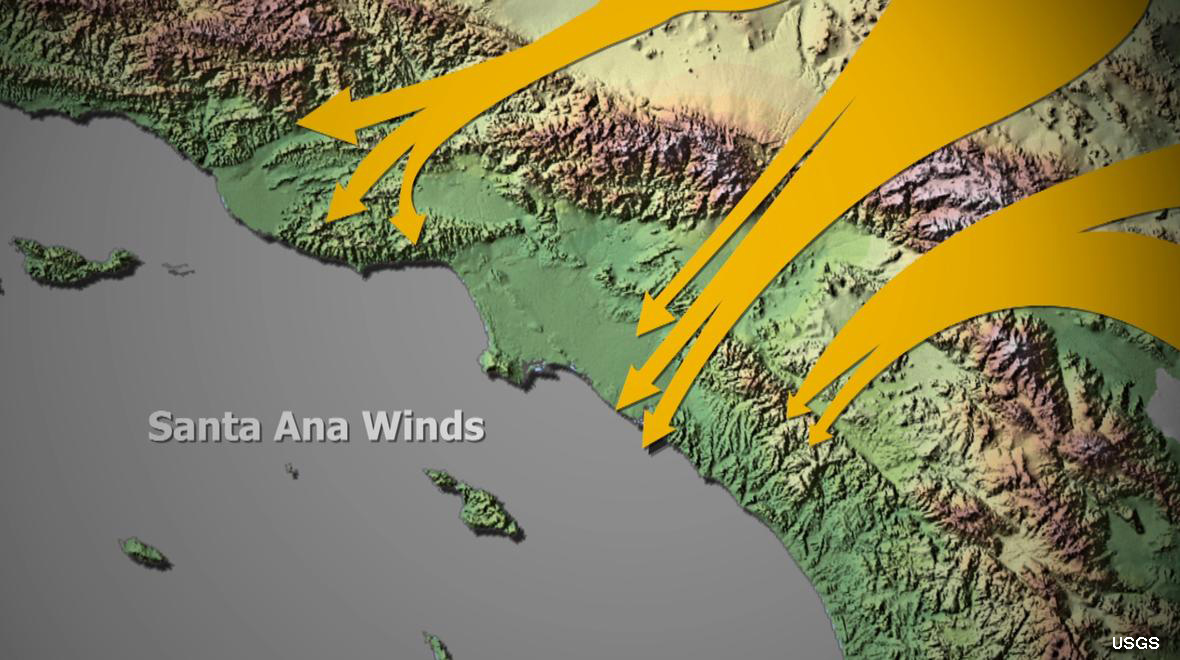 Santa Ana Winds are typically associated with a dry low-pressure trough along or near the coastline and a dry high-pressure center inland over Great Basin (Nevada) and southwestern interior states (AZ, CO, NM, UT). |
"Pineapple Express" (Cloud Rivers)Southern California sometimes experiences storms with extended periods of rain when a stationary weather front settles in, creating a Pineapple Express—this is the name of an atmospheric river that transports moisture from the Pacific Ocean (in the vicinity of Hawaii) to the West Coast and the Inter-mountain West. These atmospheric rivers can carry as much moisture, sometime the 5 to 10 Amazon Rivers combined. These storms can last several days and can locally drop a foot of rain or much more, particularly over the coastal mountain ranges. In the winter season these storms can result in many feet of snow in the high country. These storms are associated with massive flooding events, landsliding, and debris flows that can have catastrophic effects on communities and infrastructure. The California's worst flooding event occurred in the winter of 1861-2 may have been associated with powerful Pineapple Express storms. |
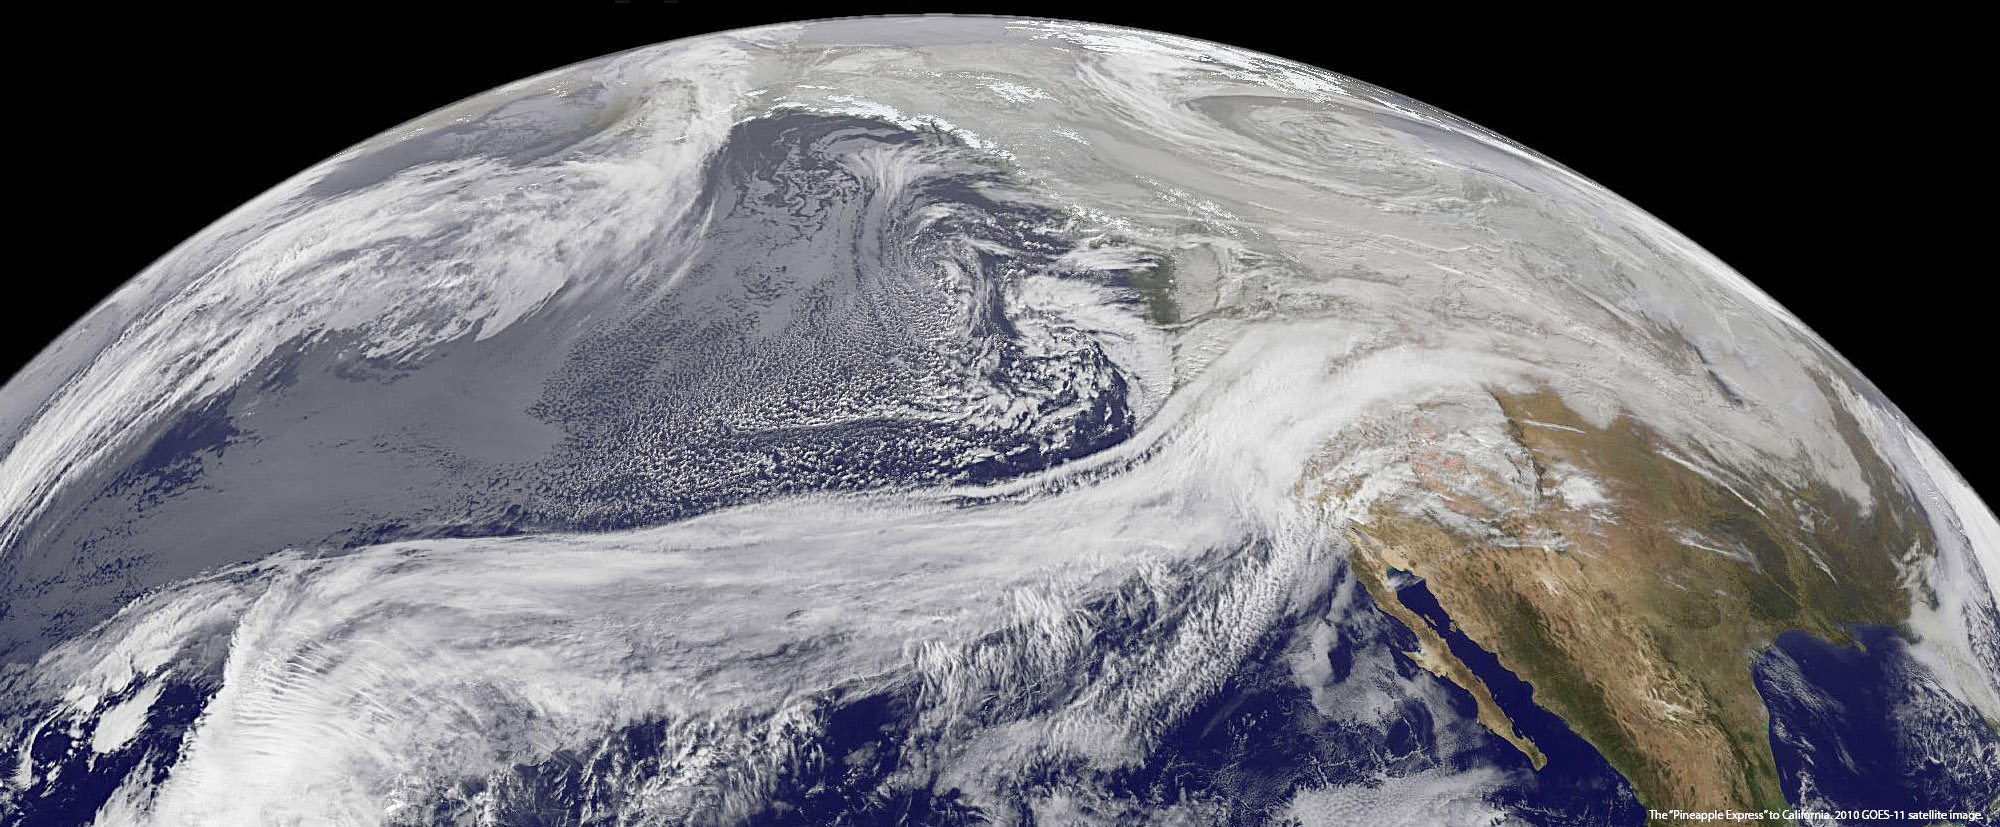 This is a GOES satellite image showing a Pineapple Express (a "cloud river") . This image show a Pineapple Express flowing from the Hawaiian tropics into California and the Southwest. |
| Scientists from many organizations are studying the potential catastrophic effects of these storms. They could produce extensive destruction over large regions, resulting in floods, landslides, coastal erosion and could severely damage water-supply systems, infrastructure, potentially displace thousands to millions of people with major economic losses. Learn about the ARkStorm Scenario, a model of what would happen if the megastorms of 1861-2 were to happen again today—it could potentially be the most expensive natural disaster to impact our country. See a NOAA discussion About Atmospheric Rivers (with animation). |
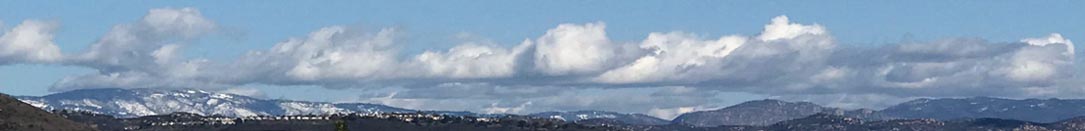
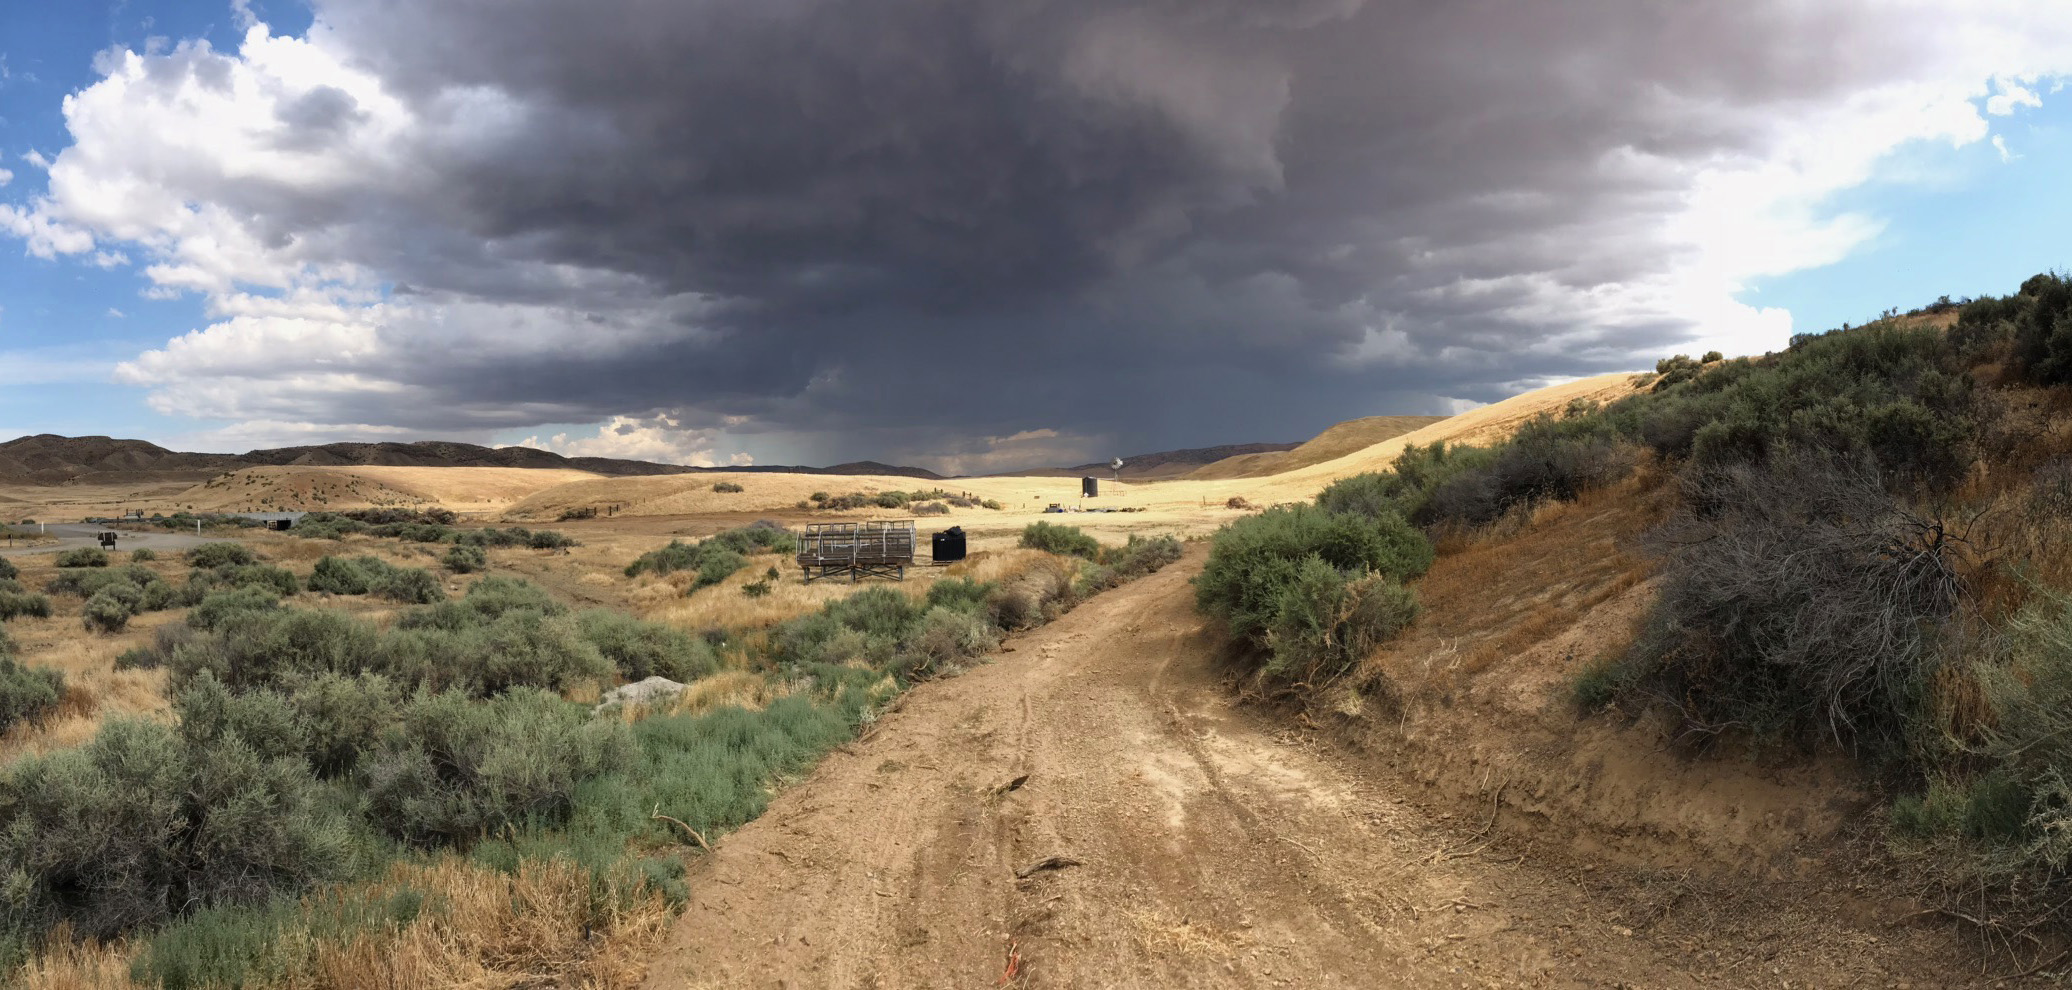
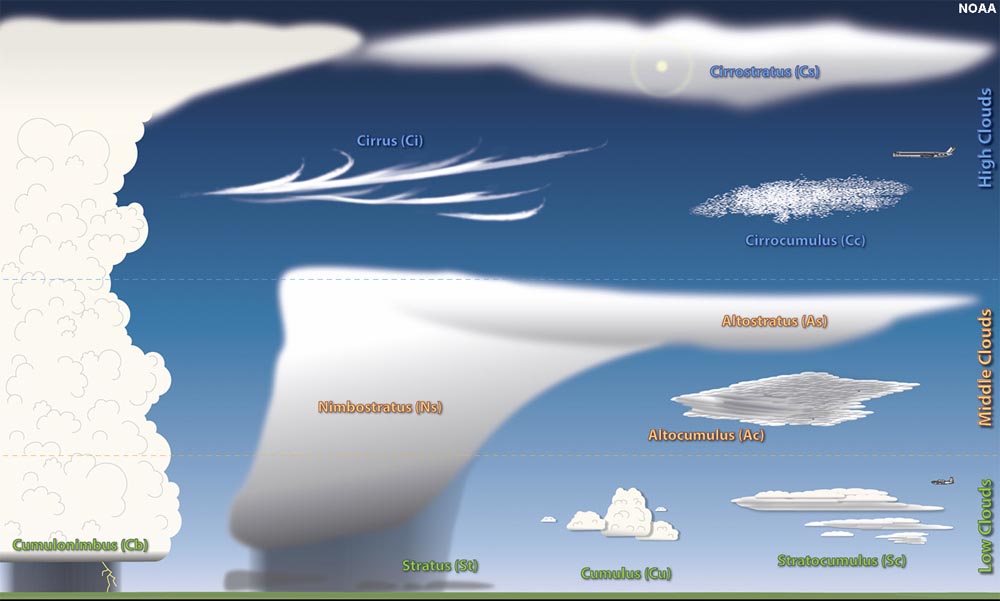
Clouds of Southern CaliforniaClick here to see a collection photos that illustrate clouds and weather in Southern California, most of the photos on this website were taken in San Diego County.Chick here for a Glossary of Cloud Terms and Classification. |
 |
 |
National Centers For Environmental Research |
Below is a list of government-sponsored weather, atmospheric, and climate research centers and data collection organizations. These research center programs work in collaboration with each other and with other Federal, State, and local government agencies, universities, and other research organizations.NOAA/National Weather Service - National Centers for Environmental Research (NCEP) include:Storm Prediction Center (SPC) - "provides tornado and severe weather watches for the contiguous United States along with a suite of hazardous weather forecasts."National Hurricane Center (NHC) - :provides forecasts of the movement and strength of tropical weather systems and issues watches and warnings for the U.S. and surrounding areas." Aviation Weather Center (AWS) - "provides aviation warnings and forecasts of hazardous flight conditions at all levels within domestic and international air space." Climate Prediction Center (CPC) - "monitors and forecasts short-term climate fluctuations and provides information on the effects climate patterns can have on the nation." Environmental Modeling Center (EMC) -"develops and improves numerical weather, climate, hydrological and ocean prediction through a broad program in partnership with the research community." NCEP Central Operations (NCD) - "sustains and executes the operational suite of numerical analyses and forecast models and prepares NCEP products for dissemination." Ocean Prediction Center (OPC) - "issues weather warnings and forecasts out to five days for the Atlantic and Pacific Oceans north of 30 degrees North." Space Weather Predictions Center (SWPC) - "provides space weather alerts and warnings for disturbances that can affect people and equipment working in space and on earth." Weather Prediction Center (WPC) - "provides space weather alerts and warnings for disturbances that can affect people and equipment working in space and on earth." Office for the Director (NCEP) - gives overarching management to the nine centers at the National Centers for Environmental Prediction. |
|||
| NOAA National Centers for Environmental Information (NCEI) - "hosts and provides access to one of the most significant archives on earth, with comprehensive oceanic, atmospheric, and geophysical data. From the depths of the ocean to the surface of the sun and from million-year-old ice core records to near-real-time satellite images, NCEI is the Nation’s leading authority for environmental information." |
University Collaboration in the Atmospheric/Earth System SciencesMany colleges, universities, and non-profit research organizations are involved in atmospheric research; these activities are partly coordinated by:University Corporation for Atmospheric Research (UCAR) - "a nonprofit consortium of more than 115 North American colleges and universities focused on research and training in the Earth system sciences... fostering public, private, and academic partnerships; advocating for the value of our science." National Center For Atmospheric Research (NCAR) - a research center focus on Earth system science "sponsored by the National Science Foundation and managed by the University Corporation for Atmospheric Research (UCAR)." |
Weather News and MediaNearly all news networks have some weather-related information on their broadcasts every day. All these organizations have staff dedicated to reviewing weather information every day. Their websites, blogs, and social media all have discussions of about the weather. One thing in common is that they are all getting their data, basically free, from NOAA, National Weather Service, and other government and education sources. The Weather Channel (TWC) is perhaps the best-known independently-owned media company (television, radio, newspapers, and on-line services) that focuses on weather phenomena. TWC utilizes data from NOAA/National Weather Service and other government agencies including FEMA, USGS, NASA, other branches of NOAA, and other federal, state, local government agencies and weather-related organizations. |
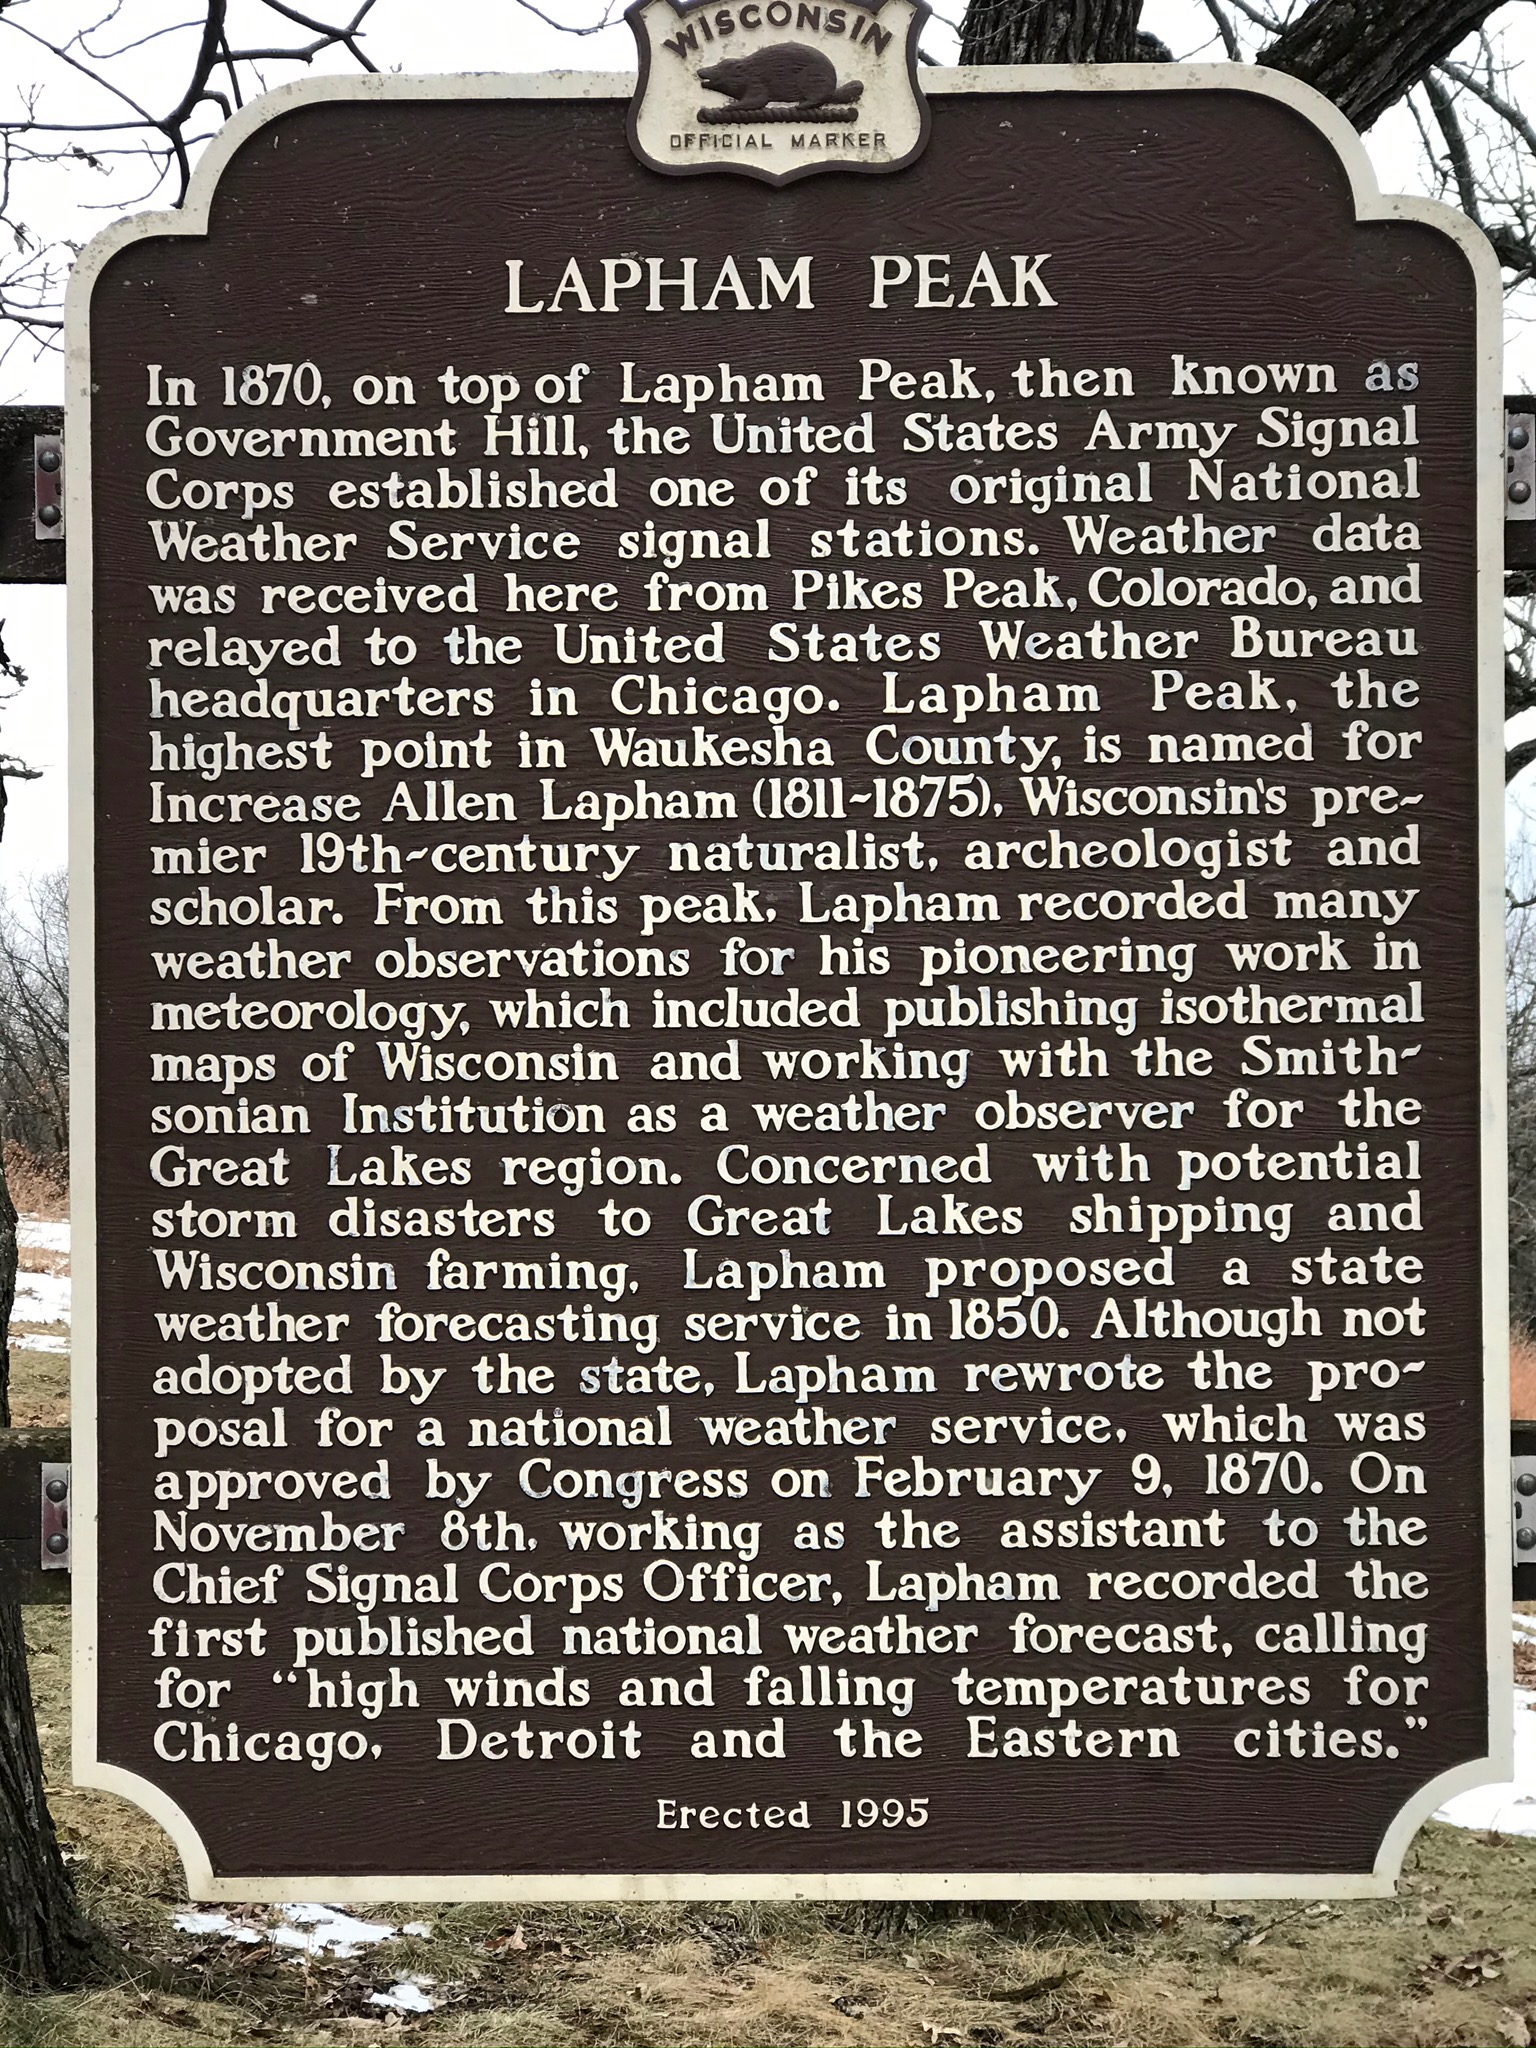
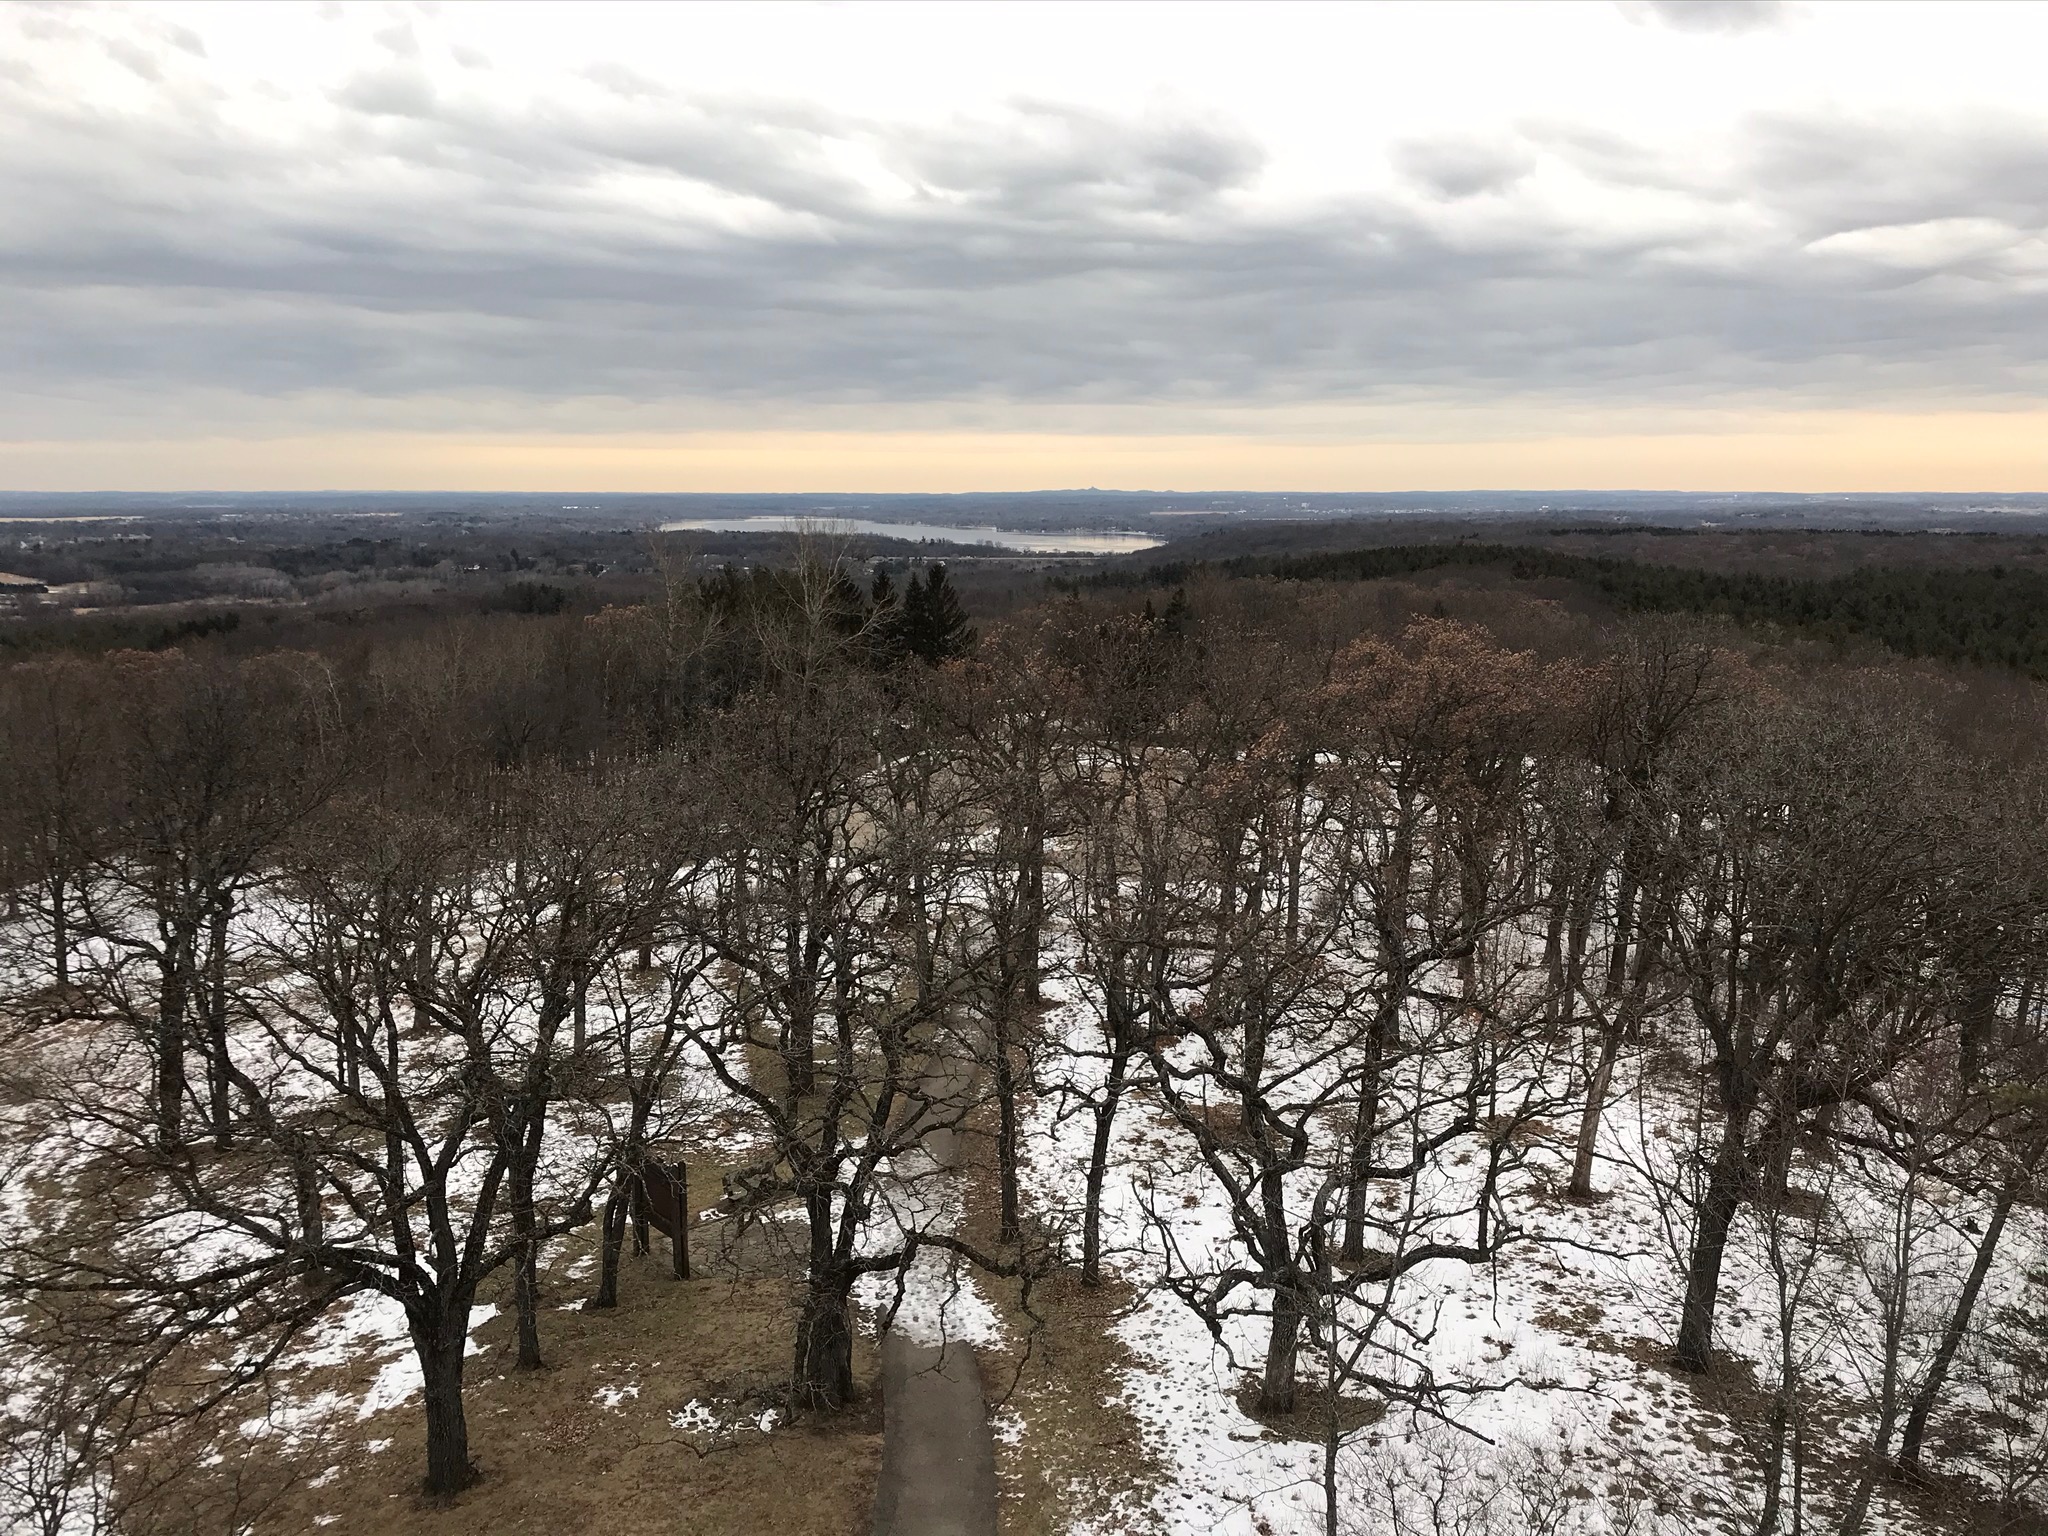
The National Weather Service was established in 1870 by an Act of Congress.Below is the text from a historical marker on Lapham Peak in Wausheka County, Wisconsin. It tells of the origin and establishment of the National Weather Service in 1870. Learn more about the many parts of the government that were combined to form NOAA in 1970. |
||
| "In 1870, on top of Lapham Peak, then known as Government Hill, the United States Army Signal Corps established on of its original National Weather Service signal stations. Weather data was received here from Pikes Peak, Colorado, and relayed to the United States Weather Bureau headquarters in Chicago. Lapham Peak, the highest point in Waukesha County [Wisconsin], is named for Increase Allen Lapham (1811-1875), Wisconsin’s premier 19th-century naturalist, archaeologist and scholar. From this peak, Lapham recored many weather observations for his pioneering work in meteorology, which included publishing isothermal maps of Wisconsin and working with the Smithsonian Institution as a weather observer for the Great Lakes region. Concerned with potential storm disasters to Great Lakes shipping and Wisconsin farming, Lapham proposed a state water forecasting service in 1850. Although not adopted by the state, Lapham rewrote the proposal for a national weather service, which was approved by Congress on February 9, 1870. On November 8th, working as the assistant to the Chief Signal Corps Officer, Lapham recorded the first published national weather forecast, calling for ‘high winds and falling temperatures for Chicago, Detroit and the Eastern cities.’ “ | ||
 Historical Marker at Lapham Peak commemorating the establishment of the National Weather Service by an act of Congress on February 9, 1870. |
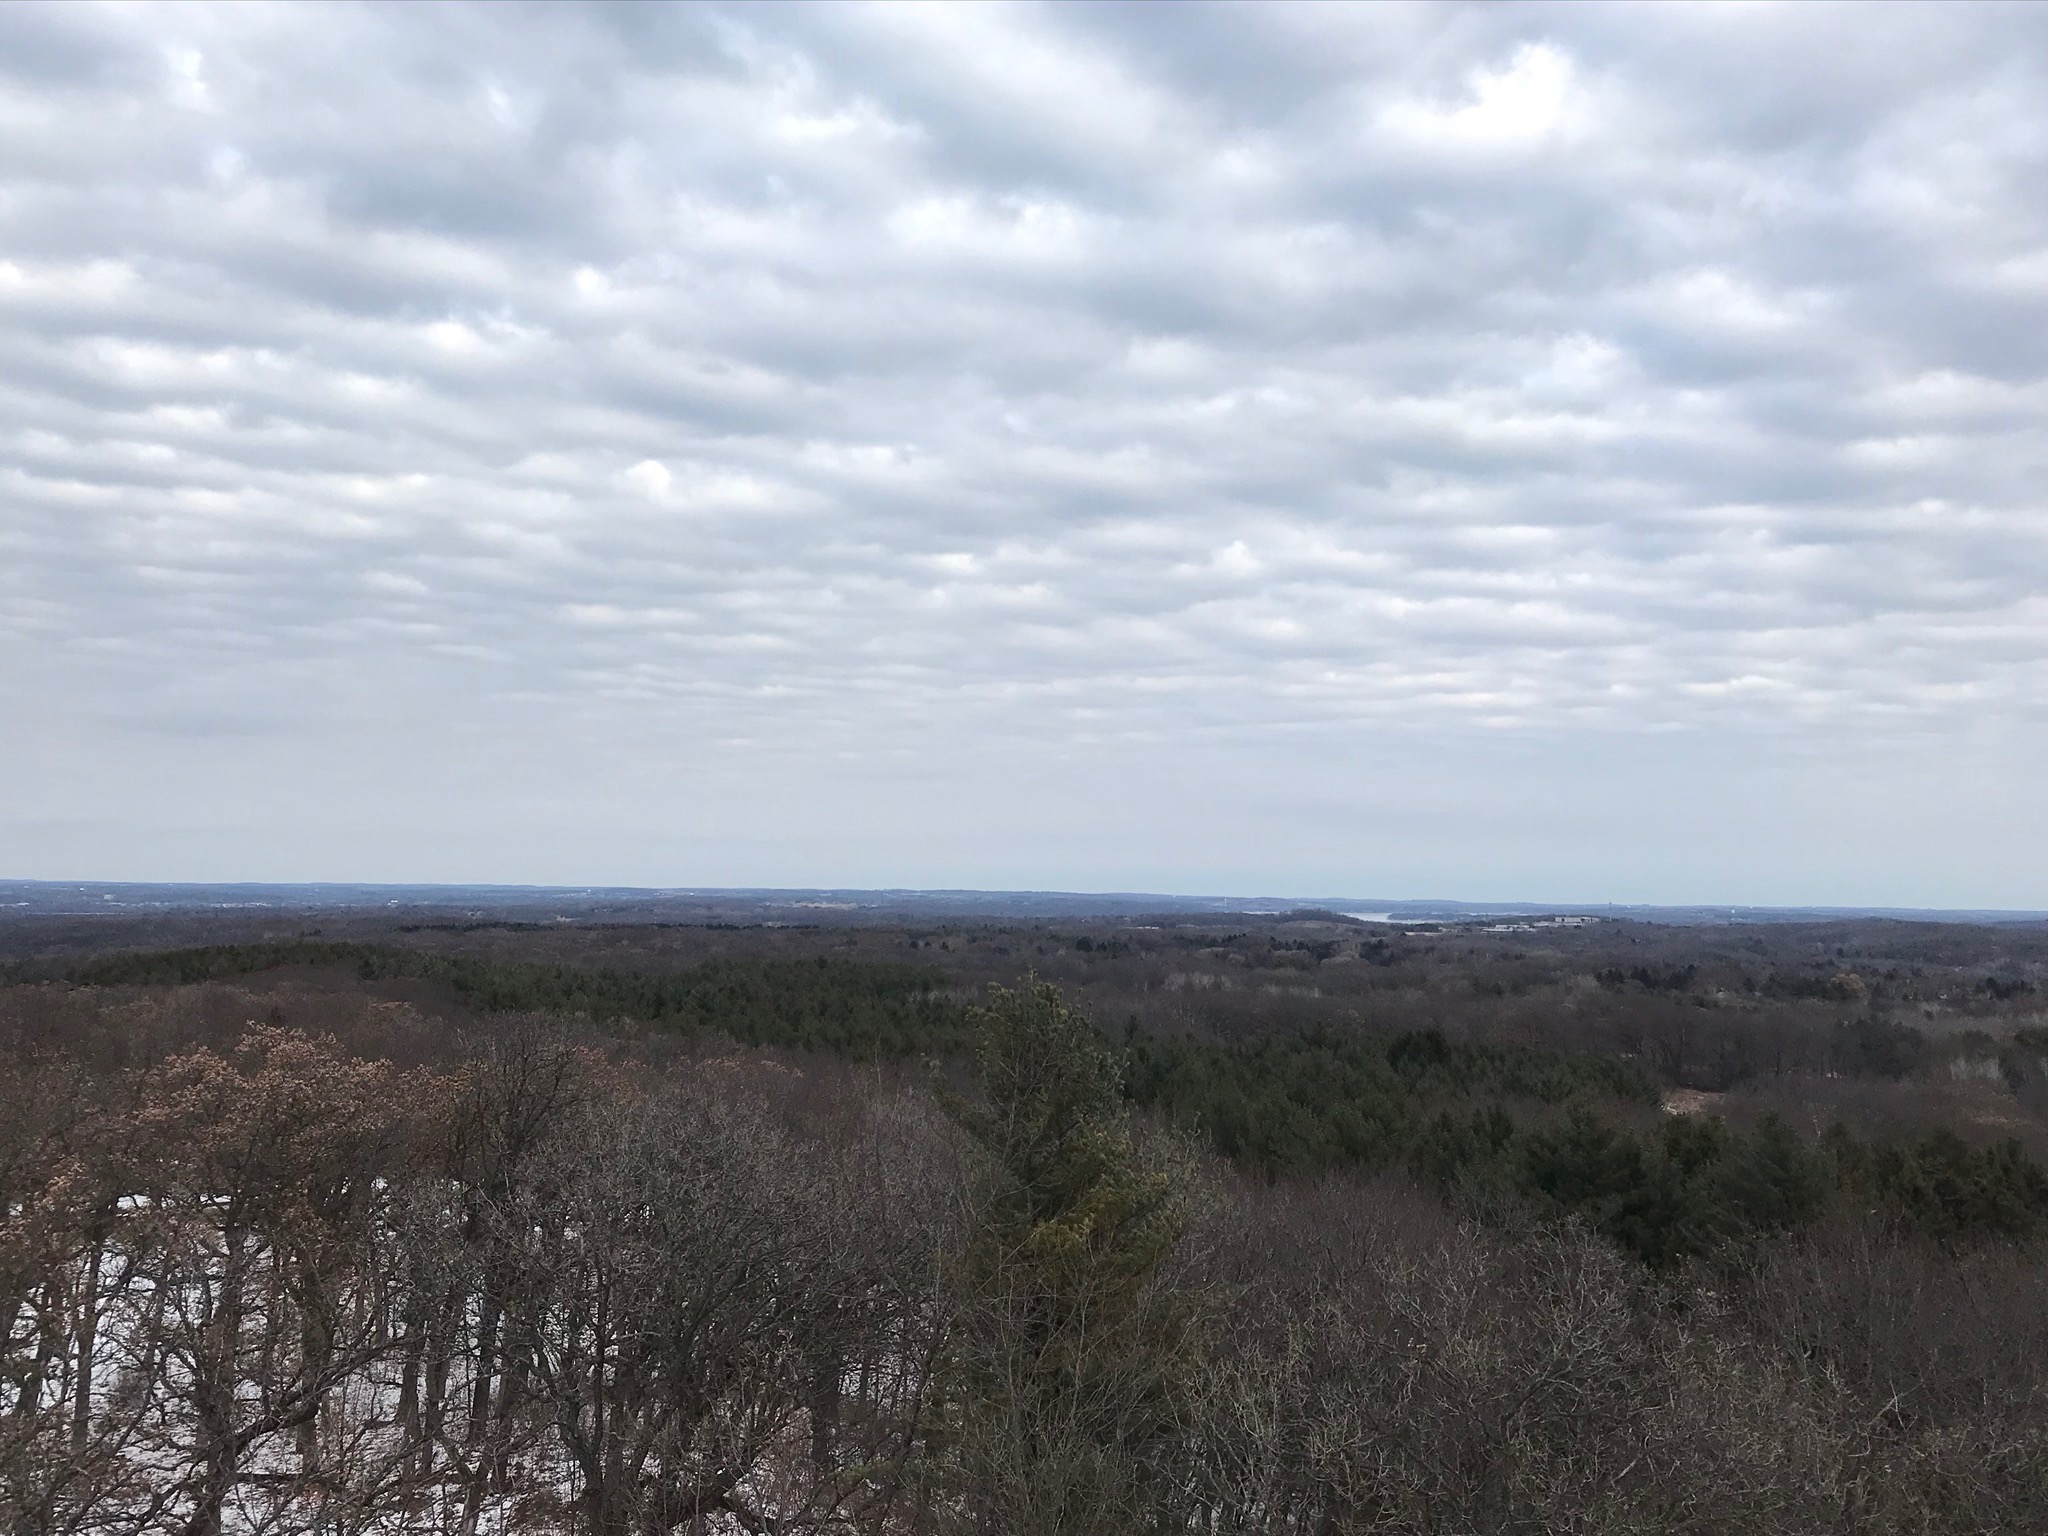
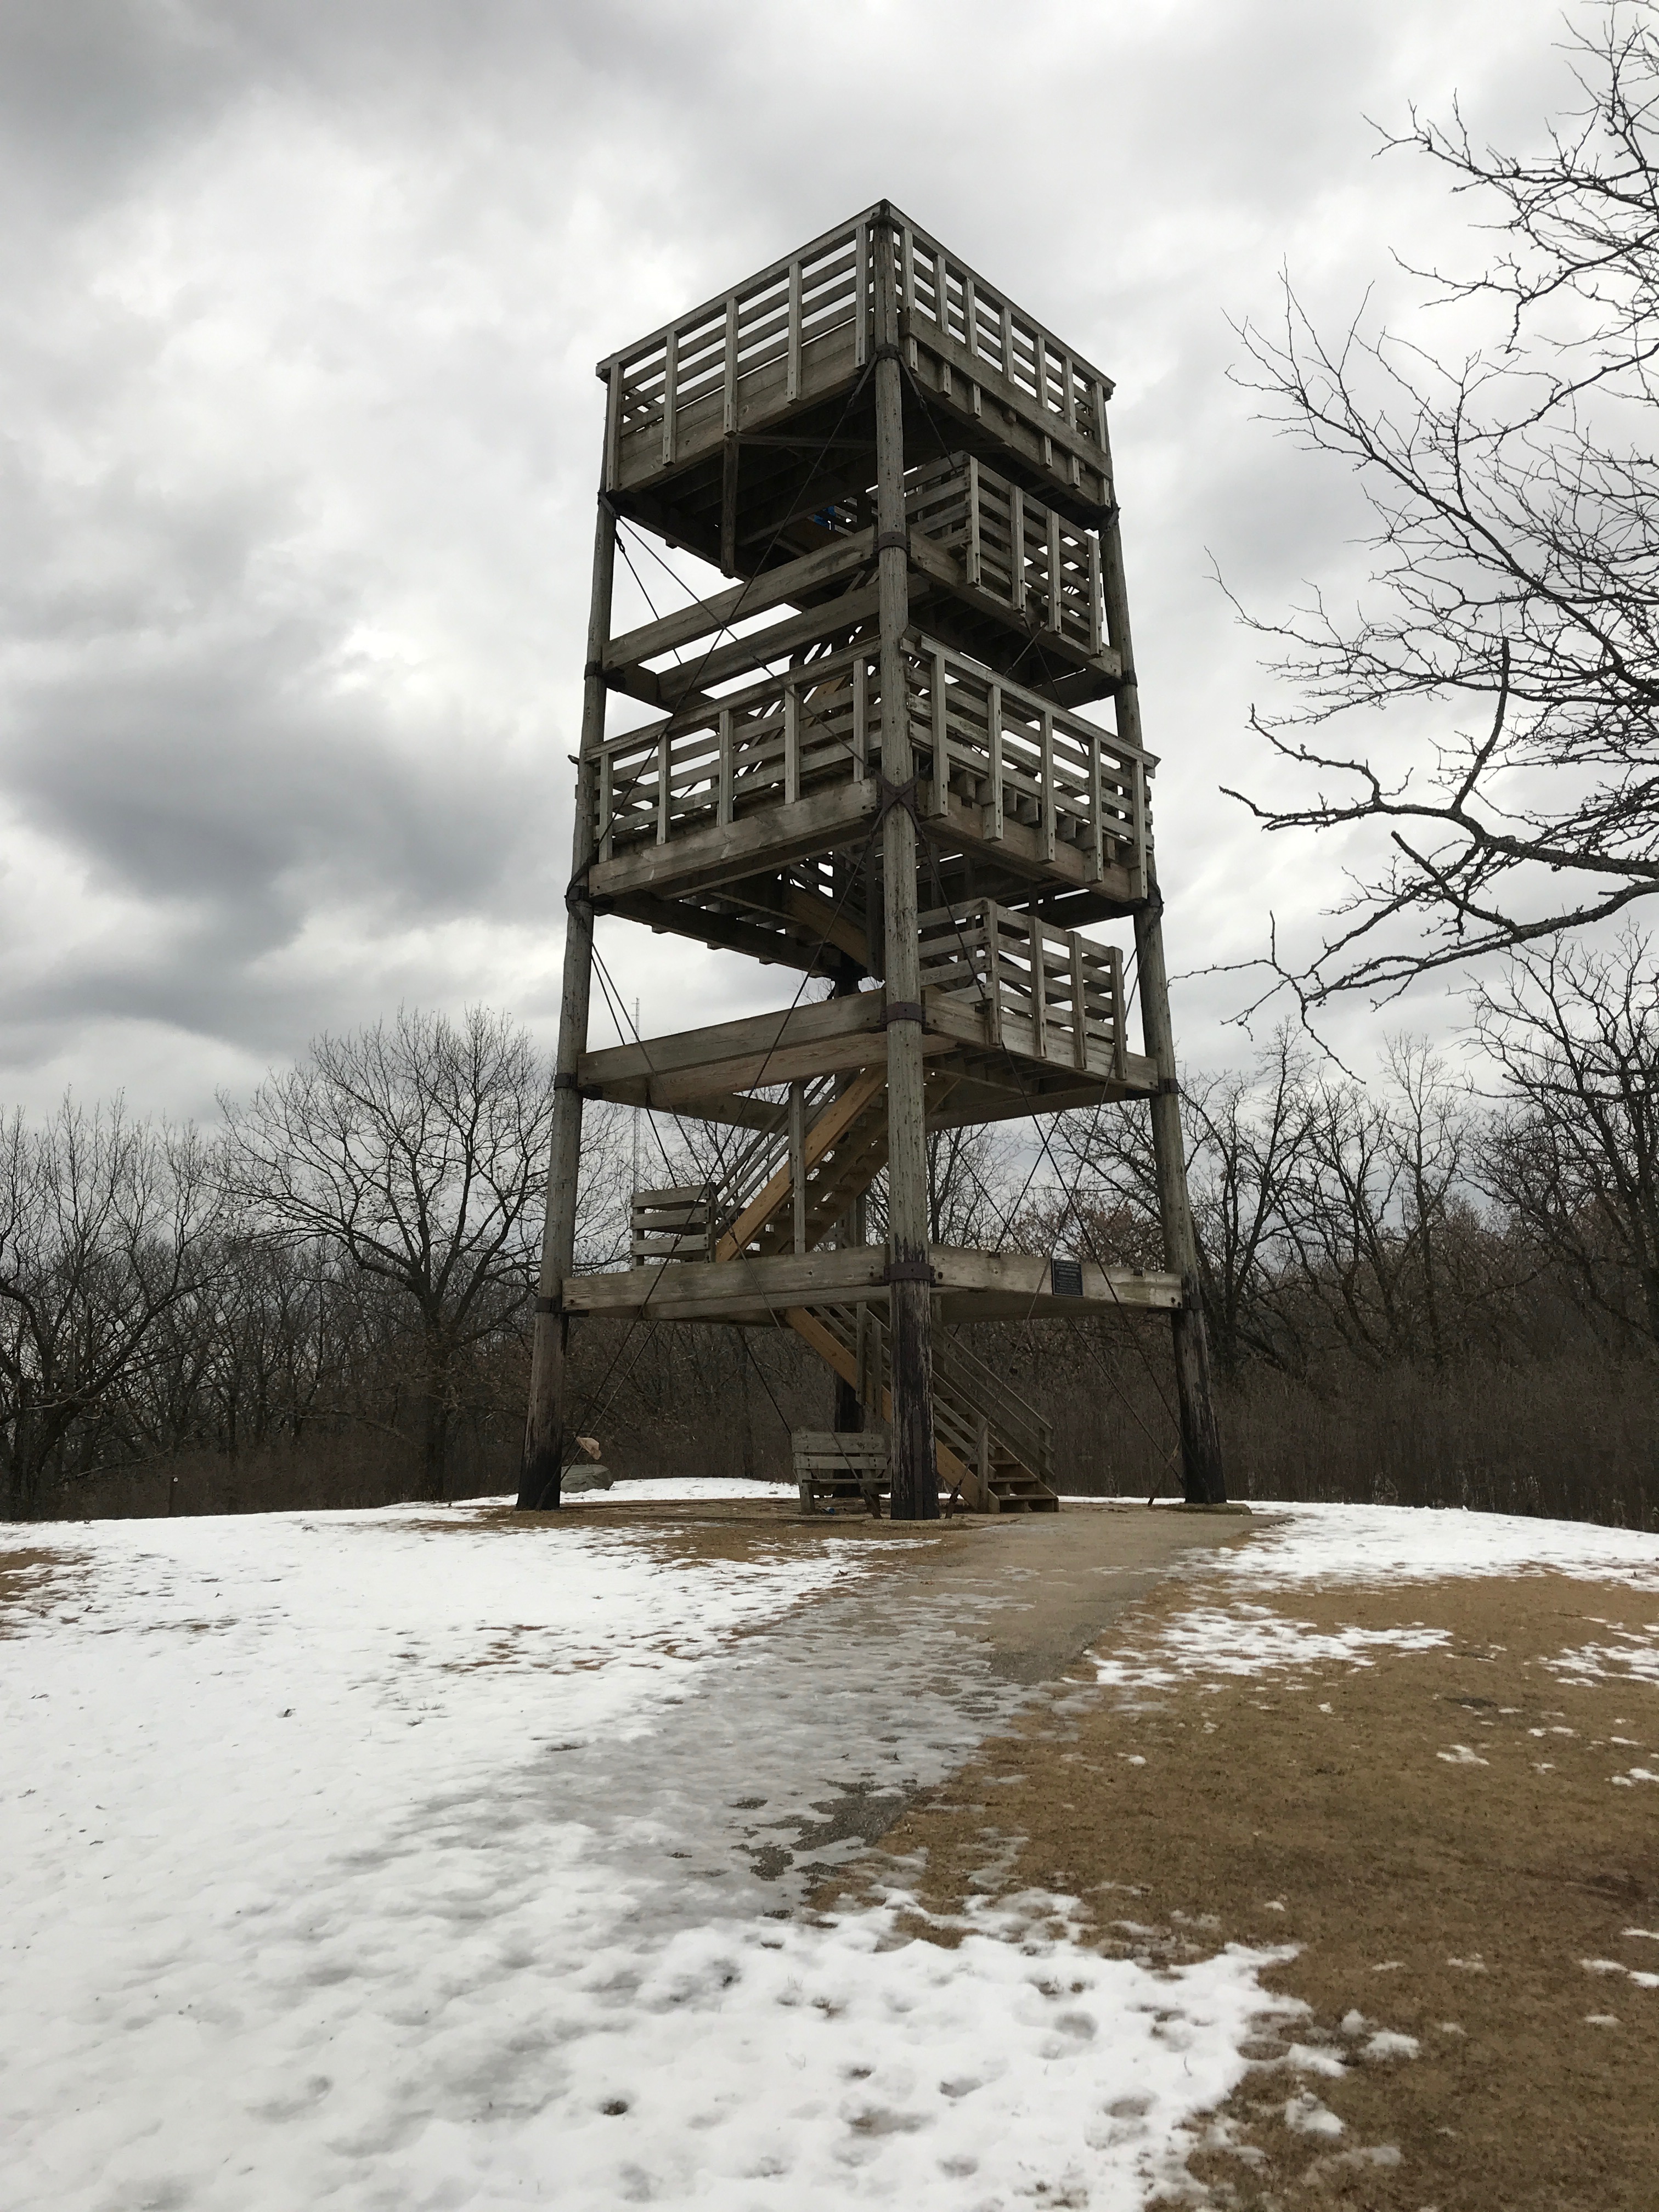 This observation tower on Lapham Peak in Waukesha County, Wisconsin, provides exceptional views across much of central Wisconsin (east and west shown here). |
  |
| "Weather—you like it or not—you should NOAA-bout it." | Click here to see an online lab assignment associated with this website. |