Figure Caption List Text and images on this site are "public domain." NOTE: The images in this section are out of context with discussion.
Also, to return to this list requires hitting the "back" key
on the Web navigation bar. To follow the text discussions of each e-book
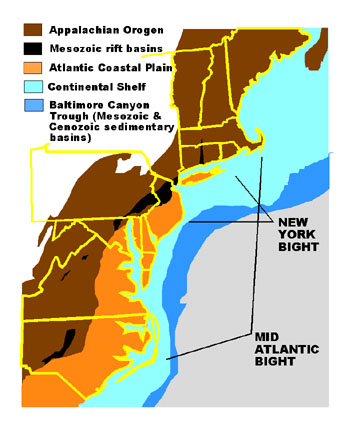
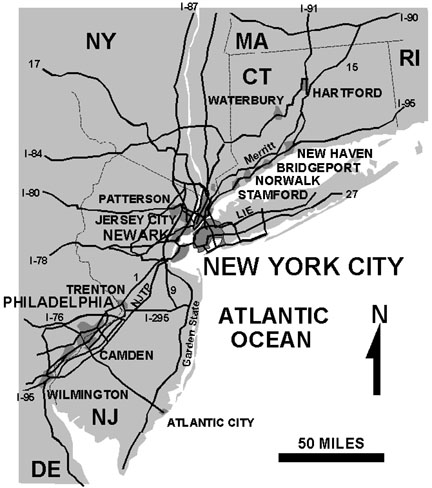
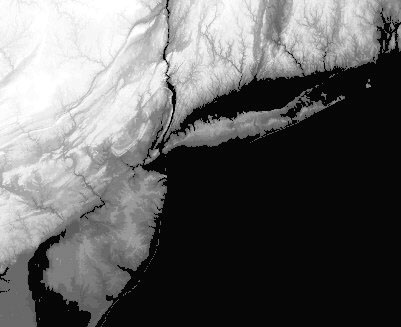
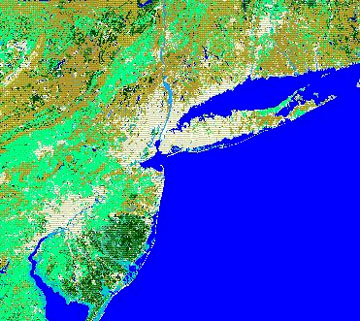
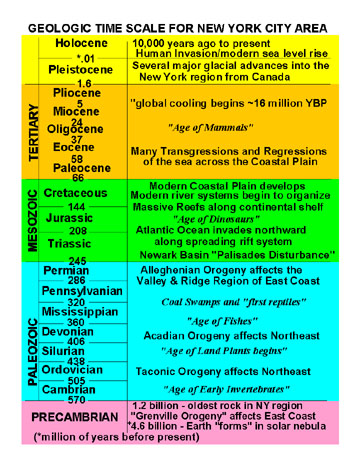
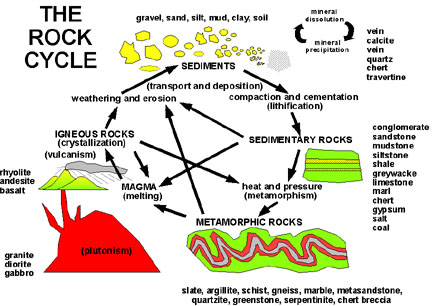
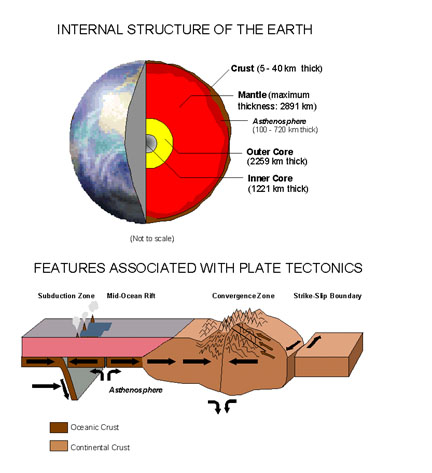
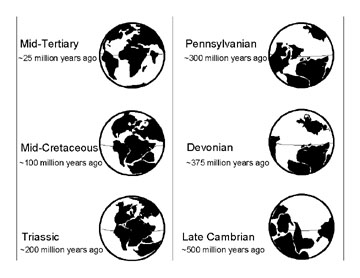
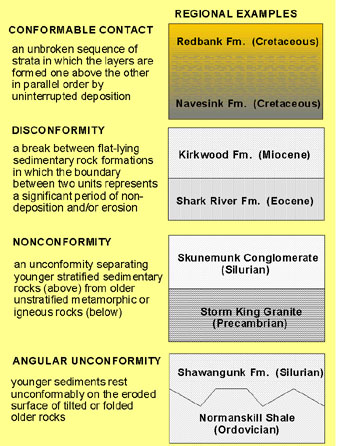
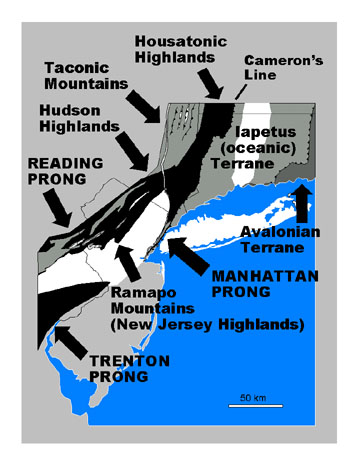
chapter, see the Table of Contents. Figure 1. Map of the greater New York City region. Figure 2. Major cities and interstate highways in the New York City region. Figure 3. Shaded relief map (digital elevation model) of the New York City region (courtesy of Karen Mulcahy). Figure 4. A map of landuse/land cover of the New York City region. Light colored areas ore urban and suburban areas. Light green represents agricultural lands. Brown represents deciduous forests (undeveloped watershed) and pine forests. Dark green areas are lands covered with pine forests. Light blue represents wetlands (courtesy of Karen Mulcahy). Figure 5. Geologic time scale for the New York City region. Figure 6. The rock cycle. Figure 7. The structure of the Earth and a model illustrating plate tectonics. Figure 8. Map of continental arrangement at different times in geologic history (after NY State Regents Earth Science Reference Tables). Figure 9. Types of unconformities. Figure 10. The Highlands Province.
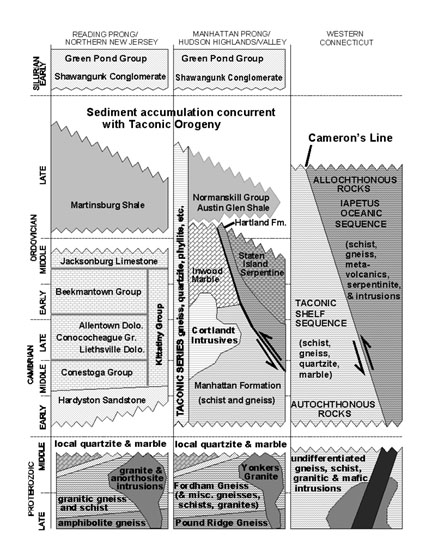
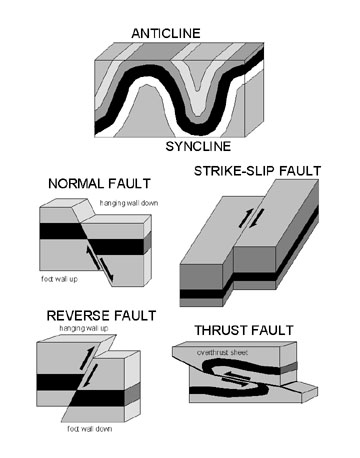
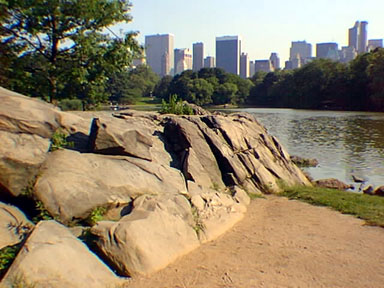
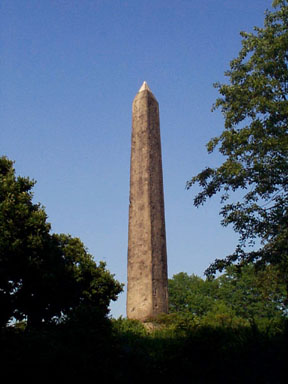
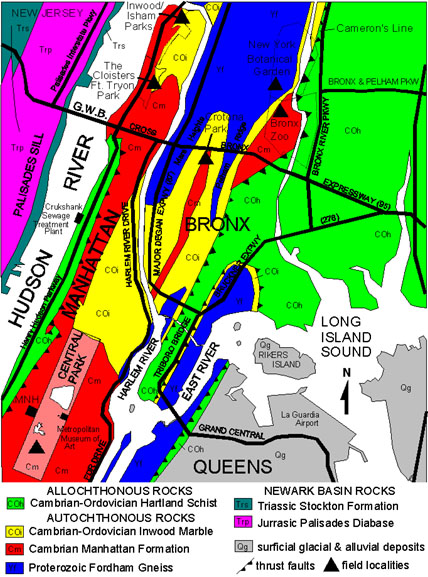
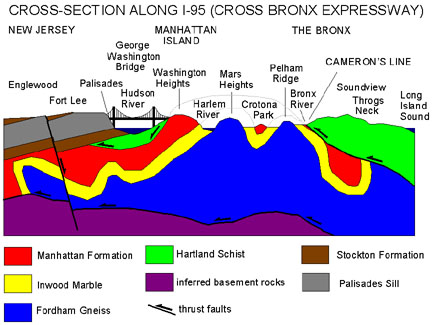
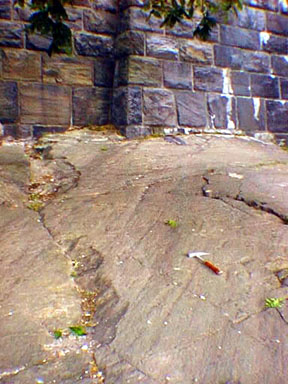
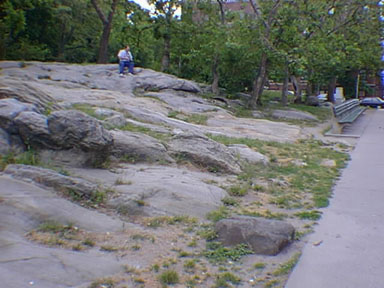
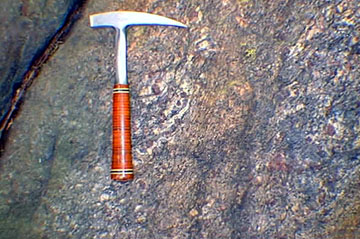
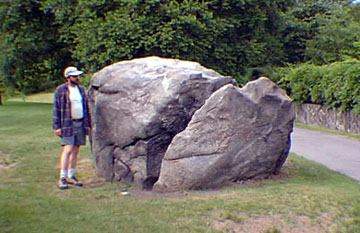
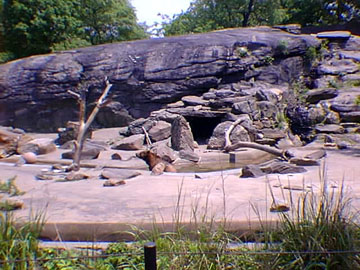
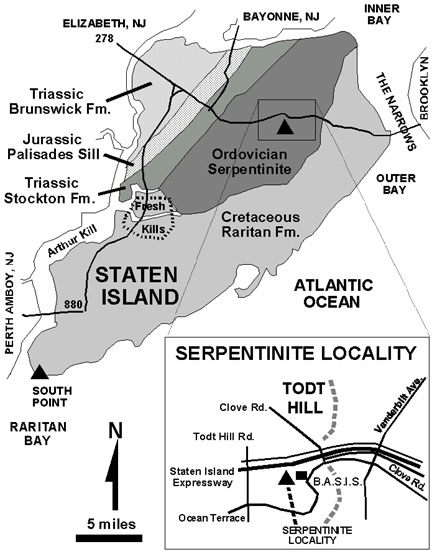
Figure 12. Generalized Precambrian and Lower Paleozoic Stratigraphy for the New York City region (modified after American Association of Petroleum Geologists COSUNA Charts (1983, 1986), Drake et al., 1996, Fisher et al., 1995, and Rodgers, 1985). Figure 13. Types of folds and faults. Figure 14. A view of a glacial scoured outcrop of gneiss and schist of the Manhattan Formation exposed by The Lake on Central Park's west side. The skyline of Midtown dominates the horizon. Figure 15. Cleopatra's Needle, a weathered Egyptian obelisk near the Metropolitan Museum of Art. Figure 16. Geologic map of northern Manhattan and The Bronx (modified after Schuberth, 1967). Figure 17. Simplified cross section of northern Manhattan and The Bronx along I-95 (including the George Washington Bridge and Cross Bronx Expressway). Figure 18. Glacial groves and striations in the Cambrian Manhattan Formation along the foundation of the Cloisters Museum. Rock hammer handle is 1 foot for scale (not for collecting!). Figure 19. Outcrop of Ordovician Inwood Marble in Isham Park in The Bronx. Figure 20. Garnetiferous gneiss and schist of the Manhattan Formation exposed at Inwood Hill Park. Note garnets next to hammer handle (hammer handle is 1 foot for scale - not for collecting!). Figure 22. A glacial erratic of Fordham Gneiss in the New York Botanical Gardens. The large boulder was probably split by the physical weathering action of tree roots. The tree has long since vanished. Figure 23. Glaciated outcrops and erratics of schist and gneiss of the Manhattan Formation are integrated into the grizzly bear pen and other exhibits throughout the Bronx Zoo Park. Figure 24. Generalized geologic map of Staten Island showing the location of the Serpentinite locality along the Staten Island Expressway (located near Brooklyn and Staten Island Schools, formerly the campus of the College of Staten Island) (map after Lyttle & Epstein, 1987). Figure 25. Exposure of the serpentinite
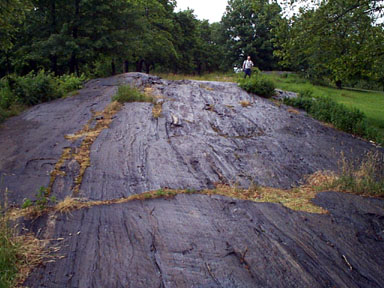
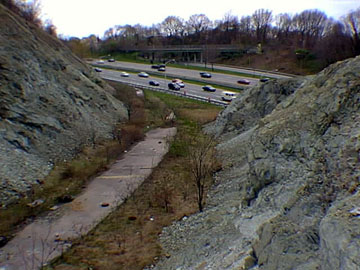
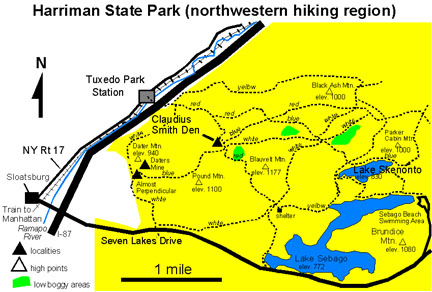
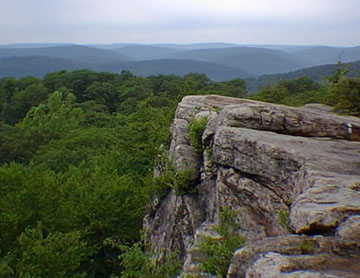
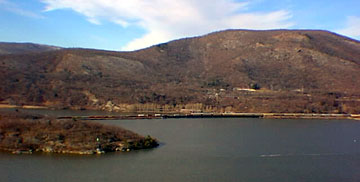
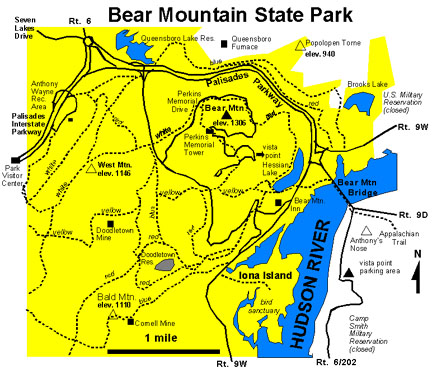
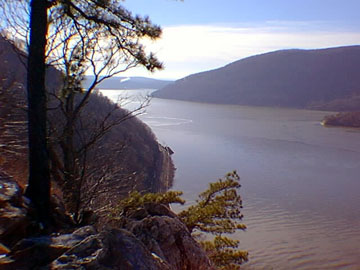
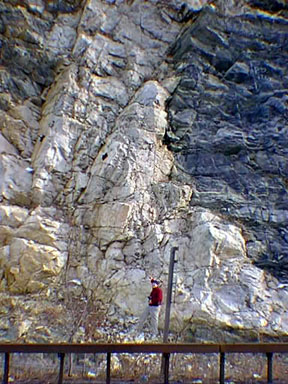
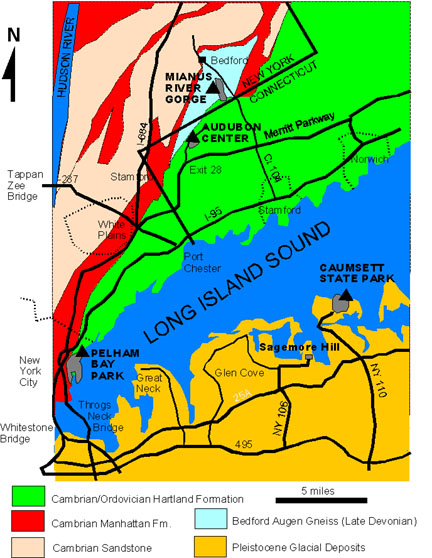
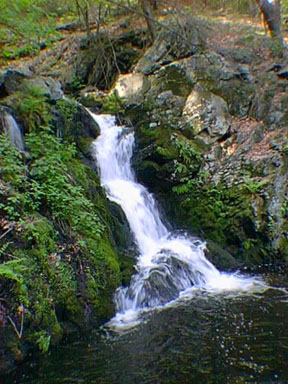
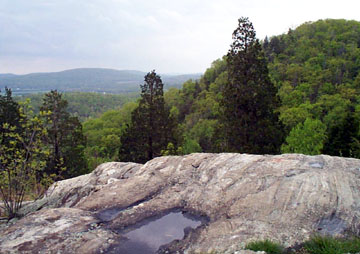
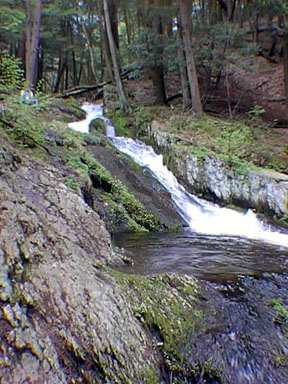
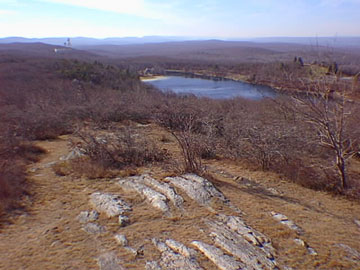
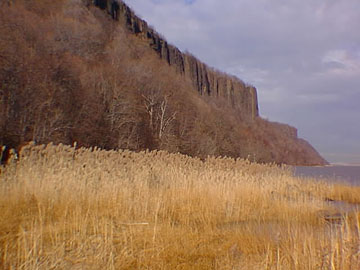
in an abandoned highway cut adjacent to the Staten Island Expressway. Figure 27. View of the barren, glacier-scoured hilltop above Claudius Smith Den in Harriman State Park. The view of the hilltops in the distance illustrates the Schooley Peneplain, a mid-Tertiary erosional surface that is now the top of the regional erosionally dissected plateau. Figure 28. A view of Bear Mountain from the east side of the Hudson River from Anthony's Nose Overlook. Iona Island Bird Sanctuary is in the foreground. The terrace along the base of Bear Mountain represents the base level position of the Hudson River Valley prior to Pleistocene glaciation. Figure 29. Trail system and investigation sites in Bear Mountain State Park, including the location of Anthony's Nose parking area on the east side of the Hudson River. Note the location of the park visitor center on the Palisades Interstate Parkway (modified after Palisades Interstate Park trail map). Figure 30. View of the Hudson River "fjord" from Anthony's Nose Overlook. Figure 31. A granitic intrusion into darker Late Proterozoic amphibolite gneiss at Anthony's Nose Overlook. Figure 32. Generalized geologic map showing the location of parks near the north and south shores of Long Island Sound (map modified after Rogers, 1985 and Fisher et al., 1995). Figure 33. Havenmeyer Falls in the
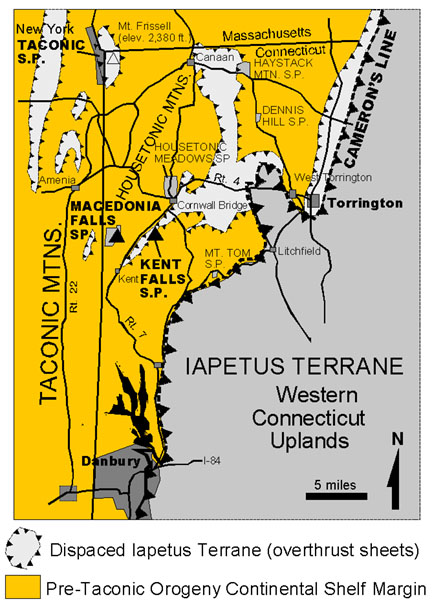
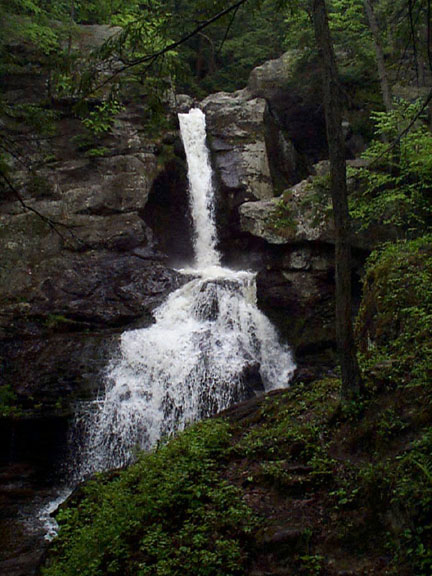
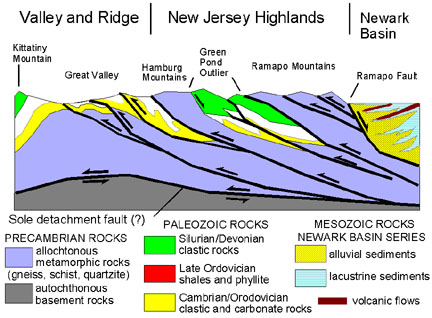
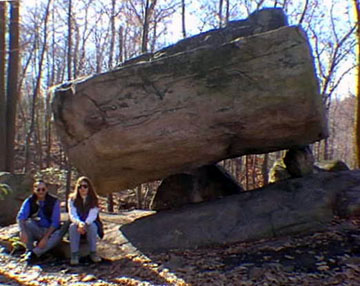
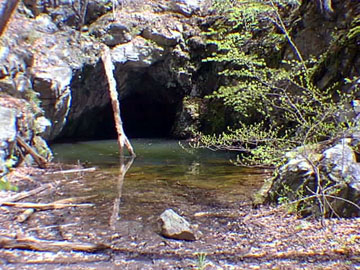
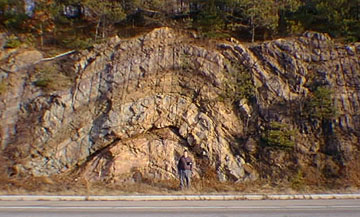
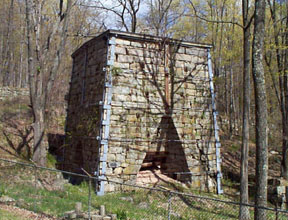
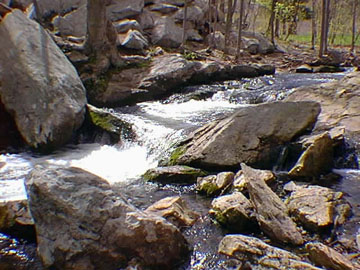
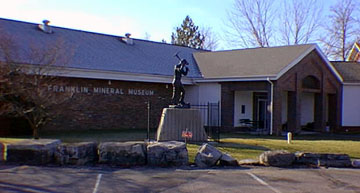
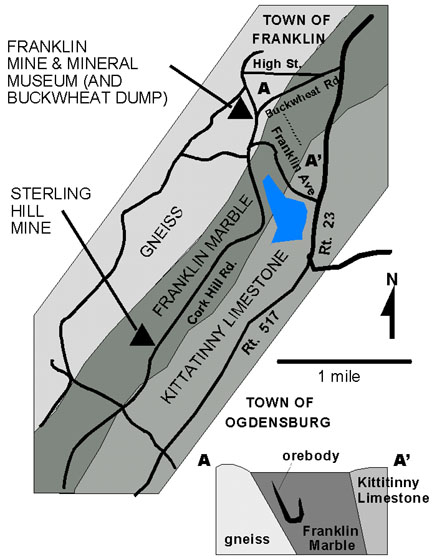
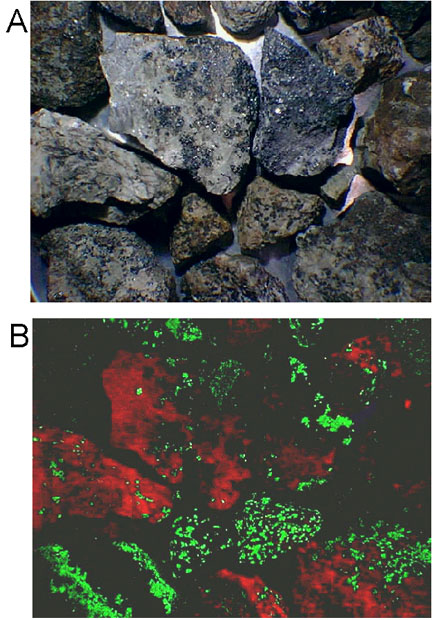
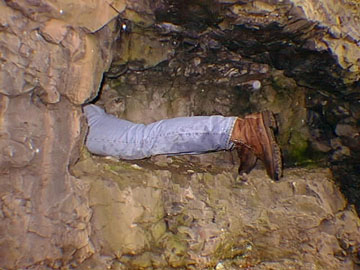
Mianus River Gorge. Figure 35. The lower cascades of Kent Falls State Park, Connecticut. Figure 36. Map of the northern New Jersey Region (modified after Lyttle & Epstein, 1987). Figure 37. Hypothetical cross-section along NJ Route 23 across northern New Jersey (after Lyttle & Epstein, 1987). Figure 38. Tripod Rock on Pyramid Mountain. The pedestal glacial erratic is believed by some to have archeological significance. Figure 39. Blue Mine, an abandoned magnetite mine in Norvin Green State Park. Figure 40. Anticline and syncline in layered Precambrian gneiss along NJ Route 23 near the rest area exit ramp (west of Butler, NJ). Figure 42. White granitic gneiss along a tumbling stream near the charcoal furnace in Wawayanda State Park. Figure 43. The Franklin Mineral Museum. Figure 44. Map of the Franklin mineral district (after Paleche, 1974). Figure 45. The common minerals of the
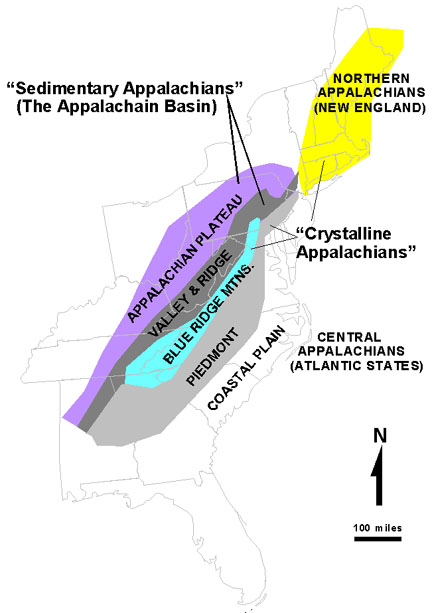
Franklin mineral district: franklinite (black), willemnite (green), and
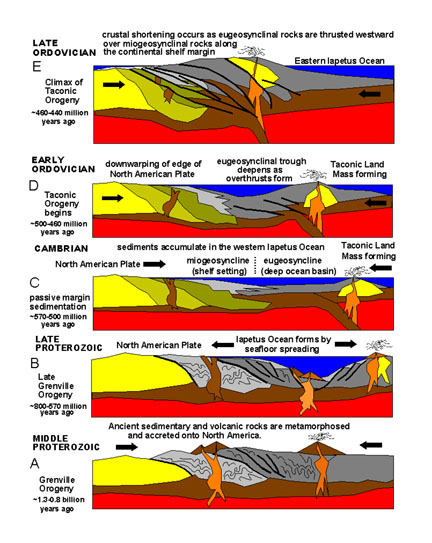
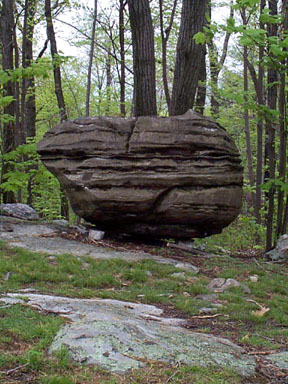
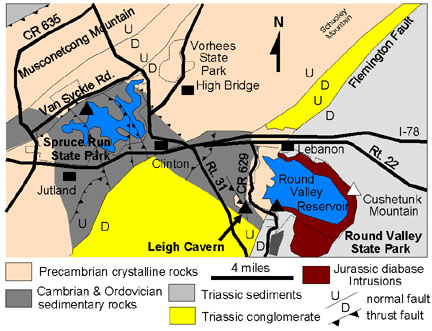
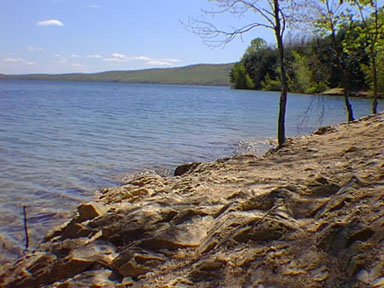
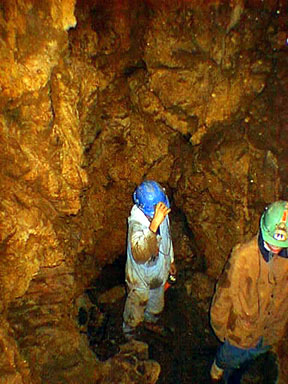
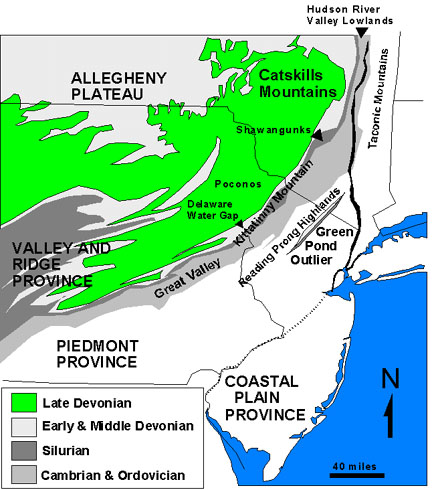
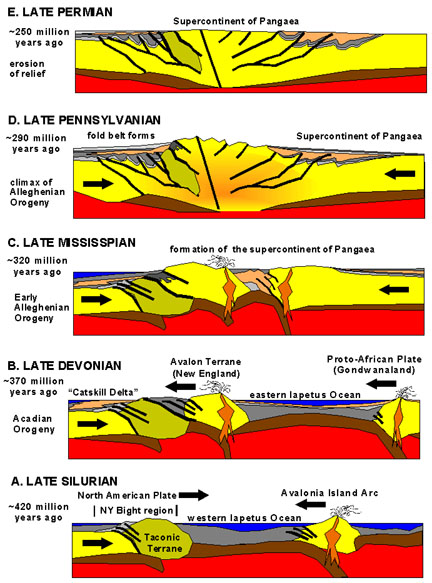
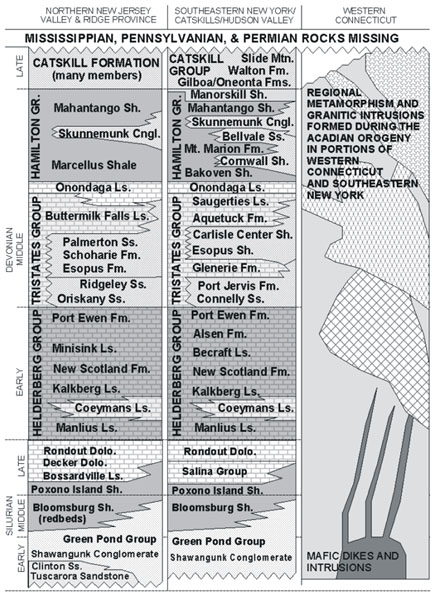
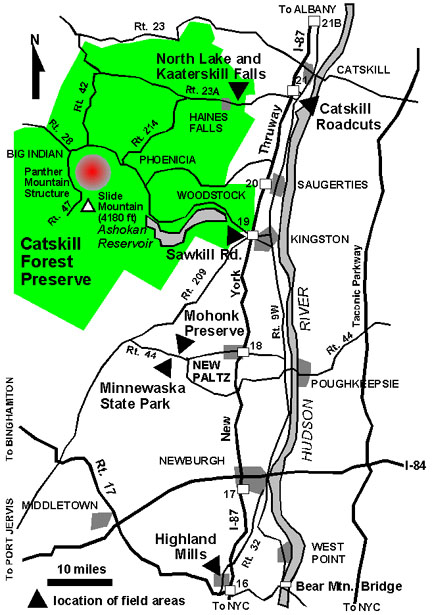
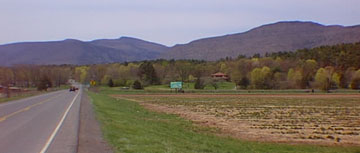
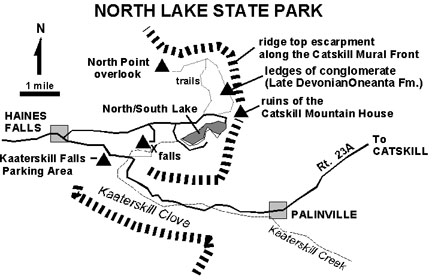
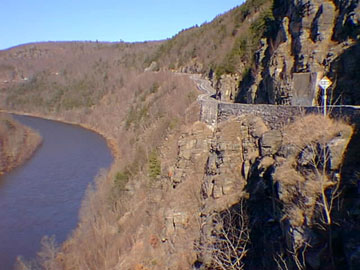
calcite (red). Figure 47. A pedestal glacial erratic of Cambrian Hardyston Sandstone resting on Precambrian gneiss on the ridge top at Jenny Jump State Park. Figure 48. Generalized geologic map of the New Jersey Highlands along I-78 (after Drake et al, 1996). Figure 49. Late Proterozoic granite crops out on the western shore of Round Valley Reservoir. Cushetunk Mountain, a large, semicircular Jurassic diabase intrusion into the Triassic sediments of the western Newark Basin forms a U-shaped ridge that surrounds most of the lake on its eastern end. Figure 50. Spelunkers covered with mud in Leigh Cavern. Figure 51. Map o the Appalachian Mountains region showing the outcrop belts of the "Sedimentary Appalachians" (also called the Appalachian Basin, and represents a vast region underlain by Paleozoic sedimentary rocks), and the."Crystalline Appalachians" (underlain chiefly by Precambrian and Early Paleozoic metamorphic and igneous rocks). Figure 52. Map of the "Sedimentary Appalachians" Province in the New York City region including the Valley and Ridge Province and the Allegheny Plateau and the Catskills (after highway map by American Association of Petroleum Geologists, 1996). Figure 53. Origin of the Appalachian Orogen, a result of three separate continental collisions involving the North American Continent with the Taconic and Acadian terranes, and finally the collision of the African and North American continents during the Alleghenian Orogeny at the end of the Paleozoic. Figure 54. Generalized Middle Paleozoic stratigraphy for the New York City region; not that Late Paleozoic rocks are "missing" (after Drake et al., 1996, Fisher et al., 1996, and Rogers 1995) . Figure 55. Map of the Catskill Mountains and central Hudson River Valley region. Figure 56. Generalized east-to-west cross section through the central Hudson Valley region. Figure 57. The Catskill Mural Front
from along Route 23A east of Palenville, New York. The gorge bisecting
the front is the Kaaterskill Clove - a canyon carved by stream erosion
after the continental glacier melted. North Lake State Park encompasses
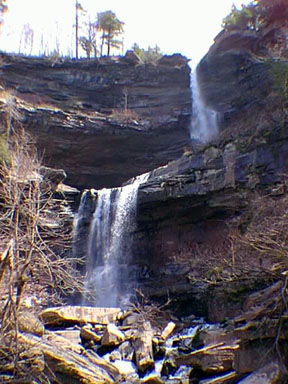
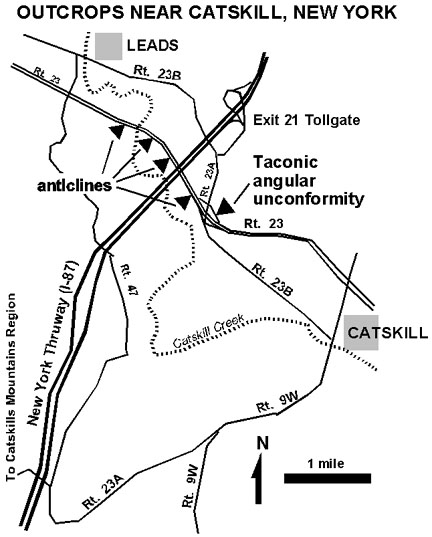
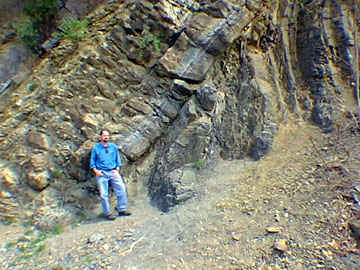
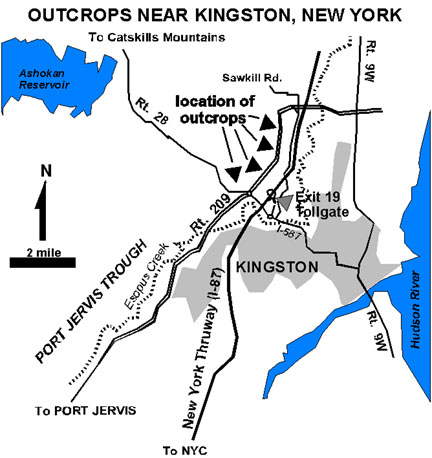
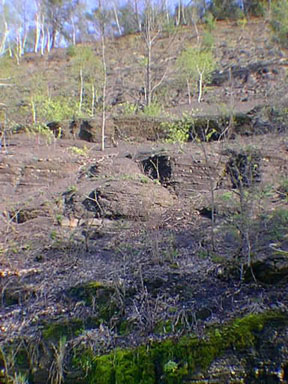
the mountain to the right of the gorge. Figure 59. Kaaterskill Falls, the tallest cascade in New York. Figure 60. Location of roadside outcrops near the town of Catskill, New York. Figure 61. The Taconic Unconformity, an angular unconformity between the vertical beds of the Ordovician Austin Glen Fm. And the overlying, but steeply dipping, Late Silurian Rondout Fm. Figure 62. Location of roadside outcrops
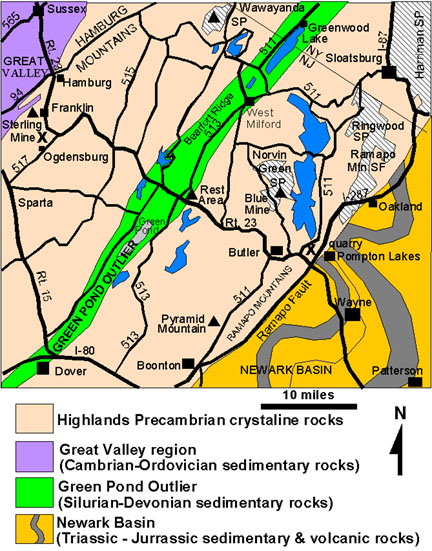
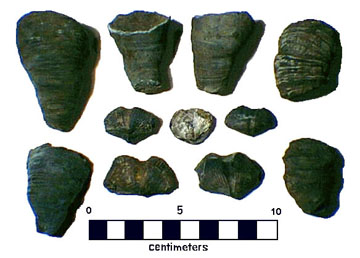
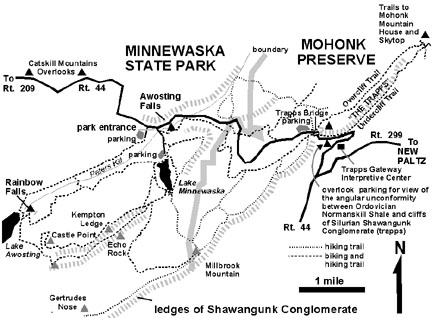
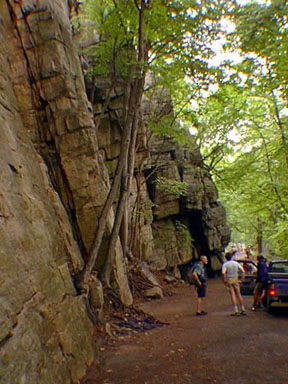
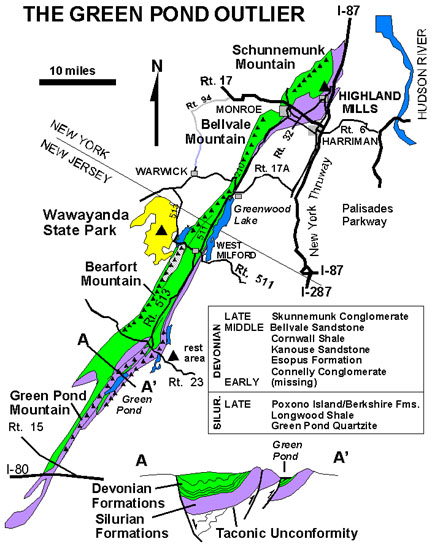
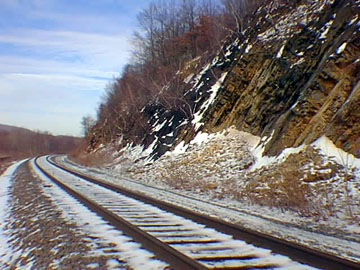
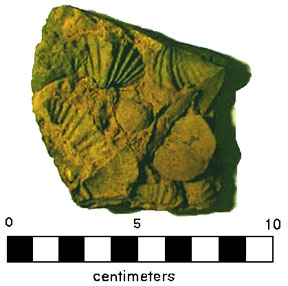
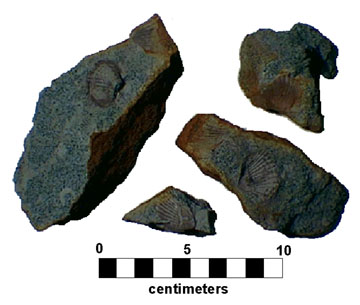
near the town of Kingston, New York. Figure 64. Rugose corals and spiriferid brachiopods from the lower Hamilton Group from near Kingston, New York. Figure 65. Map of the Shuwangunk Escarpment (Silurian) in the Mohonk Preserve and Minnewaska State Park west of New Paltz, New York. Figure 66. Climbers preparing to climb "The Trapps" in the Mohonk Preserve of the Shawangunks. Figure 67. Map Silurian and Devonian rocks of the Green Pond Outlier, New York and New Jersey (modified after Drake et al., 1996 and Fisher et al., 1995). Figure 68. Exposures of steeply dipping Middle Devonian sandstone and shale along the Conrail tracks in Highland Mills, New York. The eastern flank of Schunnemunk Mountain is on the left. Figure 69. Molds of brachiopods in
sandstone from the Middle Devonian Esopus Formation, Figure 70. An exposure of puddingstone
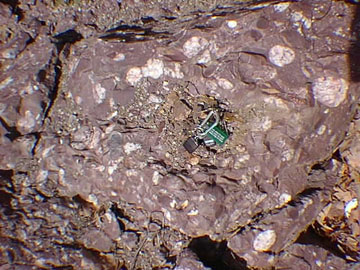
(Late Devonian Skunnemunk Conglomerate) along NJ Route 513 on Bearfort
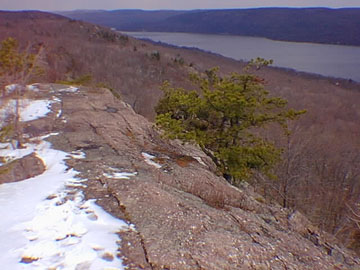
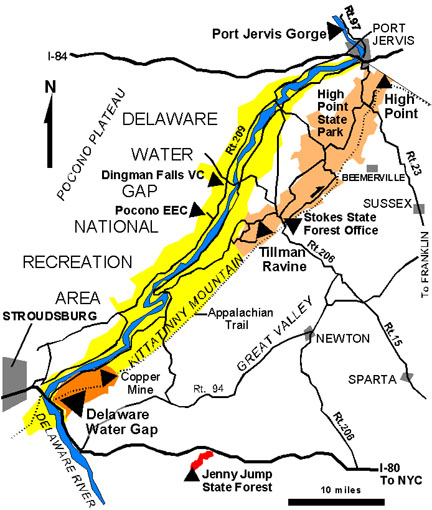
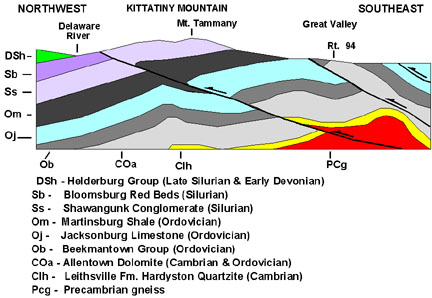
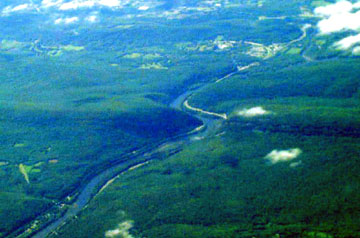
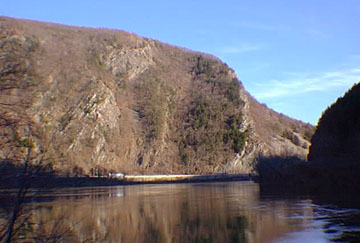
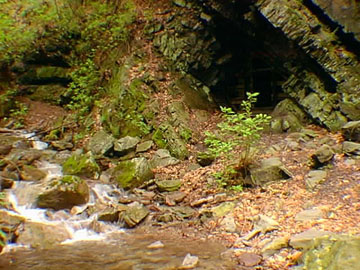
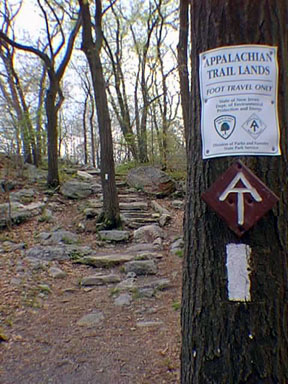
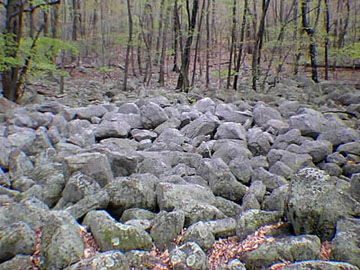
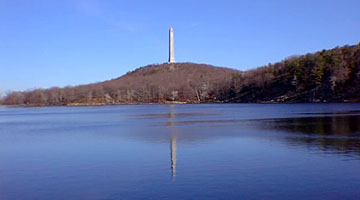
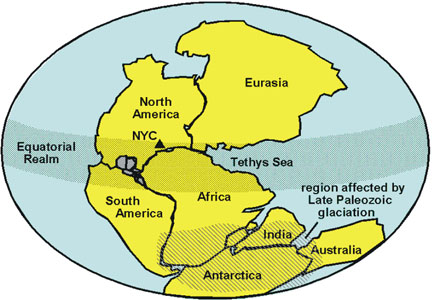
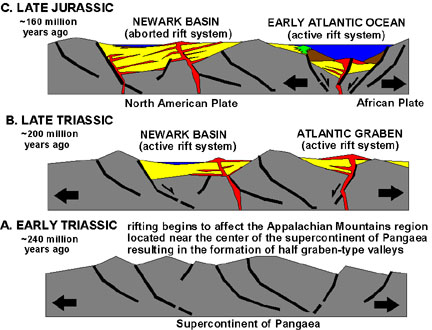
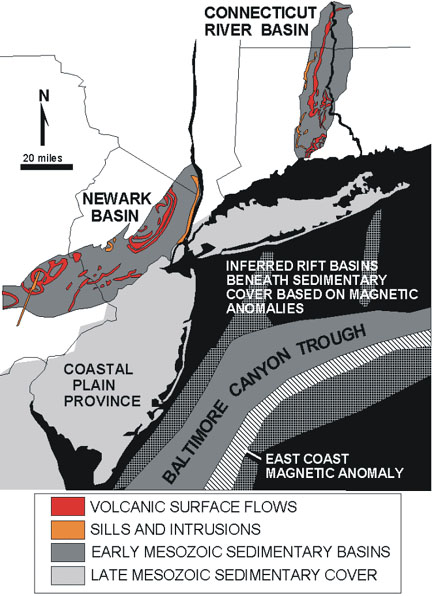
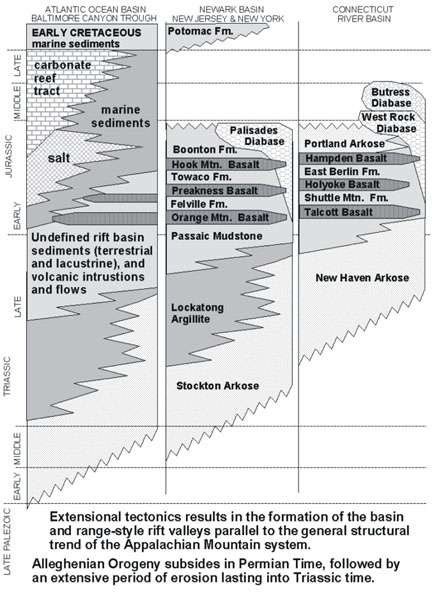
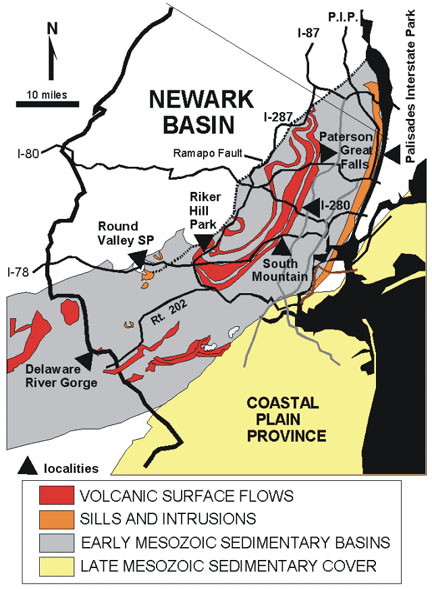
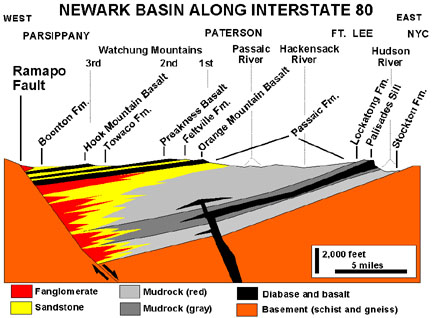
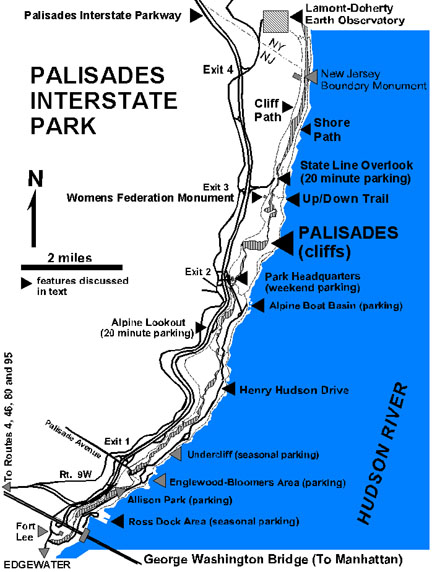
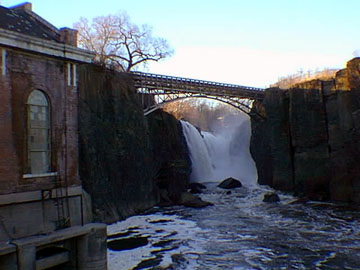
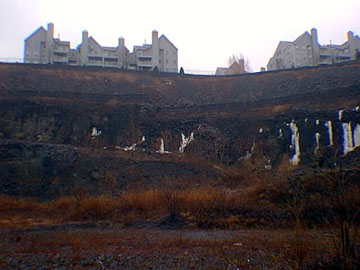
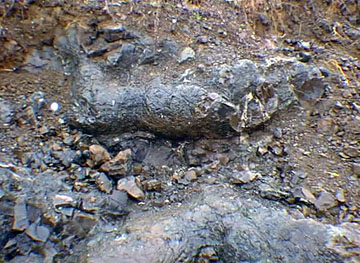
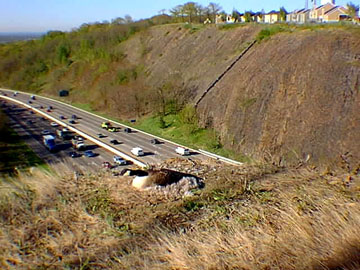
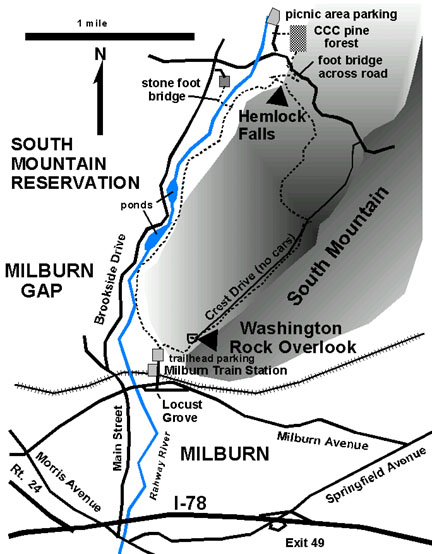
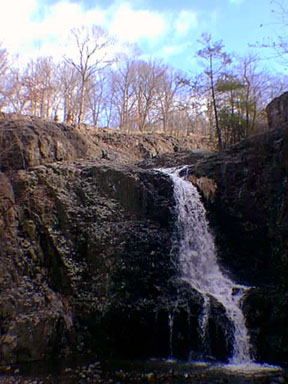
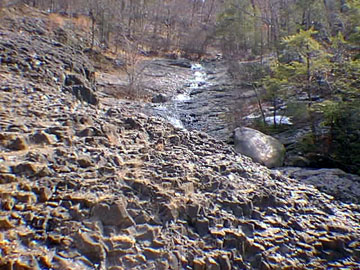
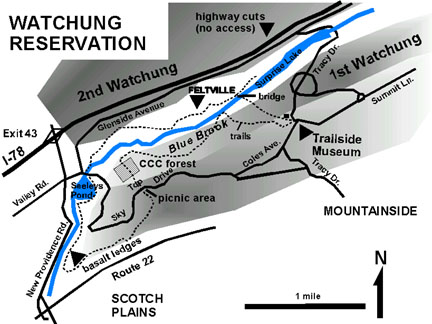
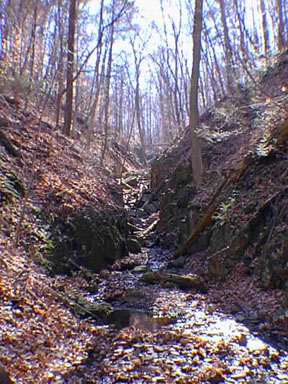
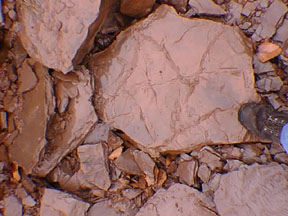
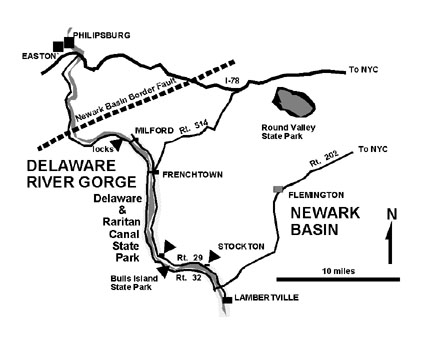
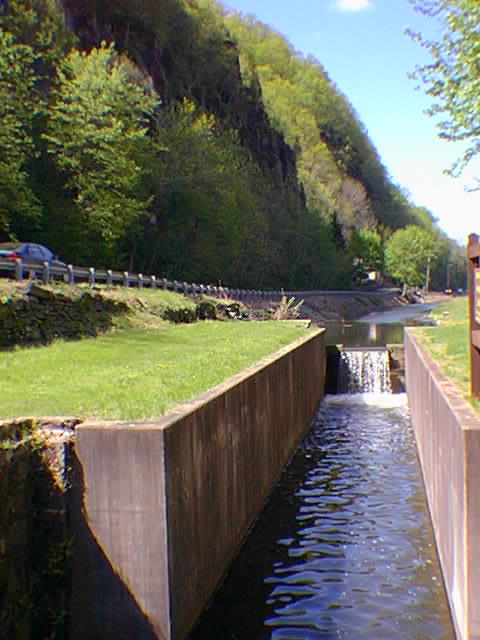
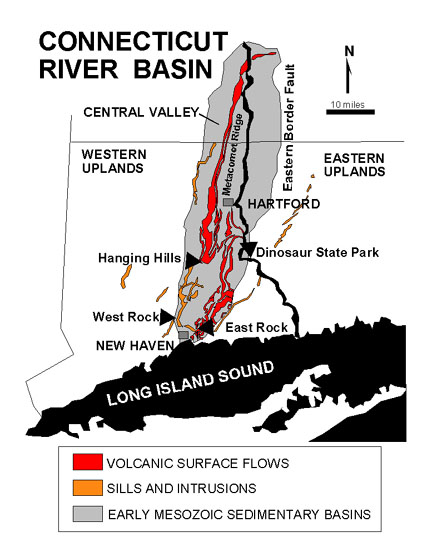
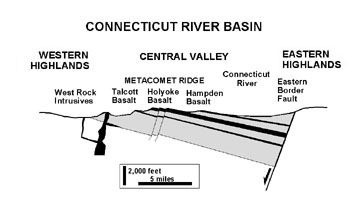
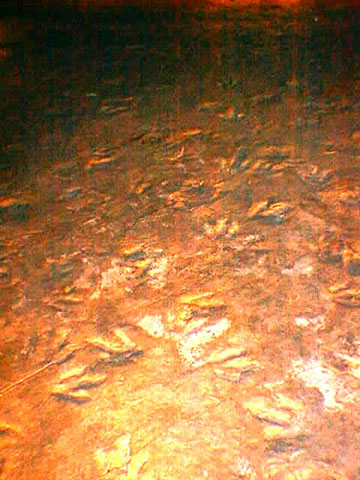
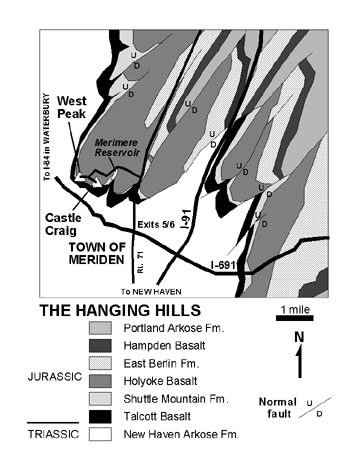
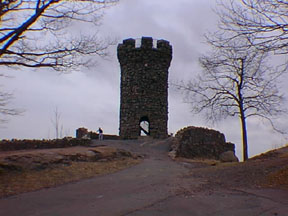
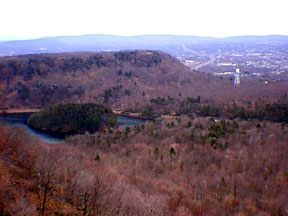
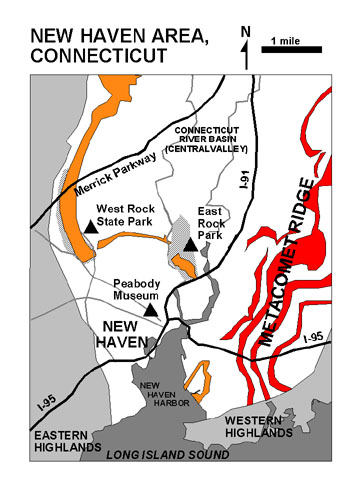
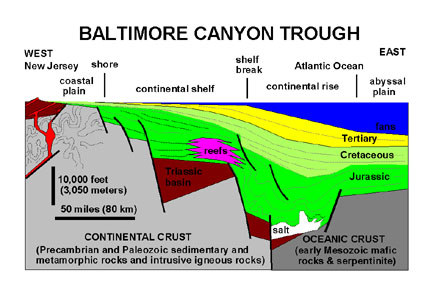
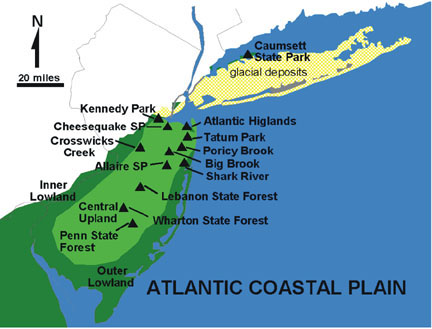
Mountain, north of West Milford, New Jersey; car keys are for scale. Figure 72. Map of localities on Kittatinny Mountain and in the surrounding region along the New Jersey/Pennsylvania border. Figure 73. Generalized cross-section of Kittatinny Mountain the Delaware Water Gap area (after Lyttle & Epstein, 1987). Figure 74. A west-facing jetliner view of the Delaware Water Gap. Figure 75. The Delaware Water Gap from riverside. Cliffs of Silurian Shawangunk Formation crop out above I-80 on Mount Tammany (part of Kittatinny Mountain). Figure 76. An 18th Century copper mine in the redbeds of the Upper Silurian Bloomsburg Formation in the Delaware Water Gap National Recreation Area, New Jersey. Figure 77. The Appalachian Trail winds among glacial erratics along the crest of Kittatinny Mountain in Stokes State Forest, New Jersey. Figure 78. A periglacial boulder field on Kittatinny Mountain along the overlook road eat of Walpack Valley Environmental Education Center, Delaware Water Gap National Recreation Area, New Jersey. Figure 79. The lower falls of Tillman Ravine in Stokes State Forest, New Jersey. Figure 80. The monument at High Point, New Jersey reflecting off of Lake Marria in the foreground. Figure 82. The Delaware River Gorge north of Port Jervis. Late Devonian sedimentary rocks of the Catskill Group are well exposed along sinuous Pa Route 97 (beckoning another car commercial). Figure 83. Generalized reconstruction of the supercontinent, Pangaea in Latest Paleozoic time. Figure 84. The breakup of Pangaea and the formation of the Mesozoic rift basins. Figure 85. Location map of Mesozoic basins in the New York City region (modified after highway map by the American Association of Petroleum Geologist, 1995). Figure 86. Generalized Triassic and Jurassic stratigraphy of the New York City region (after Drake et al., 1996, Fisher et al., 1995, and Rogers, 1985). Figure 87. Map with field localities in the Newark Basin, New York, New Jersey, and Pennsylvania (after Drake et al, 1996 and Lyttle & Epstein 1987). Figure 88. East-to-west cross-section of the Newark Basin along I-80. Figure 89. Map of the Palisades Interstate Park of New Jersey and New York (after PIP park brochure). Figure 90. View of the Palisades escarpment from along the Hudson River near Alpine, New Jersey. Figure 91. Great Falls of the Passaic River in Paterson, New Jersey. Figure 92. A mineral collector illustrates the size of a large cavity formed in a pillow basalt flow on Orange Mountain (1st Watchung Mountain) near Paterson, New Jersey. Figure 93. Condominiums built along the highwall of a quarry in Orange Mountain in Paterson, New Jersey. The ice flows form along the boundary between separate lava flows in the Orange Mountain Basalt. Figure 94. Example of a pillow lava in the Orange Mountain Basalt. Figure 95. A Canada goose sits on a nest built on the edge of a I-280 highway road cut through the columnar-jointed basalt of 1st Watchung Mountain just west of Orange, New Jersey. Figure 96. Map of South Mountain Reservation (1st Watchung) near Milburn, New Jersey. Figure 97. Hemlock Falls cascades off the columnar-jointed basalt (Orange Mountain Basalt of the 1st Watchung) in the South Mountain Reservation. Figure 98. Columnar joints in the Orange Mountain Basalt just above Hemlock Falls in the South Mountain Reservation. The large rounded boulder to the right is a large glacial erratic. Figure 99. Map of the Watchung Reservation near Scotch Plains, New Jersey. Figure 100. A V-shaped, post-glacial ravine carved into the Orange Mountain Basalt in the Watchung Reservation near the historic village of Feltville, New Jersey. Figure 101. Flaggy sandstone of the Jurassic Towaco Formation at Riker Park. The high wall at the upper end of the quarry consists of the Hook Mountain Basalt. Figure 102. Ancient dried lake muds in the Jurassic Towaco Formation display abundant desiccation cracks and sometimes rare dinosaur tracks at Riker Park, New Jersey. Figure 103. Map of the scenic route through the Delaware River Gorge along the New Jersey/Pennsylvania border where a thick sequence of Newark Basin strata is exposed. Figure 104. Locks along the Delaware-Raritan Canal along Pa Route 32 north of Frenchburg, New Jersey. The steep cliffs are of Late Triassic Lockatong Formation. Figure 105. Map of the Connecticut River Basin (after highway map by the American Association of Petroleum Geologists, 1995 and Rogers, 1985). Figure 106. Cross-section of the Connecticut River Basin. Figure 107. Dinosaur footprints on a massive sandstone slab preserved in the museum at Dinosaur State Park, New Jersey. Figure 108. Geologic Map of the Hanging
Hills area near Meridan, Connecticut showing the location of West Peak
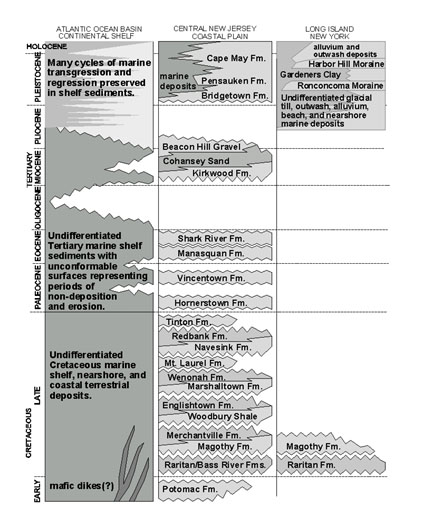
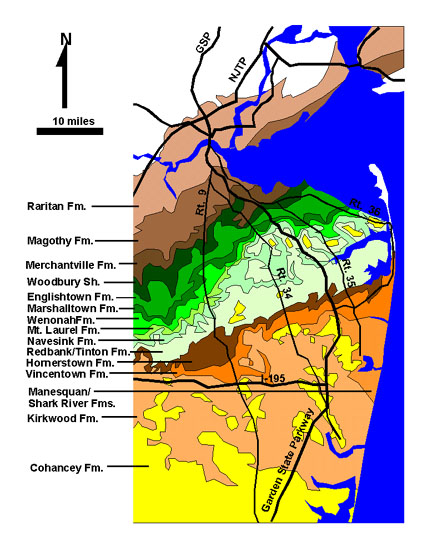
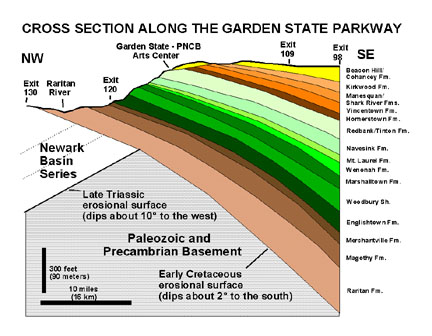
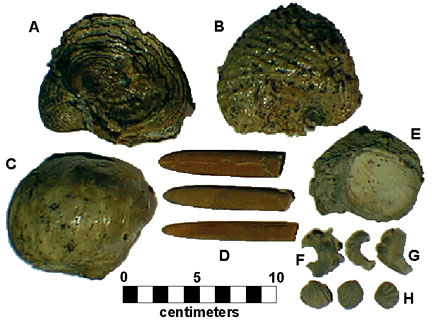
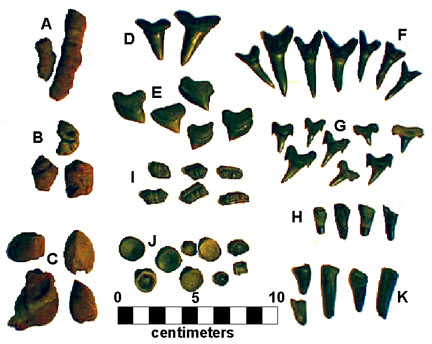
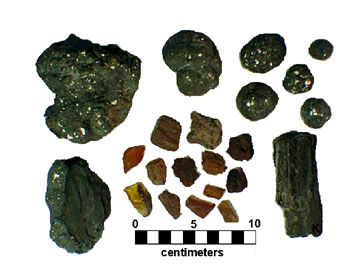
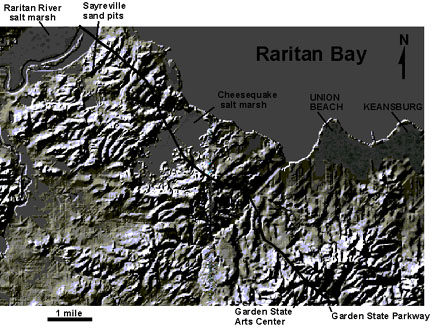
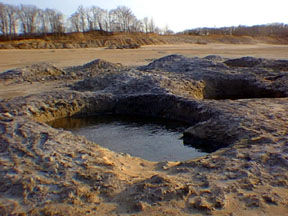
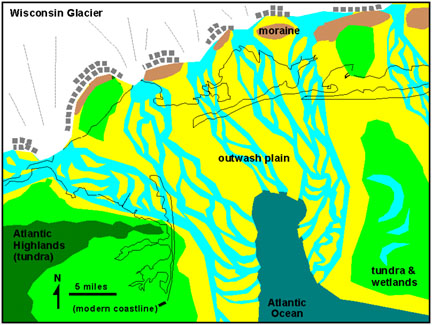
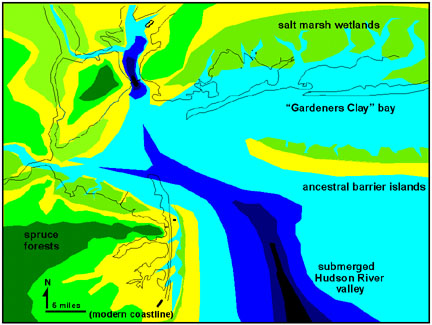
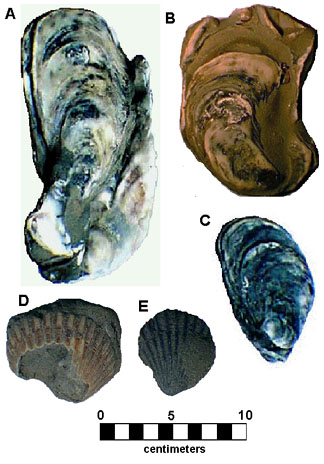
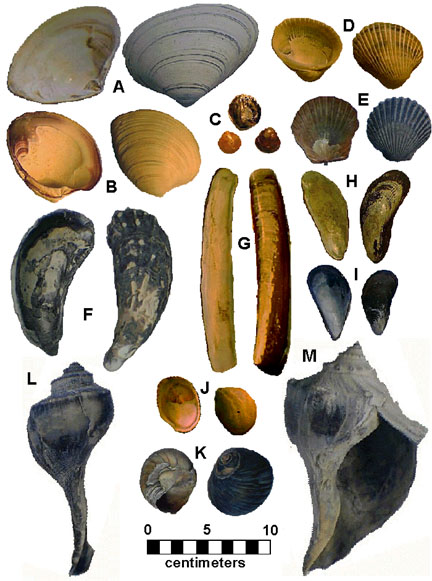
and Castle Craig overlooks (modified after Drake, 1985). Figure 111. Geologic map of the New Haven area (modified after Rogers, 1985). Figure 112. Generalized cross-section of the offshore region of central New Jersey showing hypothetical geologic features of the Baltimore Canyon Trough. Note horizontal and vertical scales (after Sheridan, 1989). Figure 113. Map showing field localities on the Atlantic Coastal Plain of New Jersey, Staten Island, and Long Island. The stippled pattern indicates the region covered by the Late Pleistocene (Wisconsin) glacier (discussed in Chapter 6). Figure 114. Cretaceous and Cenozoic Stratigraphy of the Atlantic Coastal Plain in the New York City region (modified after Lyttle & Epstein, 1987 and COSUNA Chart by the American Association of Petroleum Geologists,1983). Figure 115. Geologic map of the Coastal Plain in eastern New Jersey and New York City (modified after Lyttle & Epstein, 1987). Figure 116. Generalized cross section of the Coastal Plain along a portion of the Garden State Parkway in eastern New Jersey (after Lyttle & Epstein, 1987). Figure 117. Pelecypods in glauconitic marl from the Eocene Shark River Formation. Figure 118. The brachiopod Oleneothyris harlani from the Paleocene Vincentown Formation near New Egypt, New Jersey. Figure 119. Common fossils from the Late Cretaceous (Maastrichtian) Navesink Formation. Mollusks: A-B: Exogyra cancellata, C. Pyncnodont mutabilis, D. Belemnitella americana, E. Spondylus gregalis, F. Ostrea mesenterica, G. Ostrea falcata; Brachiopod: H. Choristothyris pilcata. Figure 120. Common fossils from the Late Cretaceous (Campanian) Wenonah Formation. Sharks teeth: A. Squalicorax, B-C various species (including lamniform sharks), D. goblin sharks (Scapanorhynchus) ; E. rays teeth. F-G. shark and unidentified vertebrate bone material; H. coral, I. casts of mollusks (gastropods and cardium-type clam). Figure 121. Amber, fossil wood, with marcasite and pyrite from the Sayreville Clay Member of the Late Cretaceous Raritan Formation. Figure 122. A shaded relief image
(digital elevation model) of the south shore of Raritan Bay in Monmouth
County, New Jersey showing the rugged topography of the Atlantic Highlands
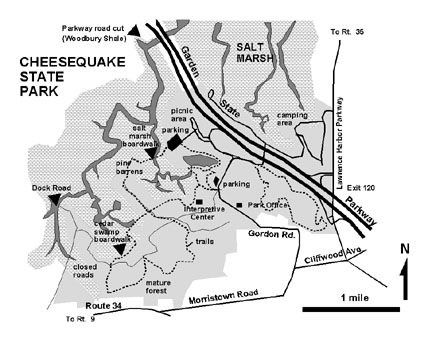
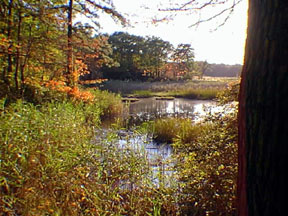
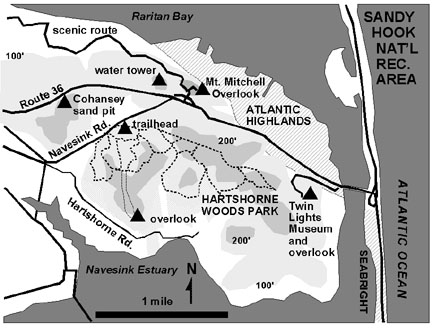
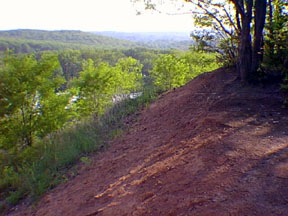
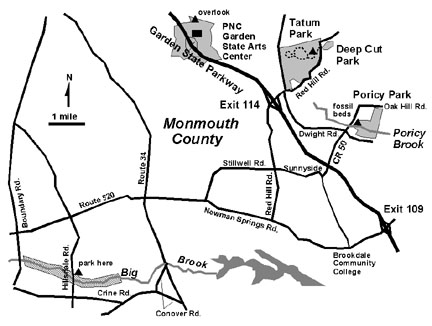
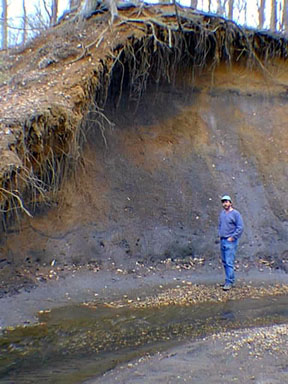
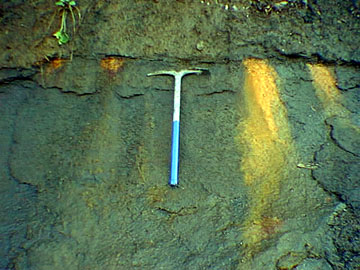
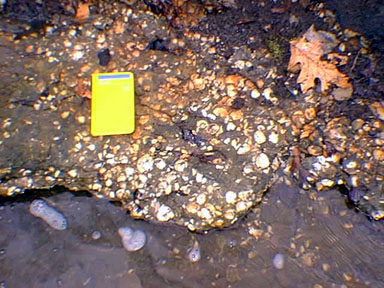
escarpment. Figure 124. Map of Cheesequake State Park. Figure 125. Transitional coastal wetland environments at Cheesequake State Park. Figure 126. Map of the Atlantic Highlands area overlooking Sandy Hook and the Navesink River estuary in Monmouth County, New Jersey (including Hartshorne Woods Park and the Mt Mitchell Overlook). Figure 127. Gravel outcrop of the Beacon Hill Gravel (Pliocene) of the Cohansey Formation near the water tower in Highlands, New Jersey (near the Mt. Mitchell Overlook, Monmouth County). Figure 128. Map showing the location of Poricy Brook, Big Brook, Tatum Park, and the escarpment overlook at Garden State Arts Center (Monmouth County, New Jersey). Figure 129. Stream cutbank along Poricy Brook in Poricy Park. A shell bed in the Late Cretaceous Navesink Formation occurs about knee level above the stream. Weathered red sand of the Late Cretaceous Redbank Formation is exposed near the top of the cutbank. Figure 130. A nonconformity at the base of the Late Cretaceous Navesink Formation along Big Brook (Monmouth County, NJ) is highlighted by iron-stained deposits associated with groundwater seepage.
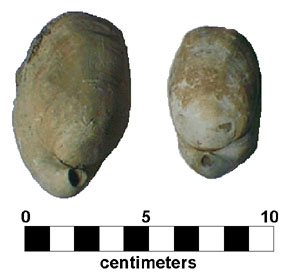
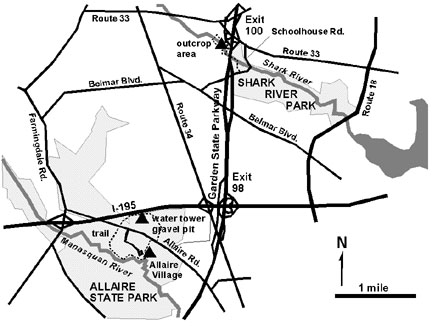
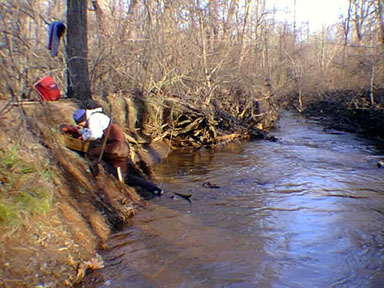
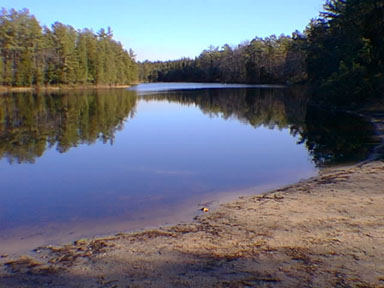
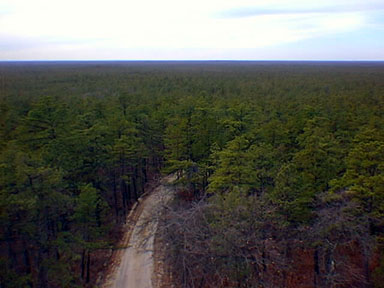
Figure 132. An Oleneothyrus shell
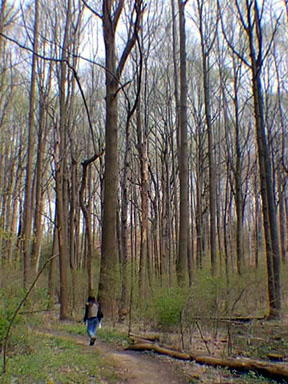
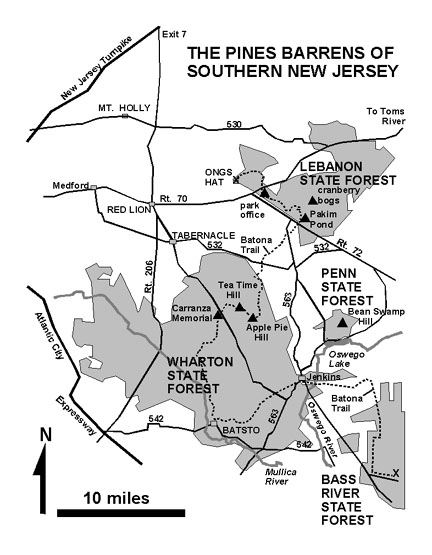
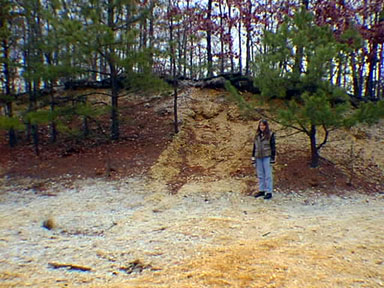
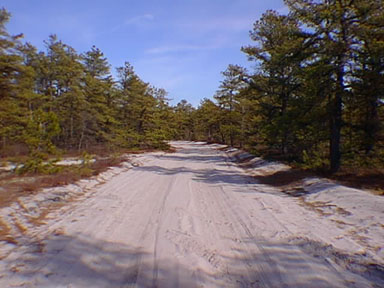
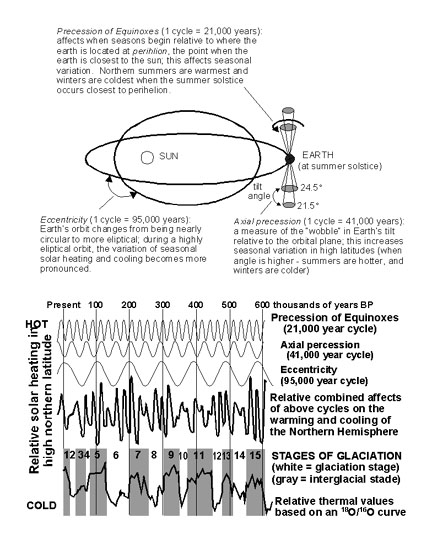
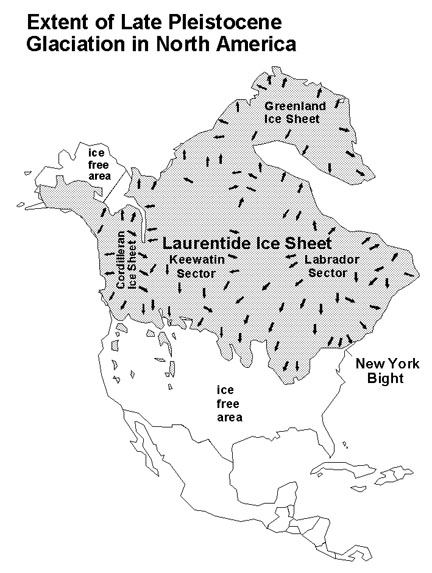
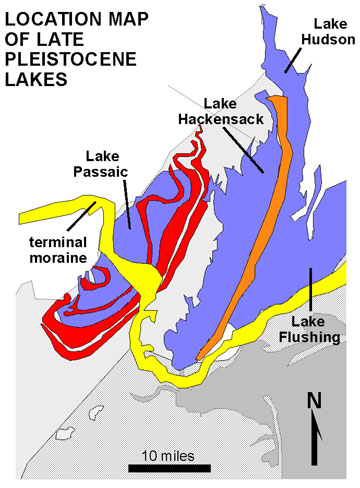
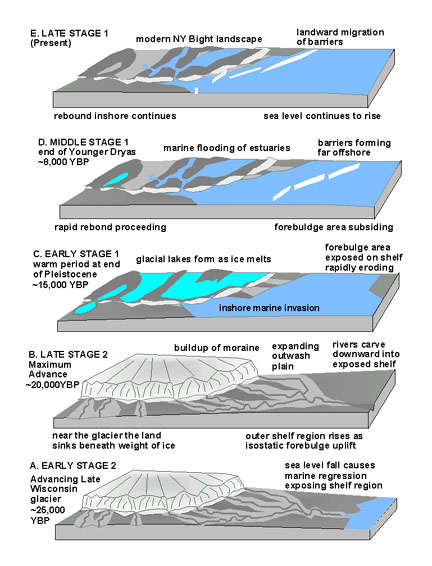
bed in the Vincentown Formation near New Egypt, New Jersey. Figure 135. Map showing parklands and features in the central Pine Barrens of southern New Jersey. Figure 136. A gravel pit in the Beacon Hill Gravel (Pliocene) near the water tower along the trails around Allaire State Park. Figure 137. A sandy beach next to the brown tea-colored waters of Pakin Pond, an abandoned cranberry bog within the pine barrens of Lebanon State Forest. Figure 138. Nearly pure white quartz
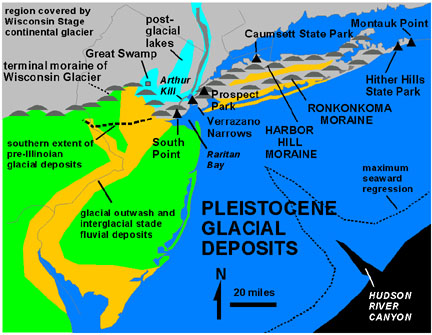
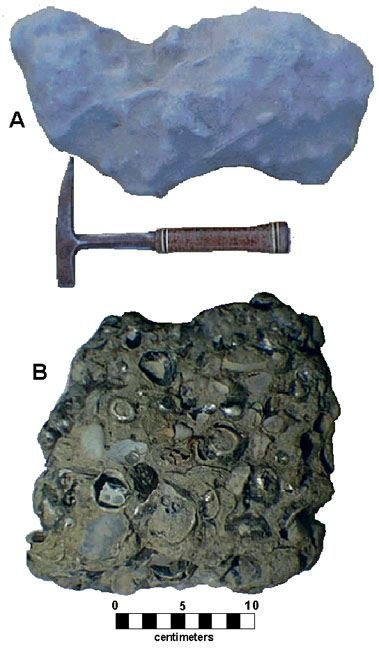
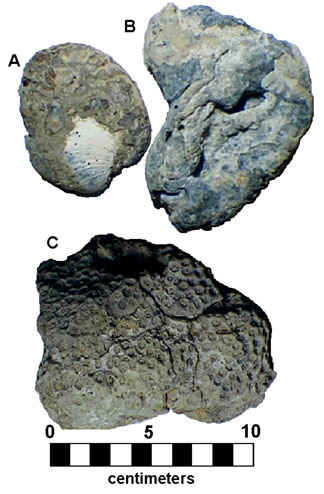
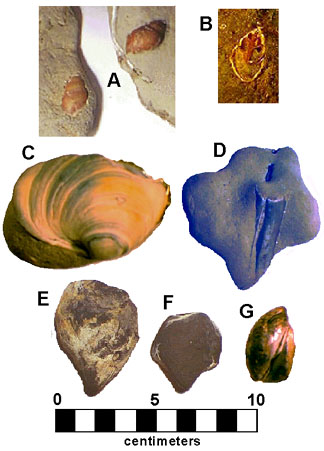
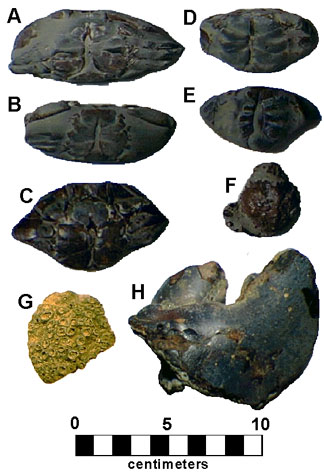
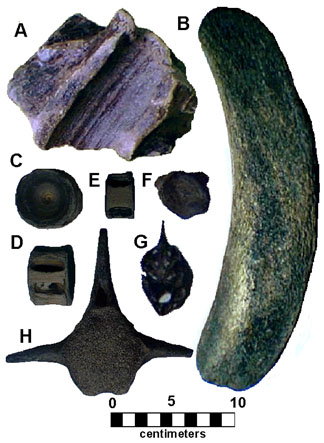
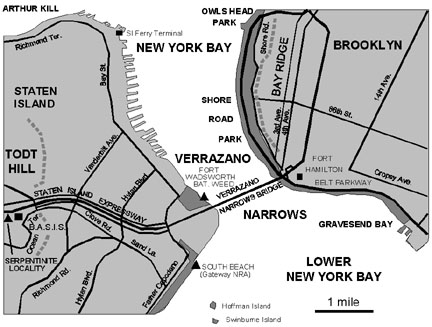
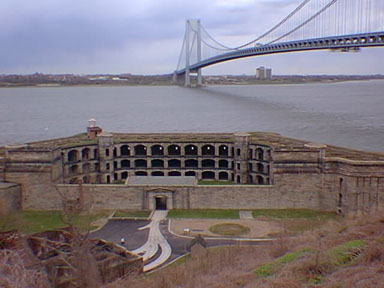
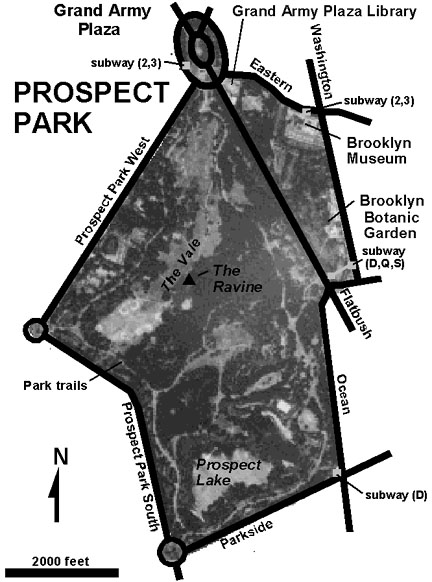
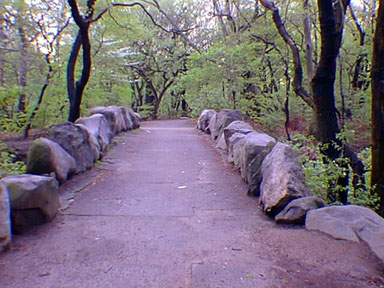
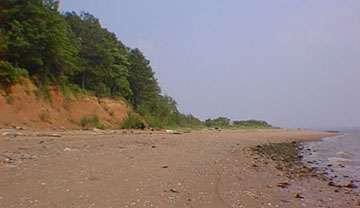
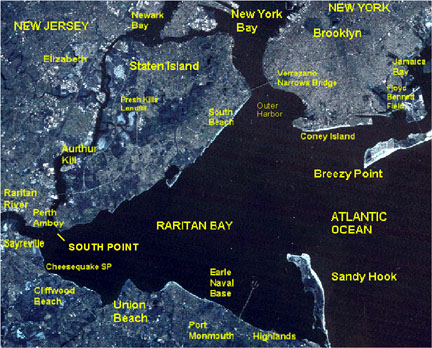
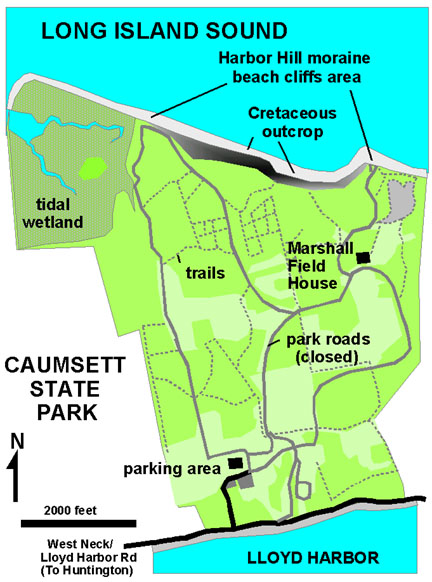
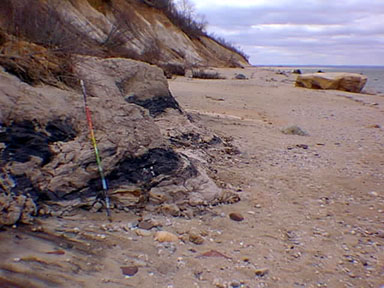
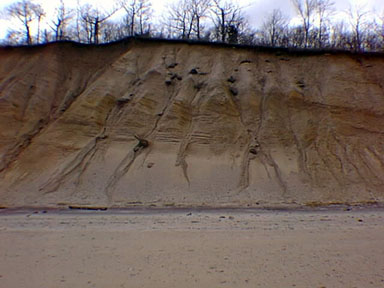
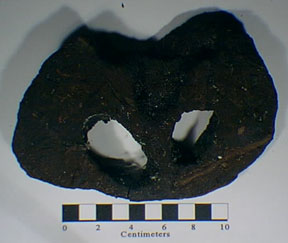
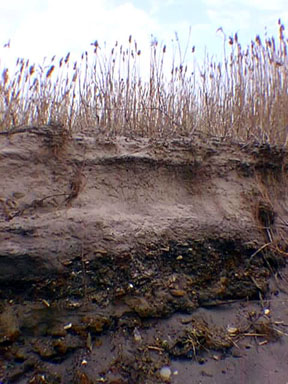
sand lines a road through the pine barrens of Wharton State Forest. Figure 140. Quartz pebbles of the Pliocene Beacon Hill Gravel amongst pine needles on Bean Swamp Hill in Penn State Forest. Figure 141. Pleistocene glacial deposits and features in the New York City region. Figure 142. Comparison of Milankovitch cycles to stages of Pleistocene glaciation (modified after Imbrie & Imbrie, 1979). Figure 143. Map of North America showing the extent of Late Pleistocene glaciation (modified after Pielou, 1991). Figure 144. Map showing the location of the terminal moraine of the Wisconsin glacier (Stage 2) and the extent of moraine-dammed lakes in the New York City area (after Schubert, 1967). Figure 145. Reconstruction of changes in the landscape in the New York City region from 25,000 years ago to the present. Figure 146. Hypothetical map of the New York Bight during the maximum advance of the late Wisconsin glacier (Stage 2 - about 20,000 years BP). Figure 147. Hypothetical map of the New York Bight during deposition of the Gardeners Clay in Early Holocene time (Stage 1 - about 8,000 year BP). Figure 148. Concretions from the Pleistocene/Holocene Gardeners Clay: A. concretion displaying massive bioturbation structures (hammer handle is 1 foot for scale); B. Concretion containing fossils of jingle shells, spruce pine cones, bone, and oyster shell . These specimens washed up on the beach at Sandy Hook during a winter storm. Figure 149. New York Bight beach fossils. Calcareous sponges: A. sponge encrusting a quahog shell; B. sponge encrusting an oyster shell; C. Stony Coral encrusting a concretion. These specimens were derived from Pleistocene-Holocene marine sediments, but both all species occur in the modern New York Bight. All specimens were found on Breezy Point, NY. Figure 150. New York Bight beach fossils. Bivalves: A-C: Oysters preserved in growth position preserved in sideritic sandstone matrix; found on Breezy Point, NY. A radiocarbon analysis of a sample of oyster shell in concretion matrix yielded an Early Holocene date of 7,610 (+/-150) years before present. The matrix of oyster shell-bearing concretions contain an abundance of gastropods (mud dog whelk). Both species thrive in estuary environments. D-E: Bay scallops in concretion matrix; Sandy Hook, NJ. Figure 151. New York Bight beach fossils. Bivalves: A-B. gastropods (mud dog whelk); Breezy point, NY. C. surf clam; Breezy Point, NY. D. razor clam; Sandy Hook, NJ. E-G. Internal molds of bivalve in lithified bay mud; Breezy Point, NY. Figure 152. New York Bight beach fossils: Arthropods: A-C. Blue claw crabs (Breezy Point, NY). D-E. green crabs (Breezy Point, NY). F. spider crab (Sandy Hook, NJ). G. barnacles attached to shell (Sandy Hook, NJ); H. American lobster claw (Sandy Hook, NJ). Figure 153. New York Bight beach fossils from Rockaway Beach, Queens, NY: A. American walrus skull (left ventral view - note tusk socket); B. whale vertebrae. C-F. fish or shark vertebrae. G-H. unidentified vertebrae. Figure 154. Map of the Verrazano Narrows area (Brooklyn and Staten Island). Figure 155. Battery Weed in Fort Wadsworth overlooking the Verrazano Narrows Bridge and bay from Staten Island. Figure 156. Map of Prospect Park, Brooklyn, New York. Figure 157. A bridge built of local glacial erratics crosses The Ravine in Prospect Park. Figure 158. Glacial moraine exposed in sea cliffs at South Point on Staten Islands. This is the southernmost outcrop in the state of New York. Figure 159. Landsat image of the Raritan Bay area. Figure 160. Map of Caumsett State Park on the north shore of Long Island, New York (after park brochure). Figure 161. Lignite in the Late Cretaceous Magothy Formation exposed at the base of the sea cliffs in Caumsett State Park. Note the large glacial erratics on the gravel beach. Figure 162. Stratified (outwash) and
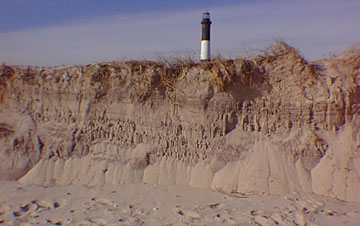
unstratified (till) deposits exposed in the sea cliffs along Long Island
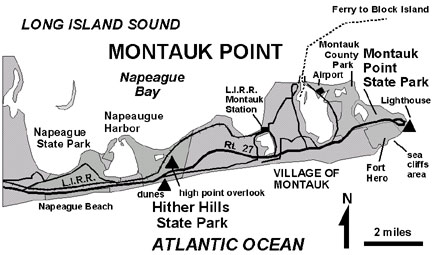
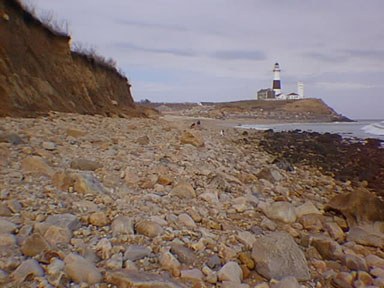
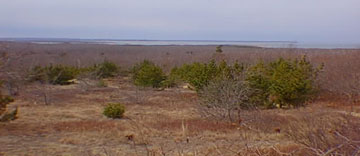
Sound in Caumsett State Park. Figure 164. The boulder-covered beach and moraine cliffs exposed along the Atlantic Ocean. Montauk Lighthouse is in the distance. Figure 165. View from the Highway
27 hilltop overlook in Hither Hills State Park, looking northward towards
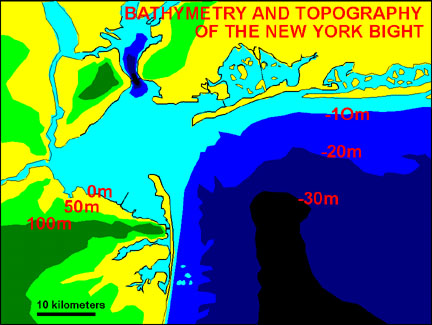
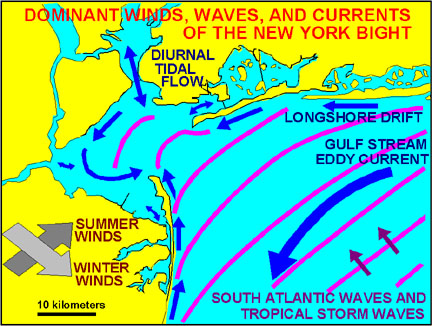
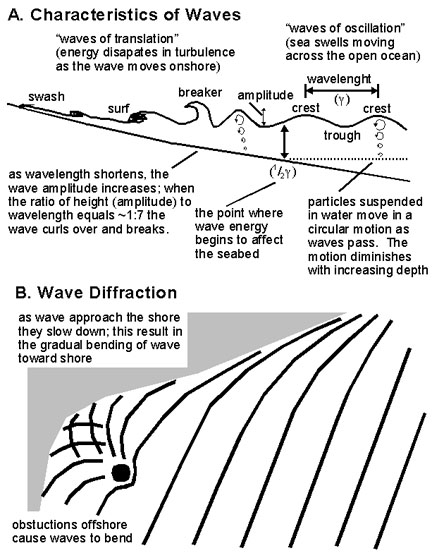
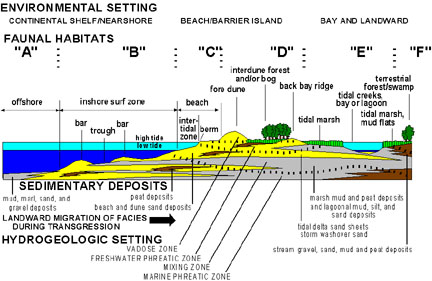
the shallow bays along Long Island Sound. Figure 167. Topography and bathymetry of the inner New York Bight region. Figure 168. Dominant winds, waves, and current patterns of the New York Bight. Figure 169. Characteristics of waves and wave diffraction. Figure 170. Environmental setting, faunal habitats, sedimentary deposits, and hydrologic setting of a barrier island.
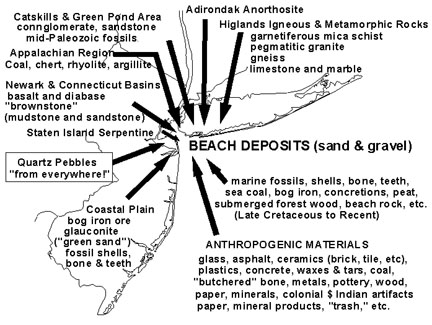
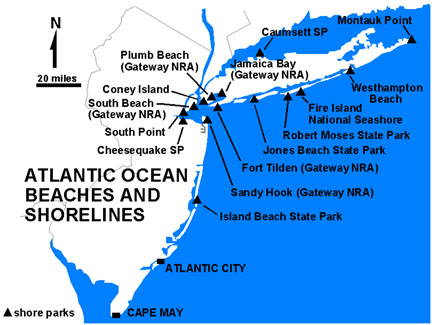
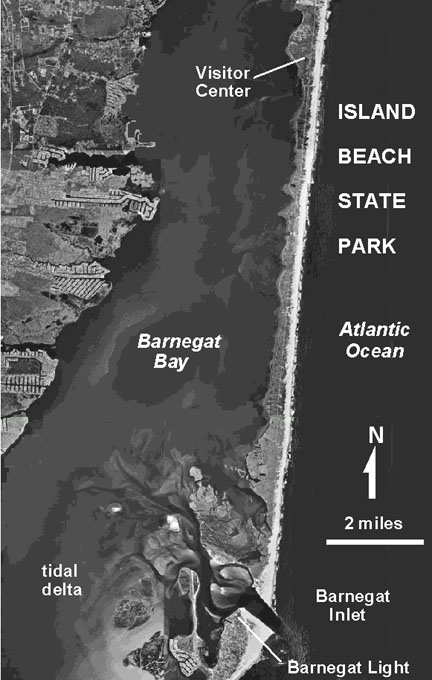
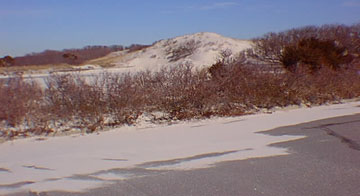
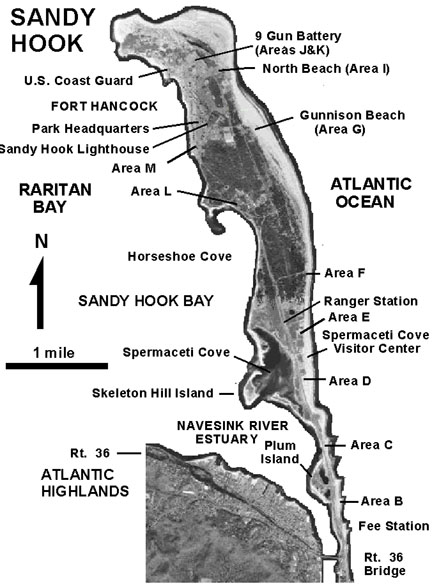
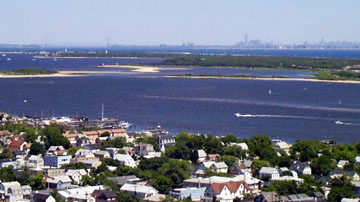
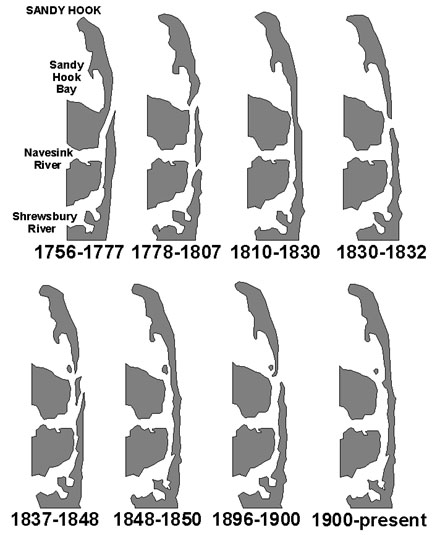
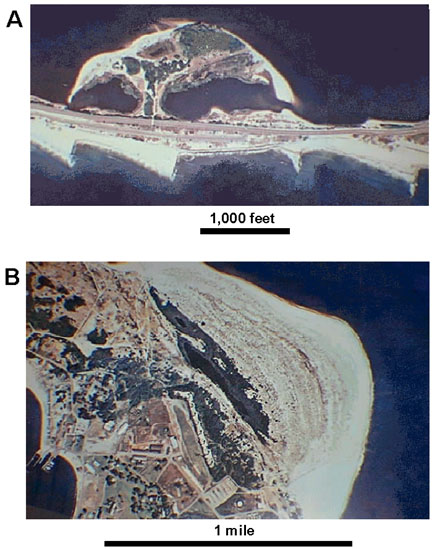
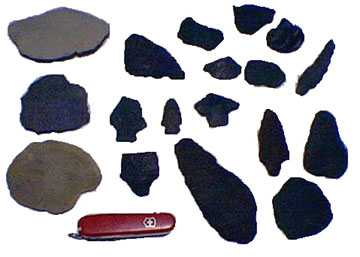
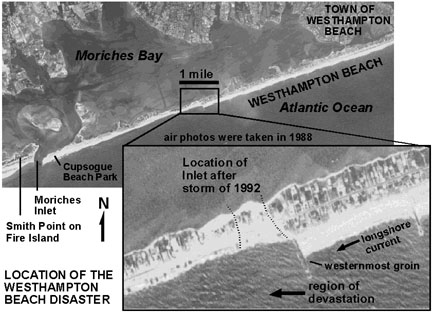
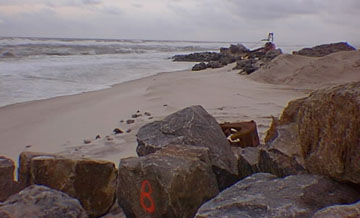
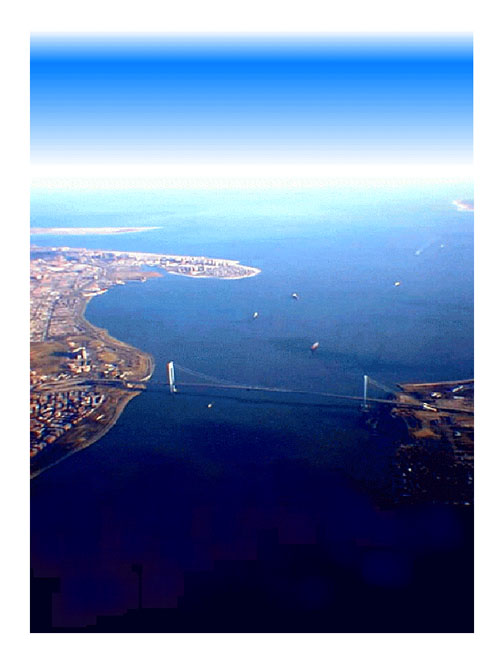
Figure 172. Types of materials found in wrackline deposits on the beaches of the New York Bight. Figure 173. Map of selected beach, barrier, and bay localities in the New York Bight. Figure 174. Aerial photograph map of Island Beach State Park including the tidal delta in Barnegat Bay. Figure 175. A coastal dune moves in on a parking lot at Island Beach State Park. Figure 176. Aerial photograph map of Sandy Hook, New Jersey. Figure 177. View of Sandy Hook from the lighthouse observation deck at Twin Lights Museum in Highlands, New Jersey. Note the Manhattan skyline in the distance. Figure 178. Maps showing the progressive shoreline changes at Sandy Hook (after NPS Spermaceti Cove Visitor Center display). Figure 179. Sedimentation features
on aerial photographs of Sandy Hook: A. Plum Island represents the remnants
of a washover fan. The sawtooth pattern along the Atlantic Ocean side
reveals the buildup of sand adjacent to stone groins transported northward
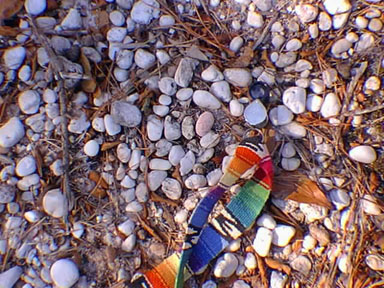
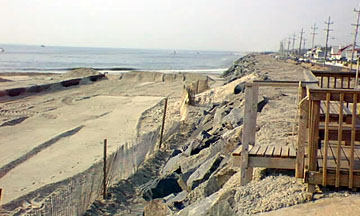
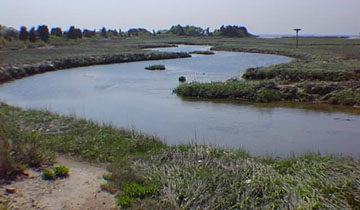
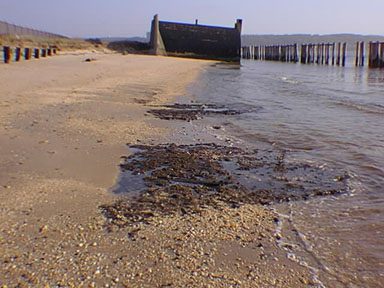
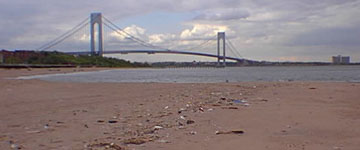
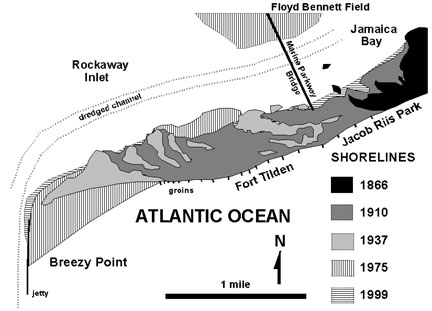
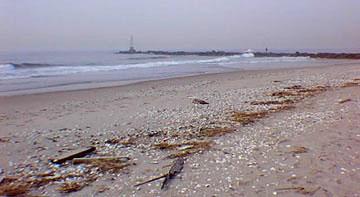
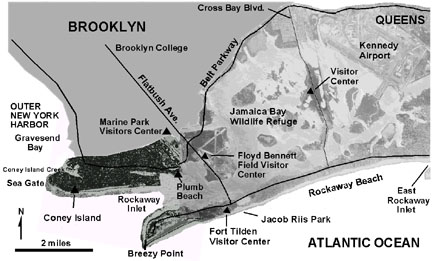
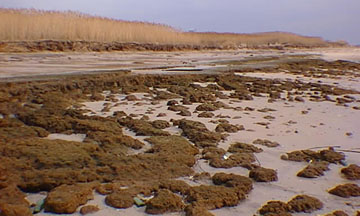
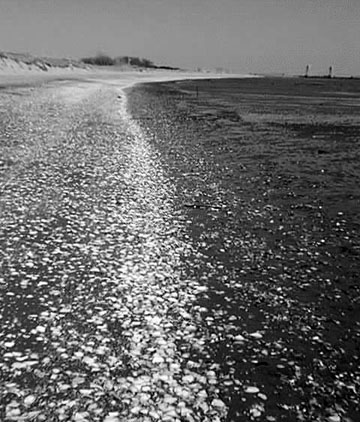
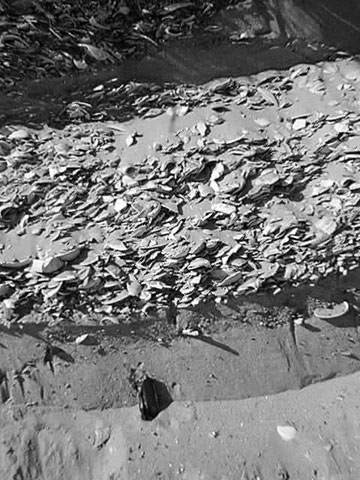
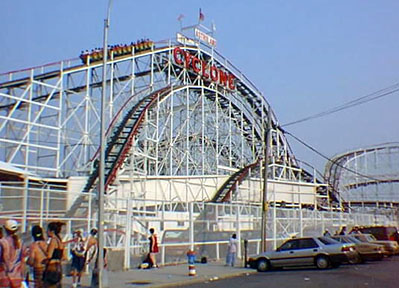
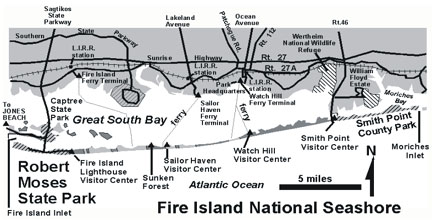
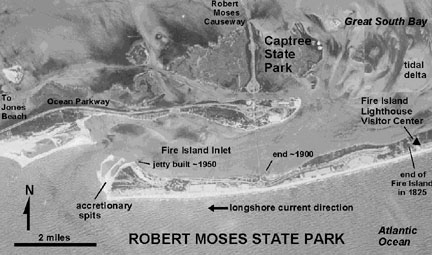
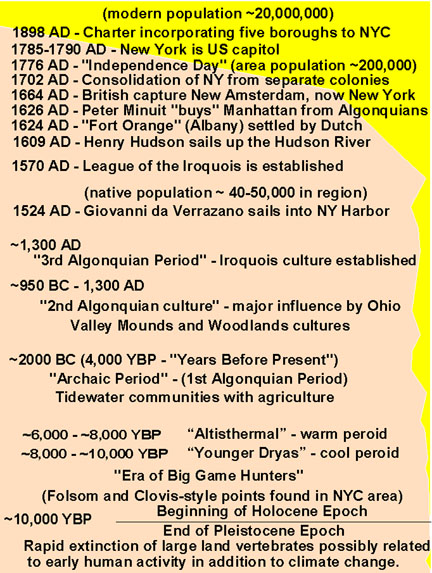
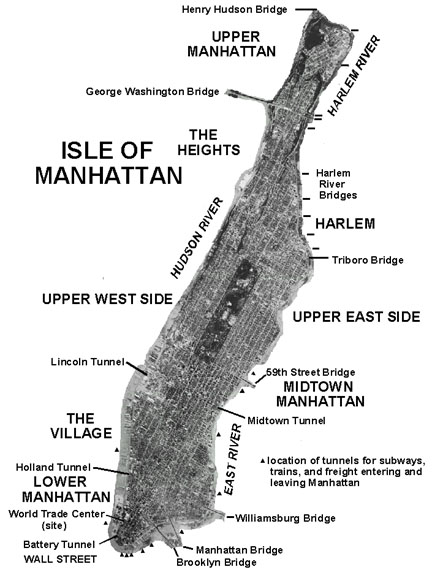
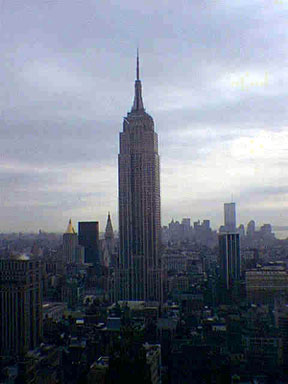
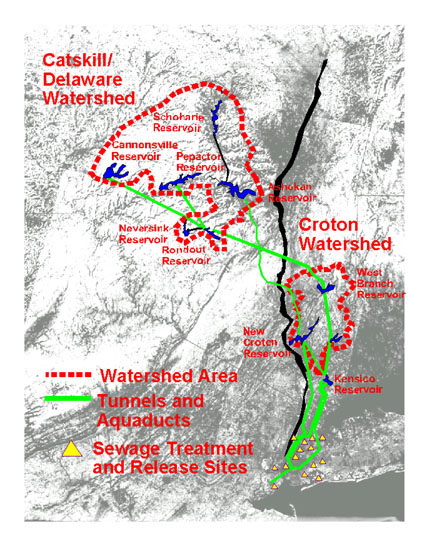
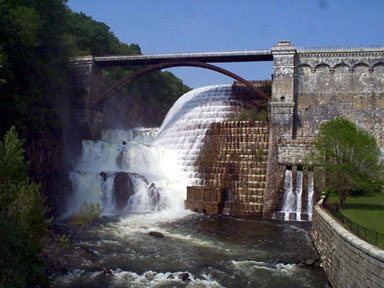
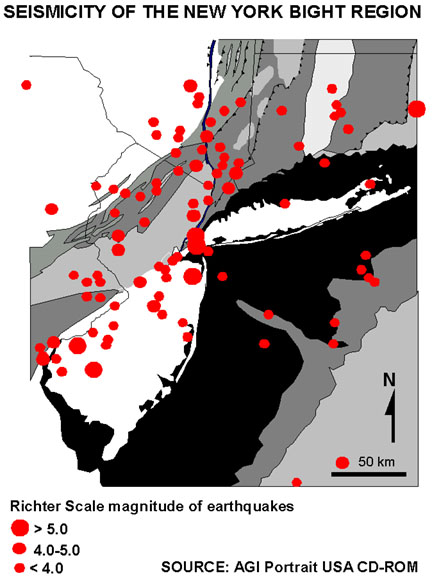
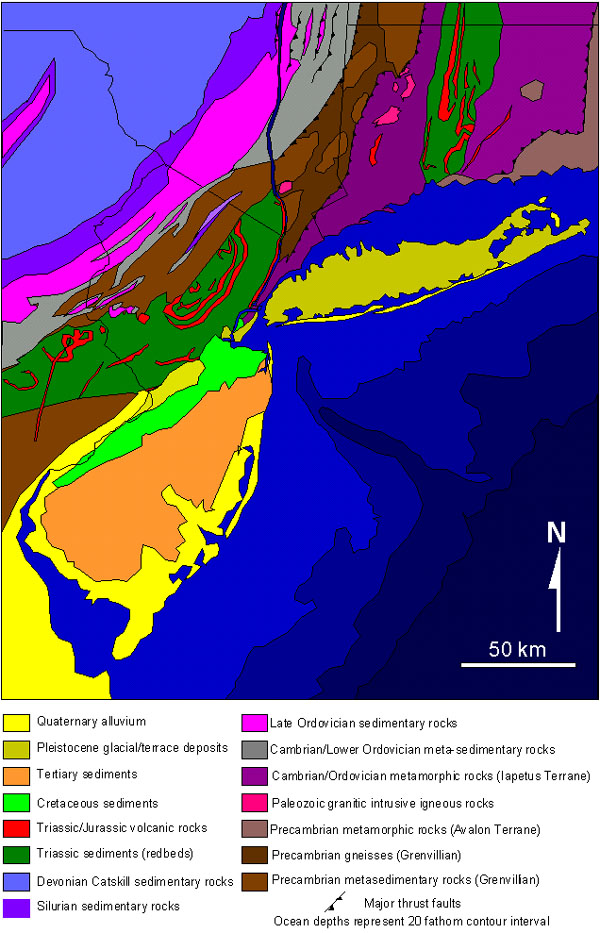
by longshore drift. Figure 180. A sand replenishment operation along the seawall in Seabright, New Jersey just south of Sandy Hook. Note the lack of beach along the seawall south of the beach-building operation. Figure 181. A tidal creek and salt marsh. A salt cedar forest is developed amongst the bayside dunes in the distance. Raritan Bay is to the right. The telephone pole-like platform is an artificial osprey nest. Figure 182. An early 20th century military bunker likes exposed to the wave on Raritan Bay. The line of posts on the right represents an old shoreline seawall built around 1910. The shoreline has eroded back almost 200 feet. The dark rocks in the foreground are tightly iron-cemented conglomerate formed in Late Pleistocene or Early Holocene gravel deposits. Figure 183. A view of the flotsam-covered South Beach of Staten Island with the Verrazano Bridge. Figure 184. Map showing the accretionary growth of Rockaway Spit (revised version of a NPS Fort Tilden Visitor Center display). Figure 185. A wrackline formed on the beach at Breezy Point. The dark line on the horizon is the Breezy Point jetty built in the early 1970s. Figure 186. Stone Indian artifacts washed up on the New York beach after storms. The occurrence of these materials on area beaches is an indication that sea level is progressively rising. A rich archeological record is probably submerged offshore. Artifacts are made from chert derived from the Valley and Ridge region, and local granite and schist. The Swiss army knife is four inches for scale. Figure 187. Map of Jamaica Bay, Coney Island, Rockaway Spit (Brooklyn and Queens). Figure 188. Peat exposed by beach erosion at low tide at Floyd Bennett Field. Note the new marsh grass growth about a meter above the high tide line. These peat deposits are another indication that sea level is rising. Figure 189. A wrackline of broken surf clam shells along mud flats exposed at low tide along Plumb Beach in Brooklyn. Beach and shore dunes are on the left Figure 190. Shell hash accumulations exposed high in the shore dunes at Plumb Beach. These storm deposits formed during nor'easters in the early 1990s. Figure 191. The Cyclone at Coney Island has been terrorizing riders since the late 1920s. Figure 192. Map of Fire Island National Seashore with Robert Moses State Park along the south shore of Long Island. .Figure 193. Aerial photograph map of Robert Moses State Park. Note the location of the end of Fire Island in 1825 when the lighthouse was built. Figure 194. Layered bedding exposed by storm erosion of the shore dunes. The top of the Fire Island Lighthouse is in the distance. Figure 195. A runnel is formed on the beach as a bar migrates on shore in the spring (after much beach erosion during the previous winter) at Robert Moses State Park. Figure 196. Westward view from the Fire Island Lighthouse observation deck of the "new land" that has formed since the lighthouse was built in 1825. This new land is now Robert Moses State Park. Figure 197. Eastward view from the Fire Island Lighthouse observation deck of the increasingly narrow Fire Island. Figure 198. Clam-bored peat eroded from submerged deposits offshore from Westhampton Beach. One indication that sea level is rising and that the barrier islands are migrating shoreward. Figure 199. Aerial photographs of the disaster area at Westhampton Beach. Figure 200. An operation to modify the groins at Westhampton Beach. Figure 201. A Holocene time line for the New York City region showing growth and changes of the human population. Figure 202. Aerial photograph map of Manhattan Island. Figure 203. Southward view of the Empire State Building from the 39th floor of the Grace Building (42nd Street in Midtown. Note the buildup of sky scrappers in the Wall Street area in the distance. Figure 204. Map of the New York City water supply network with the location of sewage treatment and release sites in the city. Figure 205. The spillway at New Croton Reservoir near Croton-On-Hudson, Westchester County, New York. Figure 206. Coastal erosion is exposing a landfill used during the 1930s to 1950s near Floyd Bennett Field, Brooklyn New York. Figure 207. Seismicity map of the New York City region (information modified from the seismic data set of the Joint Education Initiative Portrait USA CD-ROM). Geologic map of the New York City region. Index map of geologic field-trip destinations in the New York City region. |
|
The URL is: https://gotbooks.miracosta.edu/gonp/nyc/coastalplain/captions.htm Last modified: 3/11/2019 |