Natural Resources (Renewable and Non-Renewable) |
|
| Everything we use and consume comes from somewhere. A natural resource is the physical supply of something that exists in nature, such as soil, water, air, plants, animals, rocks, minerals and energy. Materials are mined or harvested, and most of our energy currently comes from fossil fuels, but that is changing as new alternative and renewable energy sources are coming available. This website is a snapshot of non-renewable, renewable, and alternative energy resources. This website also examines mineral resources (non-energy related), both non-renewable and recyclable materials. According to a USGS fact sheet provided by the Minerals Education Coalition, 2021,(1) each person in the United States requires over 40,630 pounds of minerals each year—both energy and non-energy materials distributed across all sectors of American society. This includes non-renewable energy materials and non-energy materials. The information below shows average amounts consumed by US citizens (the amount consumed by the entire nation divided by the number of citizens). Note that consumption rates are much higher that of average citizens of other countries because of the per-capita standards of living (regarding consumption of natural resources) in the US has traditionally been much higher than in other countries, but those numbers are changing globally. |
Click on images for a larger view. |
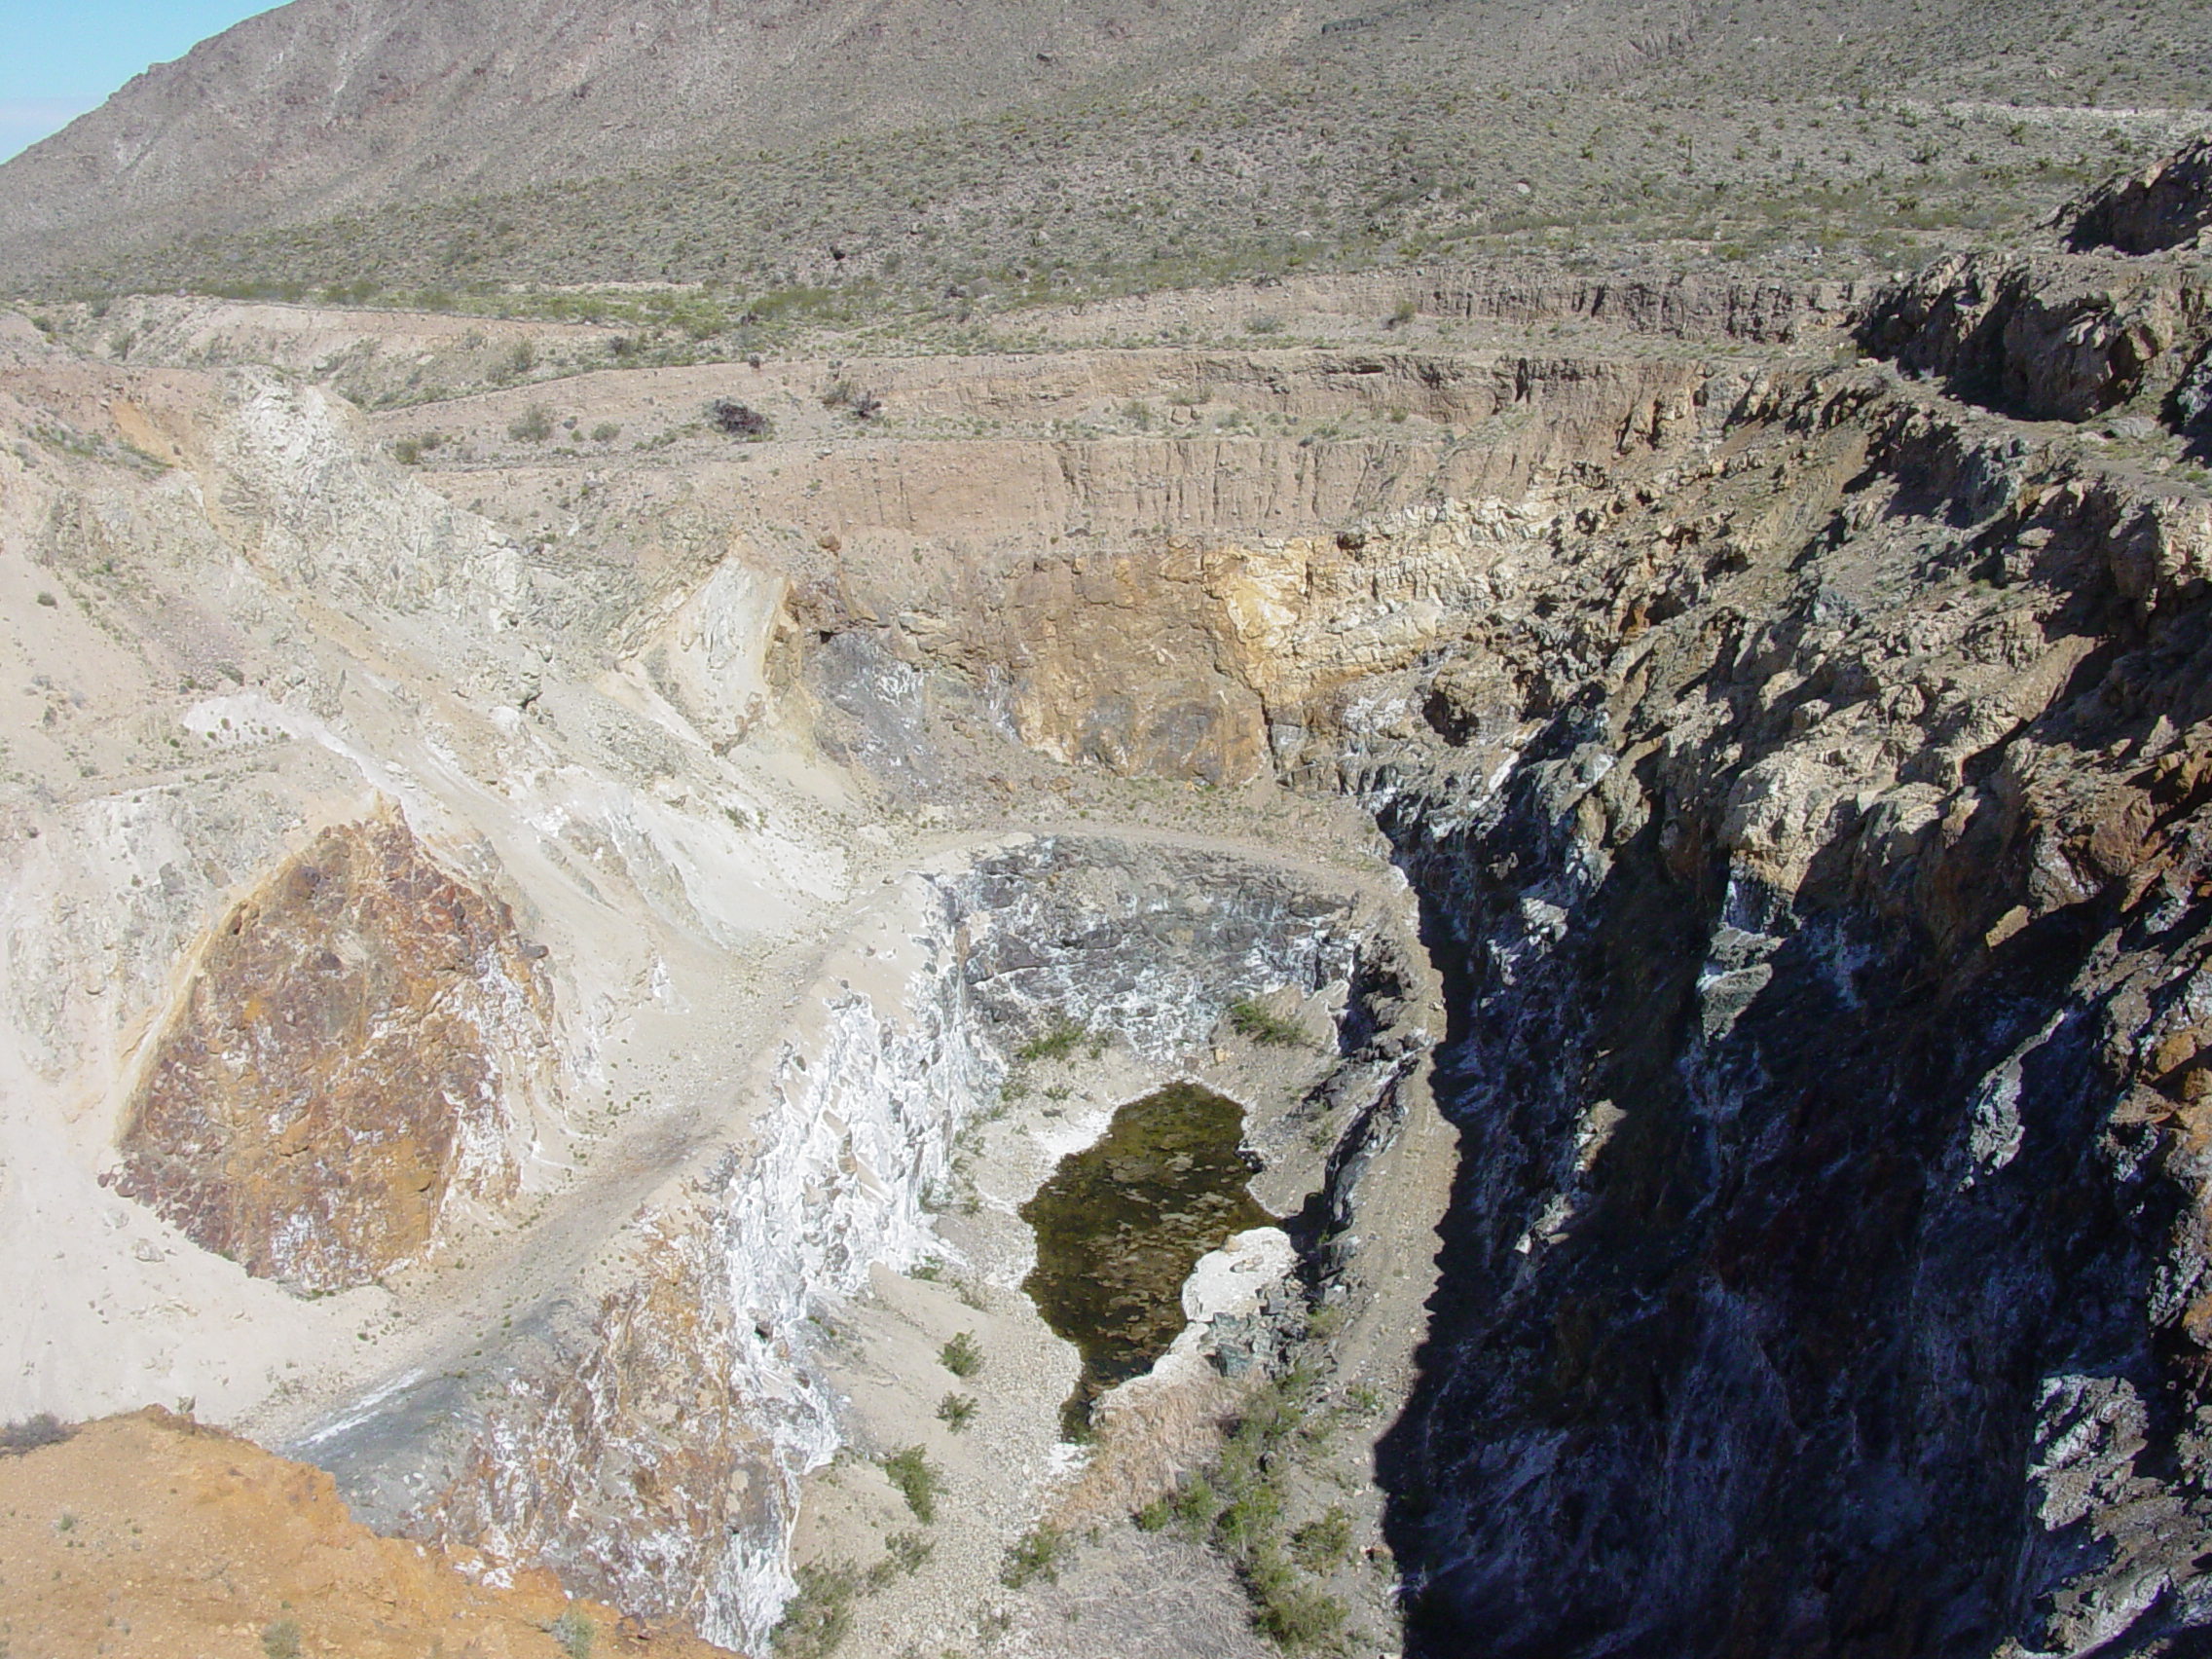 Fig. 1. Vulcan Mine, an abandoned iron mine in the Mojave National Preserve. |
Resources vs. ReservesNon-renewable resources, both energy and non-energy (minerals) related, are evaluated as both a resource or a reserve. |
Example − The Copper Industry: Booms and BustsWars and international crises have influenced the price of copper (Figure 2). The US Civil War, WWI and the Korean War created spikes in demand for copper (whereas during WW2 the US government controlled the market price and distribution). The copper industry has experience numerous "boom to bust" ventures over time. Examples include: Pierre-Eugène Secrétan, a French copper industrialist and artist, made a fortune the copper market in the 1870s. He donated 60,000 kilograms of copper to make the Statue of Liberty. He lost his fortune in 1889 with a failed attempt to control the copper market. The Amalgamated Copper Company between 1899 to 1915 was a holding company that managed the American copper industry (starting with a massive copper mining operation near Butte, Montana). The price of copper fluctuated with changing supplies and demand as other large copper mining operations came online. Amalgamated later became the Anaconda Copper Mining Company in 1915. Post WW2, the price of copper tends to follow the price of crude oil in the commodities market. Today’s copper market is also largely influenced by the demand for copper for electric automobile and alternative energy markets. |
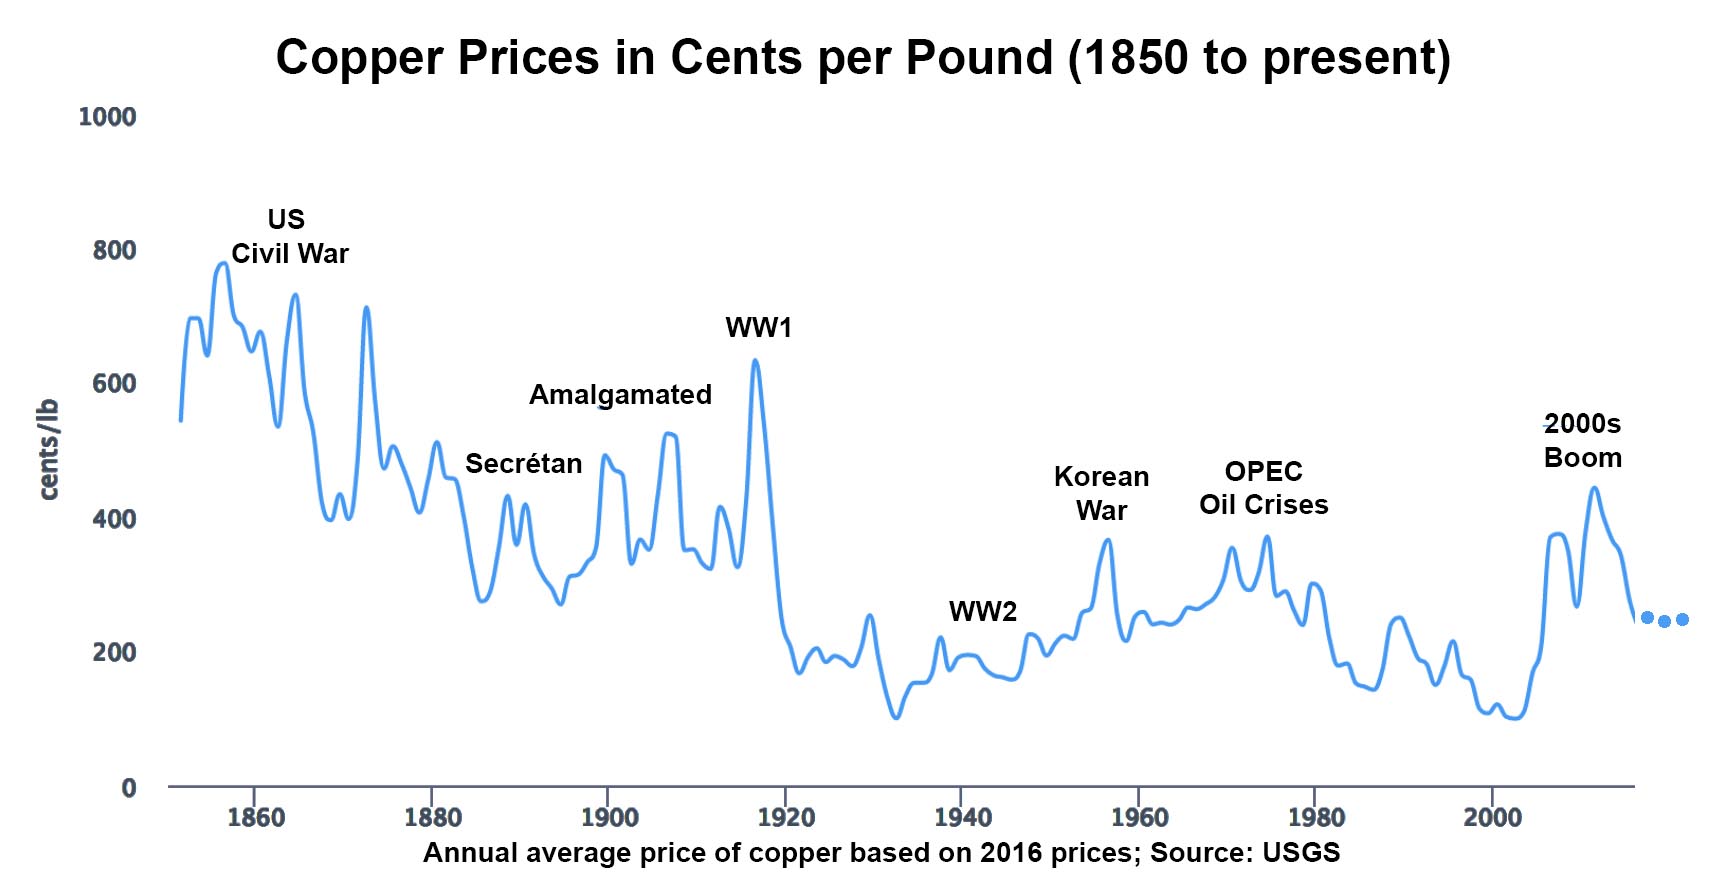 Fig. 2. Chart showing how the price of copper has fluctuated since 1850 as a result of supply and demand for copper has changed over time. The price increased when demands for copper went up, but fell when the supply of copper from new sources increased or the demand fell. Large copper resource discoveries have produced numerous "boom to bust" copper minings communities in the United States. |
Critical MineralsCongress passed the Energy Act of 2020. This Federal law is intended to provide direction for various government agencies to evaluate the supply and demand of natural resources including "critical minerals" (Figure 3). A “critical mineral” is defined as "a non-fuel mineral or mineral material essential to the economic or national security of the U.S. and which has a supply chain vulnerable to disruption. Critical minerals [mostly metals extracted from natural minerals] are also characterized as serving an essential function in the manufacturing of a product, the absence of which would have significant consequences for the economy or national security." (USGS(31)) |
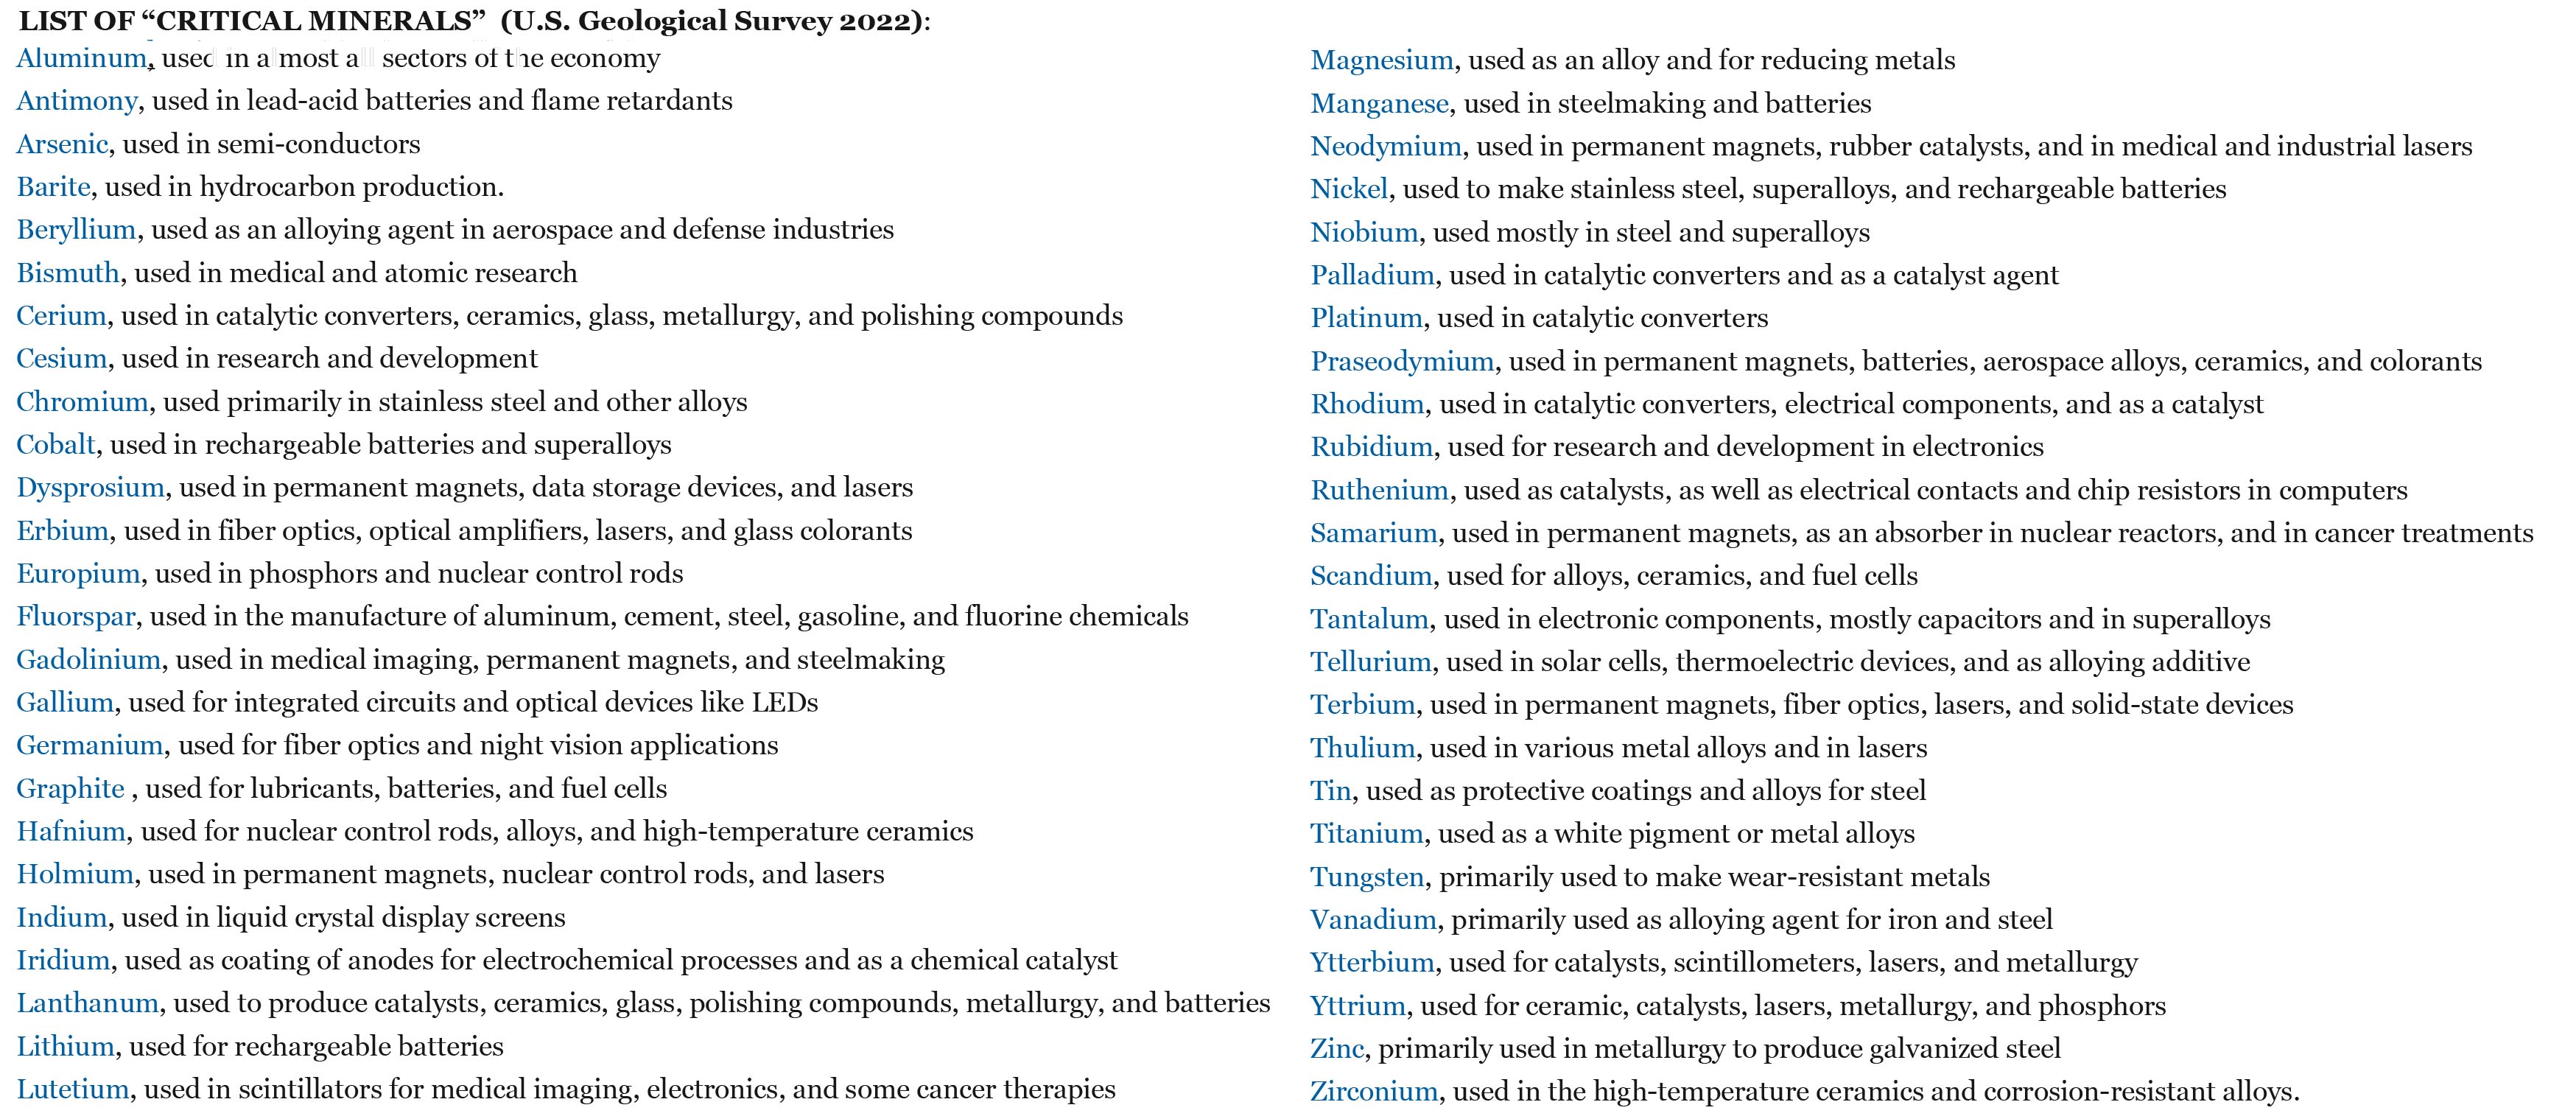 Fig. 3. Critical Minerals (reported by USGS, 2022) |
Raw Materials Produced In the United StatesRaw materials include agriculture and forestry products, non-fuel minerals (including construction materials, industrial minerals, metals [including recycled metals] and non-renewable organics (oil & gas, coal, and their derivatives).The availability of raw materials is closely monitored by many Federal and State government agencies and associations affiliated with corporate interests. Figure 4 is a chart listing U.S. raw materials by various categories.(3) Figure 5 shows the amount of raw materials put into use annually over time (1900 through 2015) as long as records have been collected in the United States.(3) |
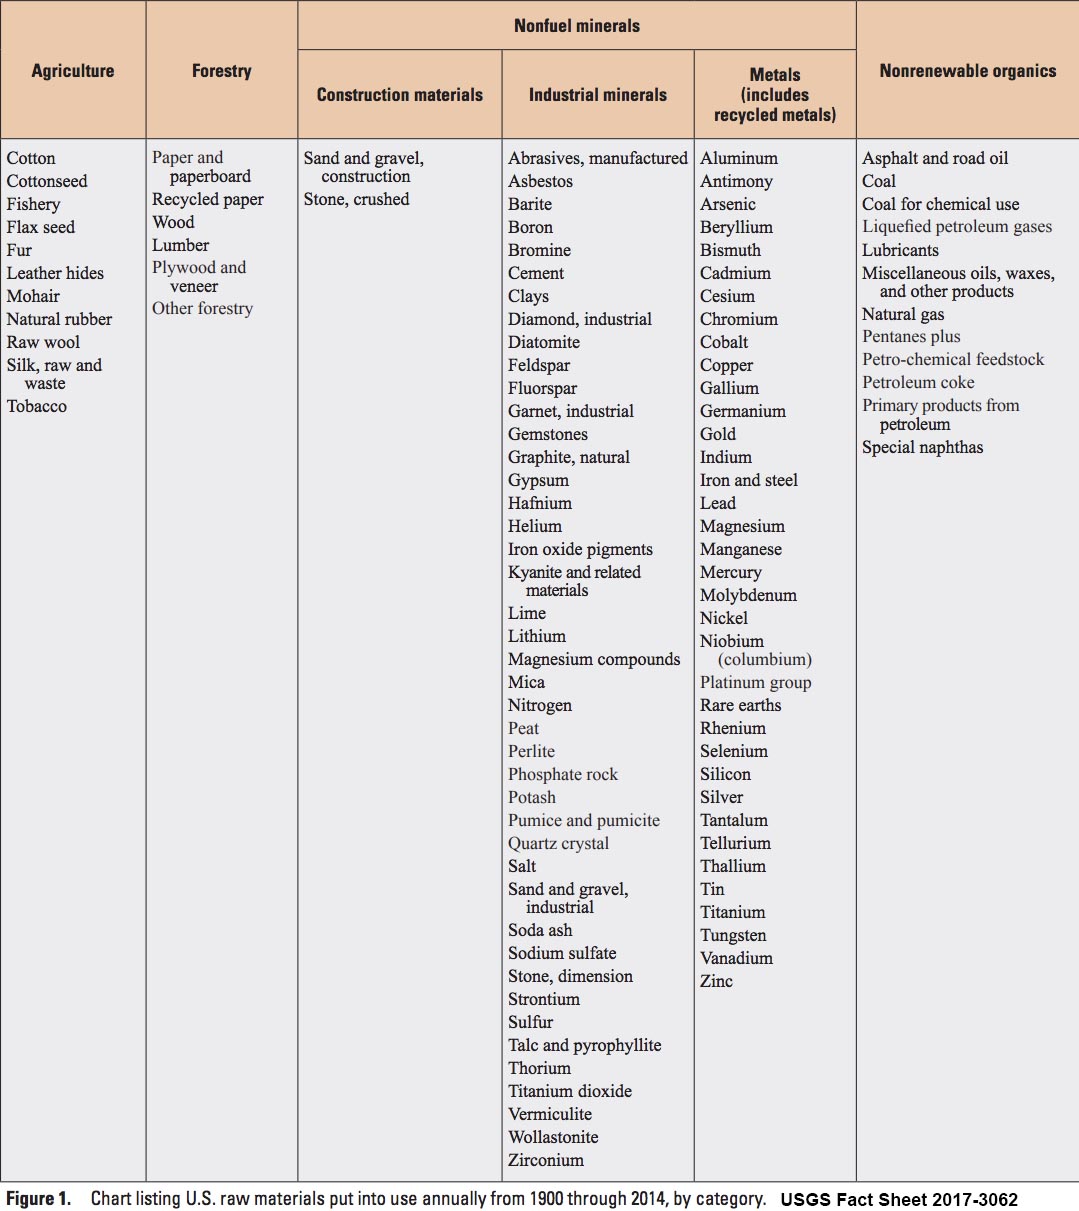 Fig. 4. Chart listing U.S. raw materials (by category).(3) |
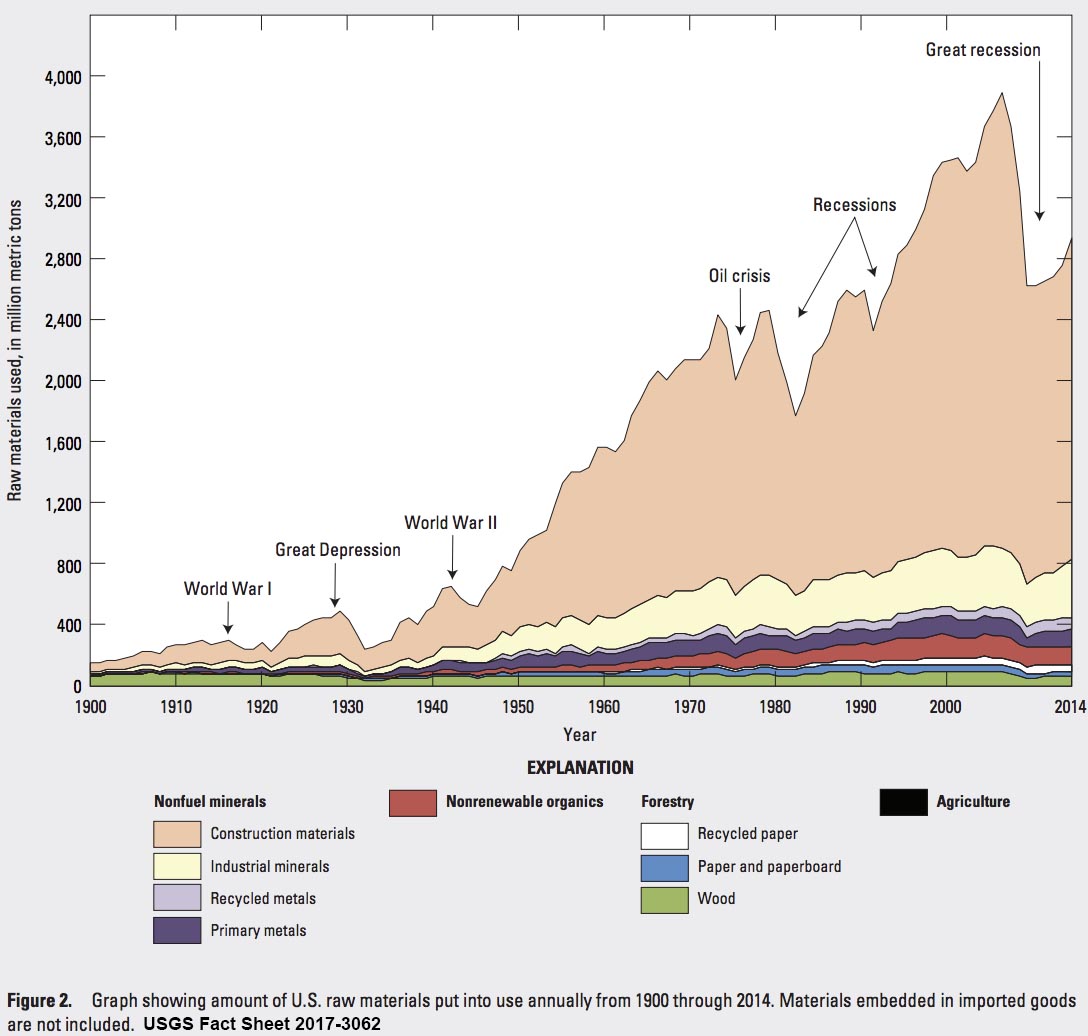 Fig. 5. Amount of U.S. raw materials put into use annually form 1900 through 2015.(3) Fig. 5. Amount of U.S. raw materials put into use annually form 1900 through 2015.(3) |
Energy ConsumptionIn 2019, U.S. Energy Information Administration projected that the world energy consumption will grow by nearly 50% by the year 2050, led by the greatest growth in demand in Asia.(4) The demands for production and consumption are partly determined by the ebb and flow of the global economy. For instance, the CoVid19 pandemic and political posturing has had a significant influence on global supply and demand of natural resources.Non-Renewable Energy materials consumed by US citizens in 2021:(1)
|
Figure 6 shows the projected rate of global energy consumption projected into the future to 2050.(5) |
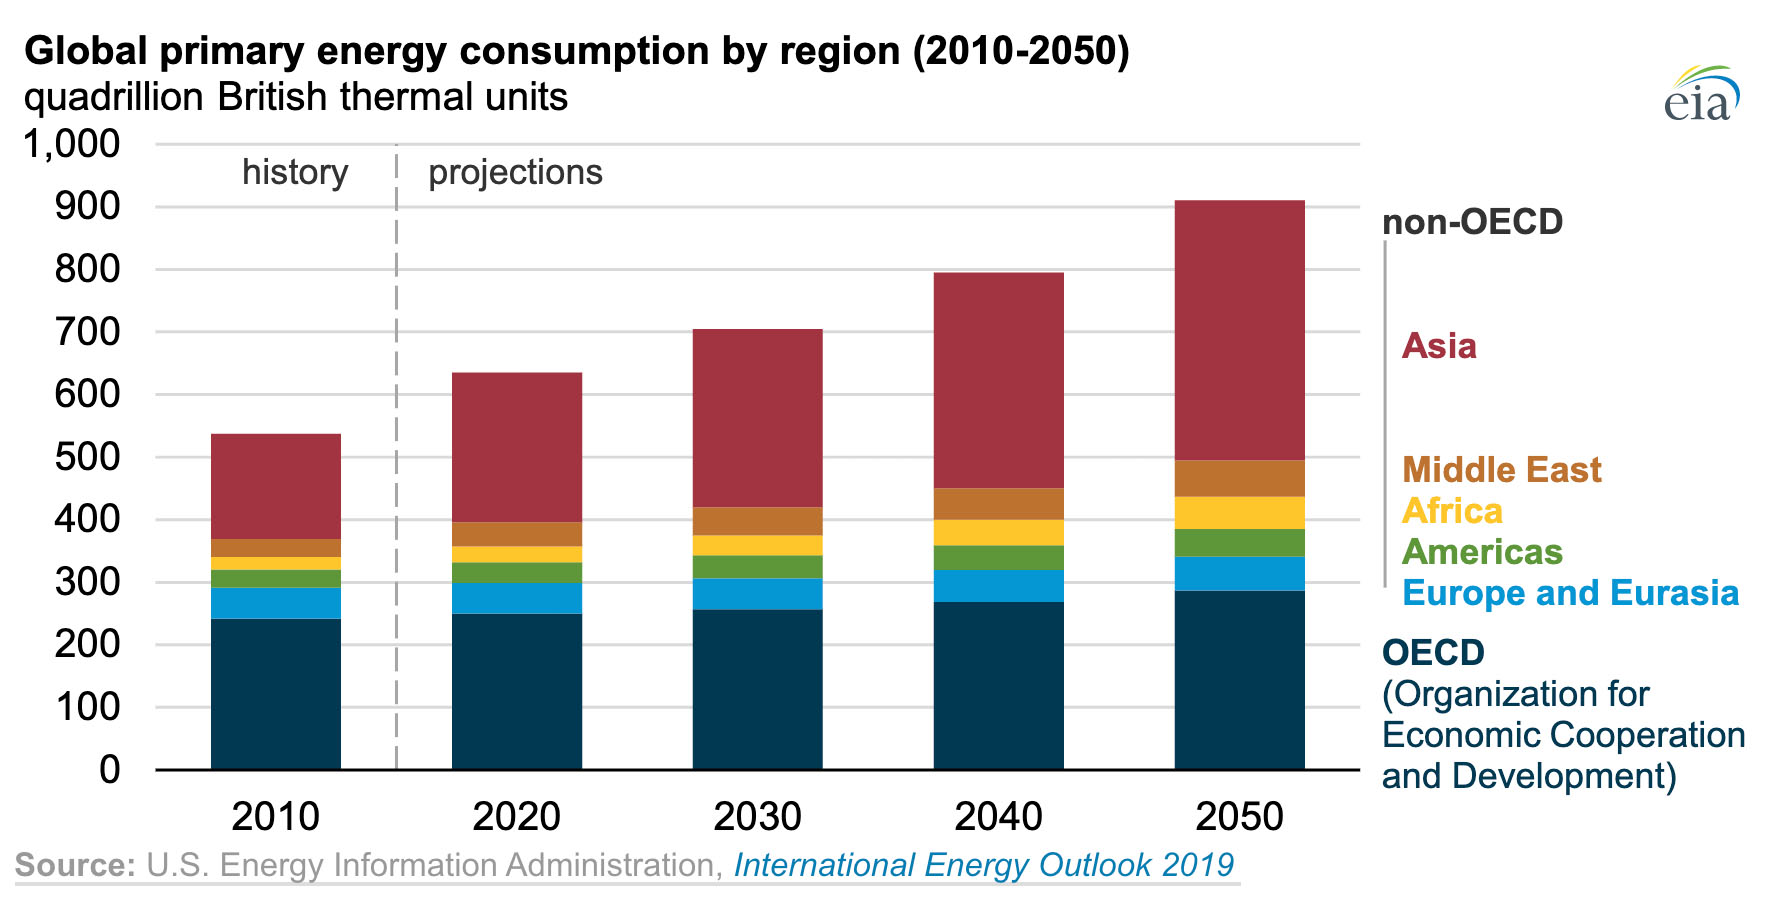 Fig. 6. Global energy consumption by region (2021-2050). |
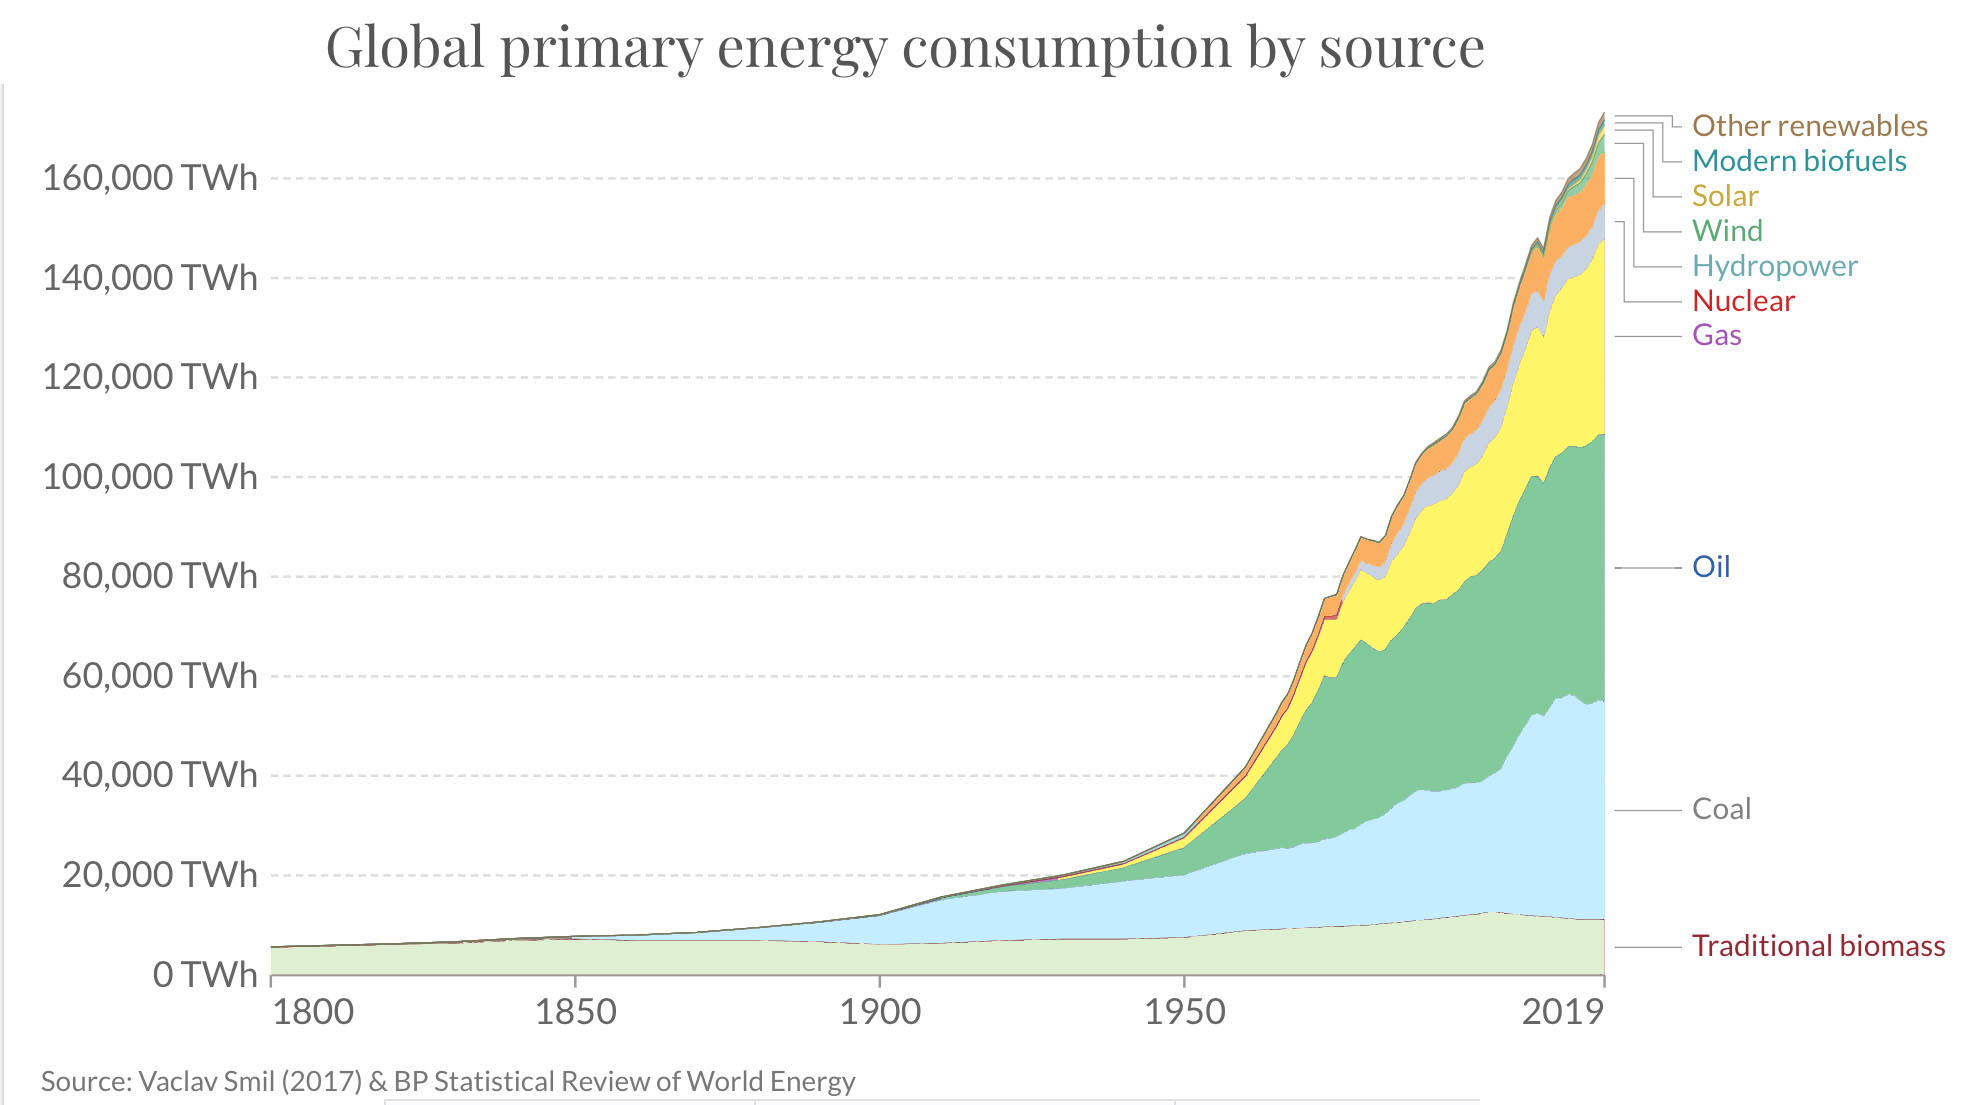 Fig. 7 Global energy consumption by source (1800-2020). |
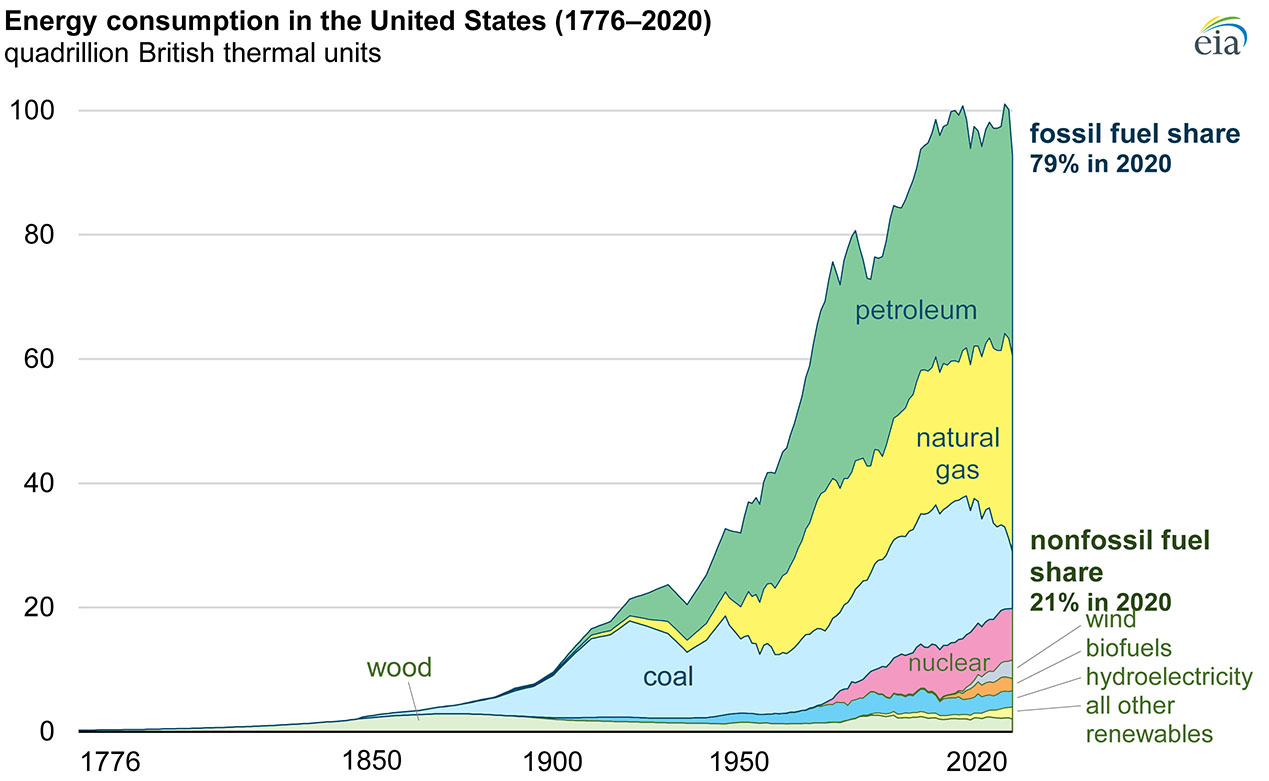 Fig. 8. US energy consumption by source, 1776 to 2020. |
Non-Renewable Fossil Fuel Energy ResourcesA fossil fuel, such as coal, oil or gas, is a natural resource formed in the past from the remains of living organisms (microbes, plants, and animals). Organic matter undergoes a form of metamorphism called organic maturation that involving organic chemical changes that occur with burial, increasing heat and pressure, and cumulative effects over geologic time (measured in millions of years) (Figure 9). This converts organic remains of microbes, plants, and animals into increasing stages of petroleum, gas, and coal varieties. Over time, oil and gas is gradually released from its source rocks (organic rich sediments) and can be trapped in underground natural reservoirs that can be tapped and developed into oil & gas fields. |
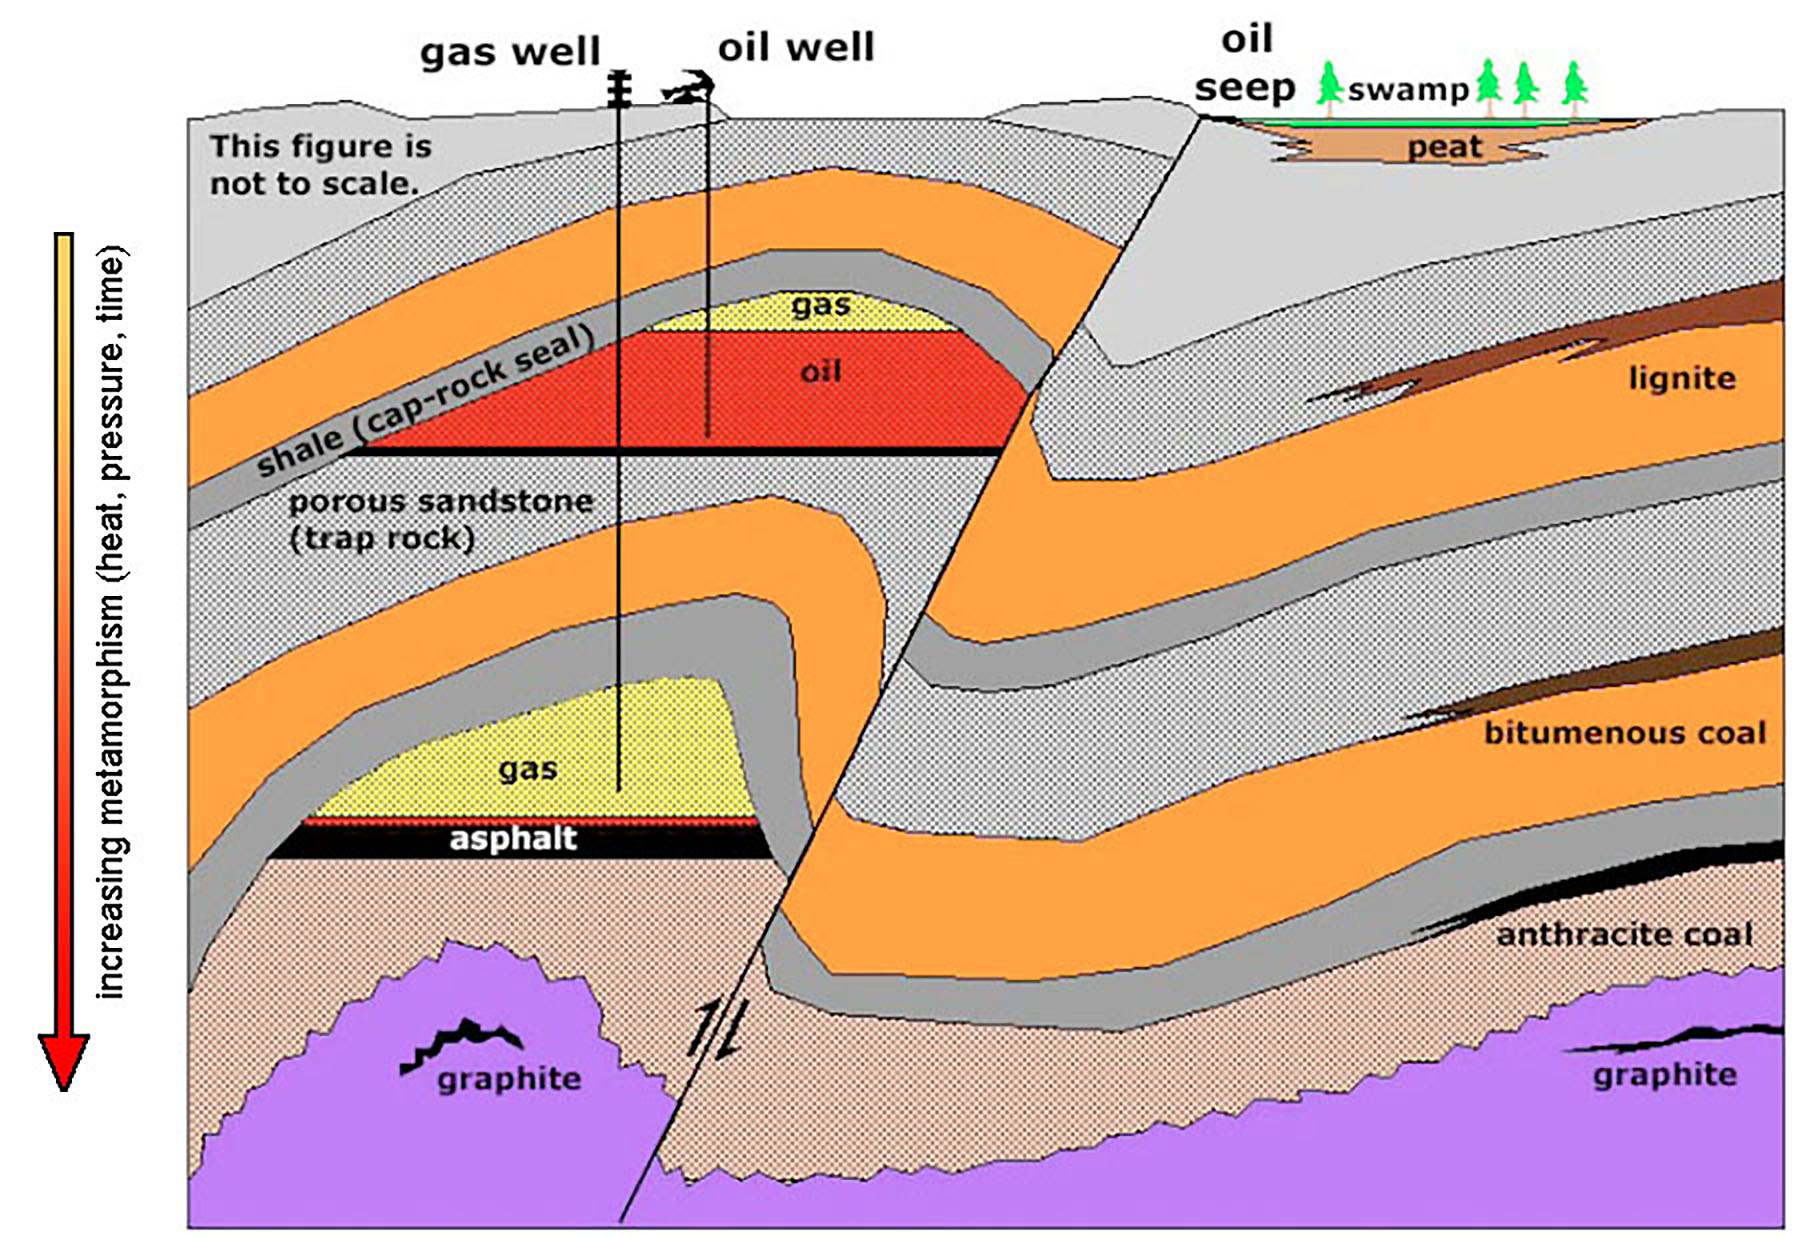 Fig. 9. Organic maturation converts organic remains into fossil fuels. |
Oil & Gas In 2020, the United States dominated the world in crude oil production and consumption.(7) |
Figure 10 shows an aging oil field in the southern Central Valley of California. |
 Fig. 10. Lost Hills Oil Field near Bakersfield, California. |
 Fig. 11. Offshore drilling platforms off the coast of Santa Barbara, California |
 Fig. 102 Map showing oil & gas production regions (sedimentary basins) in the United States.(9) |
The USGS Energy Resources Program conducts periodic assessments of the nation's oil and natural gas reserves and resources. |
CoalChina, Indonesia, and India are the largest coal producing countries. Coal was a primary source of energy in the United States until the 1950s when the country began its love affair with increasingly inexpensive gasoline, and oil and gas pipelines where constructed to connect oil fields, ports with refineries nearby, to major cities across the United States. The amount of coal being mined and consumed in the country is diminishing as the country is migrating away from coal power plants to cleaner alternative sources. However, it still remains the 3rd largest source of energy consumed in the country. Figure 13 is a map of the location and types of coal produced in the United States.(11) Figure 14 illustrates one of the largest coal mining operations in Wyoming—the state that produces the most coal in the country.Click here to see Coal Explained: U.S. Energy Information Administration website(10). |
 Fig. 13. Map showing the location and the type of coal produced in different regions in the United States.(11) |
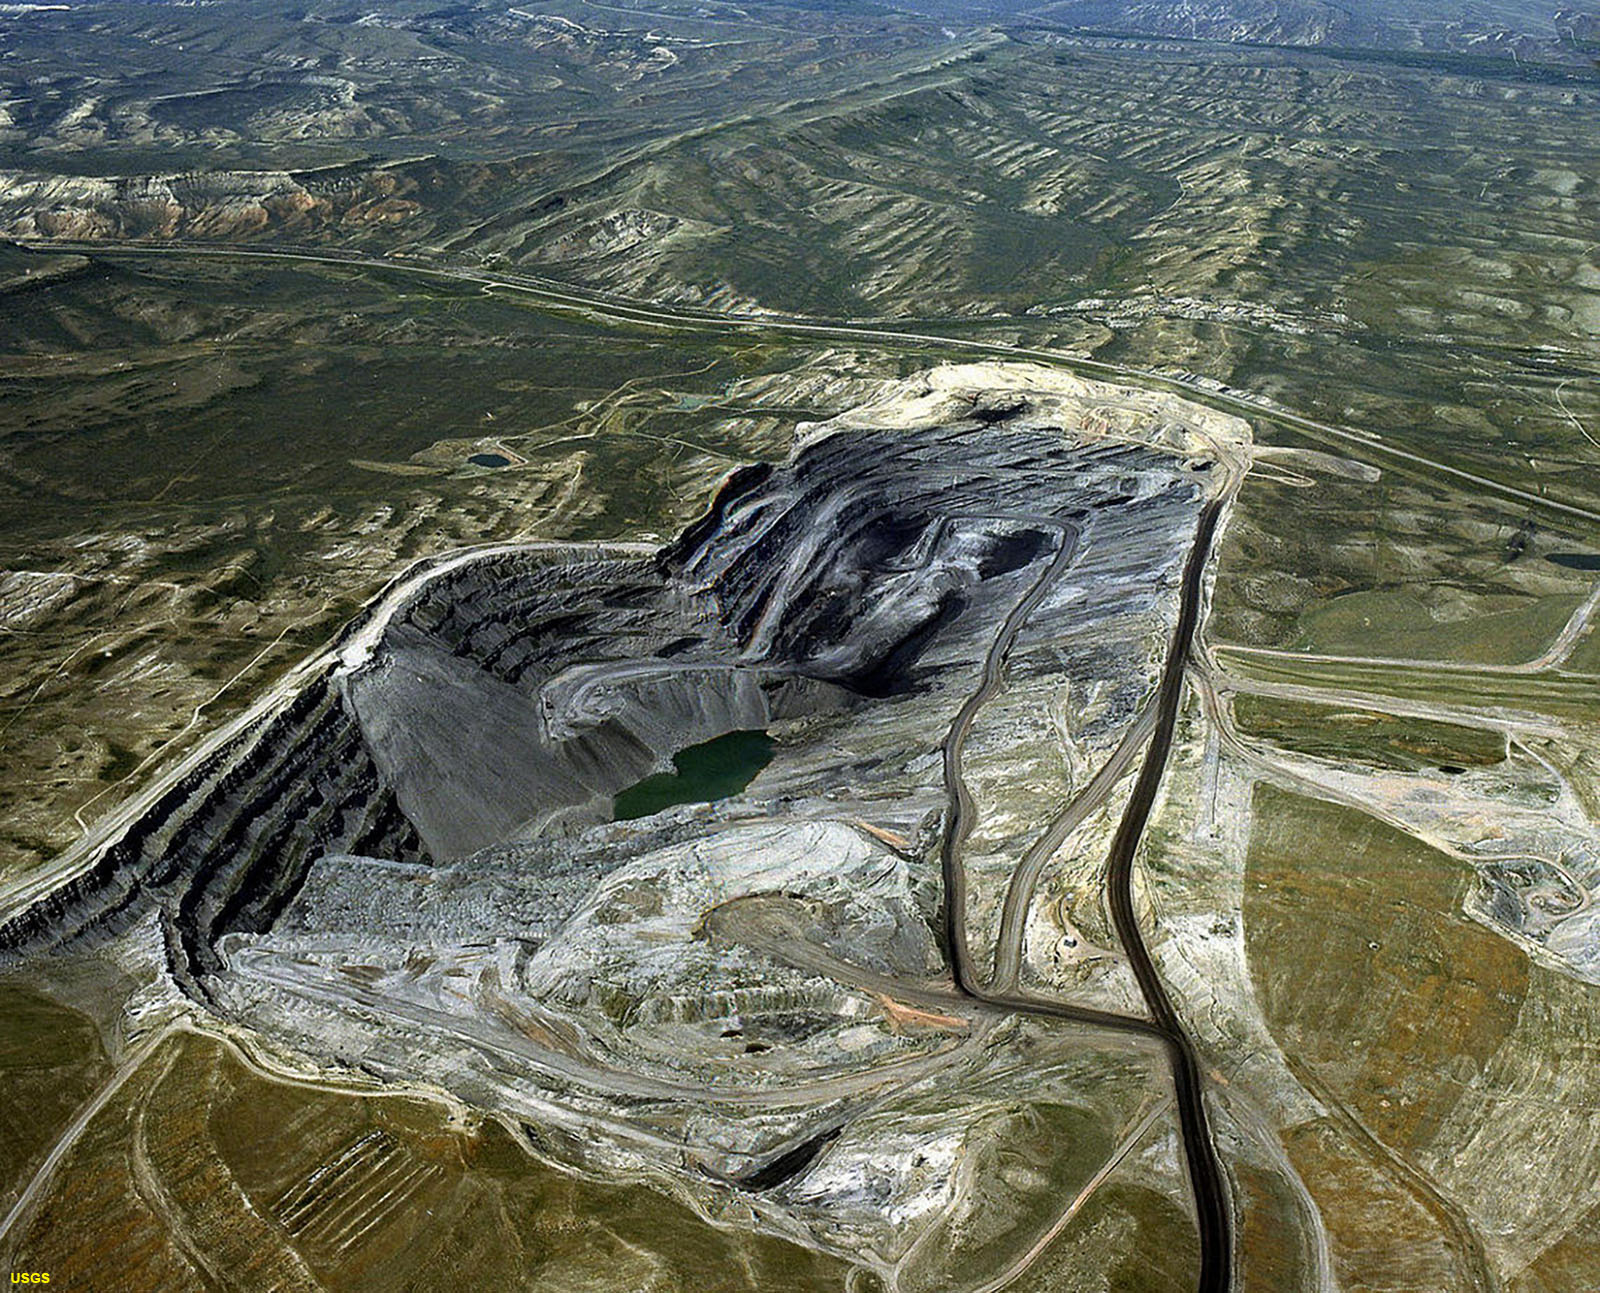 Fig. 14. Aerial photograph of an active coal mine in the Powder River Basin of Wyoming. |
Alternative and Renewable Energy (non-fossil fuel energy) |
GeothermalGeothermal energy is heat trapped or stored within the earth. Geothermal energy comes from the earth's interior, migrating slowly toward the surface. Geothermal energy is considered renewable (as long as the underground heat reservoir is able to conduct heat convert water to steam to generate electricity). Geothermal heat is also used to heat buildings, and provide hot water for bathing. Figure 15 is a geothermal resources map of the United States.(12) The United States leads the world in utilizing geothermal energy, with more that 70% being produced in California. Figure 16 shows an active geothermal plant located at the south end of the Salton Sea.Click here to see Geothermal basics: U.S. Energy Information Administration website.(13) |
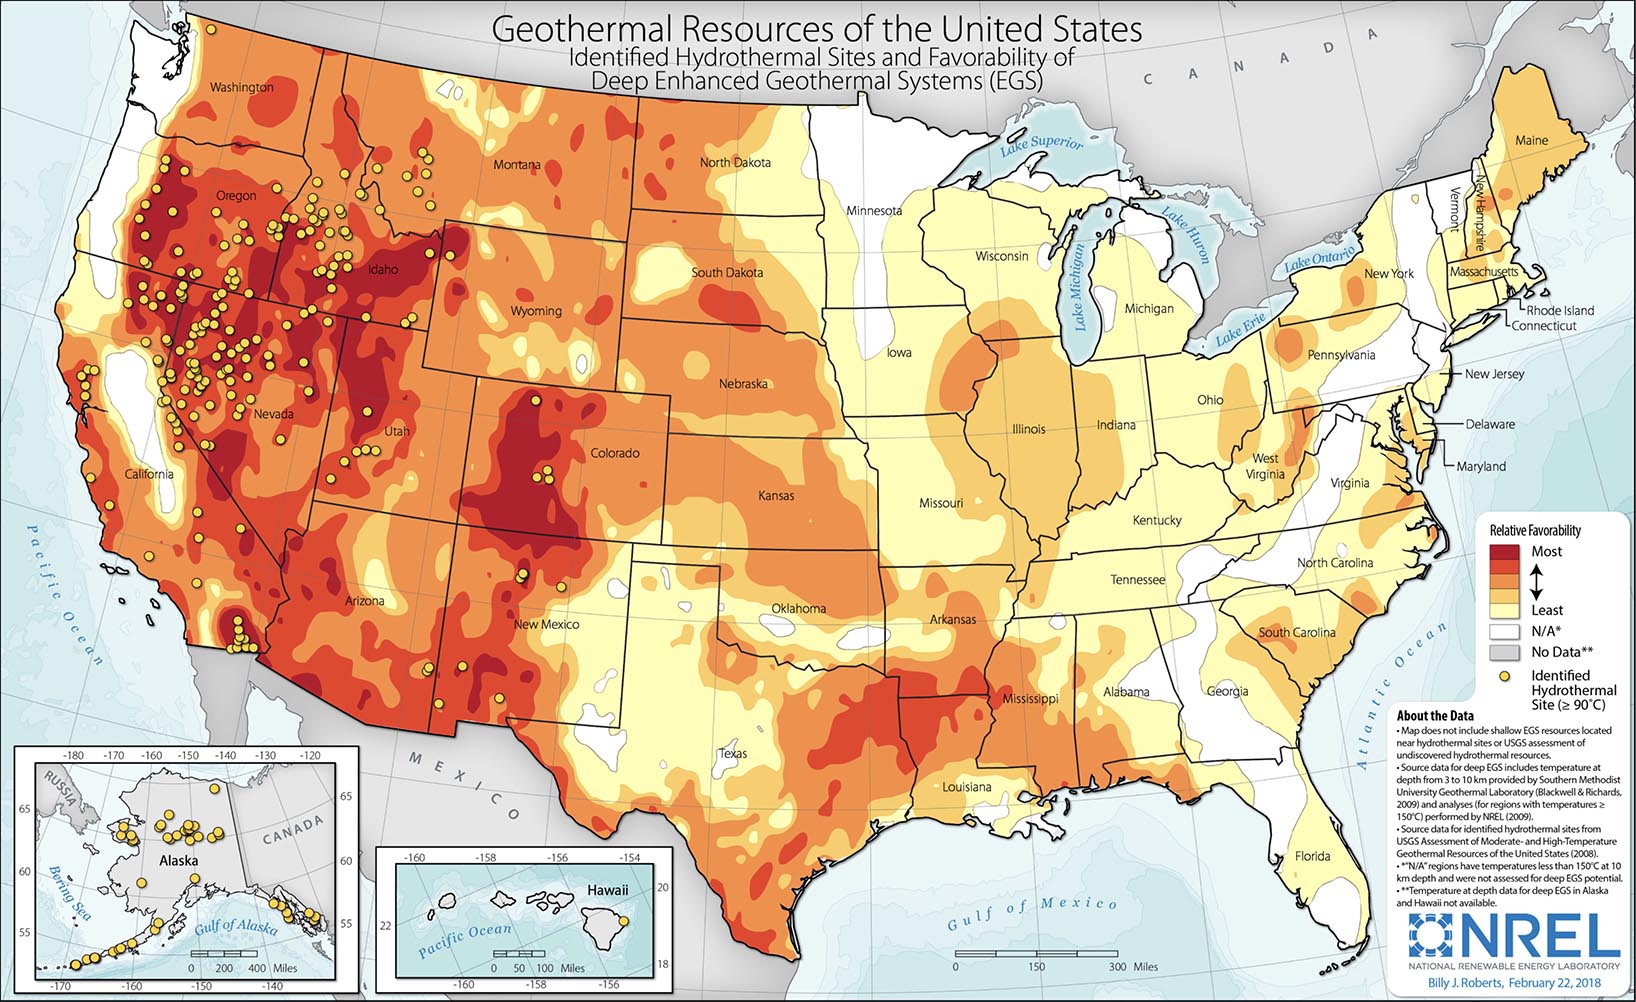 Fig. 15. Map showing potential geothermal energy production regions in the United States.(12) |
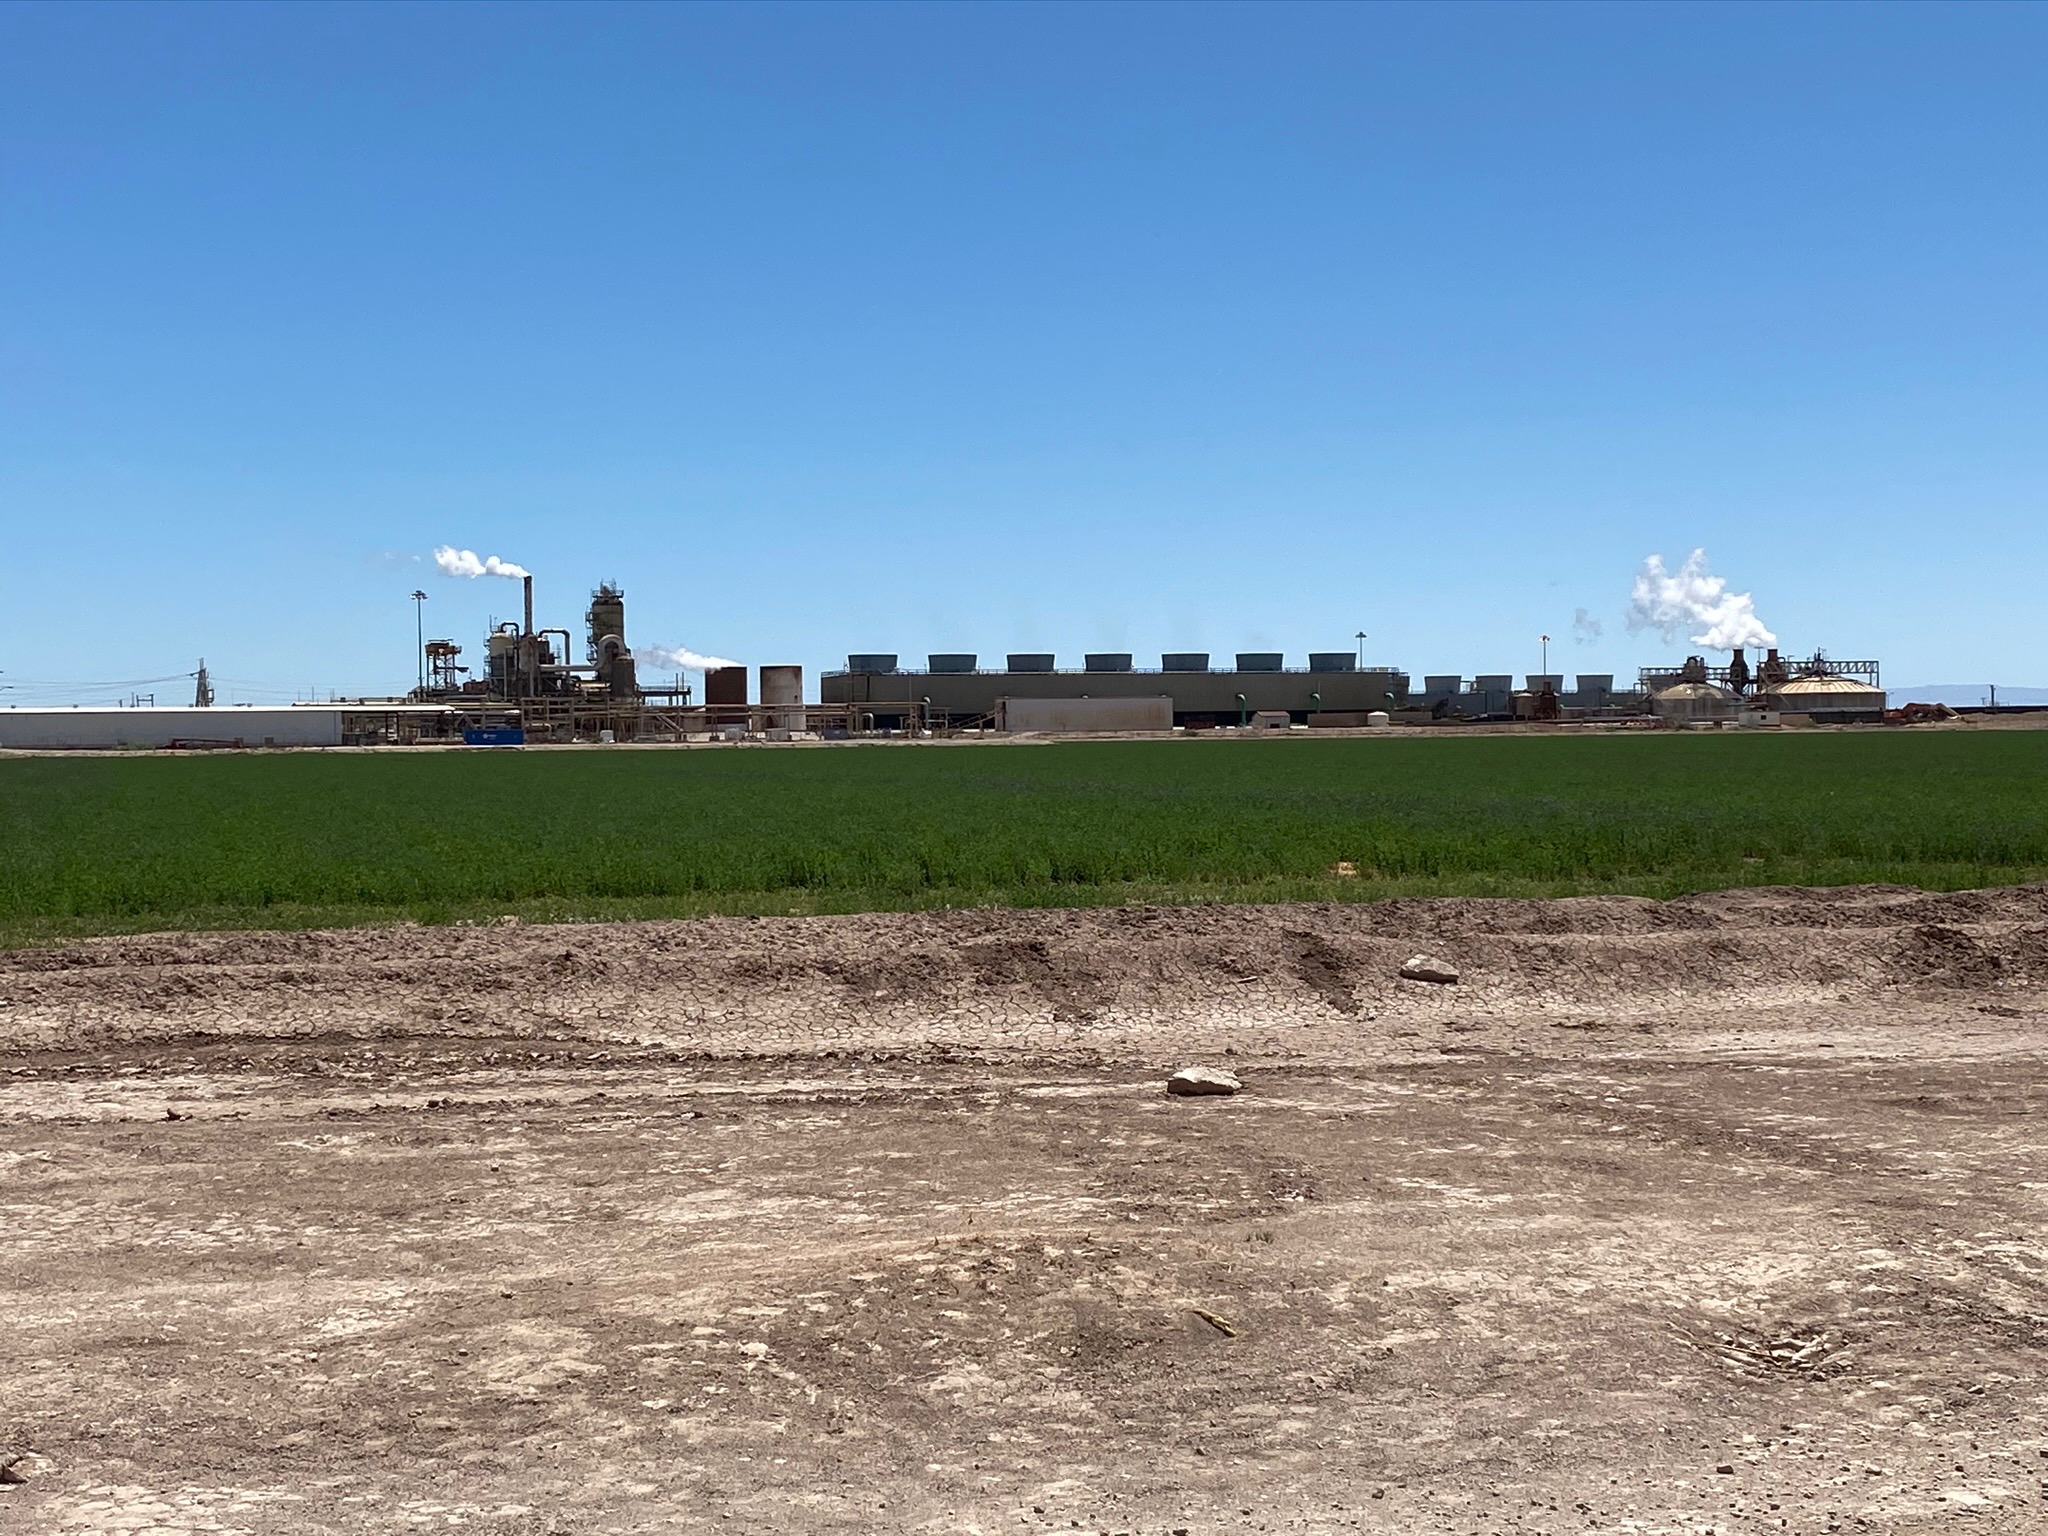 Fig. 16. A geothermal energy plant near the Salton Sea, Southern California. |
Wind PowerWind power is the energy captured in moving air caused by the uneven heating of the earth's surface from the sun. The earth's surface consists of different types of land and water, and it absorbs the sun's energy at different rates. Figure 17 is a map of the conterminous United States showing average annual wind speed at a level 80 meters about the surface.(14) Wind power is used to generate electricity using wind turbines (Figure 18). Traditionally, wind power has been used to pump well water to the surface.Click here to see Wind Explained: U.S. Energy Information Administration website.(15) Click here to see more wind power information on the WINDExchange: U.S. Department of Energy website.(16) |
 Fig. 17. Map of the United States showing average annual wind speed at 80 meters height.(14)
 |
Fig. 18. An active wind generation field near Ocotillo, east of San Diego, California. |
HydropowerHydropower has been used to mechanical energy for centuries before it became a source for electrical power generation. Nearly all major rivers in the United States have been dammed to generate electricity (and maintain flood control and water supplies). Hydroelectric power accounts for about 37% of the total of renewable electricity generation, but the total share of electricity produce by hydropower is decreasing.(17) This is partly due to environmental concerns, water loss due to evaporation, and the impact of seasonal and long-term drought on river systems and water supply, particularly in the western United States (Figure 19).Figure 20 is the 2020 National Hydropower Map showing hydroelectric generation dam sites in the United States.(18) Click here to see Hydropower explained: U.S. Energy Information Administration website.(17) |
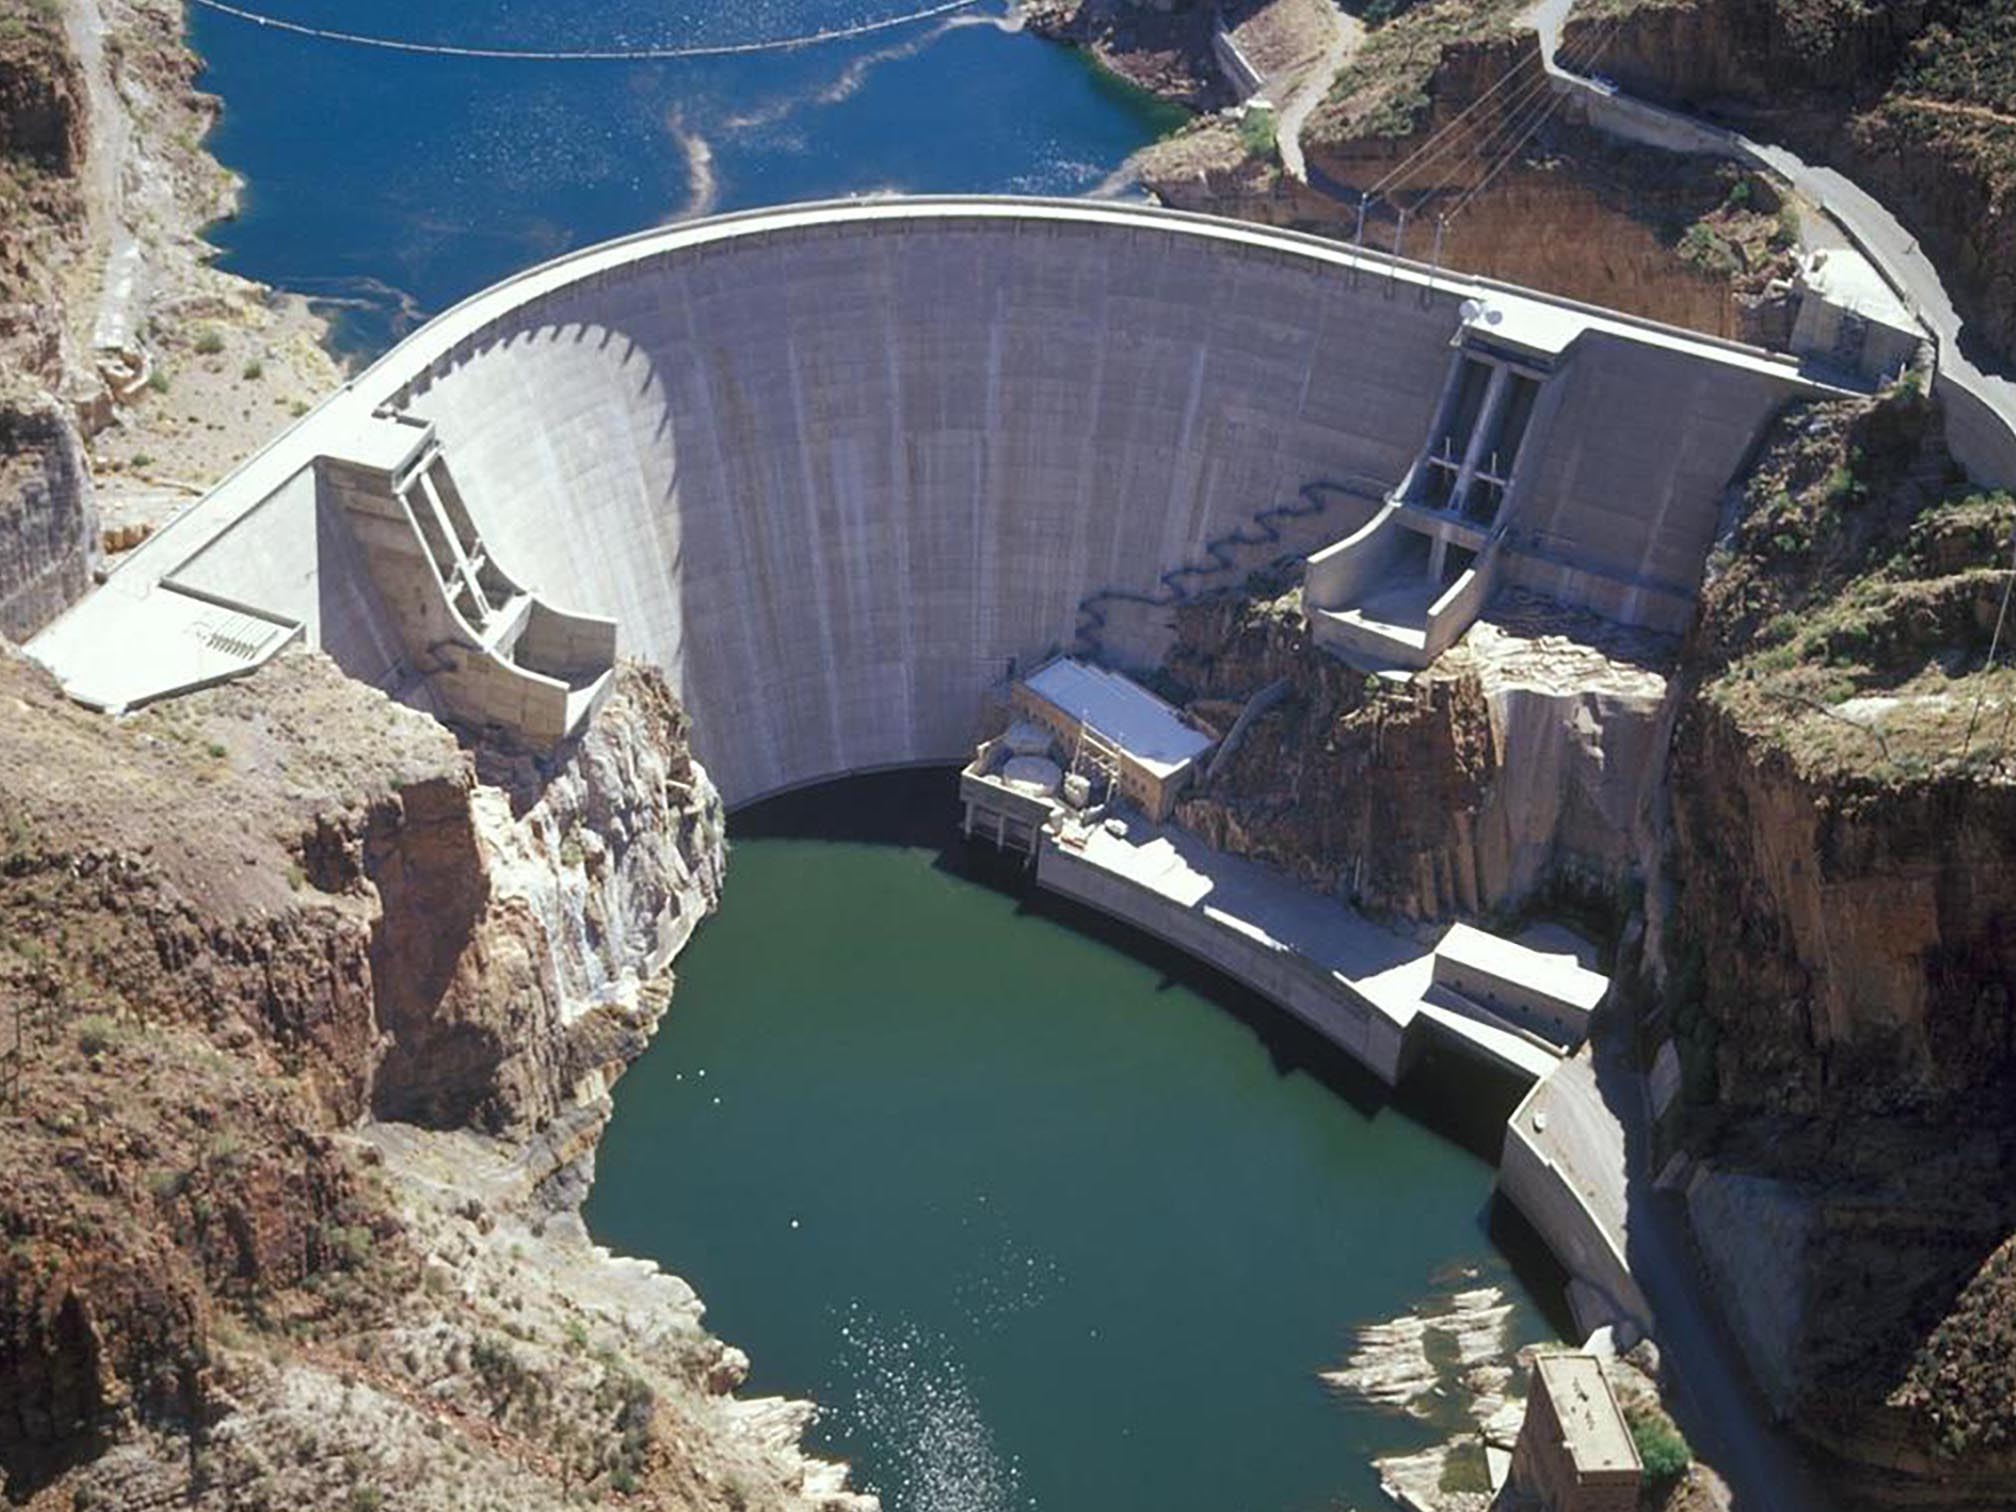 Fig. 19. Roosevelt Dam on the Salt River, a US Bureau of Reclamation high dam near Phoenix, Arizona. |
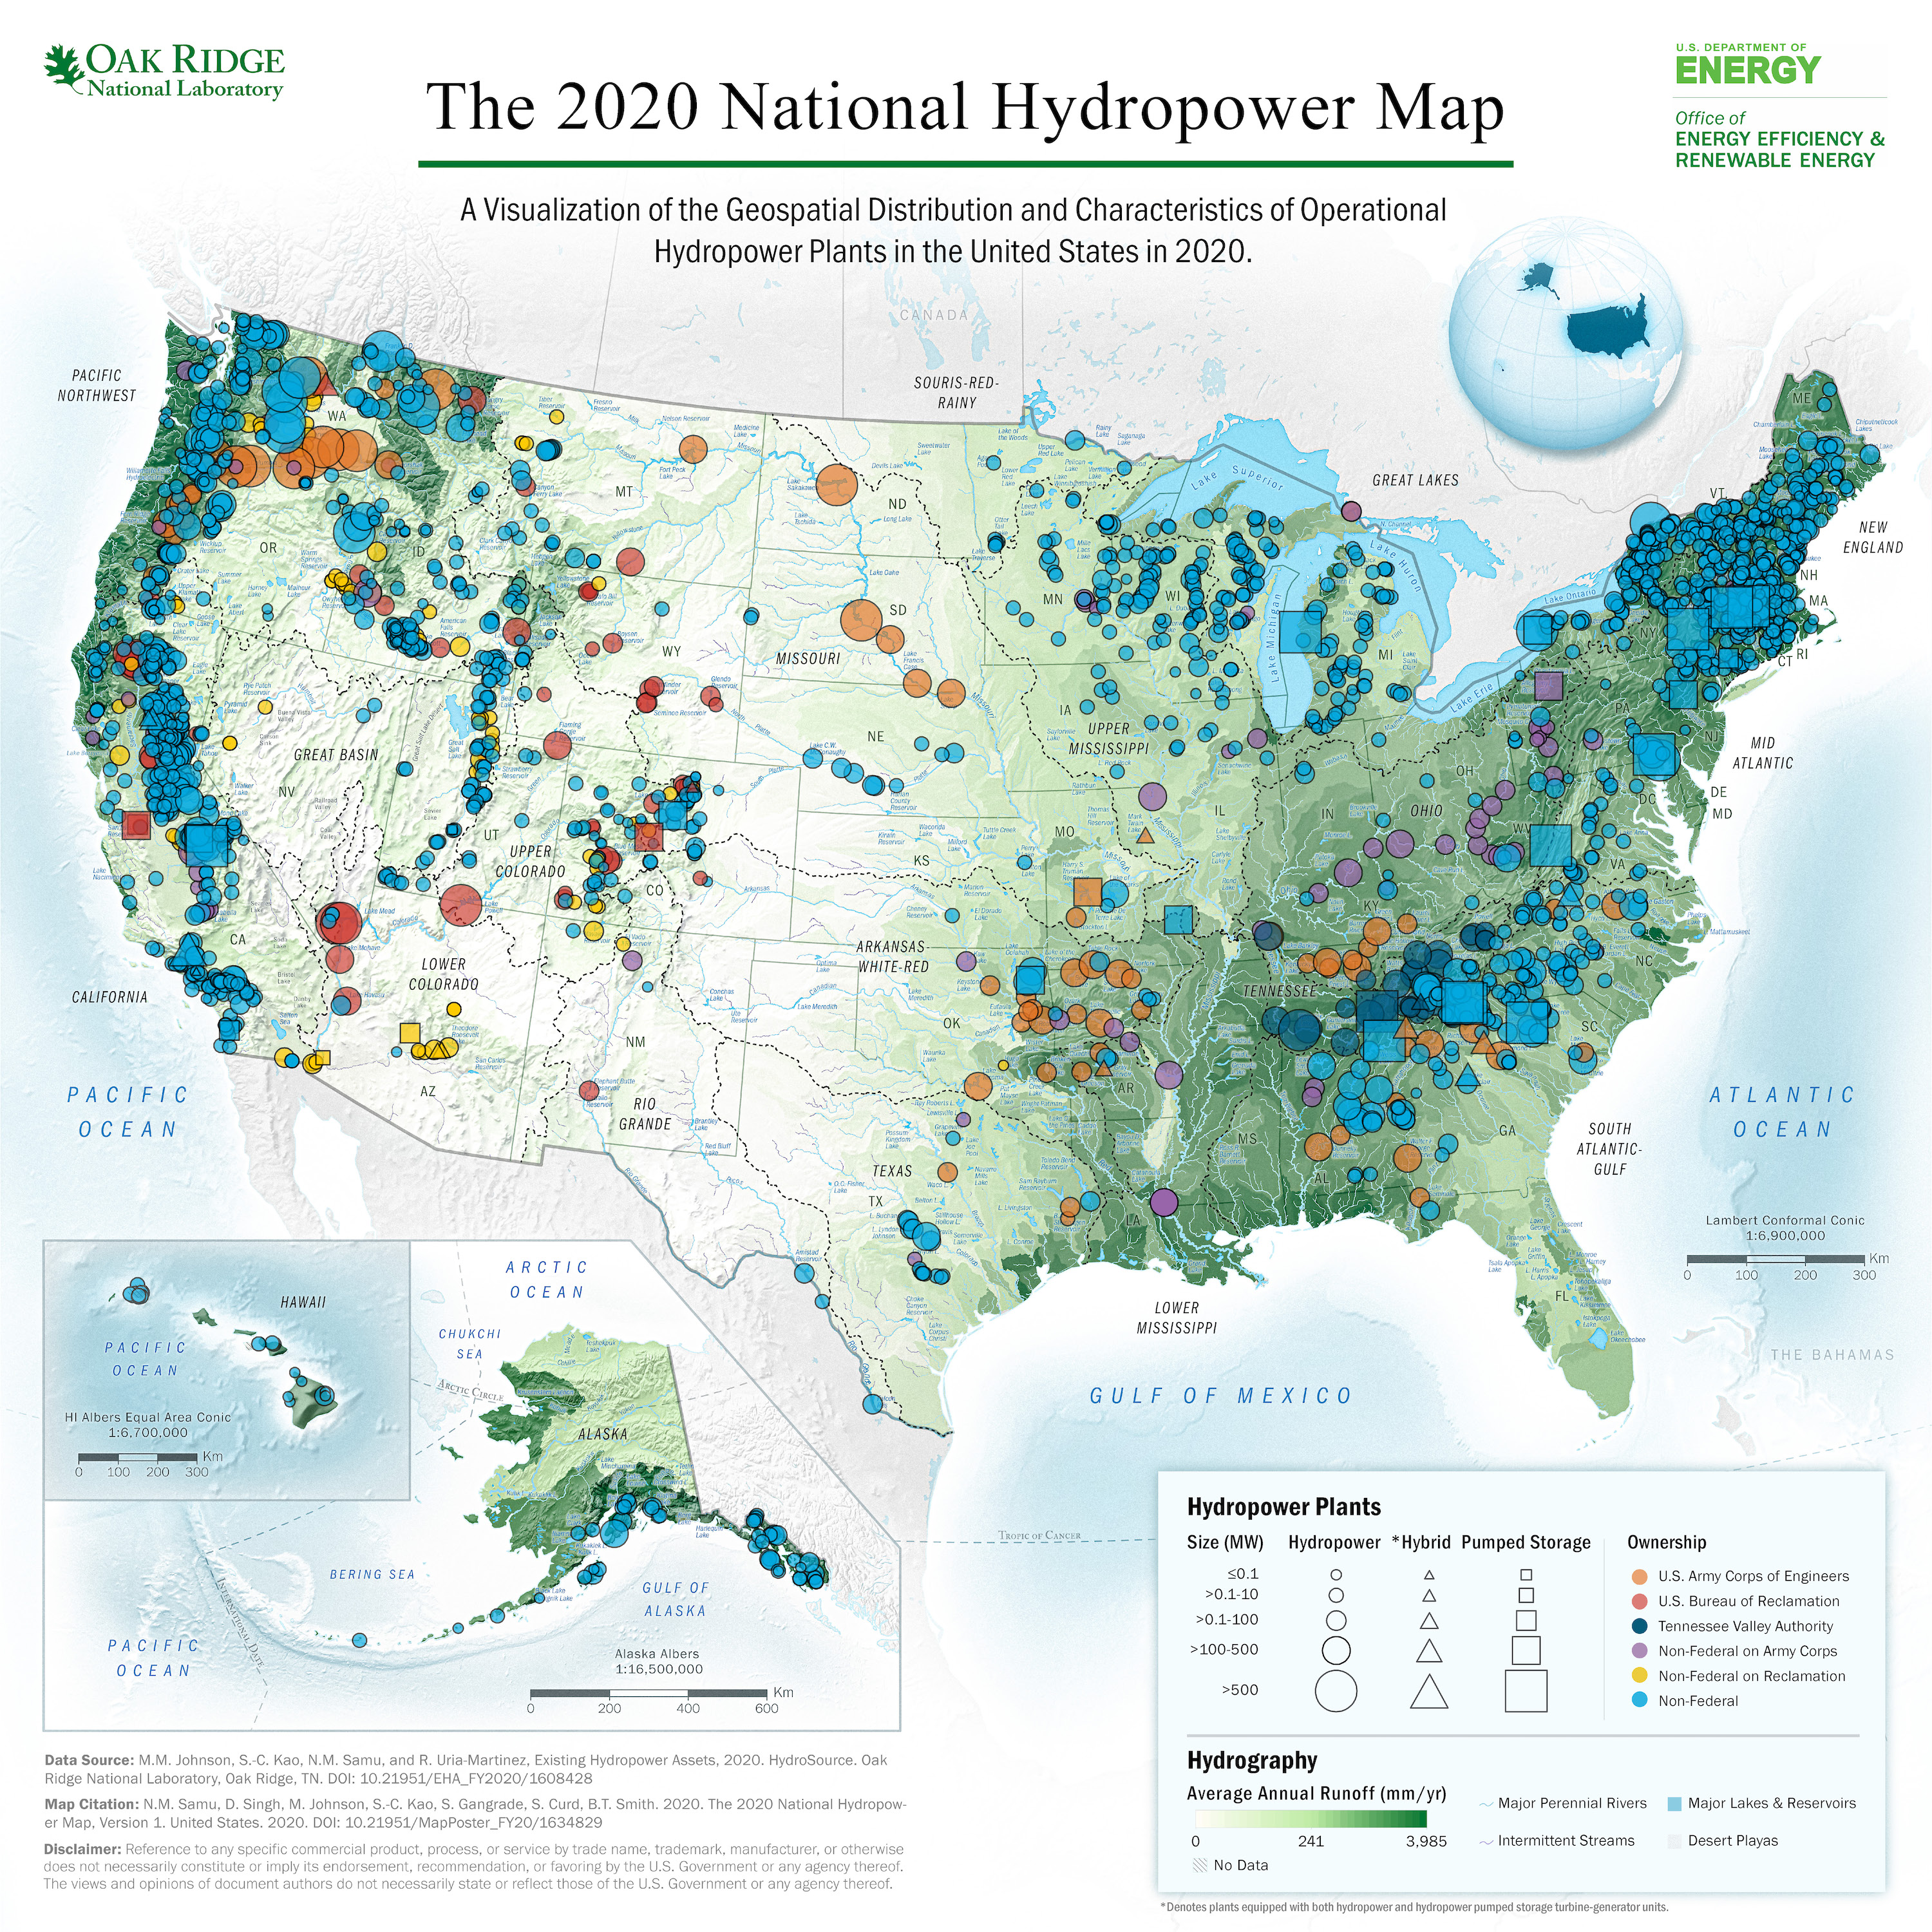 Fig. 20. US DOE national hydropower map of the United States, 2020(18) |
Biomass & BiofuelsBiomass & biofuels are organic materials that comes from plants and animals and is a renewable source of energy. Biofuel refers to any fuel derived from biomass, including, synthetic gases, ethanol and biodiesel fuels. Biomass energy accounts for about 5% of total primary energy use in the United States.(19) Figure 21 illustrates the variety of biofuel sources. Woody biomass are the trees and woody plants grown in a forest, woodland, or rangeland environment, that are the by-products of forest management. Figure 22 is an assessment map of U.S. National Forest Service land with resource potential for biomass energy development.(20) Click here to see Biomass explained: U.S. Energy Information Administration website.(19) |
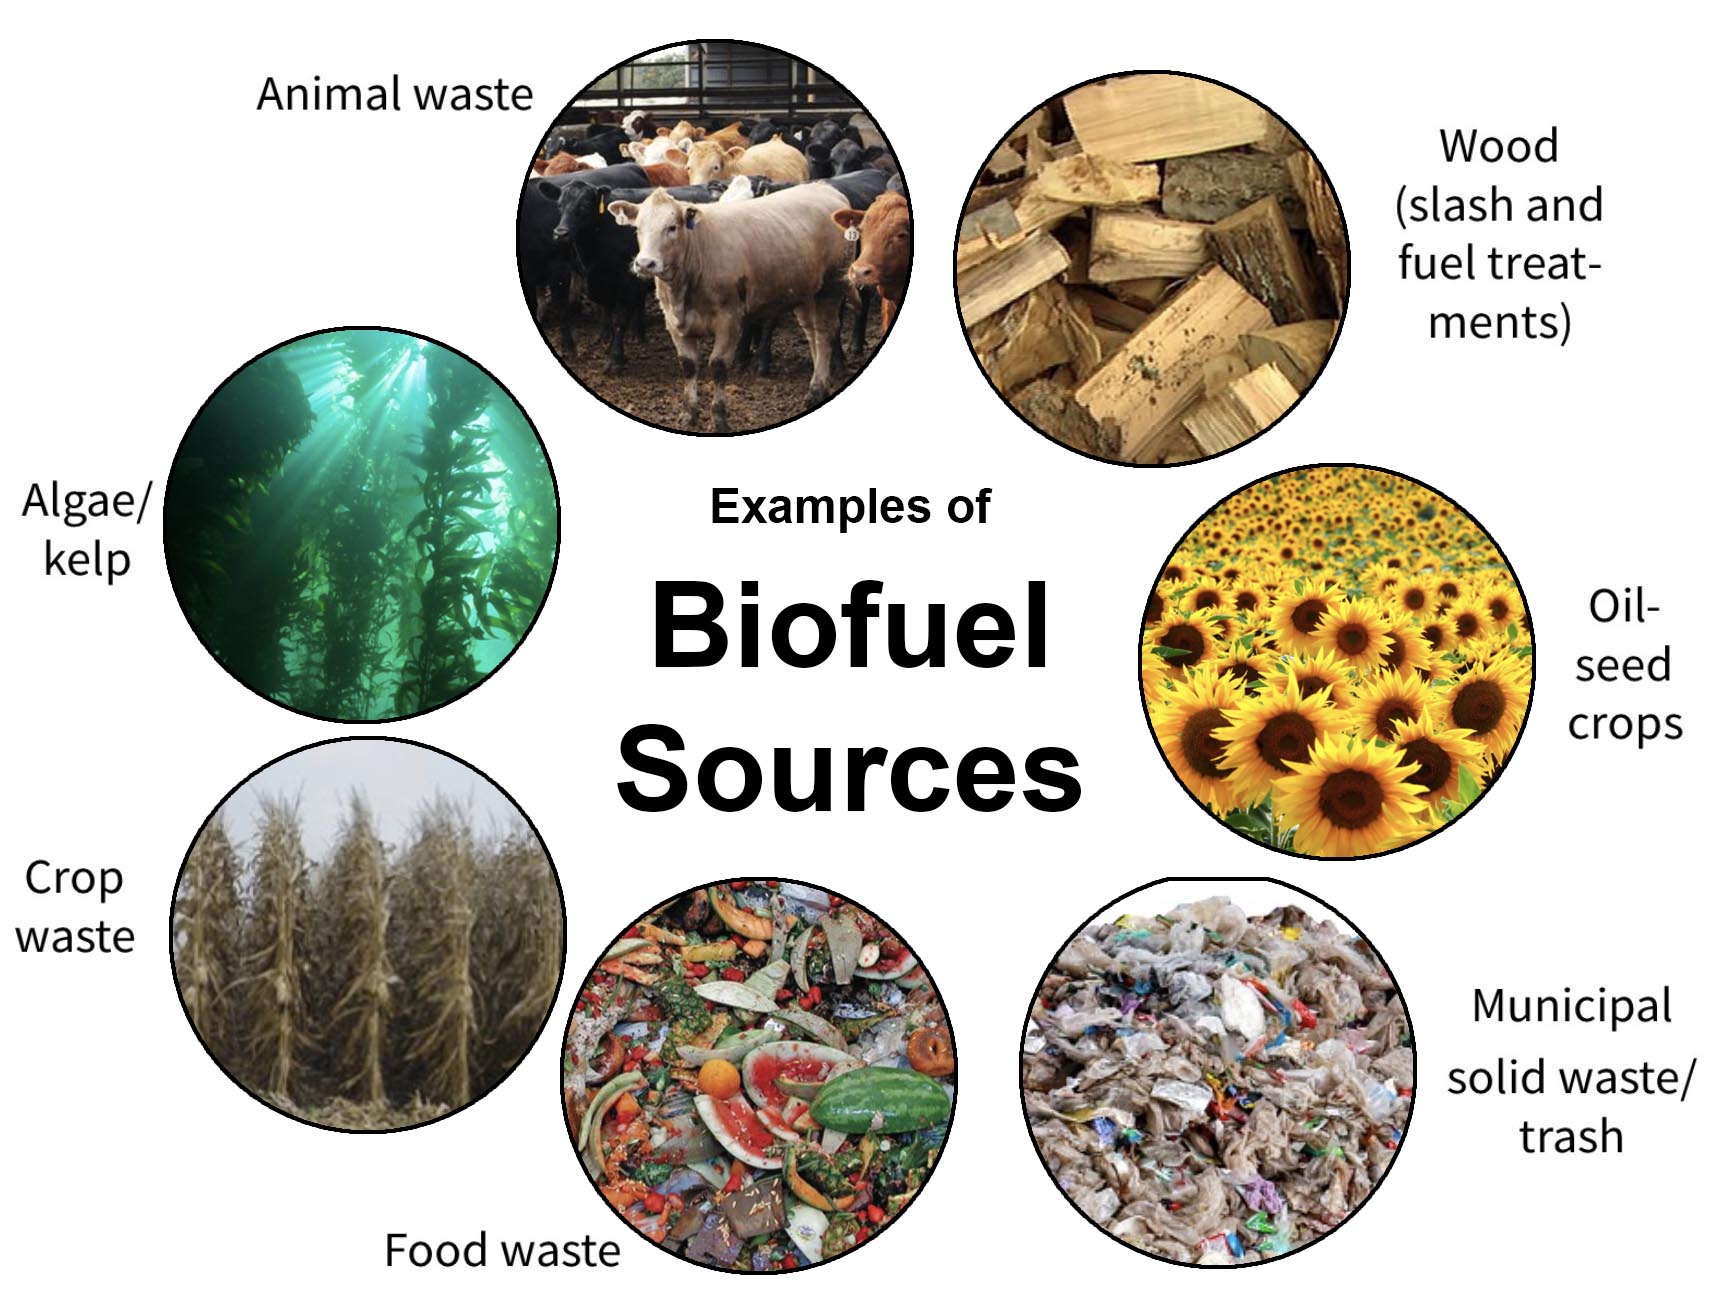 Fig. 21. Diagram illustrating examples of different renewable biomass sources that can be converted into biofuels. |
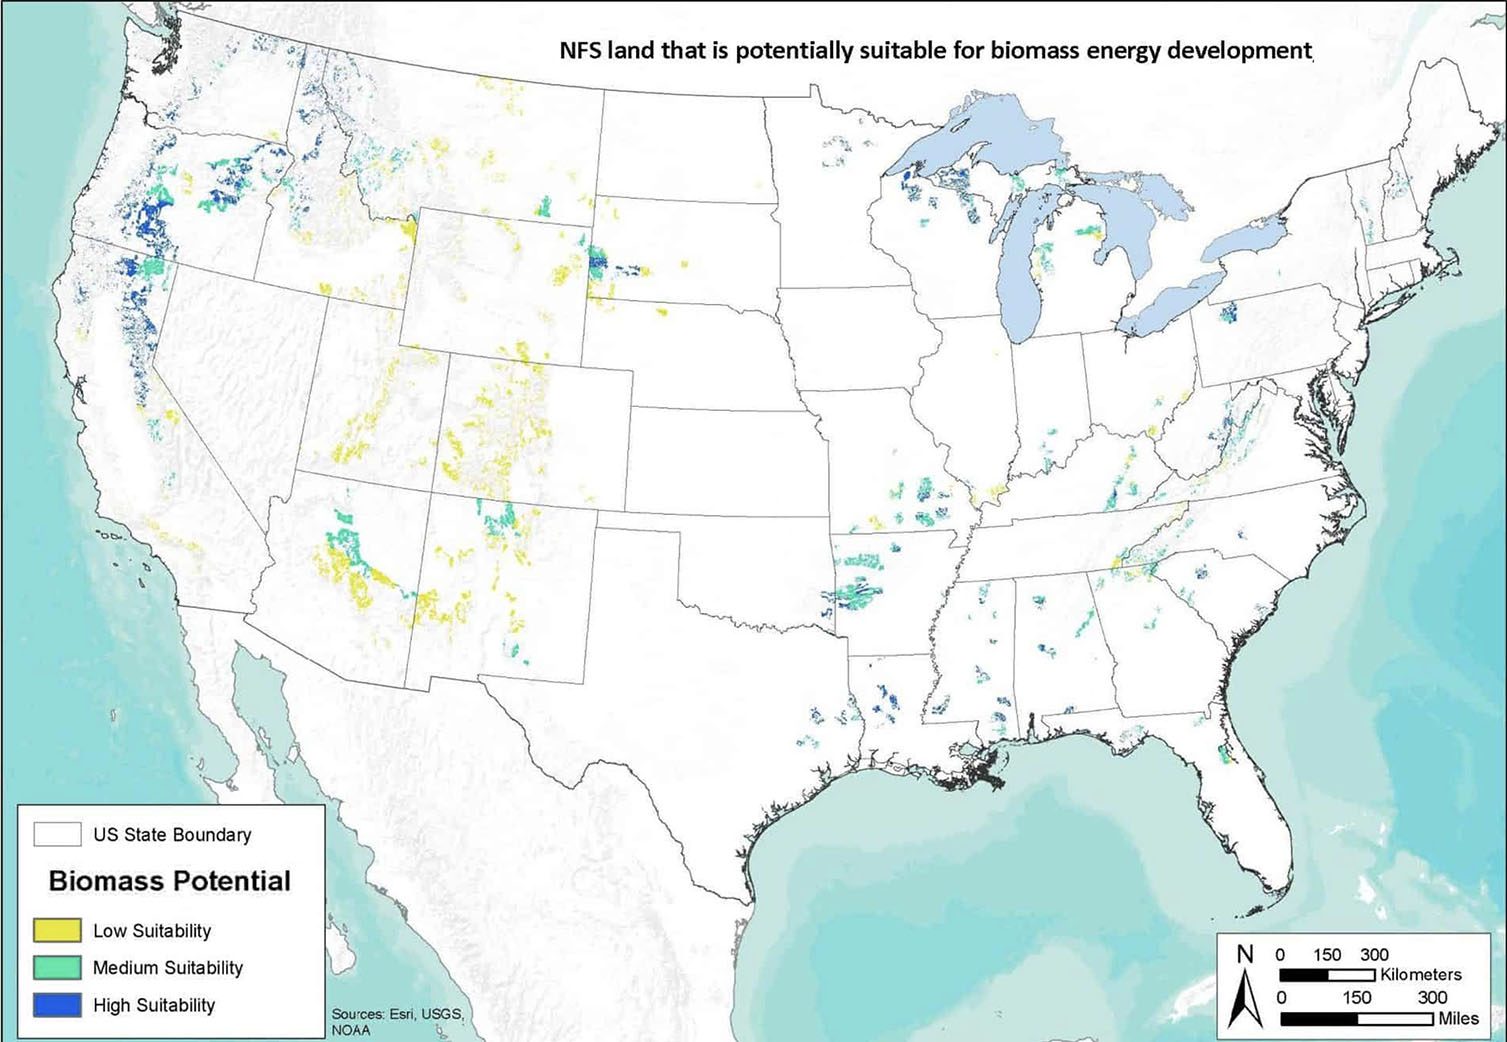 Fig. 22. US National Forest Service land potentially suitable for biomass energy development.(20) |
Solar EnergyThe sun's radiant energy is the source of power behind all forms of energy consumed (except nuclear and geothermal power). Solar energy has been used for direct and passive solar heating of building, greenhouses, and water in buildings and pools for centuries. Over the last century technologies have advanced that allow conversion of solar energy into electrical power by powering steam turbines and directly with photo-voltaic panels. The arid climate and typically clear skies of the American Southwest is best suited for generating solar energy in the United States (Figures 23 and 24).Click here to see Solar explained: U.S. Energy Information Administration website.(22) |
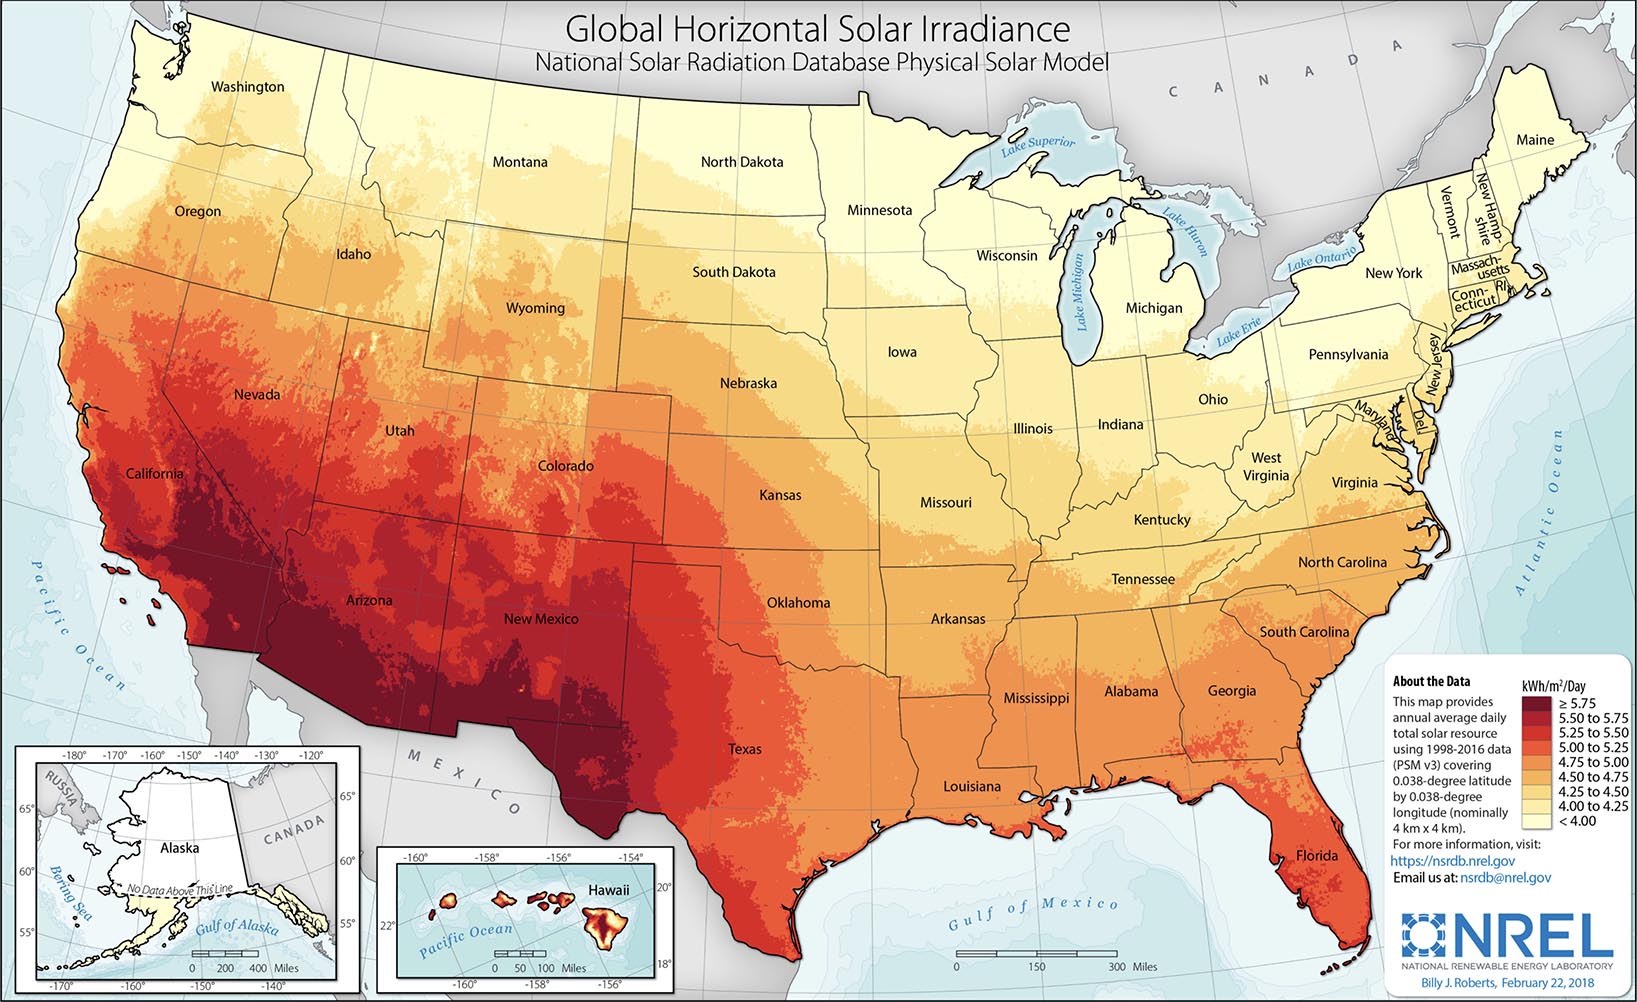 Fig. 23. Map showing solar energy production regions of the United States.(21) |
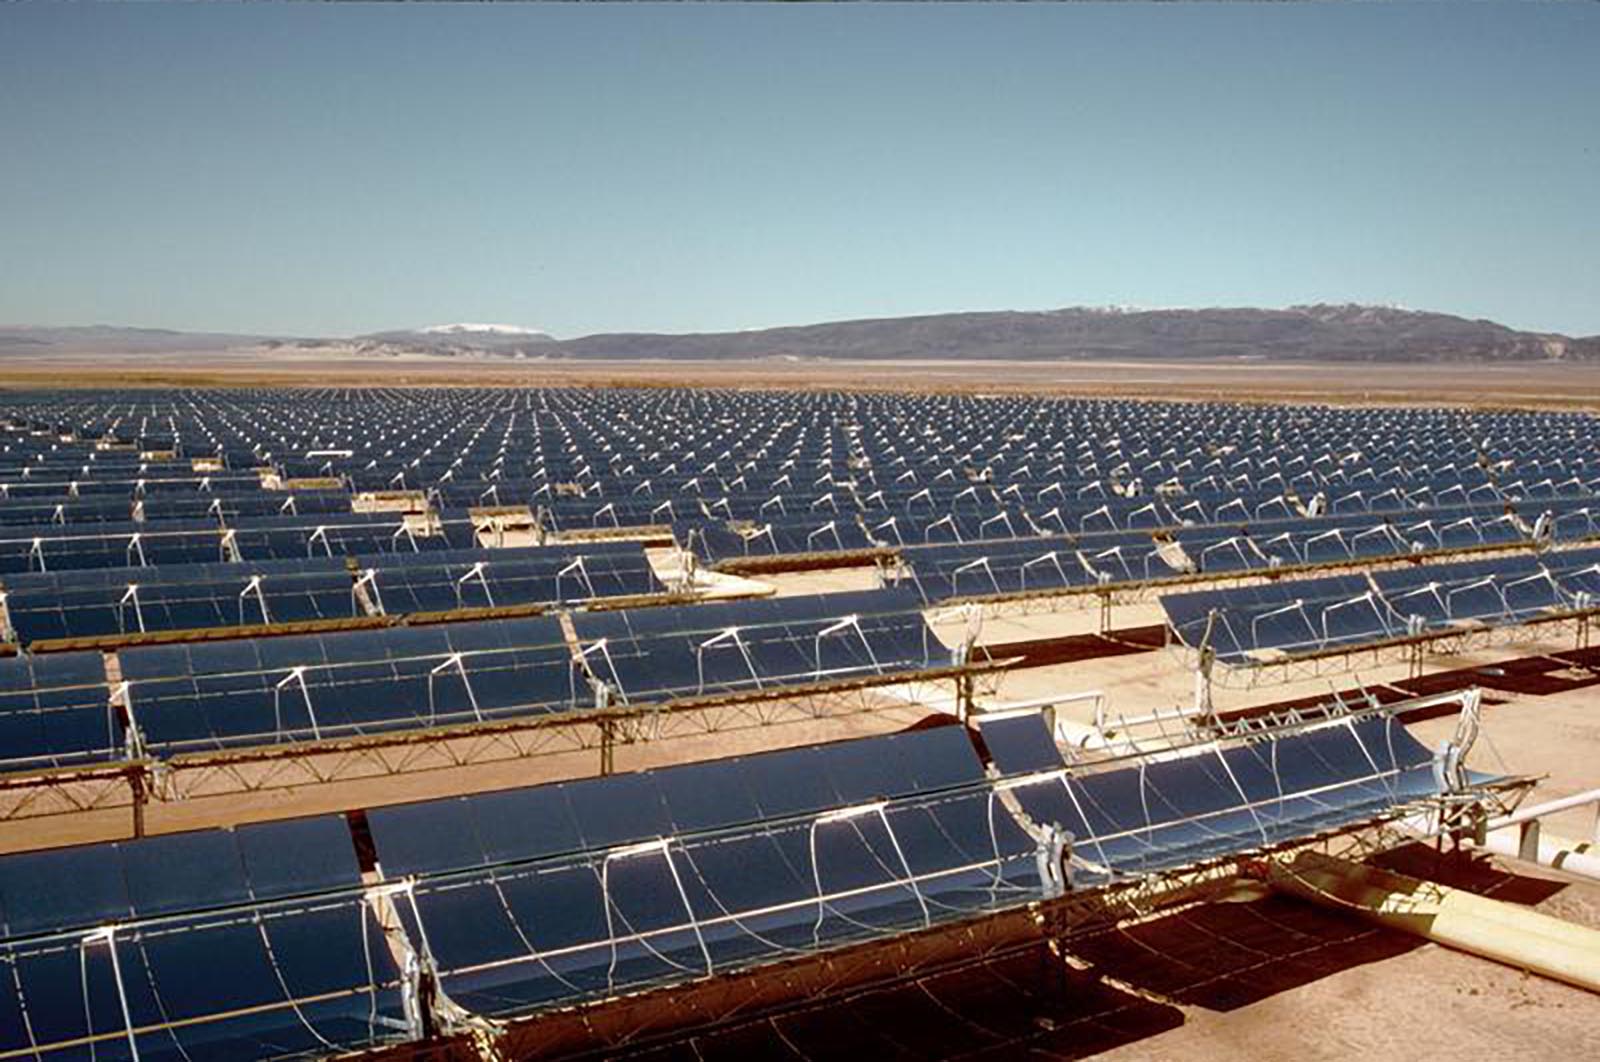 Fig. 24. View of a solar energy photo-voltaic field in the Southern California desert. |
Nuclear PowerAccording to the U.S. Environmental Protection Agency, ,nuclear reactors generate about 20% of all of the electricity used in the United States.(23) Twelve U.S. states generate more than 30% of their electricity from nuclear power.(24) Although historically, nuclear energy has many problems related to disasters including the Chernobyl, Fukushima, Three Mile Island, among others. The U.S. Energy Information Administration states are 60 commercially operating nuclear power plants with 98 nuclear reactors in 30 U.S. states (this doesn't include military power facilities). Despite the justifiable fears of nuclear energy, if done right, it is remarkably clean and new technologies are making it safer to use. Nuclear fusion power is possibly in our future, but will likely be many years before it becomes economically feasible.Click here to see Nuclear Explained: U.S. Energy Information Administration website.(25) |
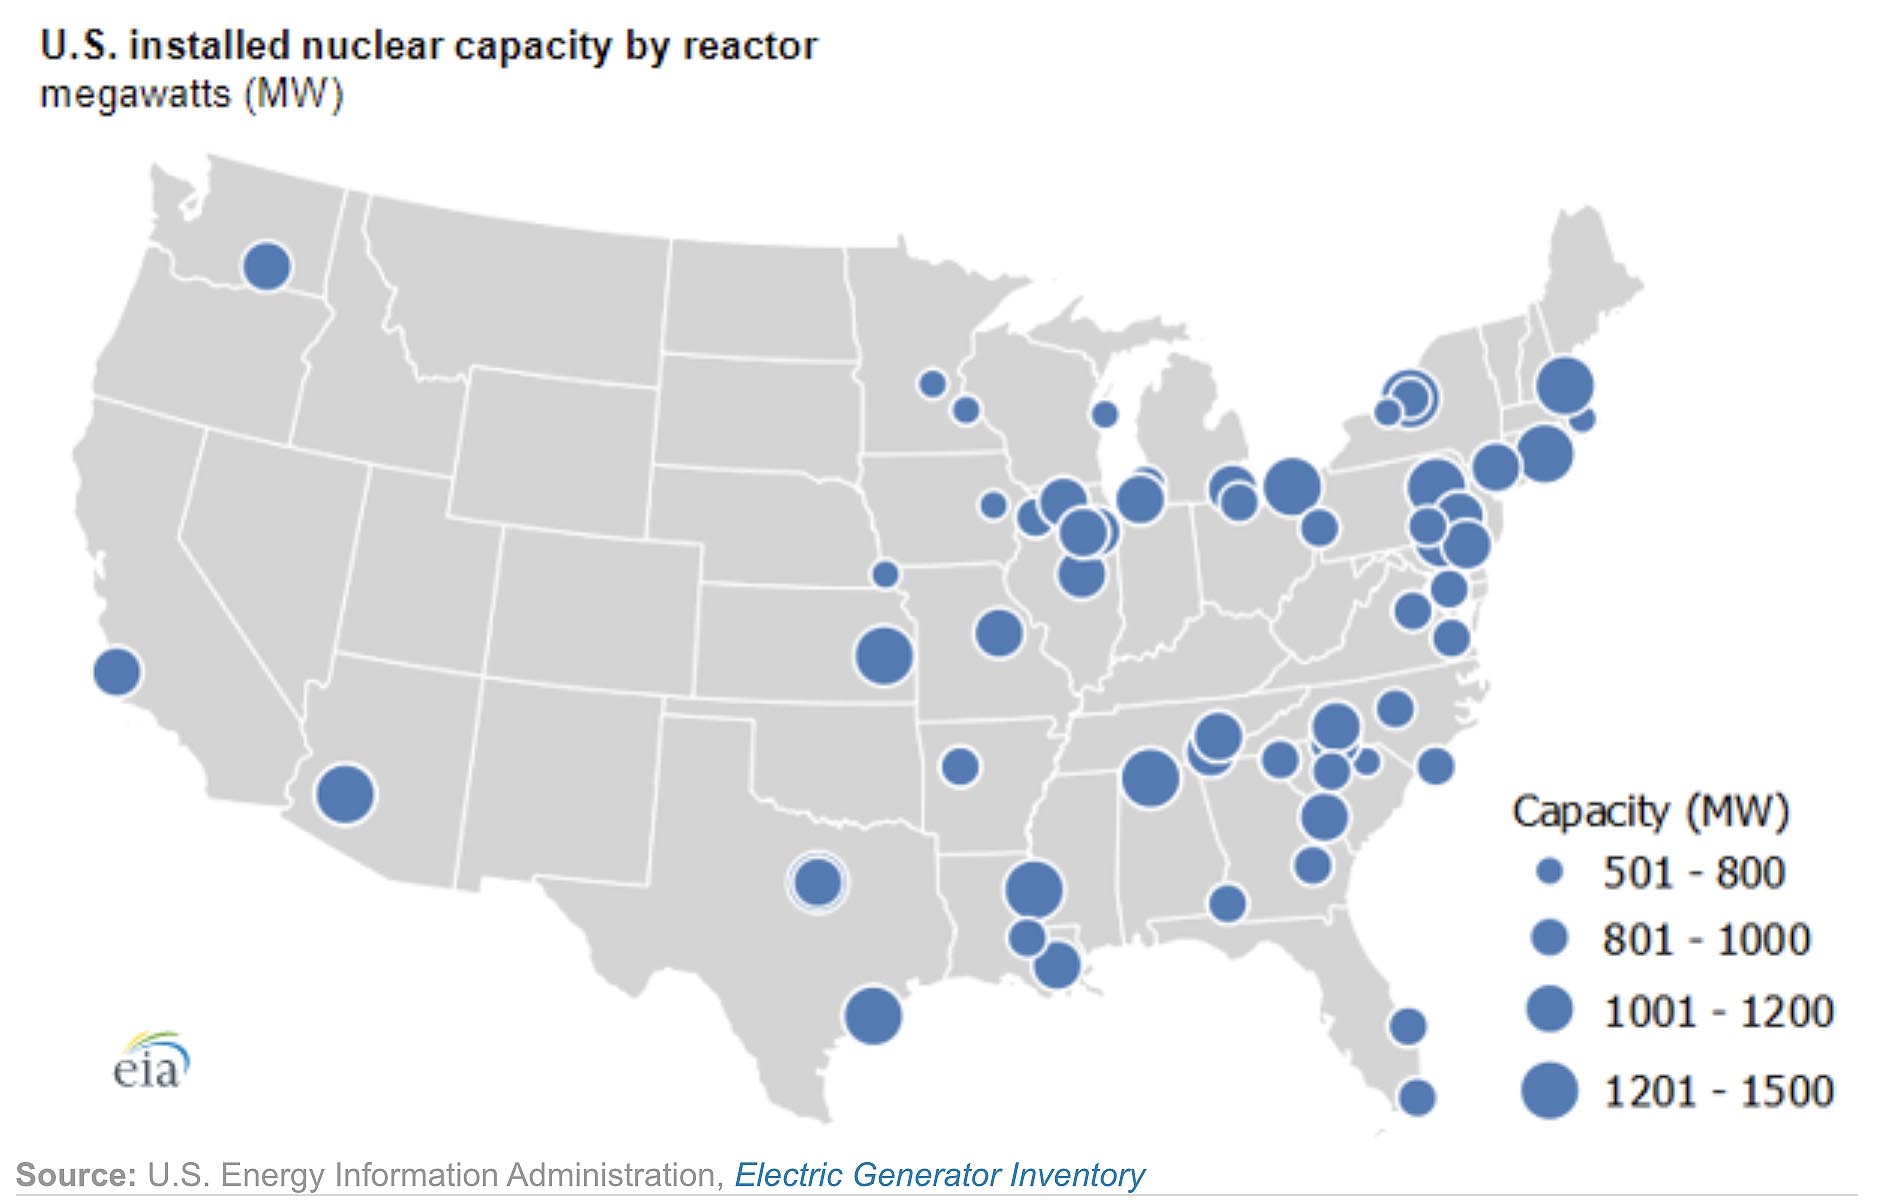 Fig. 25. US Energy Information Administration map showing installed nuclear capacity in the United States. |
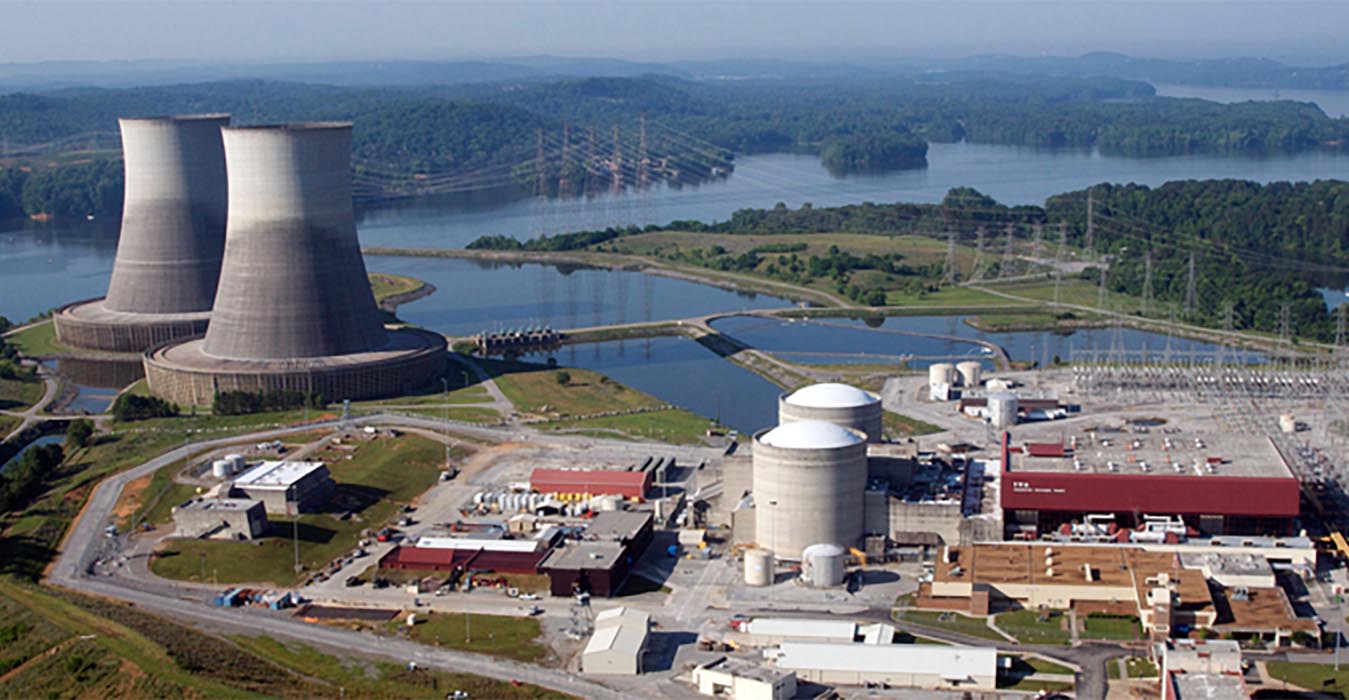 Fig. 26. Aerial view of the Watts Bar nuclear power plant with cooling towers in Tennessee (U.S. Dept. of Energy) |
Non-Energy MaterialsBelow is a list of the major non-energy materials consumed by US citizens in 2021(1):
Click here to view the detail list of USGS Mineral Commodity Summaries.(27) (large .pdf file). |
Mining Rocks, Minerals and MetalsMost non-biological materials produced and consumed come directly from mining operations (such as shown in Figure 27). However, recycling of metals and other non-metal materials is increasing for some materials that are expensive to mine, are in short supply, or controlled hazardous material (making recycling economically profitable).Figure 28 is a map active mines and mineral plants in the US (2003).(28) Click here to go to the interactive map database that you can zoom in on and find the location of active mining operations and get information about the mines. Mine plants and operations for commodities are monitored by the National Minerals Information Center of the USGS. |
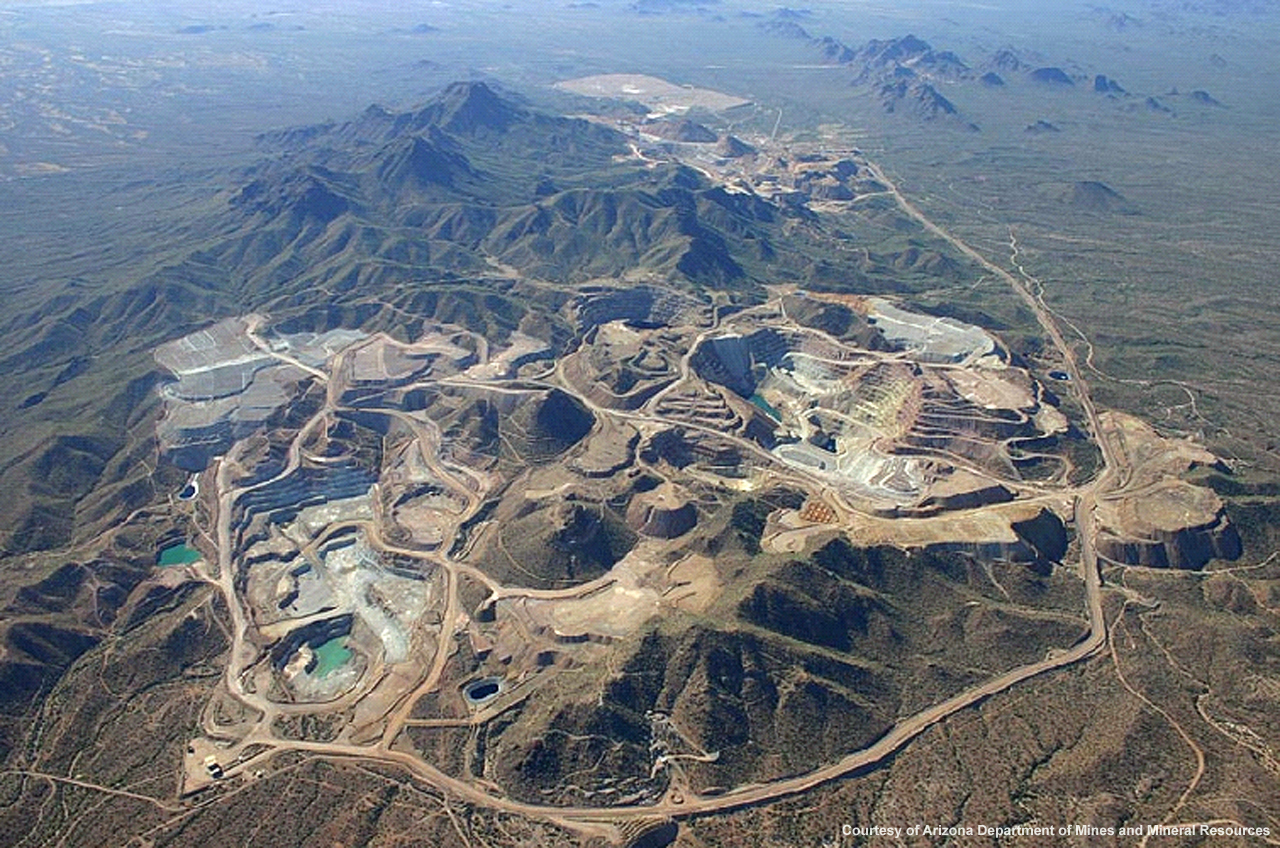 Fig. 27. Aerial photograph of a large silver mining project in Arizona (AZ DMMR) |
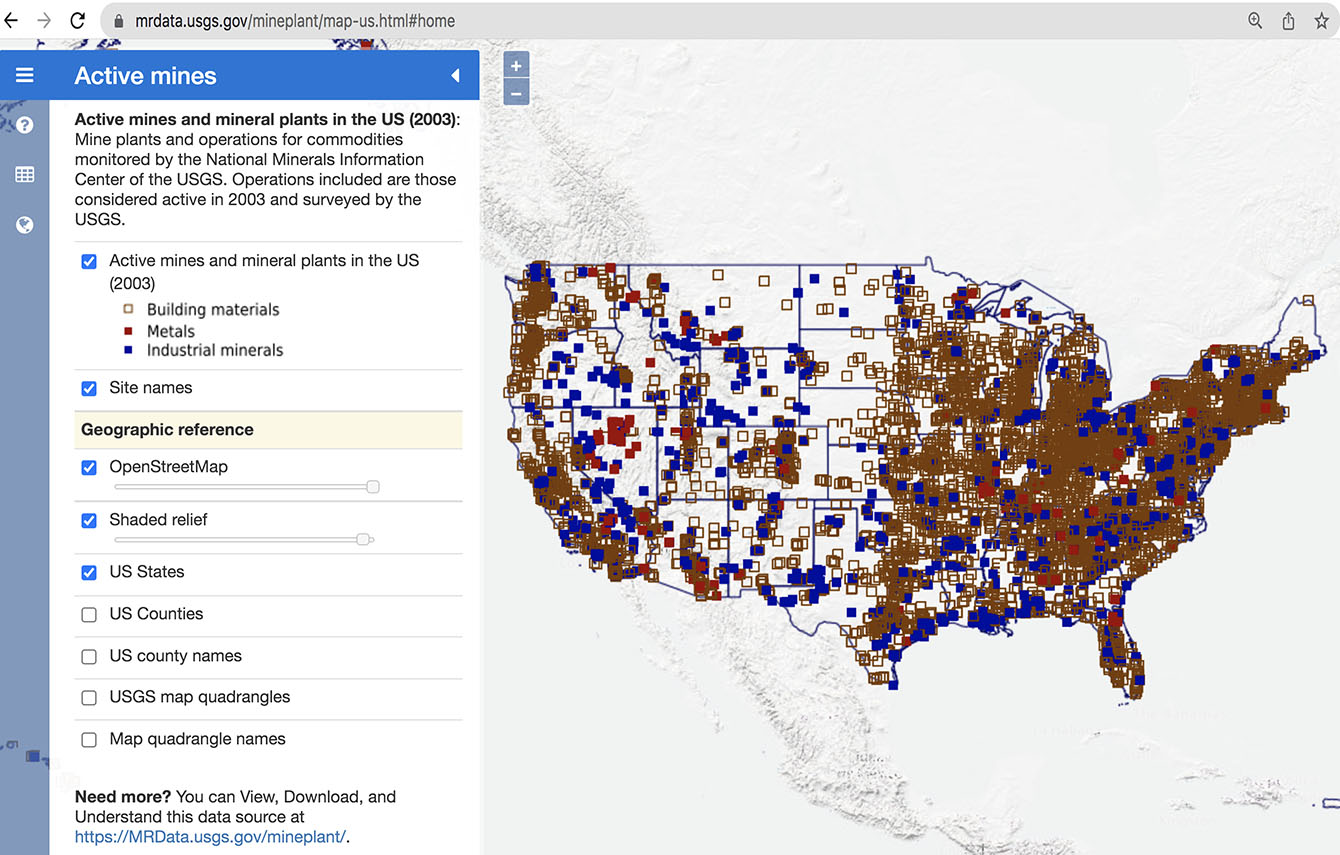 Fig. 28. Active mines and mineral plants in the US: a search-able USGS map database.(28) |
The Most Exploited Mineral Commodities
U.S. mines produced approximately $82.3 billion in minerals in 2020(29) In terms of volume, the most exploited "mine-able" mineral commodities worldwide are iron ore, coal, potash, and copper. |
Construction MaterialsBelow is a list of the most important construction materials:• Cement (in concrete) • TMT bars (high-strength thermo-mechanically-treated bars with low carbon steel) • Sand (various grades) • Bricks (various types) • Coarse aggregate (various sizes and types) • Wood. |
 Fig. 29. Limestone mined from a quarry on the eastern flank of the San Bernardino Mountains is used to manufacture cement. |
 Fig. 30. Prehistoric river terrace gravel deposits like this one along the Colorado River are a target for aggregate materials (sand and gravel). Fig. 30. Prehistoric river terrace gravel deposits like this one along the Colorado River are a target for aggregate materials (sand and gravel). |
ConcreteConcrete is the most widely used building material in the world. Although the terms concrete and cement are often are used interchangeably, cement is actually an ingredient of concrete. Concrete is a mixture of aggregates (various kinds of sand and gravel) combined with a paste of cement. Cement is manufactured through the chemical combination of 8 main ingredients during the cement production process including limestone, clay, marl, shale, chalk, sand, bauxite, and iron ore. Figure 29 shows a view of a large limestone mine on the flanks of the San Bernardino Mountains in Lucerne Valley. The limestone is crushed an baked into lime and mixed with other ingredients to make cement and concrete. Aggregate MaterialsAggregates are a non-renewable resource simply grains or fragments of rock, mined, processed, transported, and sold, typically in bulk form (typically bagged or by the truck load). They are raw rock and sedimentary materials that are mined from natural sources (extracted from pits and quarries) including gravel, sand, and crushed stone. Figure 30 shows an example of a natural sand-and-gravel deposit associated with an ancient river terrace along the Colorado River near Blythe, CA. It is poorly consolidated alluvial deposits that are commonly mined and processed to create aggregate materials.The largest share of construction materials are used in road construction. According to a Congressional statement by the U.S. Geological Survey: "As of 2012, the most recent year for which detailed data are available, the United States had 4.1 million miles of roads, 1.0 million miles of which are maintained with Federal aid and 47,700 miles of which comprised the Interstate Highway System. On a tonnage basis, the most important materials used in road construction are sand and gravel and crushed stone aggregates. These materials are also used in hydraulic cement concrete, with asphalt, and as road base. In addition, steel is used as culvert pipe, reinforcements, and structural support."(30) Figure 31 to 35 below illustrate construction material typically used in landscaping and home decoration. Another material used in building construction in plaster incorporated into drywall sheets. Plaster is made of from refining and processing gypsum or anhydrite (calcium-sulfate minerals deposited from seawater, both modern or ancient deposits). |
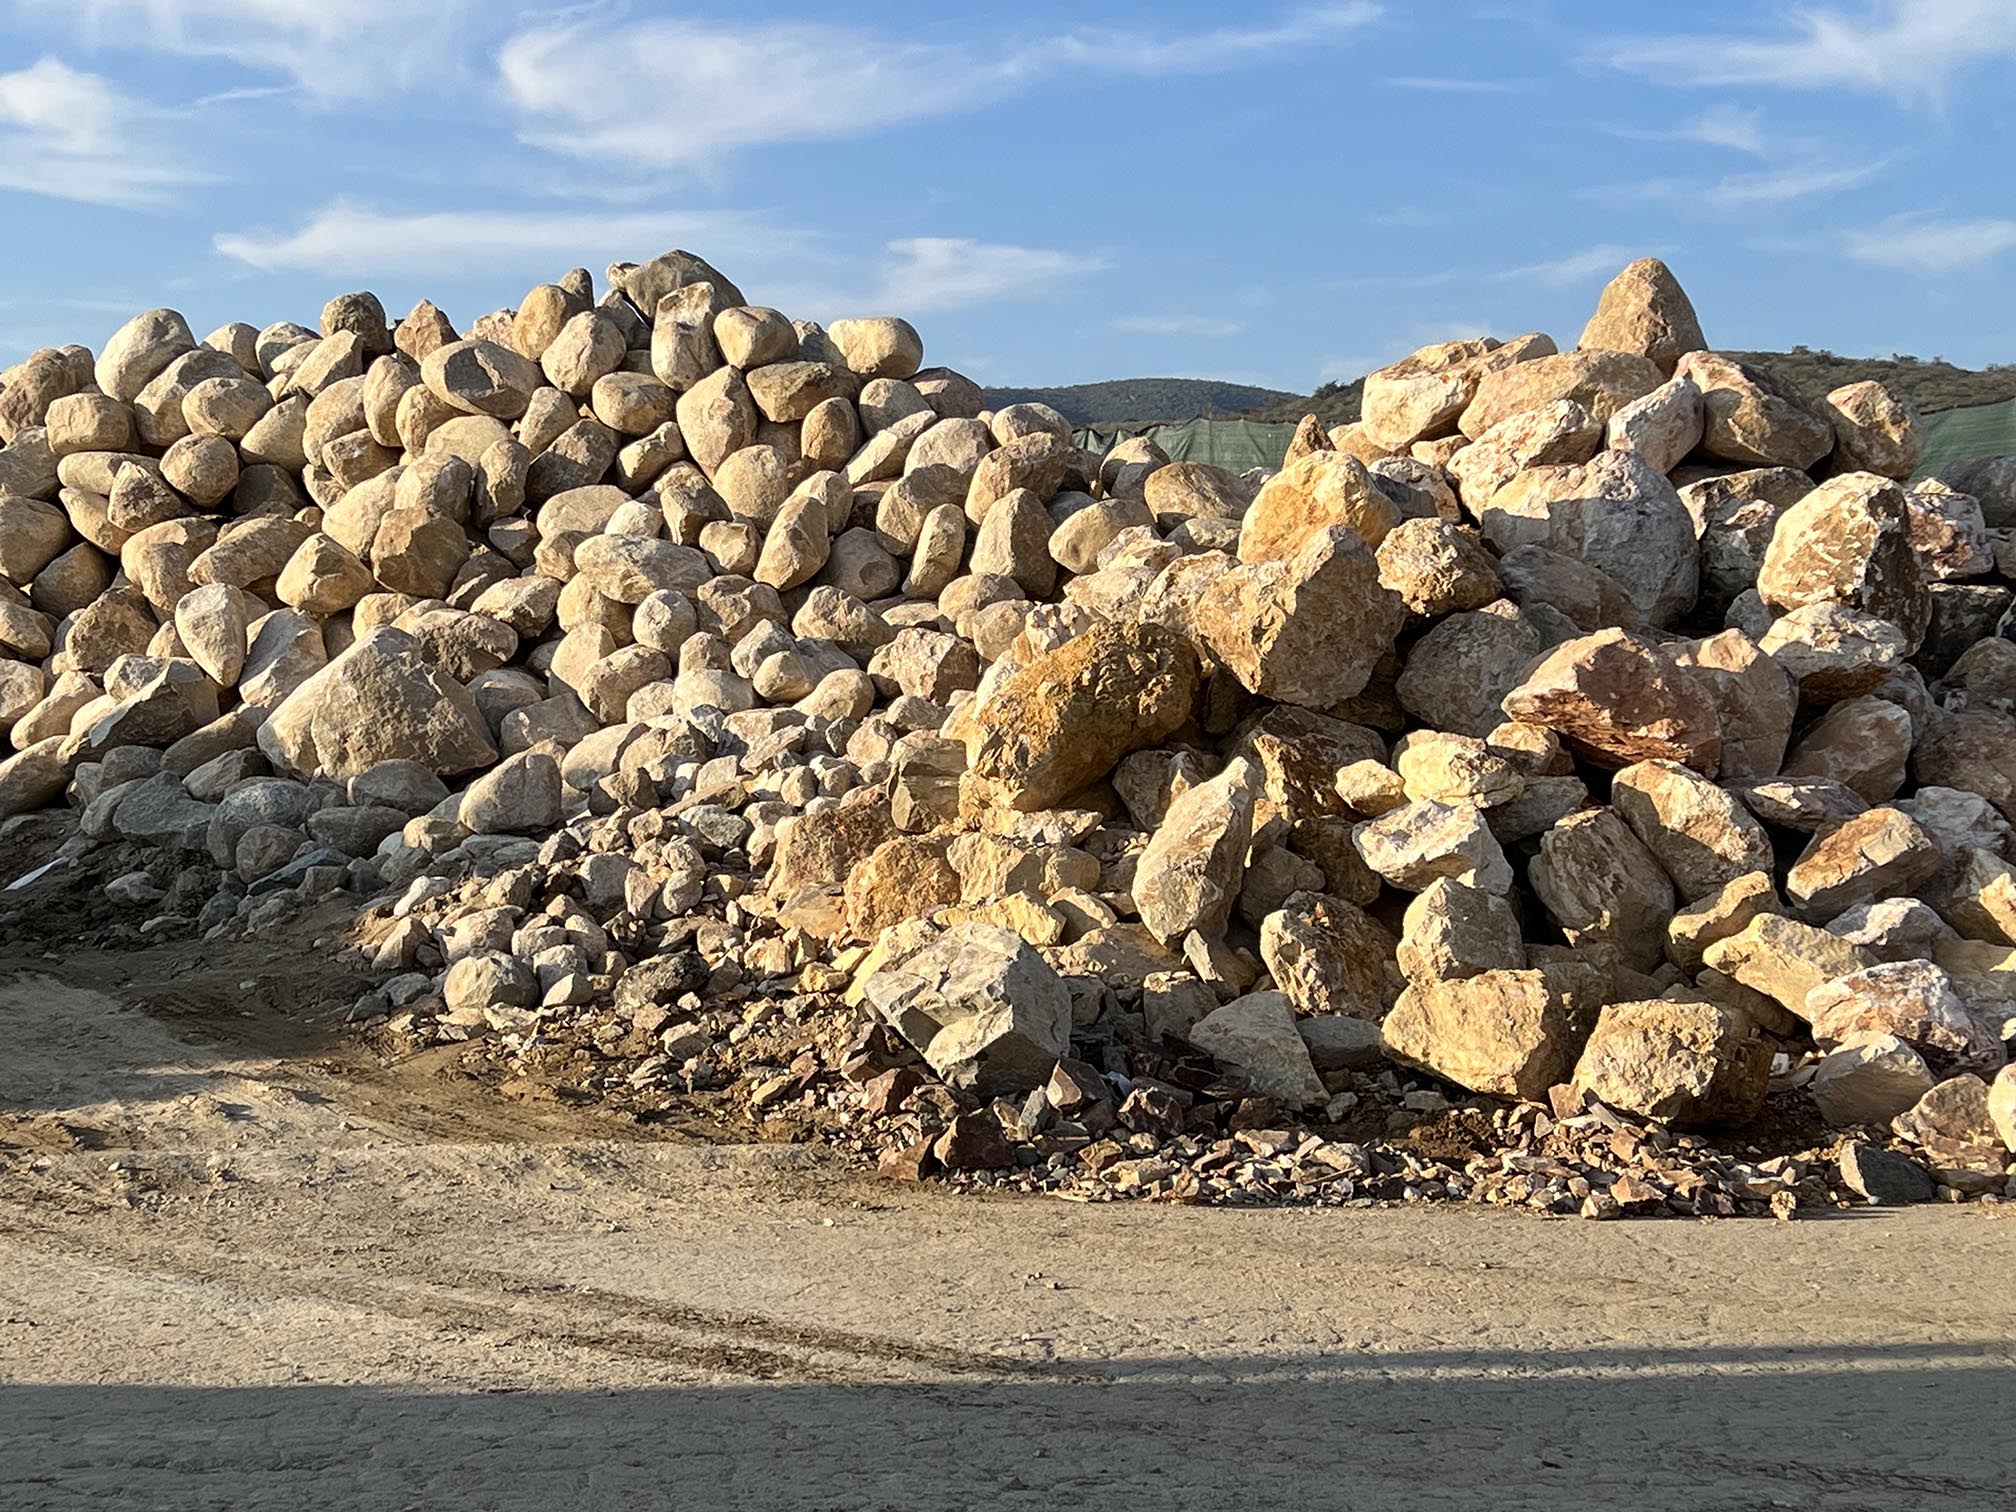 Fig. 31. Large boulders used for yard displays and walls. |
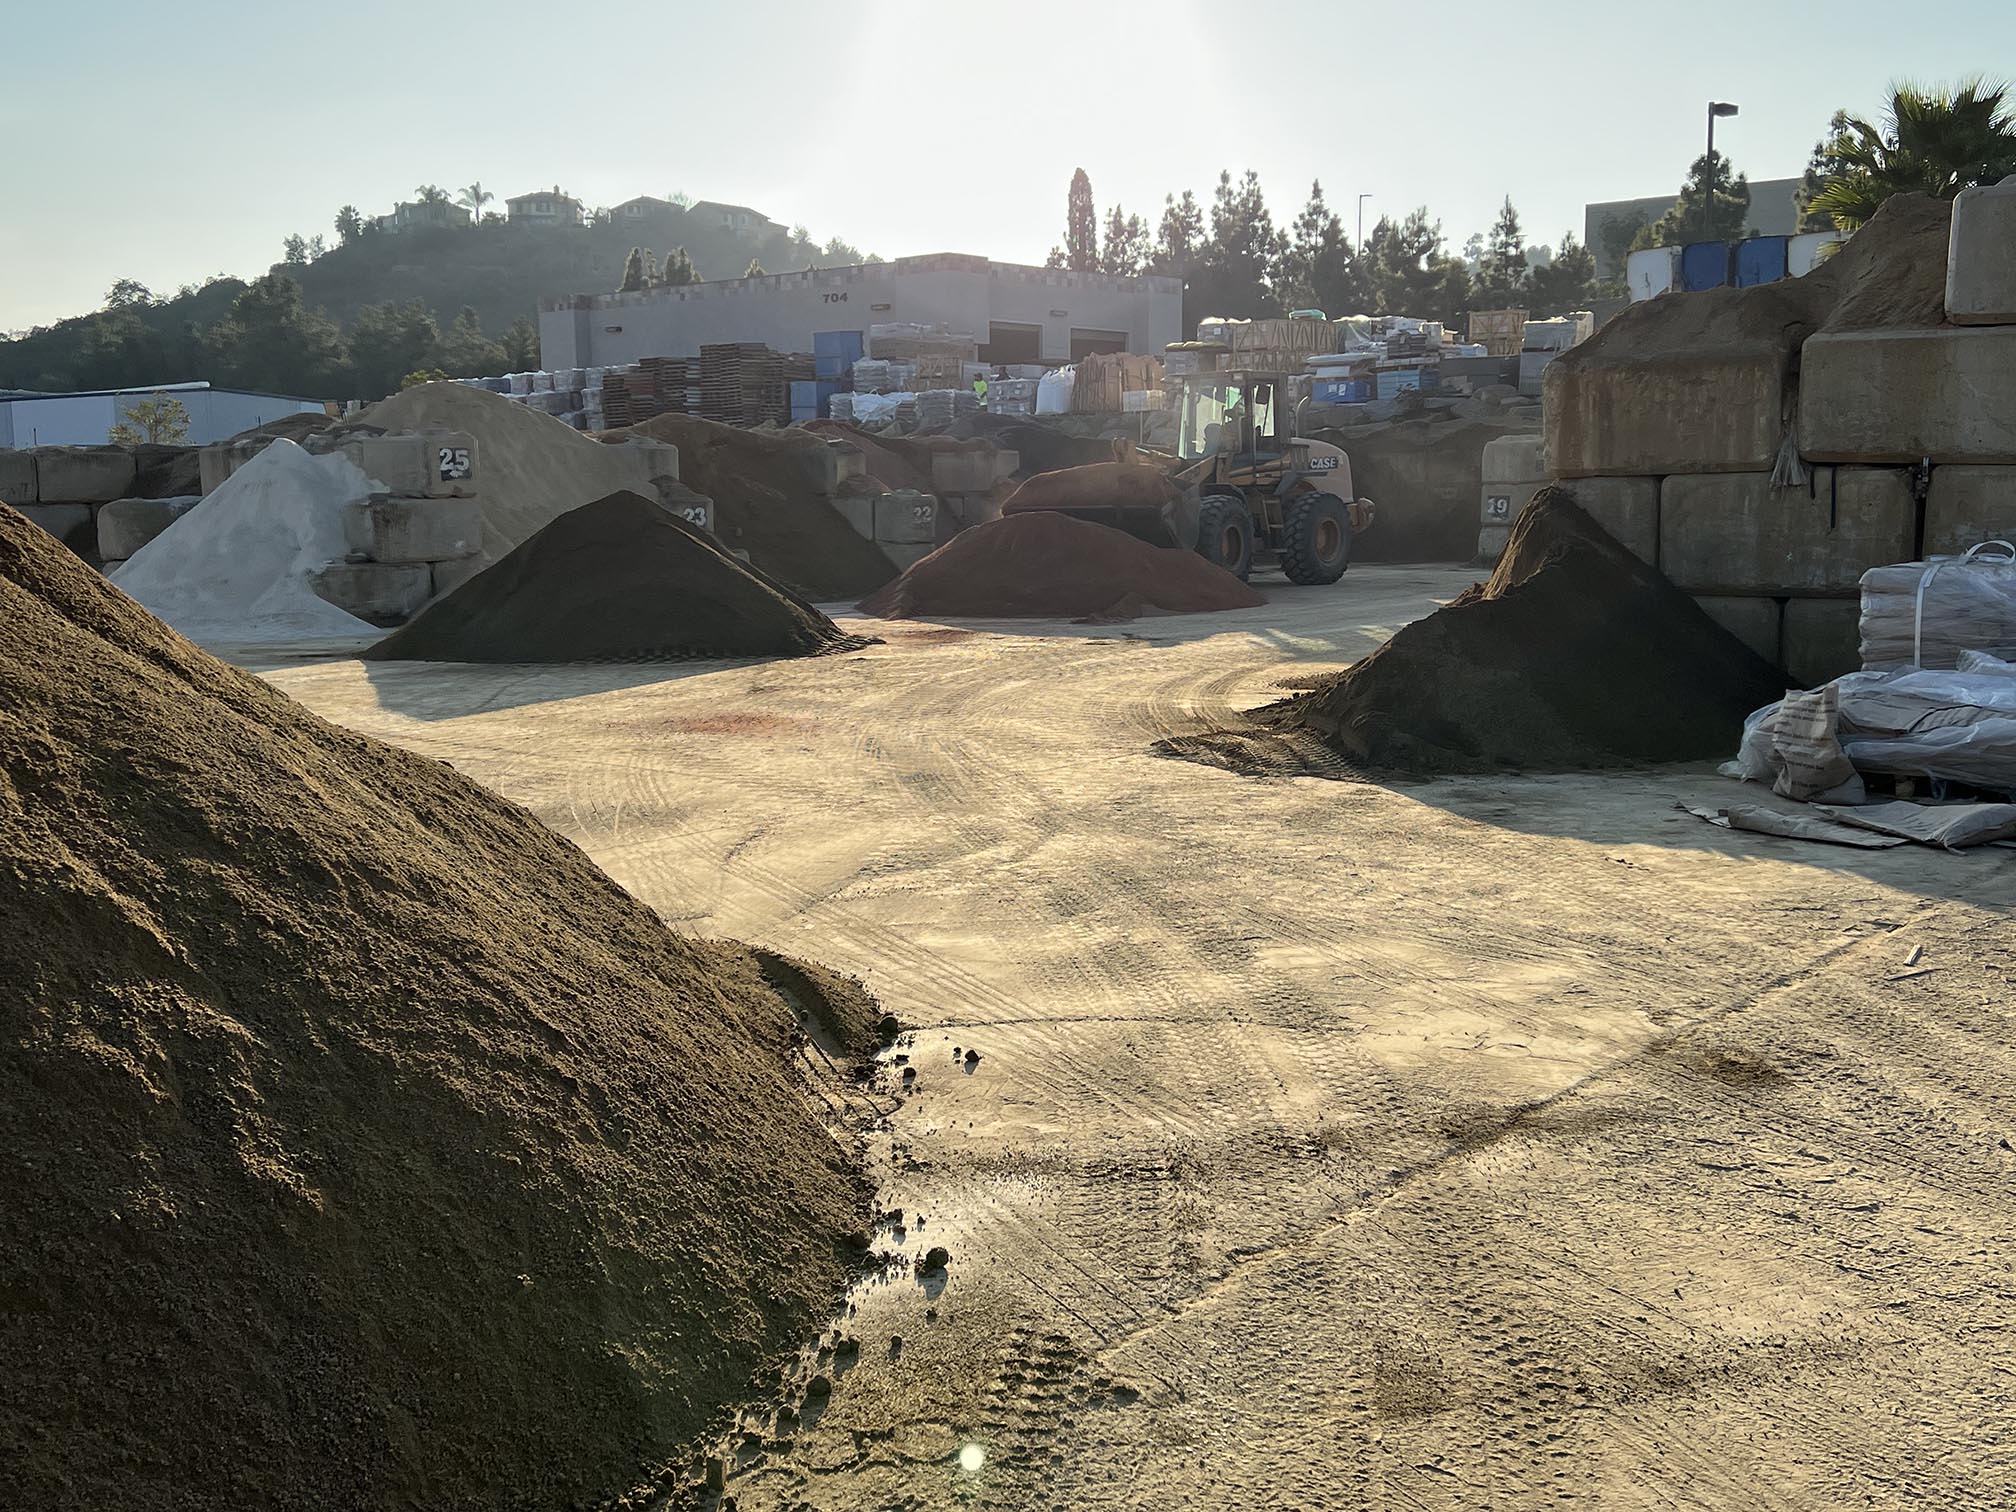 Fig. 32. Sand and degraded granite from various sources. |
 Fig. 33. Decorative yard gravels from many sources. |
 Fig. 34. Stone slabs of various rock types. |
 Fig. 35. Decorative cut-and-polished stone display. |
Conservation and PreservationConservation seeks the sustainable use of natural resources by humans, for activities such as logging or mining, while preservation means protecting nature from human use. Conservation involves the careful maintenance and upkeep of a natural resource to prevent it from disappearing. Conservation involves the care and protection of these resources so that they can persist for future generations.Preservation is essential for protecting ecosystems. Protecting precious land, open space, and water resources from development is perhaps the greatest challenge of our times. Once natural landscapes are altered, they will likely never be restored to their natural habitats that supported native species going back for millennia. |
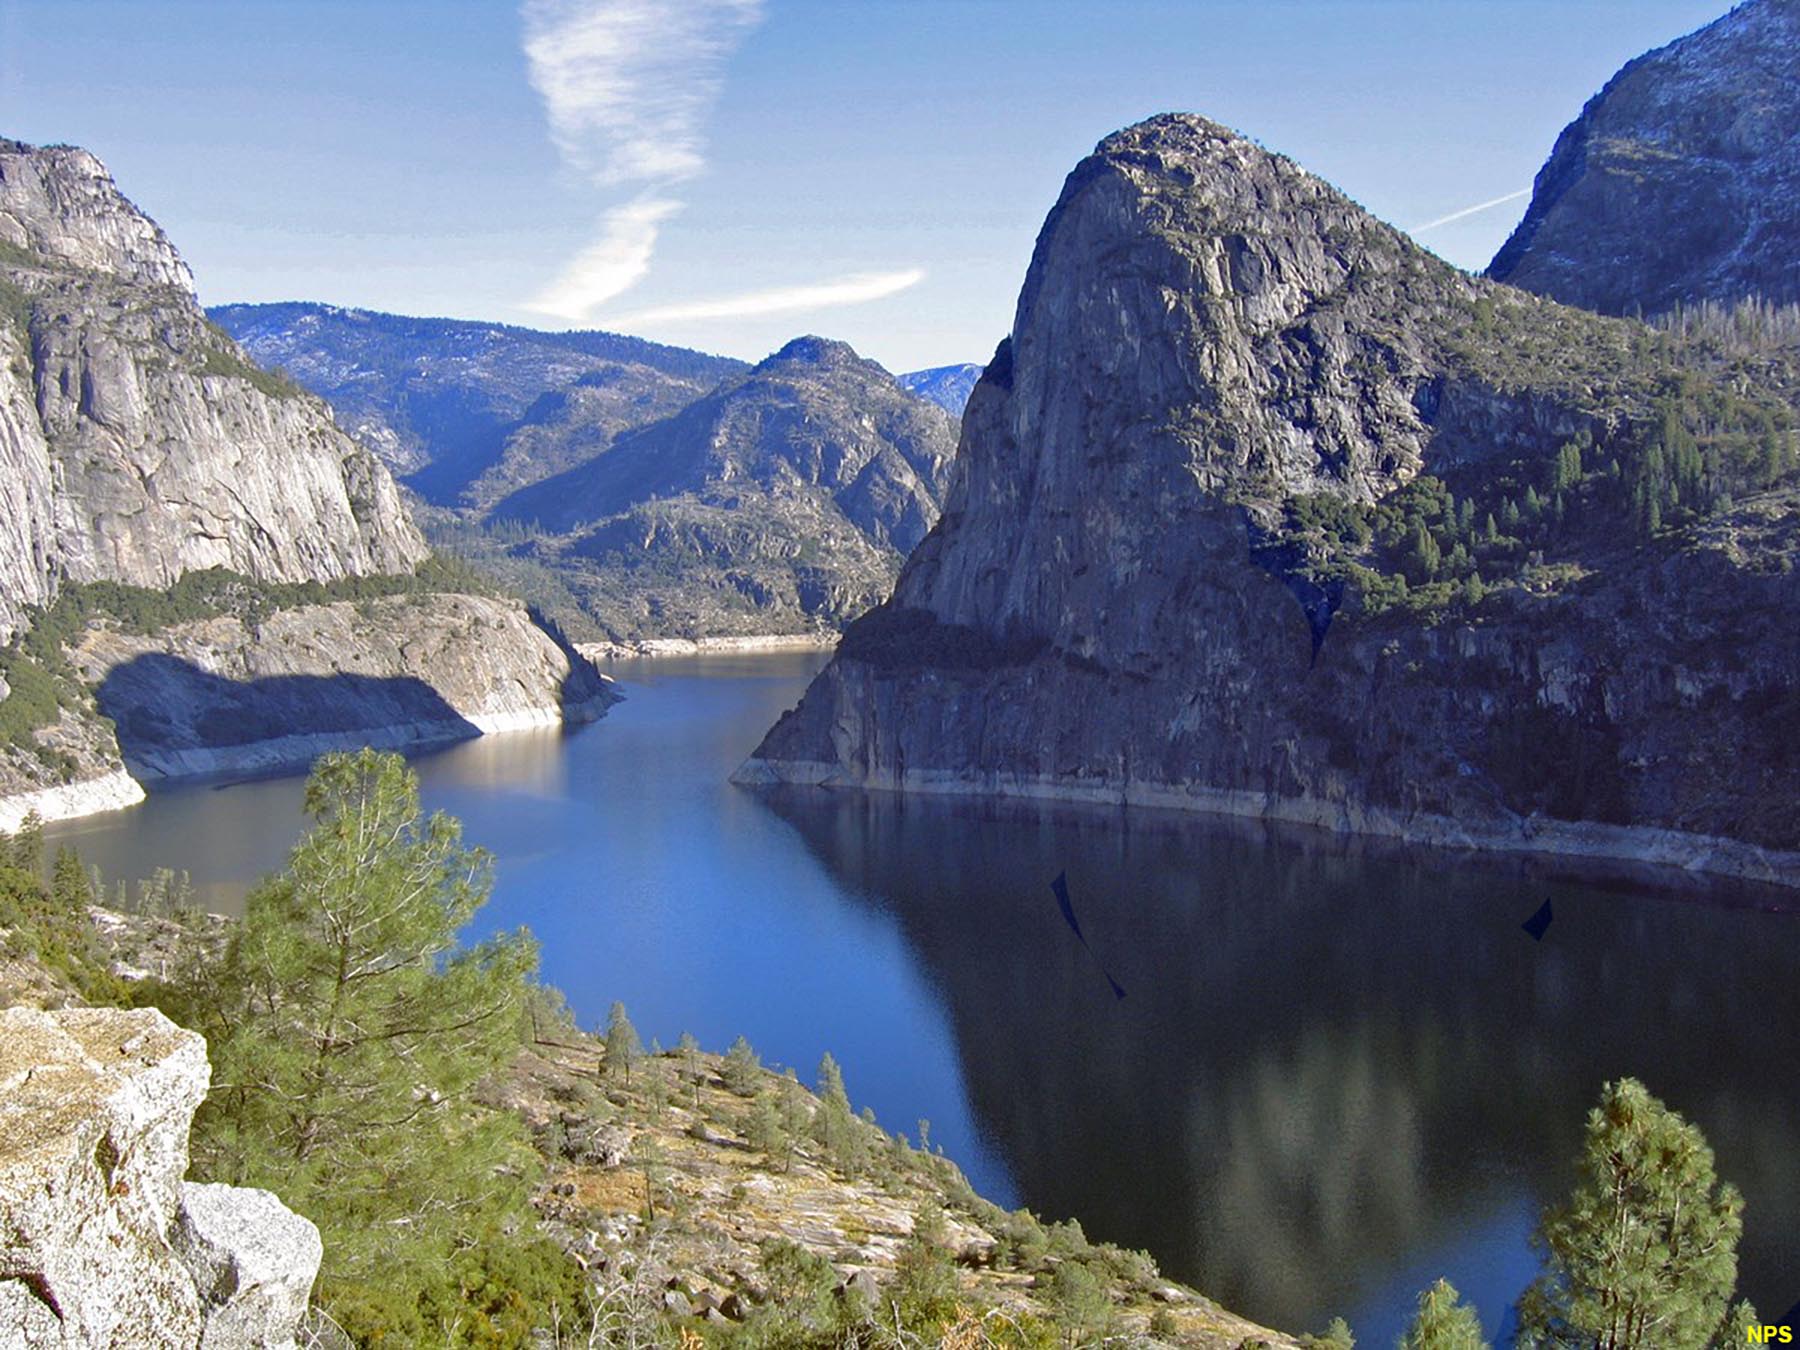 Fig. 36. The construction of Hetch Hetchy Reservoir Dam in Yosemite National Park initiated the environmental movement in America. |
 Fig. 37. "Reduce, Reuse, Recycle" slogan and icon for the conservation movement. |
Recycled MaterialsRecycling is the action or process of converting waste into reusable materials. Many kinds of waste materials can be recycled at a "profit" (hence, loosely considered a reserve" material). Many other types of materials are not able to be recycled and end up as trash/waste in landfills, which, if properly constructed, and be land restored for use with other purposes. Unfortunately, the manufacture of some materials and products produce quantities of hazardous materials that cannot be recycled and may result in a serious environmental threat if not contained or eliminated. The logical thing to do is find alternative means to produce products that cut back on the need for non-renewable resources and eliminate unwanted waste materials. |
 Fig. 38. Bin colors for trash (gray), recycle (blue), and green-waste bin (green). |
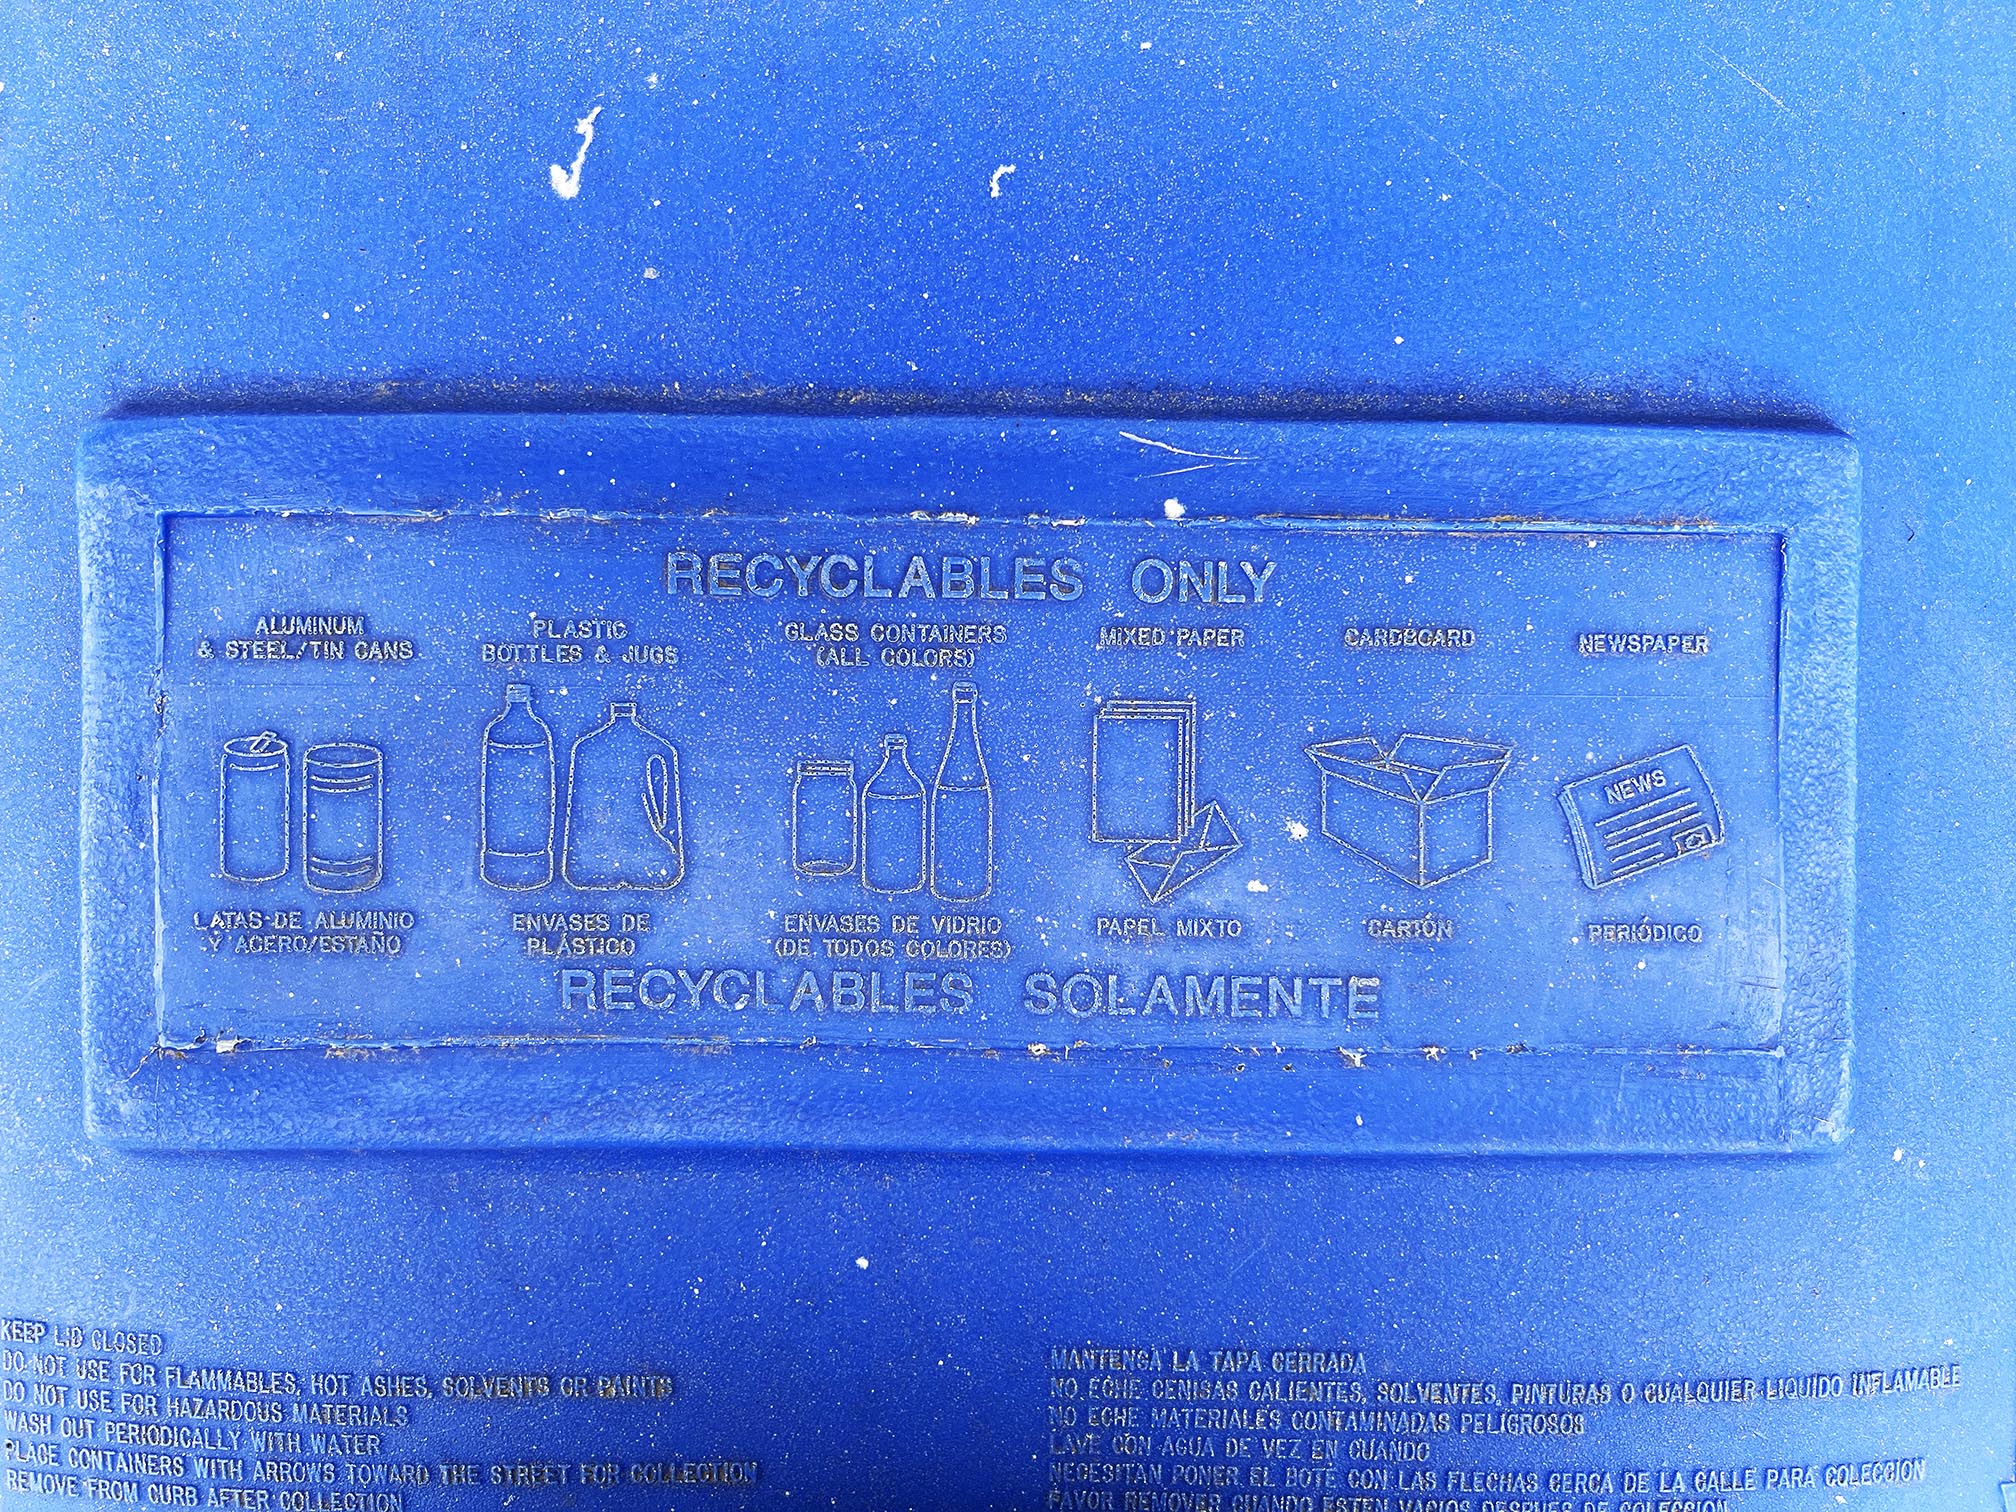 Fig. 39. List of recyclable materials imprinted on a recycle bin. |
All of us have a role in conserving natural resources. Earth Day is now an annual national awareness day that focuses on natural resources conservation with event hosted by nearly every federal and state governmental organization and many national, state, and local organization within communities everywhere. Here is the NOAA.gov Earth Day website: "Protecting Our Planet Starts With You: Ten simple choices for a healthier planet" |
Information SourcesAll web URLs listed below were actively working as of 2/15/2022.(1)Minerals Education Coalition, 2021, How many pounds of minerals are required by the average person in a year? https://www.usgs.gov/faqs/how-many-pounds-minerals-are-required-average-person-year (2)Science, Solutions, Solidarity For A Livable Future: United Nations Climate Action: https://www.un.org/climatechange (12)U.S. has large geothermal resources, but recent growth is slower than wind or solar: Today in Energy: U.S. Energy Information Administration website (11/18/2011): https://www.eia.gov/todayinenergy/detail.php?id=3970# (30)U.S. Geological Survey, Congressional Statement , March 21, 2017, Before the House Committee on Natural Resources Subcommittee on Energy and Mineral Resource, regarding the importance of domestically sourced raw materials for infrastructure projects: https://www.usgs.gov/congressional/statement-us-geological-survey |
| https://gotbooks.miracosta.edu/fieldtrips/rocks/natural_resources/index.html | 10/14/2022 |