
Oceanography 101 |
Return to class home page |
Chapter 7 - Properties of Seawater |
Seawater is the most abundant resource on Earth! Seawater has evolved to what it is over the billions of years that oceans have existed on Earth. This chapter examines the physical and chemical properties of water and seawater.Distribution of Water on Earth97.2% in the world ocean2.15% frozen in glaciers and ice caps 0.62% in groundwater and soil moisture 0.02% in streams and lakes 0.001% as water vapor in the atmosphere |
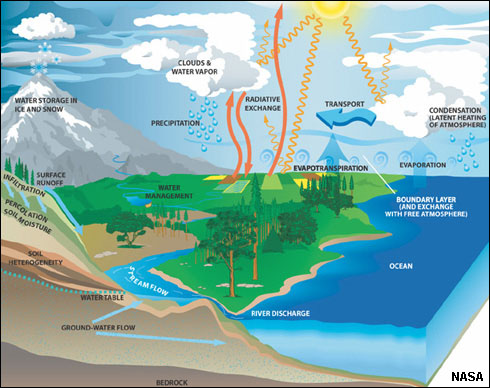 Fig. 7-1. The water cycle. |
Components of SeawaterSeawater is composed of:• Water • Dissolved matter: solids and gas (as ions) • Suspended matter (dust and organic residues) |
|
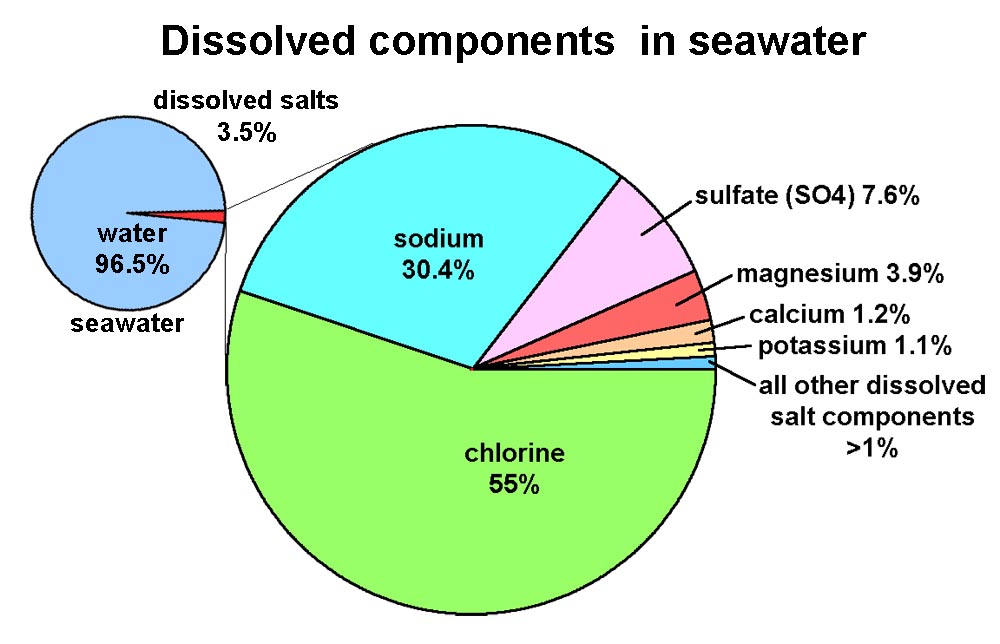 Fig. 7-2. Components of seawater |
Properties of WaterWater is a polar substance. Each molecule of water has a negative charge associated with its oxygen, and a positive charge with it hydrogen (Figure 7-3). This polar character is responsible for its properties cohesion and adhesion.• Cohesion: water has high surface tension because water molecules stick together. • Adhesion: water "sticks" to things. • High capillary action: The cohesion and adhesion properties of water allow water to move upward against gravity in small confined spaces. The smaller the tube, the higher the water will rise. Capillary action helps plants to move water upward from their roots to their leaves. • Water is a powerful solvent: A solvent is a substance that dissolves a solute (a chemically different liquid, solid or gas), resulting in a solution. The polar character of the water molecule allows it to form weak bonds with other polar molecules. Substance held together with ionic bonds will readily dissolve in water. However, the solubility of chemical compounds in water is highly variable. The solubility of a chemical compound in water is defined as the maximum amount of the chemical that will dissolve in pure water at a specified temperature. Seawater is a solution. |
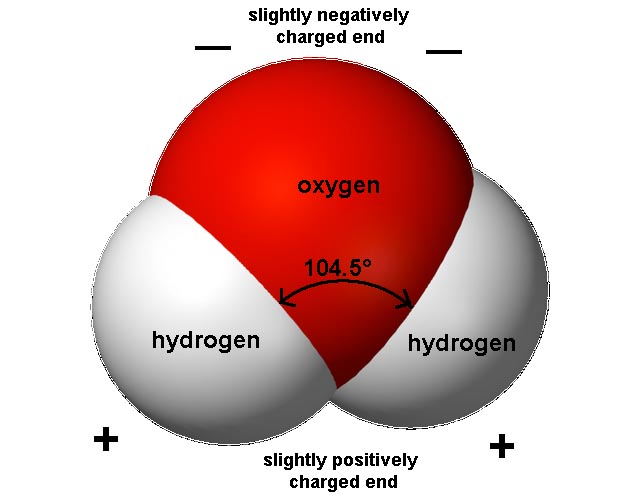 Fig. 7-3. Water is a polar molecule. 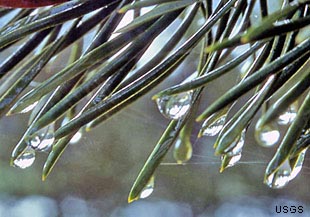 Fig. 7-5. Water droplets illustrate water's high cohesive and adhesive properties. |
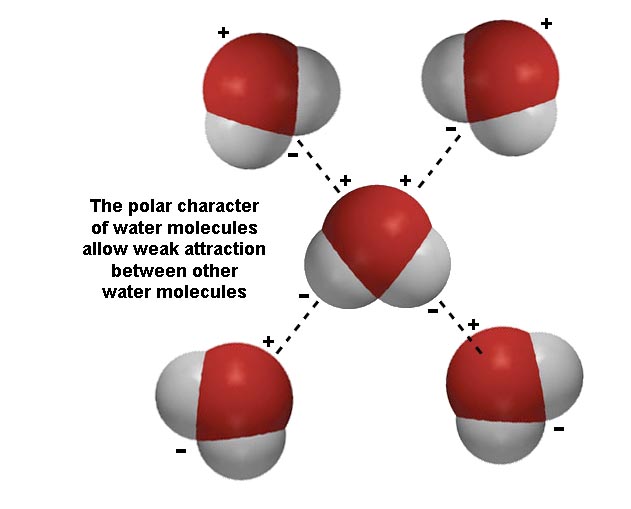 Fig. 7-4. Water's polarity allows weak attraction between water molecules. 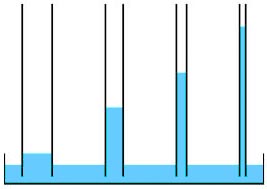 Fig. 7-6. Capillary action works because water adheres to material. The smaller the tube the higher the water will rise. |
Why don't oil and water mix?Organic compound containing only carbon and hydrogen (hydrocarbon) are nonpolar and will dissolve in nonpolar solvents (like oil). However, many organic compounds have “functional groups with very electronegative elements” (i.e. oxygen), making the whole molecule polar, allowing them to dissolve in water (ex: sugar and starch can dissolve in water). Soap compounds (called surfactants) have molecules that are both; they have portions that behave as polar and non-polar ends. One end will stick to hydrocarbons and other non-polar substances whereas the other will stick to water and other polar molecules. This allows polar organic compounds to disperse in water. |
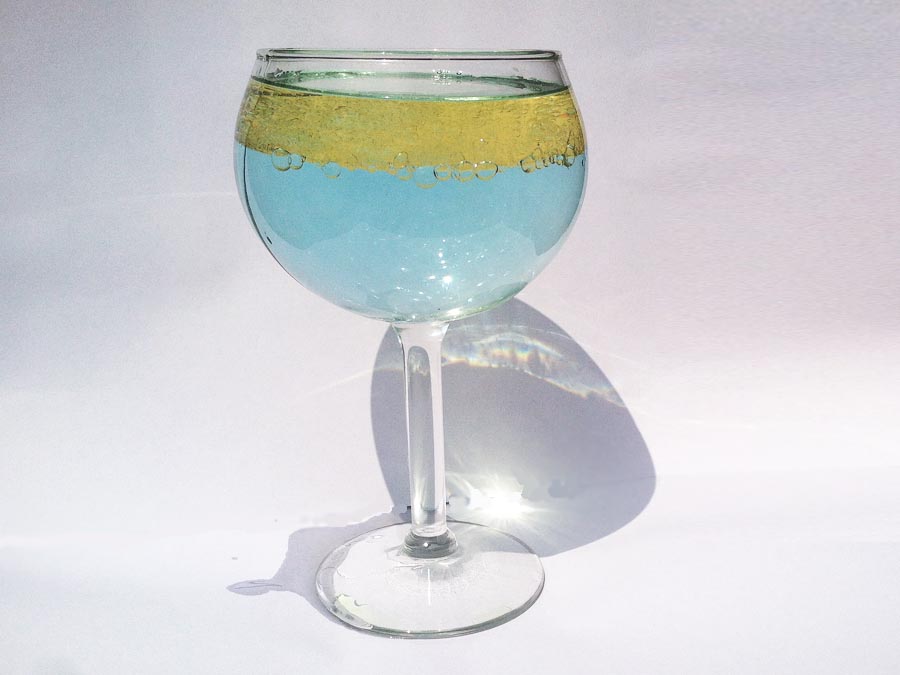 Fig. 7-7. Oil is a non-polar substance. Water is polar. |
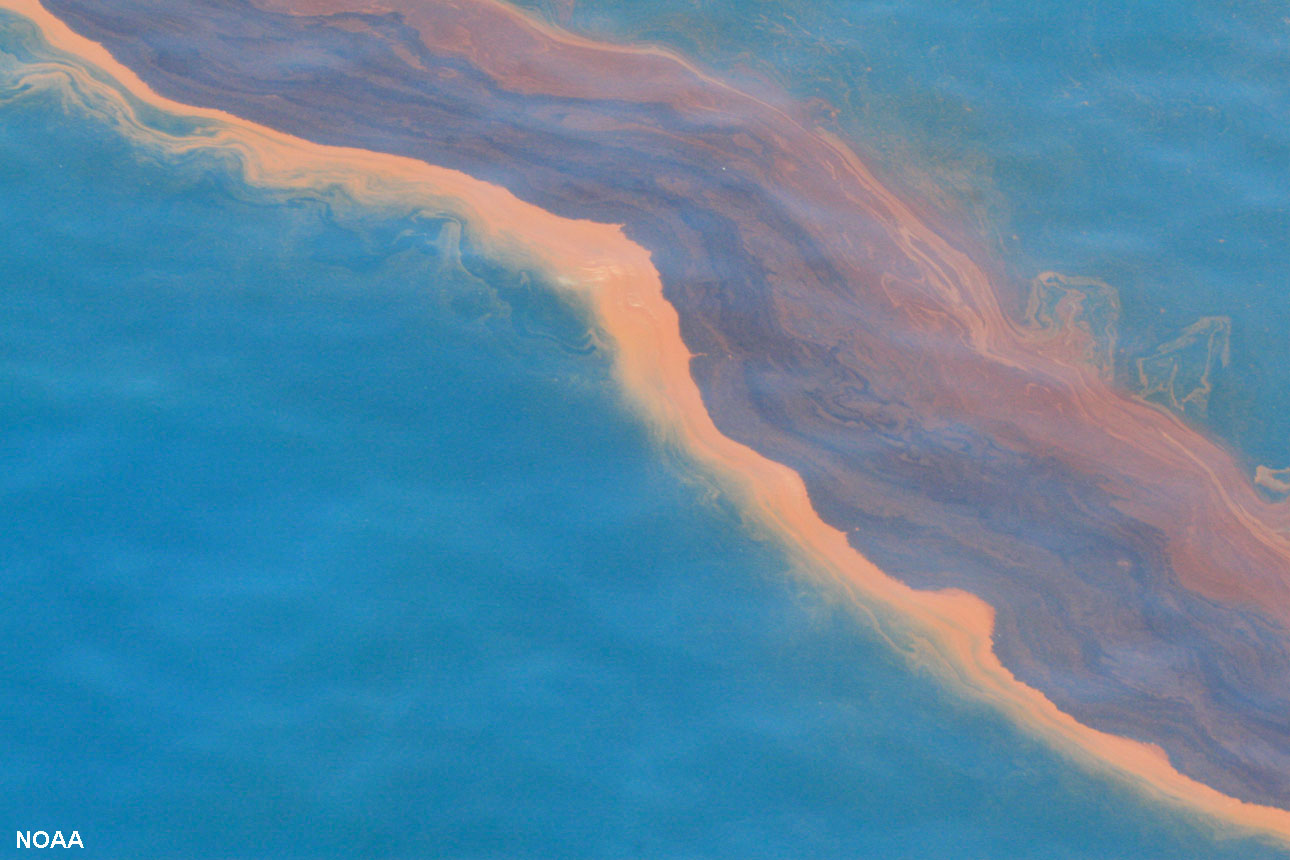 Fig. 7-8. Ship cleaning up after an oil spill. |
Properties of WaterpH (acidity and alkalinity)pH is a measure of the acidity or alkalinity of a solution expressed on a logarithmic scale on which 7 is neutral, lower values are more acid, and higher values more alkaline. pH is an important measurement in seawater. Neutral water is a pH of 7.Bicarbonate buffering of seawaterA natural buffering system with seawater’s interaction with carbon dioxide. Seawater is generally always within a range of pH of 7.5 to 8.5. The interactions of dissolved components keep ocean water in a stable range. Organisms living in or near seawater have a limited tolerance for variations in pH and other factors. For instance, calcite (as in shell material) is stable within this range, but will dissolve if exposed to acidic conditions. Carbonate buffering keeps pH stable by precipitation (increase pH) or dissolution (decrease pH) of calcium carbonate - CaCO3. |
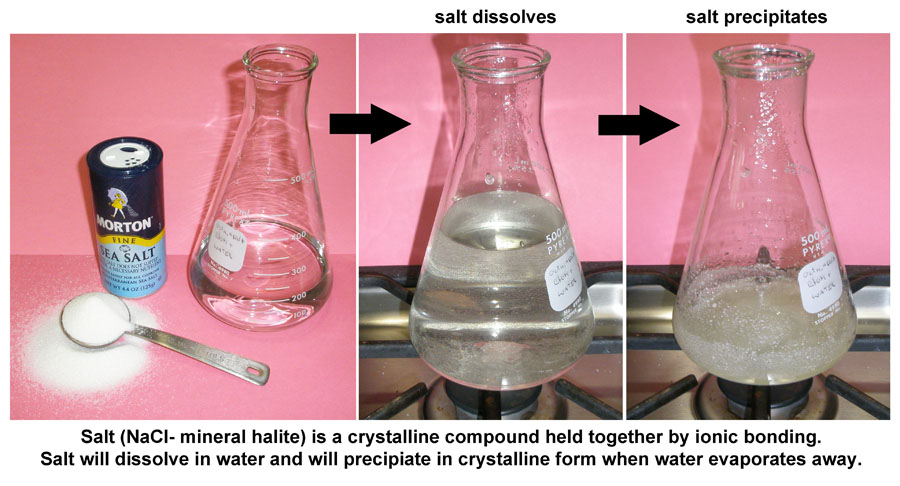 Fig. 7-9. Salts can dissolve in water and then precipitate out again as water evaporates and concentrates salts in solution. |
 Fig. 7-10. pH of common household substances compared with pure water (pH=7) and normal seawater (pH=8.2). |
Specific Heat and Latent Heat Capacity of WaterSpecific HeatMaterials vary in their capacity to store thermal energy. For example, a material like copper will heat up much faster than water or wood. Specific Heat is a measure of the energy required to heat 1 gram of substance 1° C. Specific heat is recorded in "calories" for “mass in grams” (and “Joules for kg”).Figure 7-11 compares the specific heat of various metals to the specific heat of ice, water, and steam. It takes significantly more energy to warm water than other materials, including both ice and steam. Because of water's high specific heat capacity, the oceans are capable of storing vast quantities of energy from solar heating. Heat absorbed in equatorial regions can be carried long distances and carried by ocean currents before being released in polar regions. |
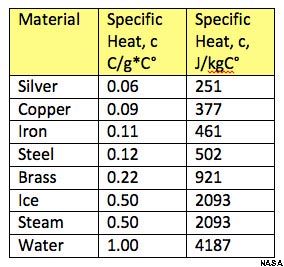 Fig. 7-11. Comparison of the specific heat of various substances with ice, steam, and liquid water. |
High Latent Heat Capacity of WaterWhen any material is heated to the temperature where it changes state (converting from solid to liquid, or liquid to gas), the temperature will remain the same until all the material changes state. Because it takes more energy to convert a substance from one physical state to another (solid to liquid, or liquid to gas), those transitions require a larger amount of energy. Latent heat is the heat required (measured in calories burned) to convert a solid into a liquid or vapor, or a liquid into a vapor, without a change of temperature. For instance a pot filled with water on the stove will gradually warm up until the water temperature approaches 212° F (or 100° C)—it will stay at that temperature until all the water has boiled away. The same is true as water freezes. As water cools it will reach 32°F (or 0° C) is will stay at that temperature until all the water freezes (Figure 7-12).
When any material is heated to the temperature where it changes state, the temperature will remain the same until all the material changes state. That means ice water will remain at 0° C (32° F) until all the ice is melted. The same thing applies when cooling the materials. The reason is that energy must be expended to change the state from solid to liquid or from liquid to gas. Likewise, energy must be withdrawn to change the state when cooling the material. The amount of energy required is call the latent heat of freezing or boiling. |
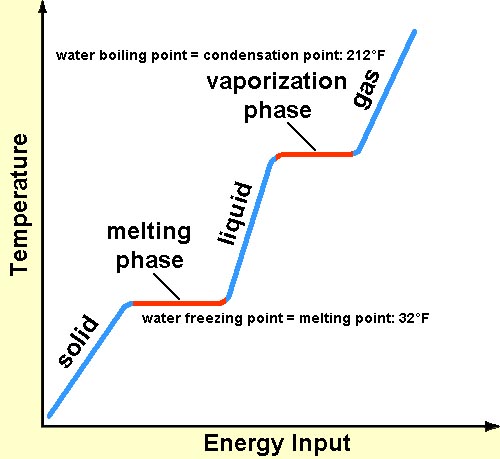 Fig. 7-12. Diagram showing heat required to heat water from solid ice to liquid water and to vapor (steam). It take both specific heat and latent heat, released in stages, to convert ice to steam! |
Specific Heat and Latent Heat Capacity of Ice, Water, and Steam Illustrated: (using charts listed above)Example: How much energy would it require to heat 100 grams of ice at -10° C to steam at 120° C?
|
Energy Associated With Evaporation and Condensation of Water In the Air• Evaporation/vaporization takes a large amount of energy (to break hydrogen bonds). For example, water absorbs energy as it evaporates on your skin. Evaporation on the surface of a swimming pool will cool the water.• Condensation releases a large amount of energy. For example, steam will burn you as it releases energy on your skin. When water vapor in the air condenses to form water droplets in clouds it releases large amounts of energy. As water evaporates into in air it cools the air and increases its humidity. Air at surface conditions can hold up to about 4% water before it becomes saturated and can not absorb more water. As humid air rises it expands and cools and if it reaches the saturation point clouds form as water is forced to condense. The condensation of water releases a lot of energy, heating the air and causing clouds to rise into larger thunderstorms clouds. The water released falls as precipitation. Heat is absorbed as ice melts and it is released as it freezes. The latent heat of water is an important factor in weather systems and the stability of climates around the world. |
 Fig. 7-13. Cloud formation releases heat into the air. Fig. 7-13. Cloud formation releases heat into the air.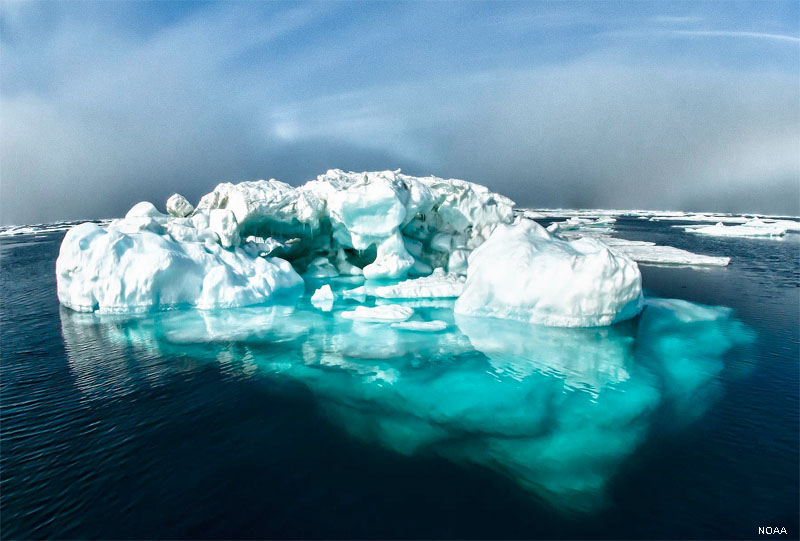 Fig. 7-14. Melting ice absorbs heat from air and water |
SalinitySalinity is a measure of the total amount of solid material (salts) dissolved in water, defined as:Weight (mass) of salt —————————— = Salinity Weight (mass) of water Units are described as: • % is part per hundred (pph) • ‰ is parts per thousand (ppt) • Open ocean seawater ranges is 33 to 37 ‰ ppt. Average is about 35 ‰ (ppt). |
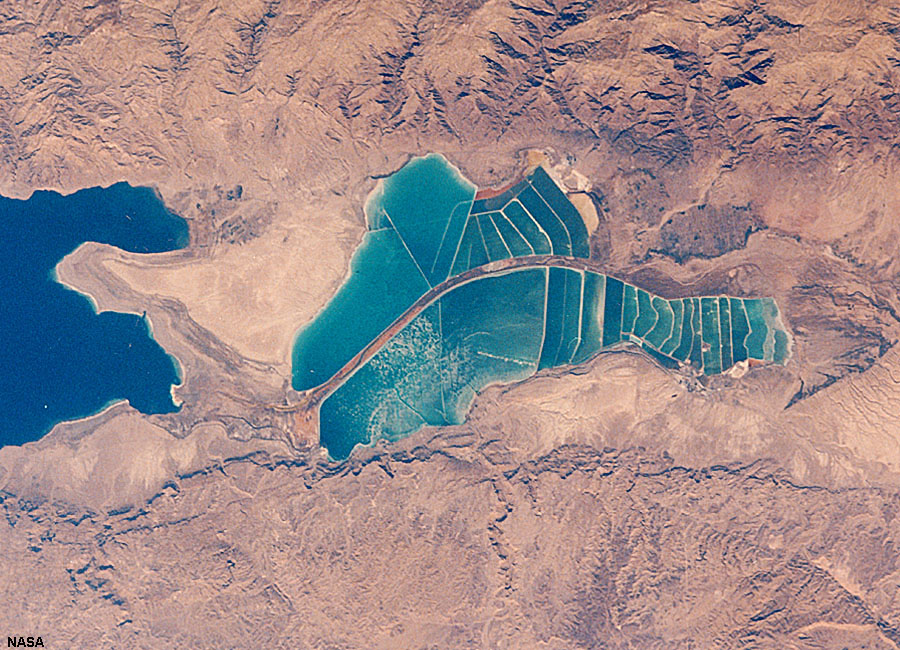 Fig. 7-15. Evaporation ponds constructed near the Dead Sea in Jordan are developed to manufacture salt. |
| Salinity is Measured by: • electrical conductance (higher salinity = higher conductivity) • density (higher salinity = higher density) At room temperature, water can dissolve about 30% of its weight in salt (NaCl). Hot water can hold about 40%. A brine is water that is concentrated with high levels of salt. When evaporation concentrates salty water to it saturation point, salt crystals will precipitate. Note that difference substances have different saturation levels in water. |
Examples: • Spring 0.3 ‰ ppt (fresh) • Tap water 0.7 ‰ ppt (fresh) • Limit on agriculture irrigation - 2 ‰ ppt • Baltic Sea 10 ‰ ppt (brackish) • Black Sea - 18 ‰ ppt (brackish) • Average Ocean -35 ‰ ppt • Mediterranean Sea - 38 ‰ ppt • Red Sea 42 ‰ ppt (hypersaline) • Great Salt Lake 280 ‰ ppt (hypersaline) • Dead Sea 330 ‰ ppt (hypersaline) |
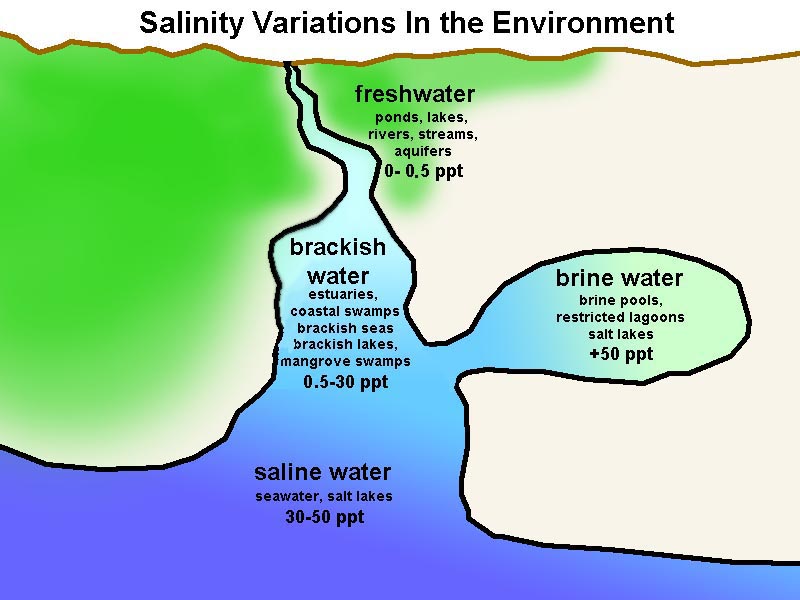 Fig. 7-17. Variations in salinity in the natural environment. |
Evaporation of Seawater Results In Precipitation Of Mineral SaltsAs seawater evaporates in a restricted basin seawater is concentrated becoming a brine. As evaporation proceeds various mineral salts will precipitate out in the reverse order of their solubility. Salty sedimentary deposits produced by evaporation are called evaporites. The first to precipitate is calcite (if not consumed by organisms first). Next come CaSO4 (gypsum and anhydrite varieties). This is followed by salt (NaCl) (mineral name: halite; rock name: rock salt). By volume, NaCl is the most abundant salt from seawater. The last to precipitate are potassium salts (sylvite: KCl and others) and magnesium salts (epson salt: MgSO4 and others). Various other trace salt compounds are concentrated in the last of the brine to evaporate. About 80 different salt minerals have been reportedly found in evaporite deposits. |
 Figure 7-17. Order that salts precipitate from seawater as evaporation proceeds. |
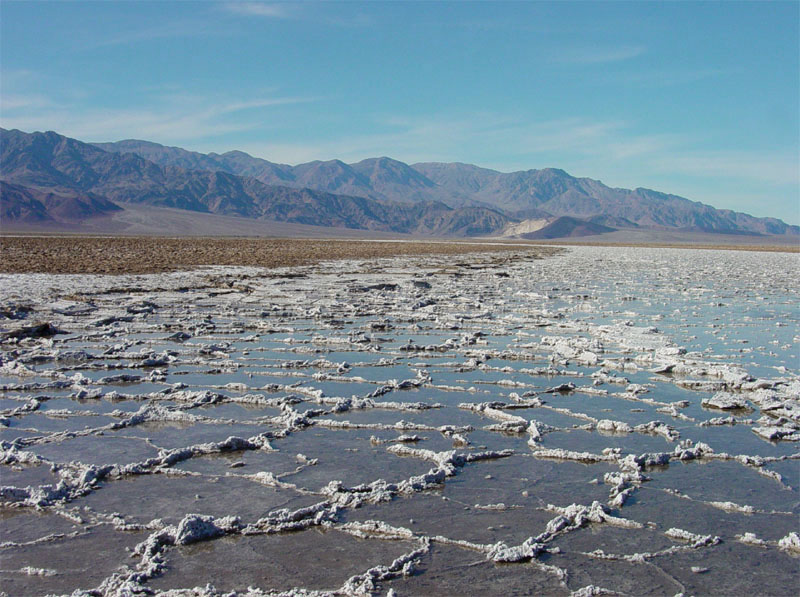 Fig. 7-18. Salts forming from evaporation in Death Valley, California. |
Formation of Sea IceFresh water freezes at 32° Fahrenheit (0° Celsius). Seawater freezes at about 28.4° F (-2 ° C) because of the salt content. However, when seawater freezes, the ice that forms contains very little salt. Only the water part freezes, the remaining salt is concentrated as brine that separates from the sea ice. This process is very important for deep-sea circulation. |
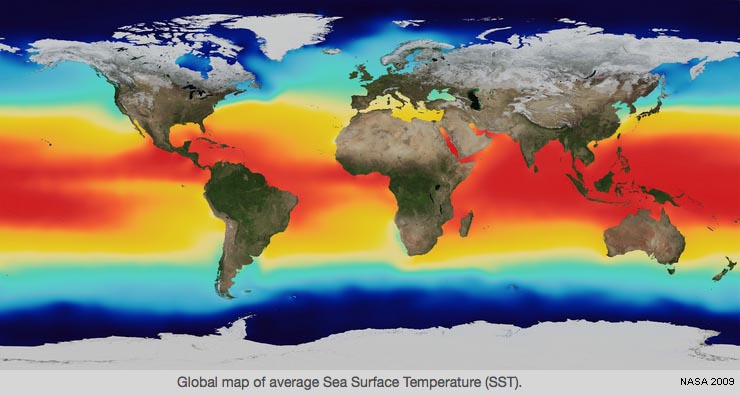
Relationship of Salinity, Density and TemperatureAssuming a closed system...• Temperature and Density: Inverse (as temperature increases, density decreases) • Salinity and Density: Proportional (as salinity increases, density increases) • Temperature and Salinity: None (as temperature changes, salinity remains the same ) |
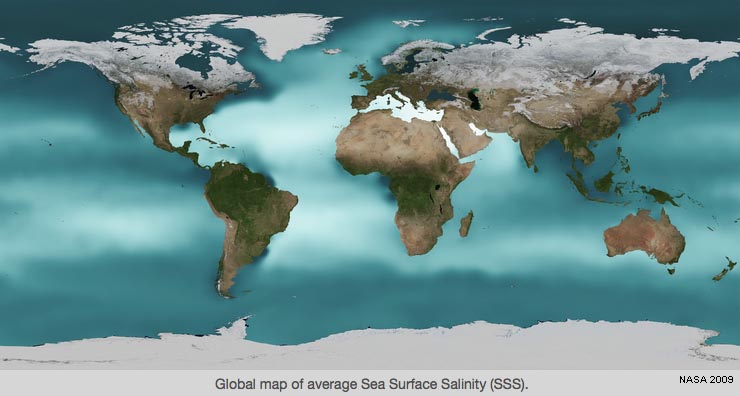
 Fig. 7-19. Sea Surface Salinity Average 2005 |
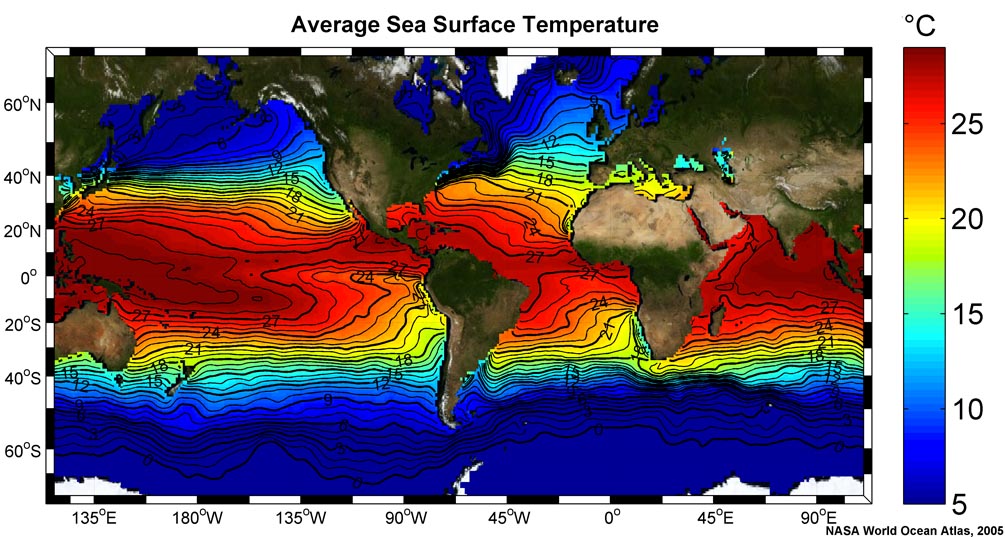 Fig. 7-20. Sea Surface Temperature Average 2005 |
|
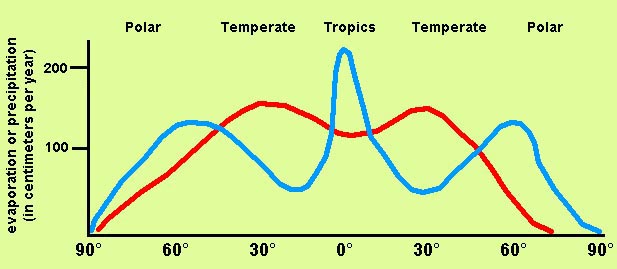
Salinity and LatitudeFigure 7-24 is a map of the globe comparing the rates of evaporation and precipitation. The map is a compilation of evaporation minus precipitation (E-P) values. The data basically shows the regions where there is a net gain of salinity created in surface waters by high evaporation rates. There is also a net loss of salinity where precipitation is higher than evaporation rates (Figure 7-25). In general:• The tropics (equatorial region) is humid and cloudy, and receives much more rain than evaporates. • The temperate regions receive less precipitation, so evaporation dominates. • The polar regions have low evaporation rates relative to the amount of precipitation they receive. |
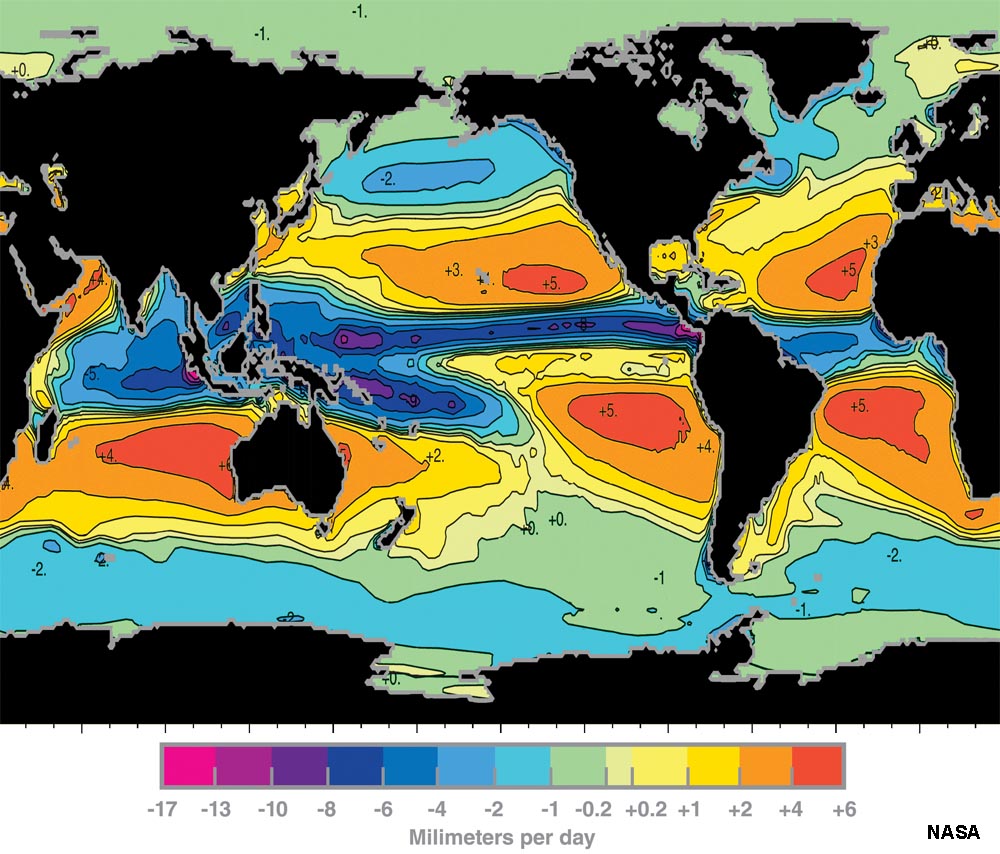 Fig. 7-24. Map of net evaporation minus precipitation (E-P) on oceans. |
|
Variability of ocean salinity: Ocean salinity is stable at depth but can be highly variable at the surface. The upper surface layers of the ocean impacted by wave energy is a mixing zone. Simply this: the more waves, the more mixing. Freshwater is less dense than seawater and without mixing freshwater will float (stratify) on top of seawater. |
 |
||||
|
Fig. 7-25. Evaporation and precipitation curves compared with latitude. |
The "Cline Curves" - changes in temperature, salinity, and density with depth• Thermocline - a steep temperature gradient in a body of water marked by a layer above and below which the water is at different temperatures.• Halocline - a vertical zone in the oceanic water column in which salinity changes rapidly with depth. • Pycnocline - a layer in an ocean or other body of water in which water density increases rapidly with depth. NOAA Animation: Annual changes of pychnocline depth |
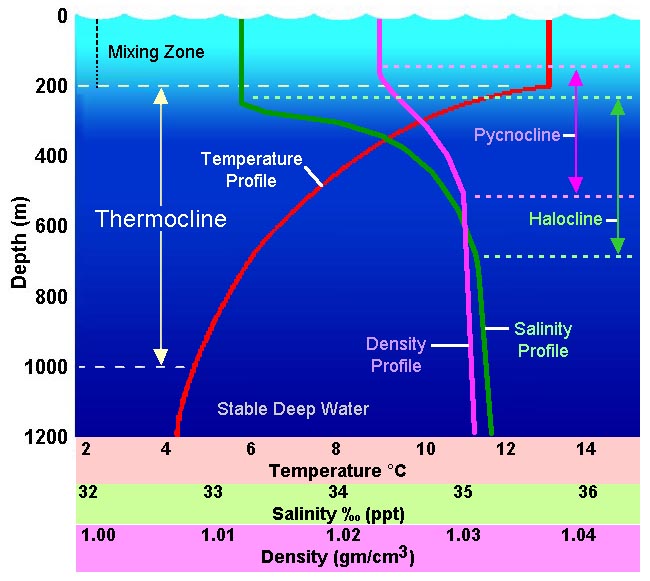 Fig. 7-26. The "cline curves" |
Mixing (Surface) ZoneUppermost water where mixing from currents make temperature, salinity, and density mostly constant.Vertical changes in temperature with latitude: • Polar regions have almost no thermocline. • Temperate regions have weak thermoclines (moderate in summer, less in winter). • Tropical regions have a strong thermocline. |
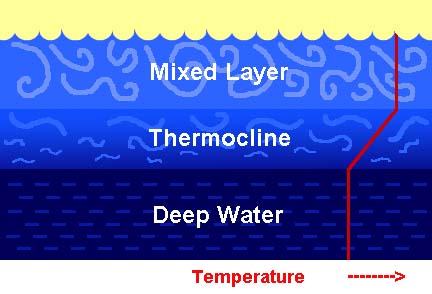 Fig. 7-27. Mixing Zone Fig. 7-27. Mixing Zone |
Gases Dissolved In SeawaterOxygen concentrations (O2) in air is about 21% oxygen, in water it is a tiny fraction of 1%. This large difference in oxygen concentrations forces oxygen to dissolve into water along the boundary between air and water. When wind blows creating waves, it increases the surface area, allowing more diffusion to occur.Carbon dioxide (CO2) is much more soluble in water than oxygen, but concentrations in the atmosphere are comparatively very low. When dissolved in water it becomes a bicarbonate ion (-HCO3), so carbon dioxide readily diffuses into the atmosphere if it is not consumed in the production of calcium carbonate (CaCO3). Biological respiration releases -HCO3 which combines with available dissolved calcium which the organism either excretes or incorporates into its skeletal structure if environmental conditions are warm enough for CaCO3 to persist. One of the gravest concerns about the burning of fossil fuels is that it is increasing the concentration of carbon dioxide in seawater, so organisms that produce carbonate shells and skeletons are negatively impacted. |
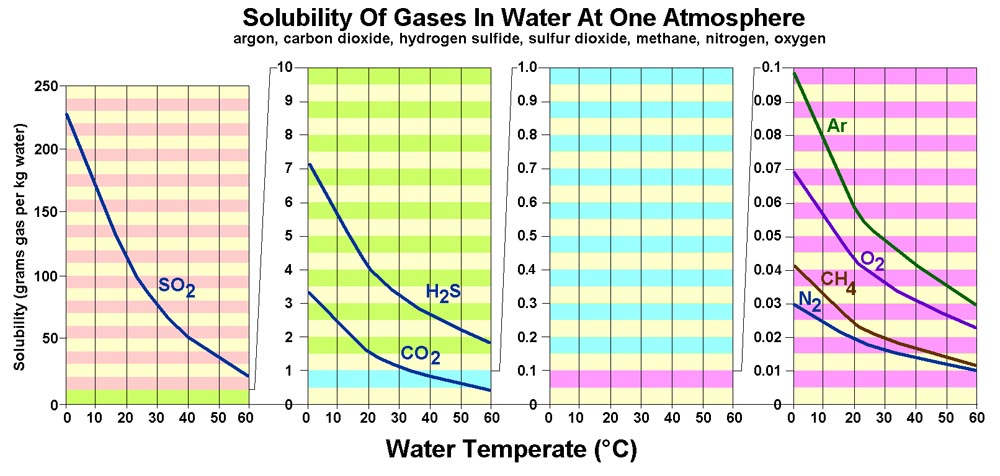 |
| Fig. 7-28. Solubility of gases in water is affected by temperature. Gases are much more soluble in cold water than warm water. In contrast, most solid materials (organic and inorganic; examples salt and sugar) are more soluble in hot water. The solubility of elements in seawater is complex and depends on many factors including pH (acid-base), eH (oxidation-reduction), temperature, pressure, and interactions between other compounds dissolved in seawater. |
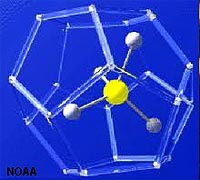
| Methane (CH4) has very low solubility in seawater, however, it is very abundant in sediments rich in organic mater. In cold settings, methane, carbon dioxide, and water form an unusual form of ice called a methane hydrate (Figures 7-29 and 7-30). A clathrate is a compound in which molecules of one component are physically trapped within the crystal structure of another, in this case CO2 and CH4 are trapped in the crystal structure of ice under certain pressure and temperature condition that exist on the seafloor in cold water, mostly on the outer continental shelves and slopes in polar regions. Global warming of the oceans can cause the release of tremendous amounts of CO2 and CH4 from the seafloor, contributing to anoxia conditions, with possible catastrophic consequences. Read about the "Clathrate Gun Hypothesis" (Wikipedia). |
|
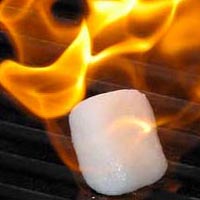 |
| Fig. 7-29. Methane-ice clathrate structure | Fig. 7-30. Methane-ice clathrates will burn! |
|
Sulfur dioxide (SO2) is extremely soluble in water. Sulfur dioxide is a gas that smells like rotten eggs. It is released in large quantities by volcanic eruptions, forest fires, and by burning coal and petroleum. SO2 is extremely soluble in water where it combines with water molecules to form sulfate ions (-HSO4). When concentrated (when water is removed), the solution becomes sulfuric acid (H2SO4). When concentrated by evaporation of seawater (where dissolved calcium and other metallic ions are present) sulfate ions precipitates as the salts gypsum (CaSO4·2H2O), anhydrite (CaSO4), epson salt (MgSO4·7H2O), and other salt minerals. |
 |
| Fig. 7-31. Gypsum |
Seawater AlkalinityAlkalinity is a measure of the ability of seawater to neutralize acids. The animation below shows satellite imagery captured between 2011 and 2015 that shows the variation of the total alkalinity as it changes over time in locations around the globe. Why is alkalinity so important to study? Most organisms that live in the ocean have a "tolerance range" of about how much acid waters they can survive. Most shelled organisms that have calcareous (CaCO3) shell material, weather from microscopic calcareous plankton to organisms with sea shells, to large carbonate reef require a higher pH (higher alkalinity) to survive (Figure 7-32). Average seawater has a pH of about 8.1 (slightly alkaline). Unfortunately, higher concentrations of carbon dioxide (CO2), sulfates (SO2), and other organic acids that are introduced into seawater lower the pH, reduces the ability of organism to produce shell material. |
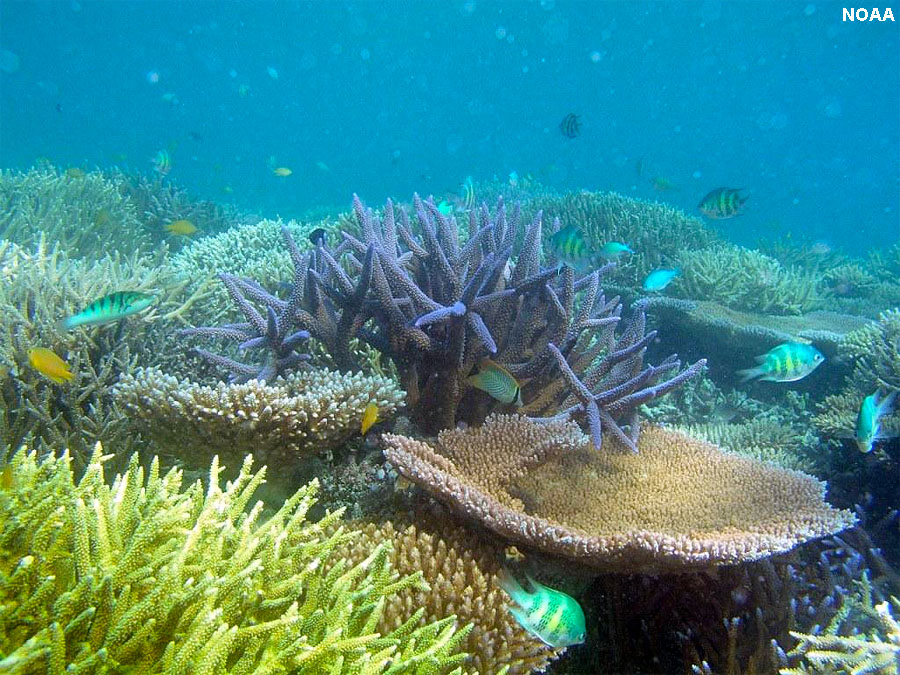 Fig. 7-32. Calcareous organisms like reef corals or invertebrates with shells need higher alkalinity to produce calcium carbonate (CaCO3) in order to live and reproduce (survive). Seawater temperature also impacts how shell material can form or dissolve. |
Local Conditions in San Diego region• In San Diego, we have a temperate thermocline, which is weak in the winter and fairly strong in the summer.• During El Niño years we may get a strong thermocline all year. • California's weather patterns are cyclical on multi-year periods of rain and drought. Figure 7-33 shows California's annual precipitation 1895 to 2014. As of fall, 2021, California is experiencing the worst drought in the period records have been recorded. |
 Fig. 7-33. California's precipitation history. |
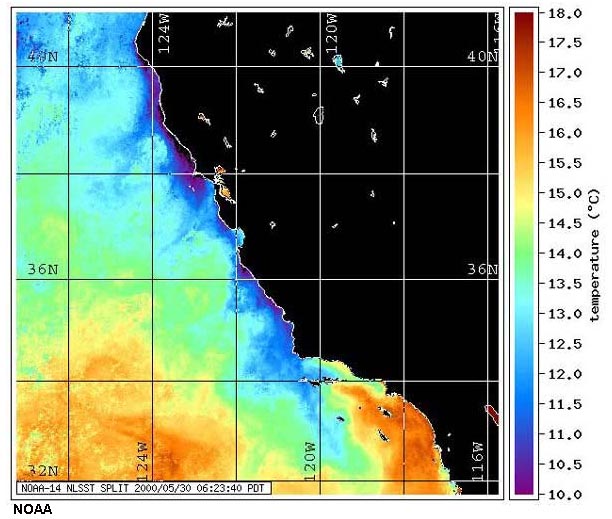 Fig. 7-34. SoCal ocean temperatures (5/30/2000). |
| Chapter 7 quiz questions |