
Oceanography 101 |
Return to class home page |
Chapter 13 - Primary Production of Life in the Oceans |
Primary ProductionPrimary productivity is the rate at which energy is converted to organic substances in a region or ecosystem.Energy is converted through autotrophic (self-feeding) organisms, converting solar or chemical energy into biomass. Basically, primary production is generation of food by making organic matter from inorganic matter. Primary process is photosynthesis (in shallow surface waters), and small amount from chemosynthesis (at deep sea vents and underground). Solar energy is the primary source of energy in the production of biomass in the global oceans, with comparatively trace amount coming from chemosynthetic sources. |
Click on thumbnail images for a larger view. |
 Fig. 13-1. Solar energy is the main source of energy in ocean primary production. |
| Note: The contents of this chapter and following chapters follow the essential concepts of the evolution of life on Earth as presented in Chapter 2. |
Trophic PyramidsA trophic pyramid exemplifies feeding levels within an ecosystem.There are three major categories of living organisms in an ecosystem and each has a special role: producers (plants), consumers (animals), and decomposers (and detritus feeders).
A “food chain” is a hierarchical series of organisms each dependent on the next as a source of food. A “food web” is a system of interlocking and interdependent food chains. Note: food chains range from simple to complex! For instance, larvae of some organisms may start as primary consumers but rise to secondary levels as they mature. |
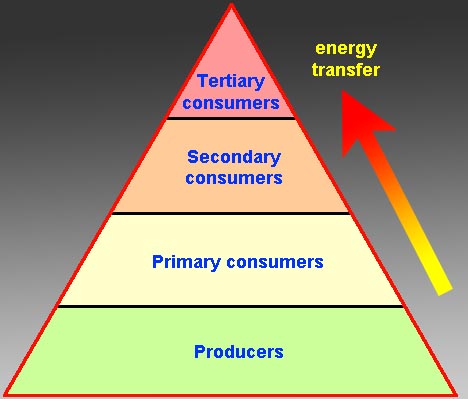 Fig. 13-2. Trophic pyramid 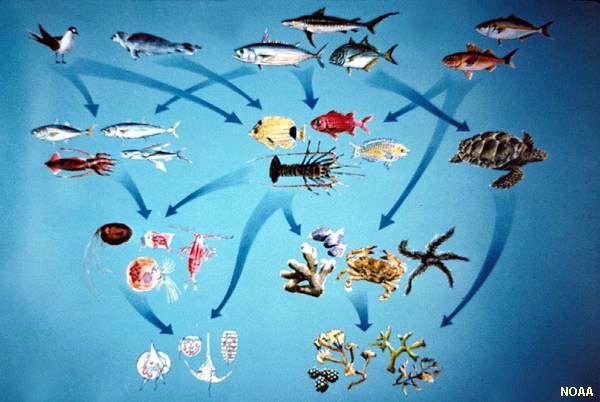 Fig. 13-3. Food chains and food webs in the oceans. |
All living things rely on the continual uptake of organic compounds from their environment. These compounds are used to provide energy both for biosynthesis (the production of a chemical compounds by a living organism) and metabolism (the processes that drives cellular activity and to generate carbonate skeletons). The first organisms on the primitive Earth had access to an abundance of the organic compounds in the young oceans and continents. However, most of these original compounds were used up billions of years ago. Through evolution over time, today, the vast majority of the organic materials required by living cells are produced by photosynthetic organisms, including many types of photosynthetic bacteria, green algae, and plants. |
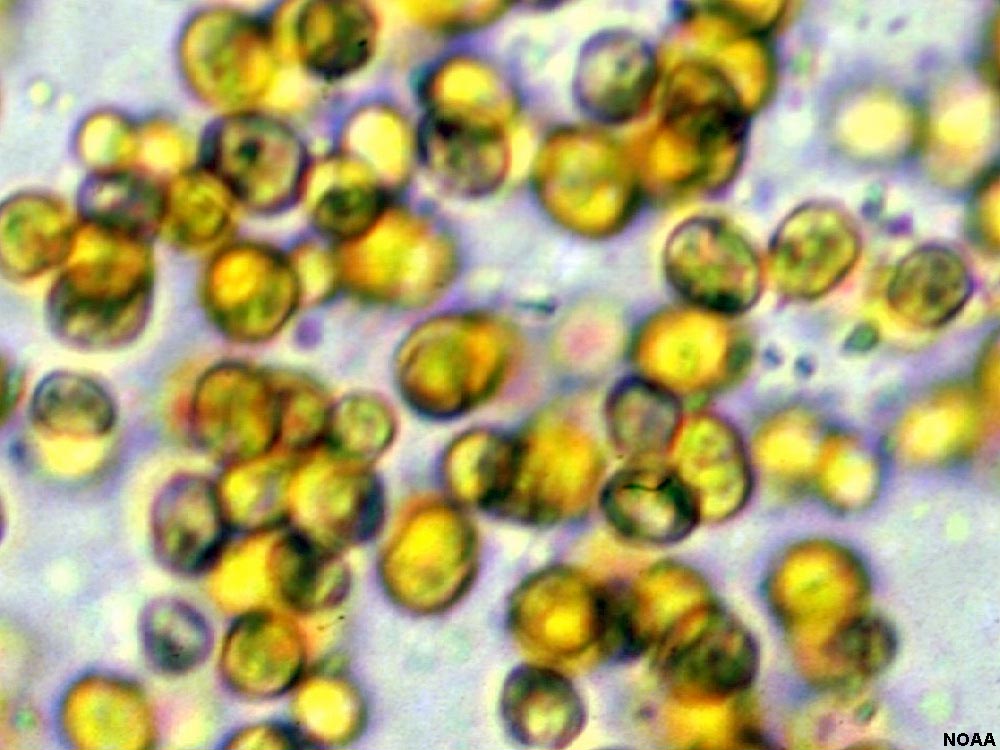 Fig. 13-3. Green algae cells. |
PhotosynthesisGreen plants, algae, and some bacteria use sunlight to synthesize foods from carbon dioxide and water. These organisms thrive with sunlight with minimal nutrient requirements. They use water and the energy of sunlight to convert atmospheric CO2 into organic compounds—a process called carbon fixation. A bi-product is oxygen (O2) released into water, and eventually, the atmosphere.Photosynthesis in plants generally involves the green pigment chlorophyll (but also other colors and compounds) and generates oxygen as a byproduct. The process is: 6 H2O + 6 CO2 = C6H12O6 (glucose) + 6O2 In the oceans, photosynthesis is completed by microscopic and macroscopic plants. |
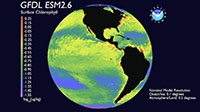
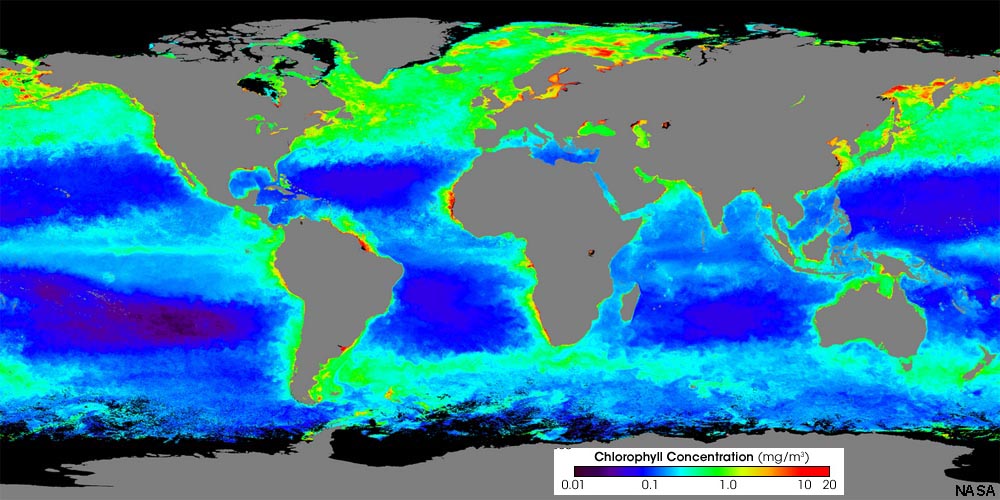 Fig. 13-4. Average sea-surface chlorophyll concentrations around the world (1998-2006). Most productivity is near coasts. |
Ocean Model of Chlorophyll Productivity (biogenic organic matter) observed from NOAA satellite data This animation illustrates the hourly outgoing long-wave radiation (OLR) field from a NOAA satellite data. The model shows the daily model output of surface chlorophyll is animated and shown globally. This animation highlights the models ability to simulate a biological quantity which has global ramifications on the physical and biological climate systems. |
 Click on image to start video. |
Microscopic Plants: PhytoplanktonPhytoplankton means “floating plants.” Over 90% of the worlds food (carbohydrates) come from phytoplankton. It is the single most important process for life and the production of food on Earth.Types of phytoplankton include bacteria, protists, and single-celled plants. Primitive photosynthetic bacterial appear in the fossil record about 3 billion years ago. Their oxygen production is what made life possible for aerobic organisms (particularly animals) to evolve. |
 Fig. 13-5. Phytoplankton. |
Photosynthetic BacteriaBacteria are very small in size, and many varieties. Some have evolved to be capable of photosynthesis (called photosynthetic bacteria). They contribute a large amount to primary production in certain parts of the oceans, and maycontribute up to 50% of the world's biomass. Cyanobacteria (commonly called called blue-green algae) are photosynthetic algae common in marine and freshwater environments. Cyanobacteria contain chlorophyll while other forms of bacteria contain bacteriochlorophyll. Although bacteriochlorophyll resembles chlorophyll, it absorbs light of a longer wavelength than chlorophyll. Common kinds are cyanobacteria in the marine environment include golden algae and green algae. |
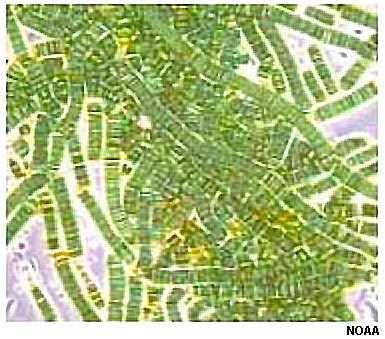 Fig. 13-6. Cyanobacteria Fig. 13-6. Cyanobacteria |
Golden AlgaeGolden algae are characterized by the presence of the pigments chlorophyll, carotene, and xanthophyll, which impart yellow-brown to golden colors. the name golden algae encompasses nearly three dozen genera, and over a thousand species in oceans and bodies of water worldwide. The dominant types of golden algae in the marine environment include diatoms, coccoliths, and dinoflagellates.Diatoms: (from Greek diatomos meaning "cut in two”) Diatoms are the most productive in the oceans. They have skeletal cell walls (tests) composed of silica and thrive mostly cooler waters. Their tests come in a variety of shapes but has a top and bottom that fit together like a shoe box and a single cell in the “box” (Figure 13-7). Nutrients and waste are pushed through the test perforations. Diatoms are the chief component of siliceous ooze throughout ocean basins. Diatomaceous earth (or diatomite) is a naturally occurring, soft, siliceous sedimentary rock that is easily crumbled into a fine white to off-white powder used in filters and manufacture of glass and ceramic products. Coccoliths (coccus-berry, lithos-stone)(also called coccolithopores): These produce less than the diatoms. They have a calcareous shell that is made up of a number small individual round plates (Figure 13-8). Coccoliths have calcareous tests prefer warmer waters. Coccoliths are the prime component of calcareous ooze which becomes the sedimentary rock: chalk. Dinoflagellates (dino-whirling flagellum-whip) (Figure 13-9): These have cellulose tests which are biodegradable (typically not preserved in marine sediments). They also have a small whip-like tail which provides a small means of locomotion. These are the critters that produce red-tides or harmful algae blooms (HAB). |
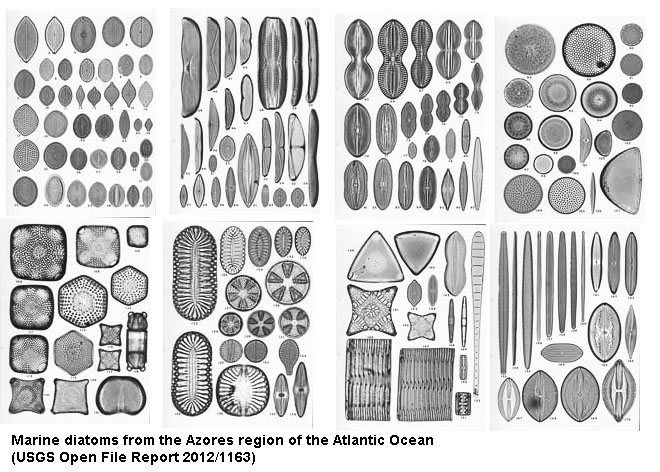 Fig. 13-7. Diatoms have siliceous tests and prefer colder water settings. 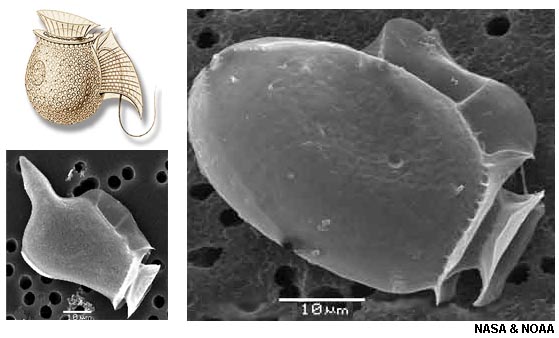 Fig. 13-9. Dinoflagellates have whip-like appendages that help propel them through the water. |
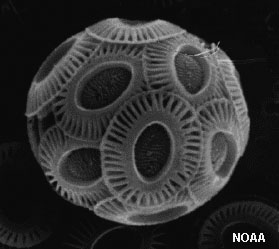 Fig. 13-8. Coccoliths have calcareous tests and prefer warmer water settings. 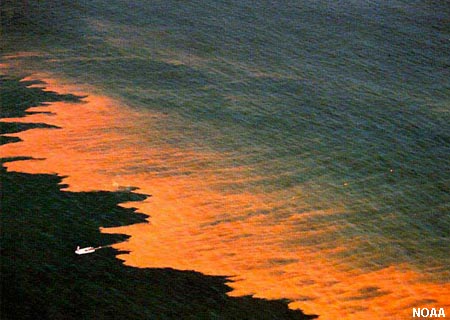 Fig. 13-10. A red tide or better, a harmful algae bloom (HAB) are caused by a bloom in dinoflagellates. |
Green algae (and plants, which share ancestral roots) developed much later, and utilize chloroplasts—internal organelles that use “chlorophyll” (photosynthetic compounds) that produce sugars for metabolism. Chloroplasts are thought to have evolved by through symbiosis between primitive (and ancient) cyanobacteria and other eukaryotic cells. For instance, lichens are a combination of a symbiotic algae and a fungus. Mitochondria in cells are also an example of ancient symbiosis of ancient bacteria. Photosynthesis is the mechanism for organisms to first thrive in the oceans, and eventually on land. |
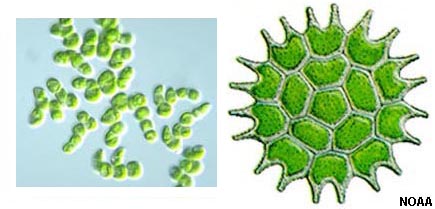 Fig. 13-11. Planktonic green algae has chloroplasts. |
Macroscopic Marine Algae (Seaweeds)Although in terms of ocean biomass, they are relatively insignificant compared to microscopic planktonic forms, however, they fill important niches is marine ecosystems, often found attached to the seabed offshore or extending up into the intertidal zone.Brown algae: Occur in temperate or cooler waters. Kelp and Sargassum are examples. Can be attached to bottom like kelp or encrusting mostly in the intertidal zone. The Sargasso Sea in the North Atlantic gets its names for large patches of sargassum floating in the open ocean. Green algae: Mostly attached to bottom. Sea lettuce, sea grass, and dead mans fingers are examples. Red algae: These are encrusting or sometimes branching in the near-shore environment. Very hardy. |
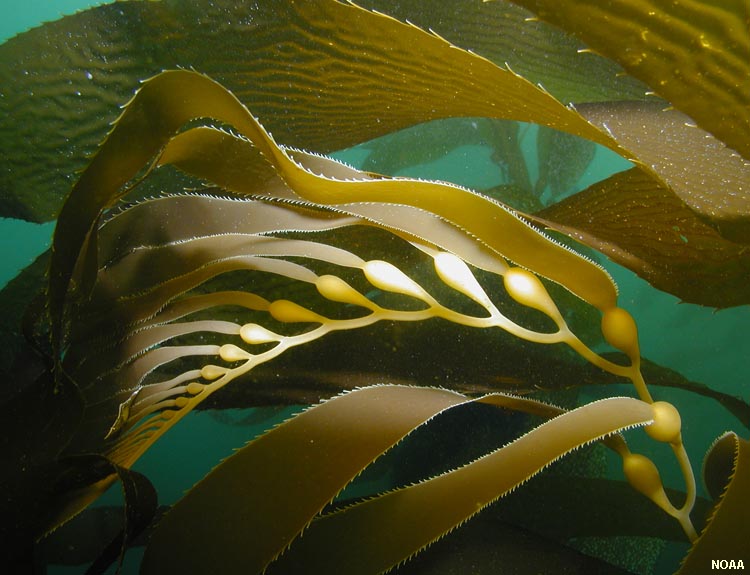 Fig. 13-12. Kelp 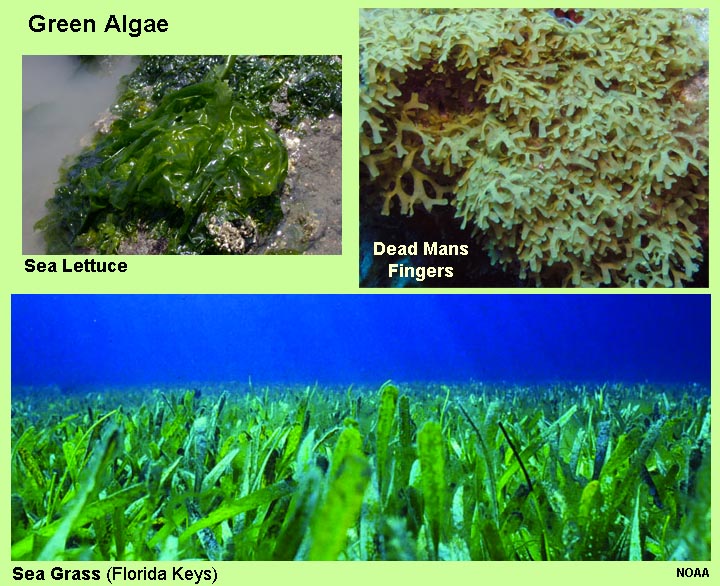 Fig. 13-14. Green algae Fig. 13-14. Green algae |
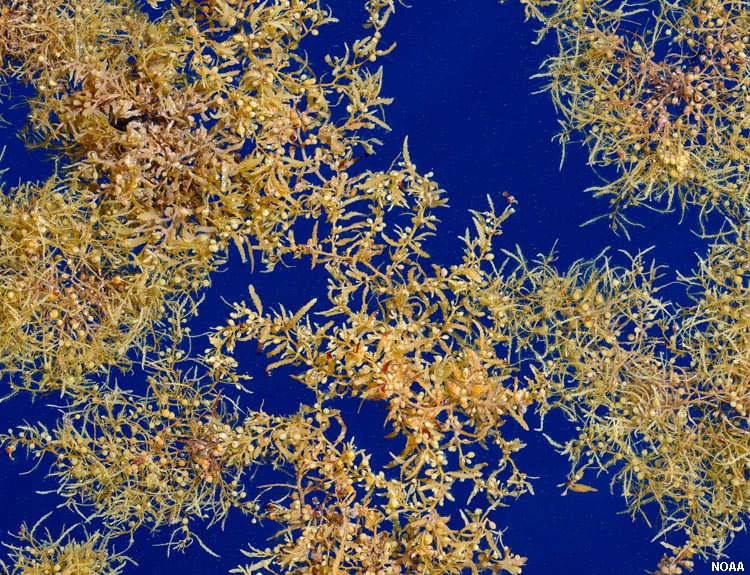 Fig. 13-13. Sargassum 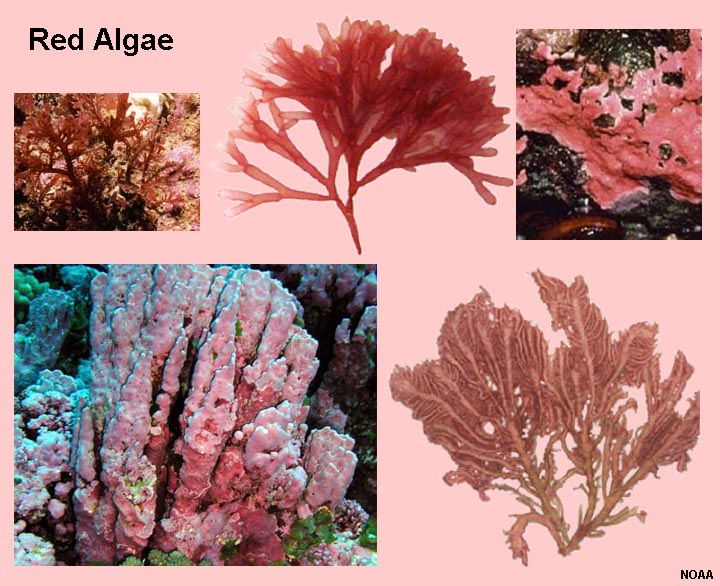 Fig. 13-15. Red algae |
Marine PlantsSome plants have adapted to transitional marine environments (being salt tolerant). Examples include eel grass, prickleweed, and mangroves.Eel grass is common in protected lagoons and estuaries. Pickleweed is abundant here in California covering tidal flats in protected bays and lagoons. Mangroves are common in tropical regions. |
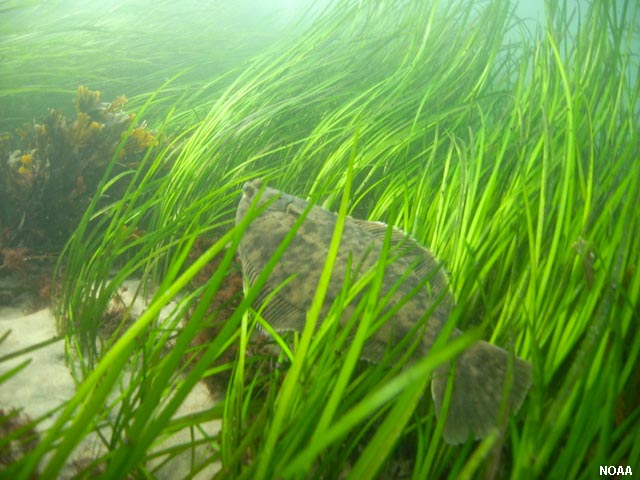 Fig. 13-16. Eel grass |
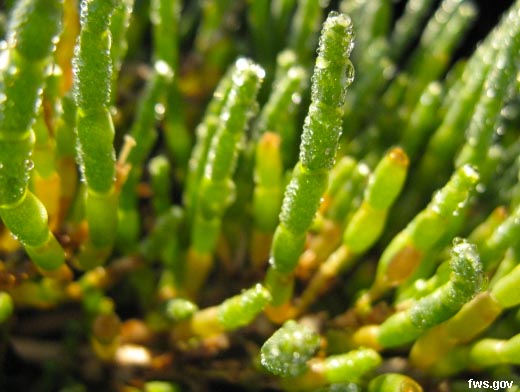 Fig. 13-17. Pickleweed |
 Fig. 13-18. Mangroves |
Factors influencing Primary ProductionSunlight and Nutrient AvailabilitySunlight penetration decrease with depth; it is impacted by water clarity (turbidity).The Epipelagic Zone is also called the Euphotic Zone (where sunlight penetrates, Figure 13-19). The euphotic zone extends downward around 200 meters in the open ocean, but varies with seasonal changes in turbidity. This zone is also called the neritic zone on continental shelves and the epipelagic zone in open ocean settings. The euphotic zone where all photosynthesis takes place. It is also the part of the ocean most likely to have a thermocline is mostly above the oxygen minimal zone (OMZ). Compensation Depth: where respiration (consumption) equals photosynthesis production. The compensation depth is depth at which the light intensity is just sufficient to balance between the amount of oxygen produced and consumed by algae (typically a depth where only 0.1-1% of solar radiation penetrates). The compensation depth varies with latitude, water clarity, and nutrient availability. Nutrients: These are not like food, they are more like a fertilizer. Major nutrients in need for biological activity include nitrogen, phosphorus, and silicon, iron, zinc, and copper. Organic compounds including vitamins are also essential. However, some nutrients can become toxic if concentrations become too high. Sources of nutrients include: * Upwelling from deep ocean (particularly nitrates and phosphates) * Rock weathering (minerals provide iron, silica, and other element) * Decaying organic matter (releases elements and vitamins back into seawater) Human activities are also creating artificial sources of nutrients: Agriculture (fertilizers) and pollution (sewers, etc.) |
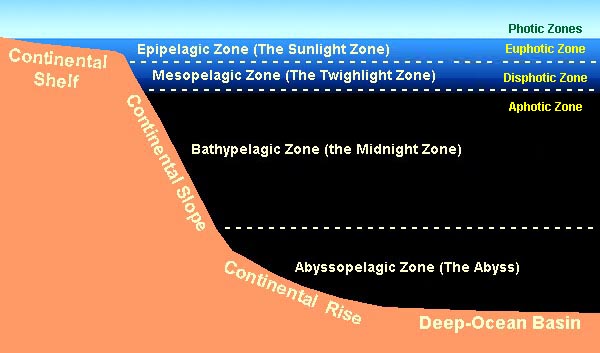 Fig. 13-19. Pelagic zones in the oceans  Fig. 13-20. Energy and nutrient transfer through ecosystems. 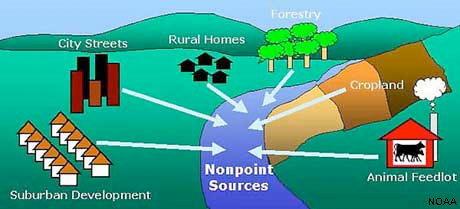 Fig. 13-21. Sources of ocean pollution. |
Measuring Primary ProductivityPrimary Productivity is measured in biomass or in gC/m2 day (or grams of carbon per square meter per day).Ocean biomass is measured by pulling fine nets to catch plankton and weighing/examining catch (however, smallest organisms pass through nets). Ocean biomass is also measured by satellite: 2 dimensions (i.e.: square meters per day). Satellites can detect levels of chlorophyll in seawater, but not far below the surface.
|
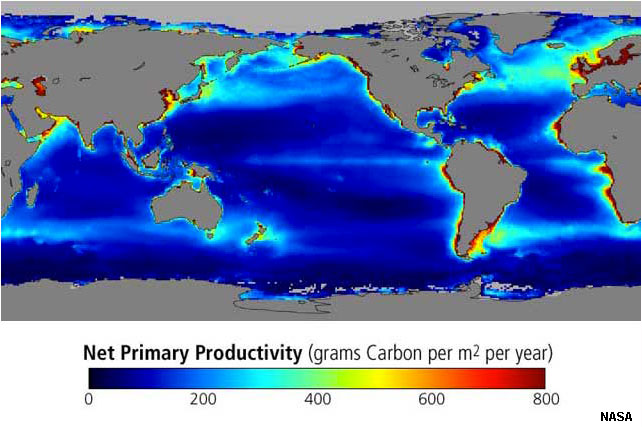 Fig. 13-22. Net productivity in the oceans as observed from satellite data. Net primary productivity is measured in kilograms of carbon per meter2 per year. |
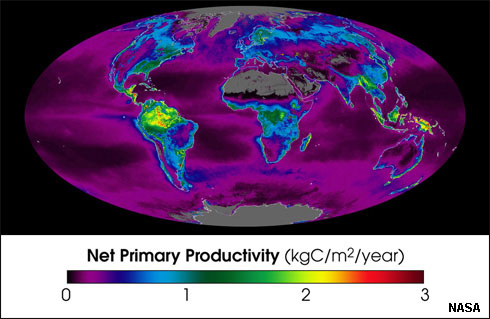 Fig. 13-23. Net productivity is much greater on land (in tropical forested regions) than in the oceans, but the oceans cover a vastly larger area. |
Global and Seasonal Distribution of Plankton BiomassFigure 13-22 shows the net productivity of the oceans observed from satellite data. Figure 13-23 compares ocean productivity to regions on vegetation cover on land. In general, plants on land have access to more concentrated light, but the availability of water and nutrients are a factor of climate and geology. Although tropical forests account for a large volume of biomass, the volume is a fraction of the amount of biomass in the oceans because of the differences in surface area. Productivity in the oceans are influenced by atmospheric and oceanographic factors:Tropics: Reliable sunlight but the strong tropical thermocline prevents mixing of cold deep nutrient rich water. The warm water on top is too buoyant. The exception to this are coral reef areas. Temperate: Reliable sunlight and weak thermocline. Most productive zone. In California we get lots of production in the winter as that’s when we get upwelling from our coastal winds. Polar regions: Lots of nutrients little or no thermocline. Sunlight limited only in the few months of summer, but is highly productive. |
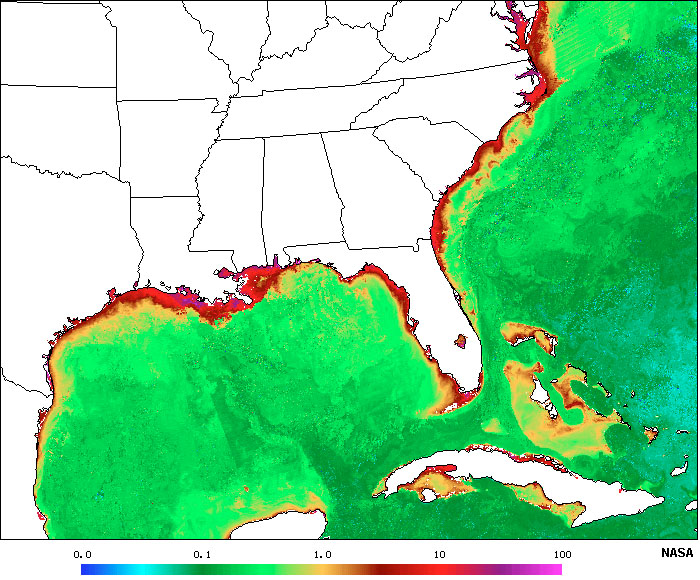 Fig. 13-25.Productivity along the East Coast. 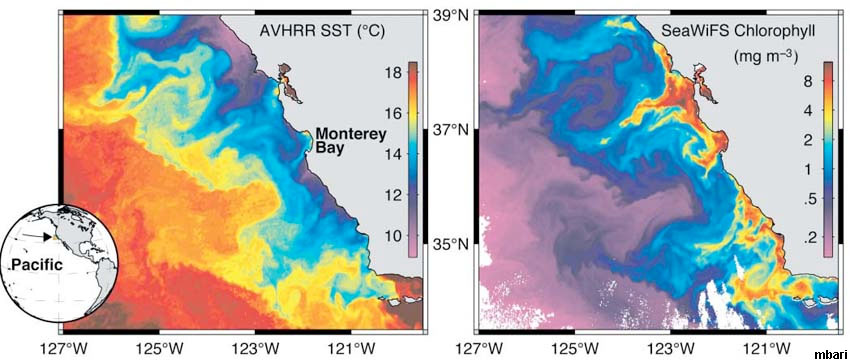 Fig. 13-26. Productivity along coastal California |
Examples of Satellite Evaluations of Ocean ProductivityFigure 13-25 is a satellite composite image showing the Gulf of Mexico and East Coast of the United States. Warm water at the surface creates a strong thermocline preventing nutrient upwelling in the open ocean. However, nutrients from rivers and stream are abundant along coastal waters, allowing phytoplankton to proliferate.Figure 13-26 compares sea-surface temperatures to chlorophyll productivity, revealing regions of upwelling along coastal California. (Figure 13-27 shows an image generated from data captured by NASA’s Aqua satellite used a Moderate Resolution Imaging Spectroradiometer (MODIS). It shows a massive phytoplankton bloom off of the Atlantic coast of Patagonia (Argentina). Seven different spectral bands (visible light and infrared) were used to accent the differences in the plankton communities in the ocean (this is a false-color composite image). These green and blue shades indicate phytoplankton blooms developed on the continental shelf off of Patagonia. This is where warmer, saltier coastal waters and currents from the subtropics meet the colder, fresher waters flowing up from the south. Where these currents collide turbulent eddies form, allowing nutrients to well up from the deep ocean. In addition, the nearby Rio de la Plata supplies nitrogen and iron-laden sediment into the sea just north of the area shown in the image. |
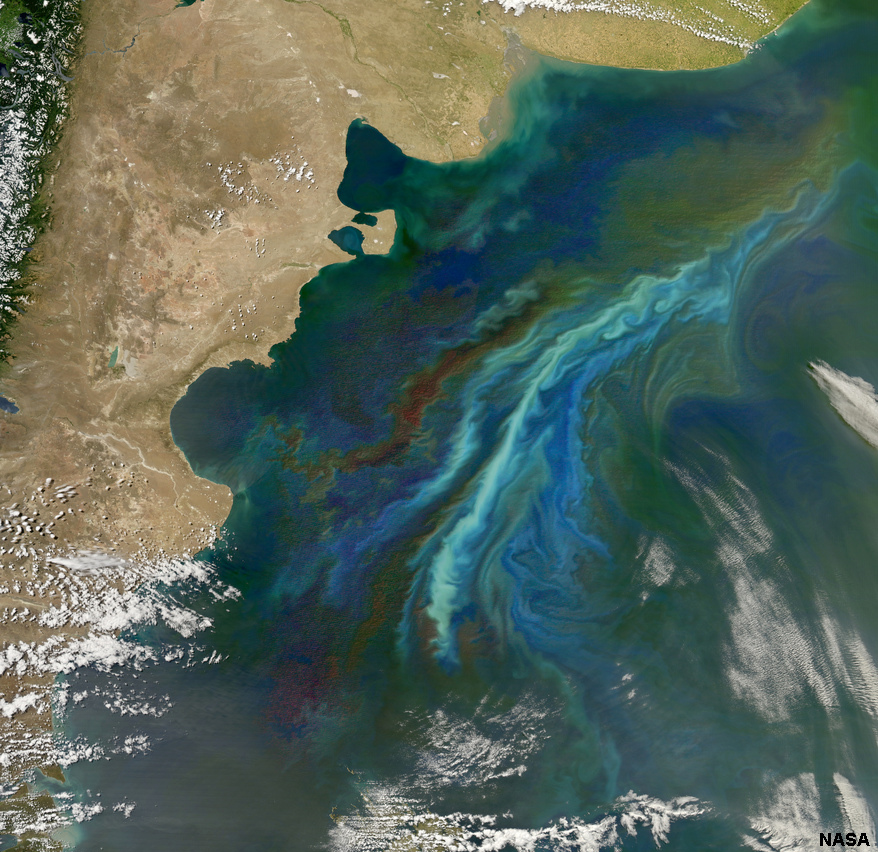 Fig. 13-27. Phytoplankton blooms off of Patagonia (Argentina). |
| Chapter 13 quiz questions |