
Oceanography 101 |
Return to class home page |
Chapter 11 - Tides |
Tides are one of the most reliable and predictable phenomena in the world. What are tides and how they are created?Tides are cause by the gravitation pull of extraterrestrial objects, the Sun and Moon being the most significant tidal forces on planet Earth. Tidal forces can affect crustal rocks and especially water (oceans and great lakes). Water will flow in the direction of gravitational pull. However, because the earth is rotating, this gravitational pull is constantly changing causing daily tide cycles.Tides are very long-period waves that move through the oceans in response to gravitational forces exerted on the oceans by the Moon and Sun. Both the solid Earth and the oceans are impacted by tidal forces, but oceans can move because they are fluid. Tidal forces create bulges on the ocean surface (Figure 11-1). The largest tidal effect is from the Moon due to its proximity to Earth; a
smaller tidal effect is from the Sun. The sun's gravitational pull on the Earth is about half (~44%) of the moon's gravitational pull. Tides arise in the oceans and move toward the coastlines where they appear as the daily rise and fall of the ocean surface. Large lakes can have tides, but they are small because of the comparatively small volume of water. A tidal range is the difference in height between the highest high water (HHW) and the lowest low water (LLW) (Figure 11-2). Tidal ranges vary from region to region, influenced by the geography of coastlines. |
Click on thumbnail images for a larger view. |
 Fig. 11-1. Tidal bulge from the gravitational attraction of Earth, Moon, and Sun |
|
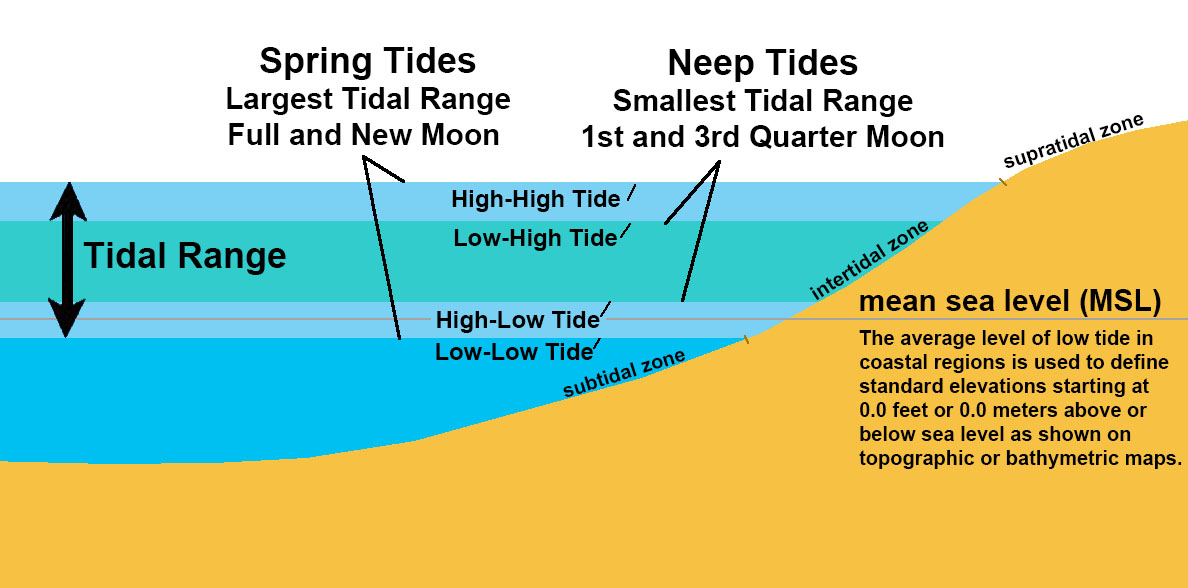 Fig. 11-2. Tidal range is the distance between average highest and lowest tides. |
|
Tidal CurrentsAn incoming tide along a coast is called a flood current; an outgoing tide is called an ebb current. The strongest currents usually occur near the time of the highest and lowest tides. The tidal currents are typically weakest midway between the flood and ebb currents and are called slack tides.Daily tides move vast quantities of water along coastlines, filling in and emptying coastal bays and estuaries, flushing out stagnant waters, and moving nutrients in and out. The ebb and flood tides cause rivers in delta regions to reverse their flow directions and bring in seawater to mix with freshwater (creating brackish waters). The speed of tidal currents can reach up to several miles per hour. |
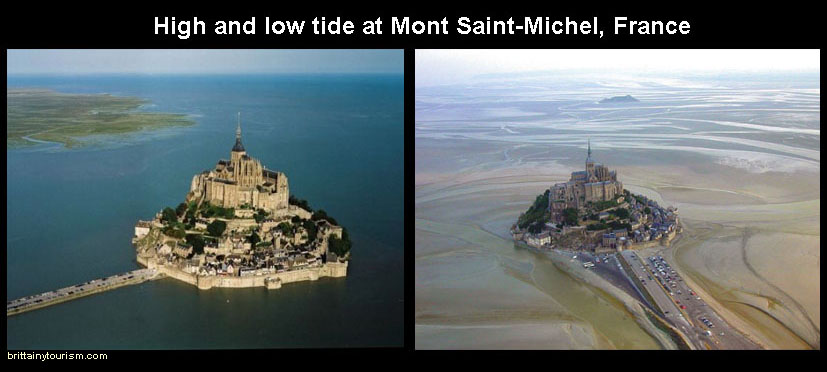 Fig. 11-3. Tides and tidal flats at Mont Saint-Michel, France, a region with a high tidal range. |
Phases of the Moon and TidesTides are periodic short term changes in the elevation of the ocean surface caused to the gravitational attraction of the Moon and Sun, AND the rotational motion (inertia) of the of the Earth. The gravitational pull of the Moon is slightly stronger than the Sun. However, sometimes the gravitational forces of the Sun and Moon join together to make higher tides (Figure 11-4).Spring Tides and Neap Tides* During full moon or new moon phases, the gravitational forces of the Sun and Moon are maximized, producing very large ranges of tidal highs and lows called spring tides (Figure 11-5). During a full moon, the Earth and the Sun and Moon are approximately aligned, producing very large ranges of tidal highs and lows (spring tides).* During the quarter moon phases, the gravitational forces of the Sun and Moon are at their minimum, producing very small ranges of tidal highs and lows (neap tides). A neap tide is the lowest level of high tide; a tide that occurs when the difference between high and low tide is least. Neap tide comes twice a month, in the first and third quarters of the moon. During the quarter moon phase, the gravitational forces of the Sun and Moon are at their minimum, producing very small ranges of tidal highs and lows (neap tides).
|
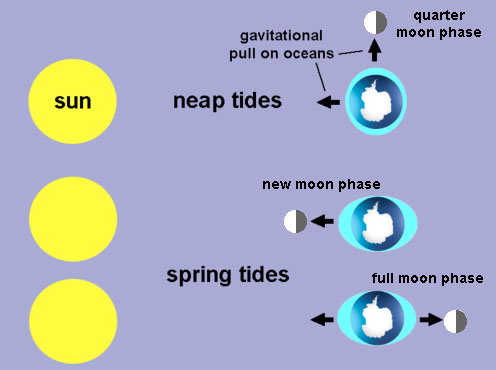 Fig. 11-4. Spring and neap tides are related to the orientation of the Earth, Moon, and Sun (note polar orientation in this view). 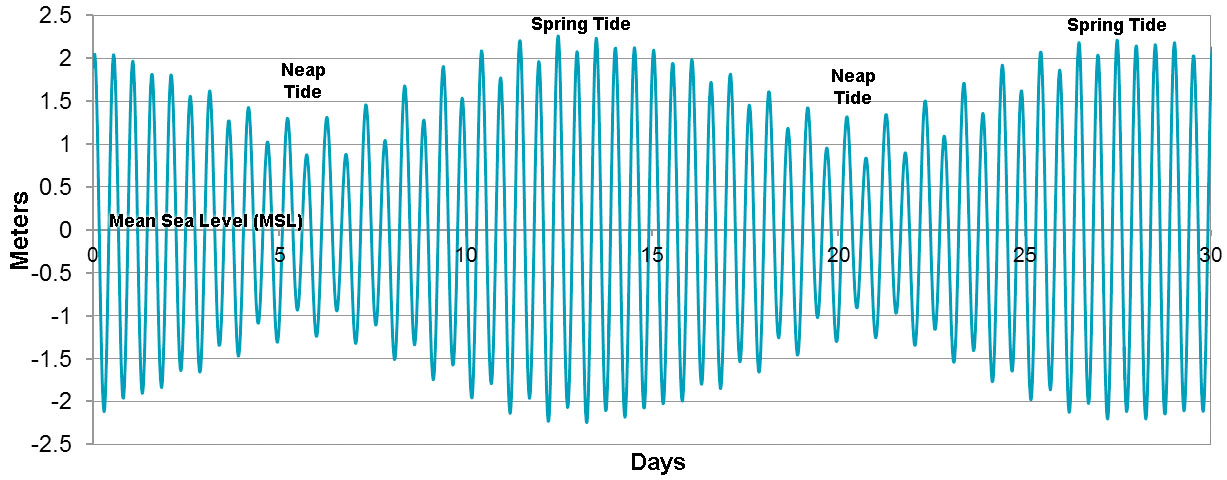 Fig. 11-5. Monthly tidal cycle showing spring tides and neap tides. |
The Effects of Elliptical Orbits of Earth and Moon On TidesIt take the Earth 365.242 days for the Earth to orbit the Sun. The Moon completes one orbit around the Earth in 27.3 days (called the sidereal month). However, due to the Earth's motion around the Sun it has not finished a full cycle until it reaches the point in its orbit where the Sun is in the same position (29.53 days) - this is the time from one full moon to the next.However, both the Earth and the Moon have orbits that are slightly elliptical (not circular). This has an influence on the intensity of tide cycles (Figure 11-6). Perigee is when the Moon is closest to the Earth. Apogee the Moon the farthest from the Earth. Perihelion is when Earth is closest to the Sun (in early January). Aphelion Earth is farthest from the Sun it is called (in early July). Because the Moon has a greater influence on tides, the highest tides happen at perigee when there is a full or new moon. This happens a couple times a year and are called king tides. King tides occur when the Earth, Moon and Sun are aligned at perigee and perihelion, resulting in the largest tidal ranges seen over the course of a year. |
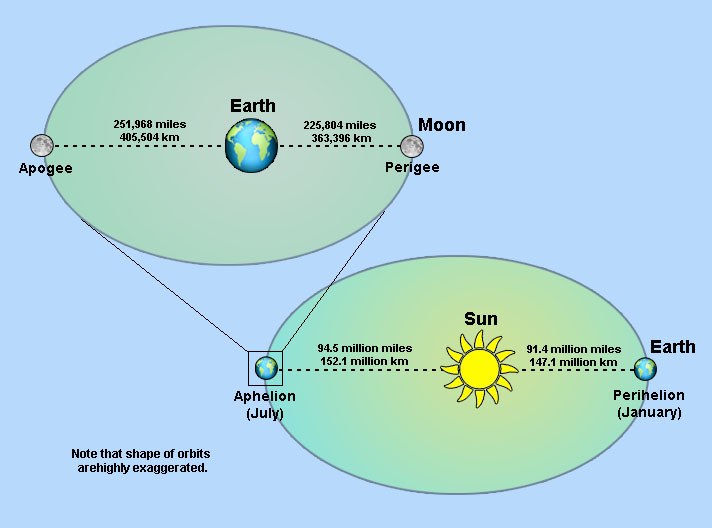 Fig. 11-6. Effects of elliptical orbits. |
Types of Tidal CyclesIf the Earth were a perfect sphere with no continents, all parts of the planet would have two equally proportioned low and high tides every lunar day as the Earth rotates. However, the large continental land masses block the westward movement of the tidal bulges. This blocking of the tidal bulges results in the development of complex tidal patterns within each ocean basin. As a result, different parts of ocean basins have different types of tides (Figures 10-7 and 10-8).
|
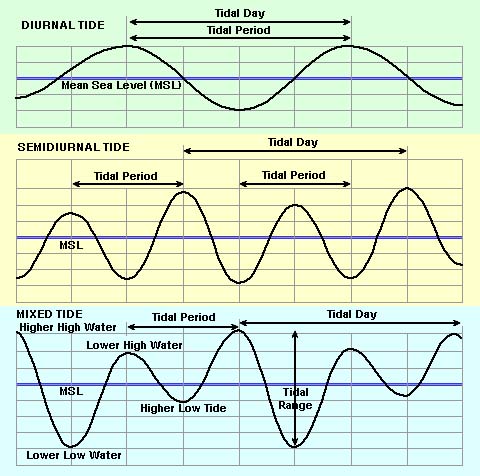 Fig. 11-7. Tidal curves for diurnal, semi-diurnal, and mixed tides. |
Regional Tidal VariationsTidal ranges vary considerably around the world and are influenced by factors including shoreline and continental shelf geometries, latitude, size of the body of water, and other factors (Figure 11-8). For instance, the equatorial regions have very minimal tides compared with higher latitudes. Like all ocean currents, tidal currents are influenced the influence of the Coriolis effect. Ebb and flood currents influenced by the Coriolis effect create circular flow patterns in large bays. |
 Fig. 11-8. Map of the world showing the regions affected by semidiurnal, diurnal, and mixed tides. |
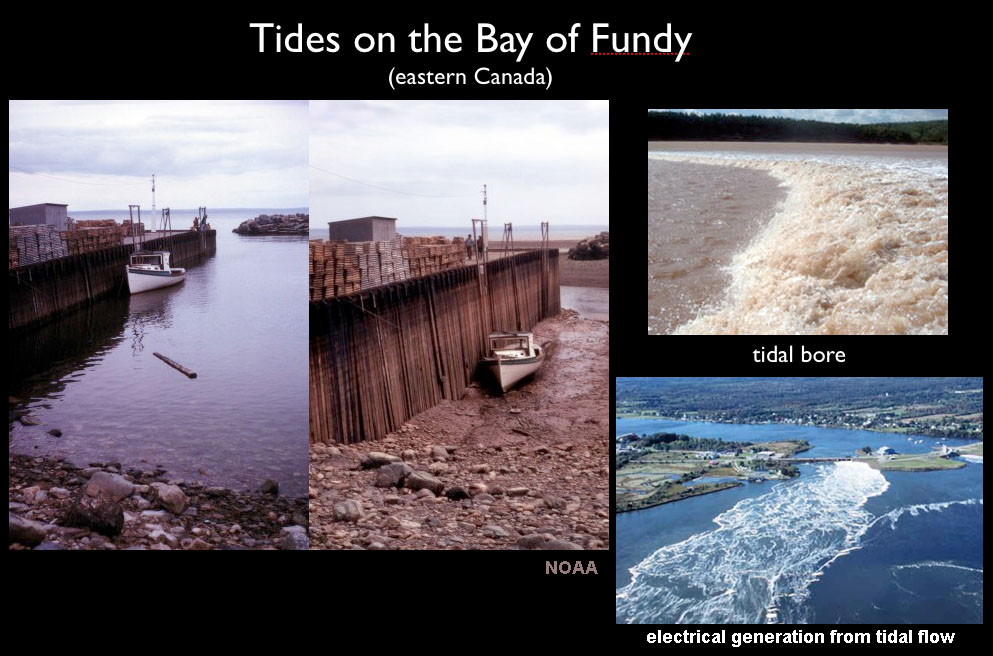 Fig. 11-9. Tides at the Bay of Fundy, Maine and Canada, are the largest in the world with spring tide ranges more than 50 feet! |
|
What is Sea Level?Sea level” is generally used to refer to mean sea level (MSL). A common accepted definition of mean sea-level standard is the midpoint between a mean low and mean high tide at a particular location.Sea level is an average level for the surface of one or more of Earth's oceans from which heights such as elevations may be measured. However, sea level varies for place to place due to gravitational differences in the solid earth, and variations in sea water characteristics (water density) and atmospheric pressure effects. For instance, Figure 11-10 shows topography of the ocean surface one specific day, however, it is constantly changing day by day, season to season. MSL is a standardized geodetic reference point for geographic locations. |
 Fig. 11-10. Sea level height map on a particular day (departure from mean sea level). |
Mean Sea Level (MSL) is not really level...* Sea levels are different for each ocean basin. Sea level is about 20 cm higher on the Pacific side of North America than the Atlantic due to the water being less dense (on average) than on the Pacific side. Variations in sea level are due to the prevailing weather and ocean conditions.* Differences in MSL are also related to the gravity variation cause by different densities rocks in the lithosphere and depth of the ocean basins (Figure 11-11). For instance mid-ocean ridges (MORs) tend to be low gravity areas. Sea level is influenced gravitational acceleration. A boat on sea level region near the North Pole in the Arctic Ocean has the highest gravitational acceleration of the planet: 9.8337 m/s2. The lowest is on Mount Huascaran in Peru on the equator where the gravitational acceleration is only 9.7639 m/s2 (a difference of 0.7% - which you would not feel). |
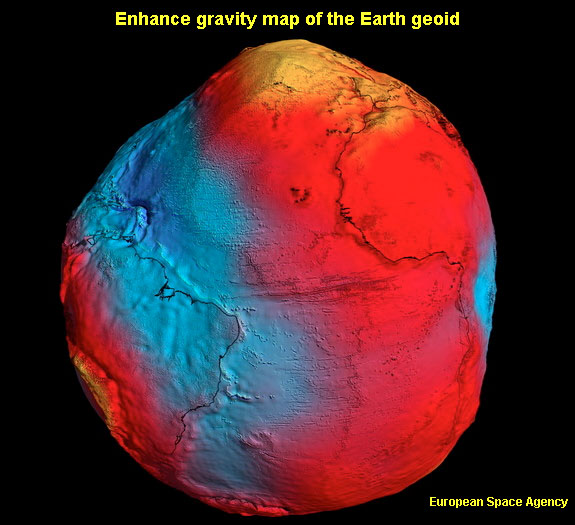 Fig. 11-11. Gravity map of the Earth exaggerated: highs are red, lows are blue. |
Changes of the Sea LevelSea levels are constantly changing around the globe. Long-term trends in sea-level rise are linked to global climate change. Sea level changes are primarily due to the melting and freezing of the icecaps due to global temperature changes. Sea level change is also due to the expansion and contraction of the total water mass due to global temperature changes. Figure 11-12 illustrates the dramatic rise in sea level over the past 20,000 years—estimated at about 120 meters (400 feet)! Figure 11-13 shows how much sea level has risen since detailed global record have been kept (starting around 1900).Figure 11-13 show that in most places around the coastline of North America sea level is rising, however, in some places sea level is falling. In northeastern North America the land is rising due to glacial rebound (an isostatic adjustment caused by the melting of the great Laurentide continental glacier). In Alaska and other part of the West Coast, tectonic forces are pushing up coastal regions, some of these were rapid adjustments associated with massive earthquakes. |
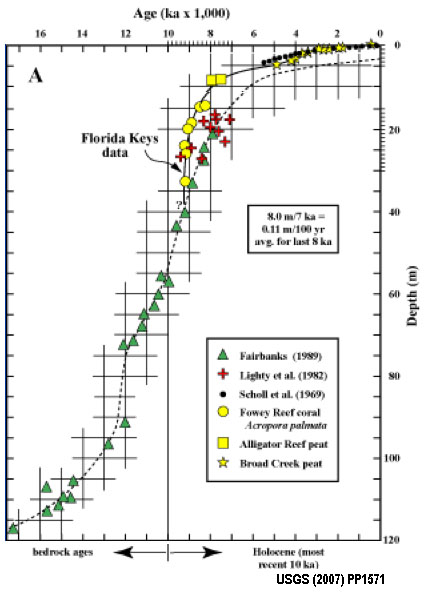 Fig. 11-12. Sea level changes of the past 20,000 years (Late Pleistocene and Holocene) |
 Fig. 11-13. Average global sea-level rise 1900 to 2010. 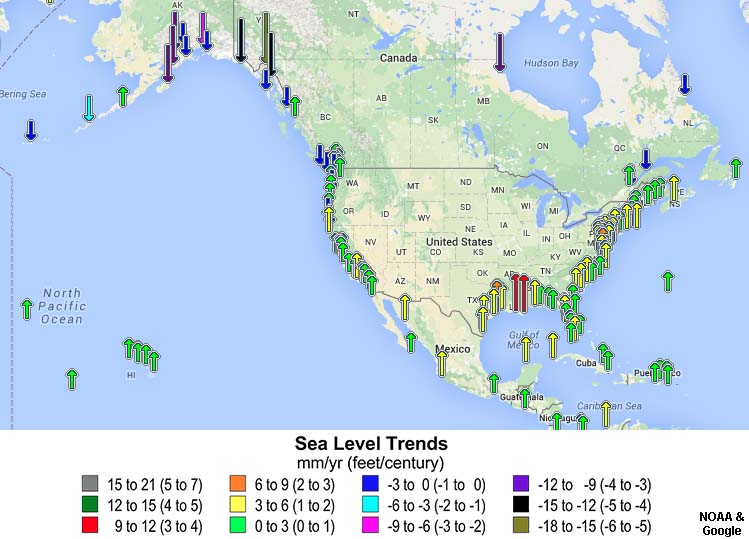 Fig. 11-14. Sea level changes around North America. |
| What is Sea Level? YouTube video explaining the geodesy of defining sea level. Sea Level Trends (NOAA website linked to data used in Figure 11-14). |
Amphidromic Points and Co-tidal LinesAmphidromic points are locations where there are little or no tide in the ocean. (This is also related to influence of continental land masses interfering with the westward movement of tidal bulges and the influence of the Coriolis effect.)* The closer to the amphidromic the lower the tidal range. * There are about 1 dozen amphidromic points in the oceans (Figure 11-15). * About five in the Pacific Ocean. * One near Hawaii - there is little tide change there, so beaches tend to be narrow. A cotidal line is a line on a map connecting points at which a tidal level, especially high tide, occurs simultaneously. * Cotidal lines are hypothetical tidal crest rotating around an amphidromic point (Figure 11-15). * Cotidal lines rotate around amphidromic points about every 12 hours. * They rotate left in Northern Hemisphere, and rotate right in Southern Hemisphere. |
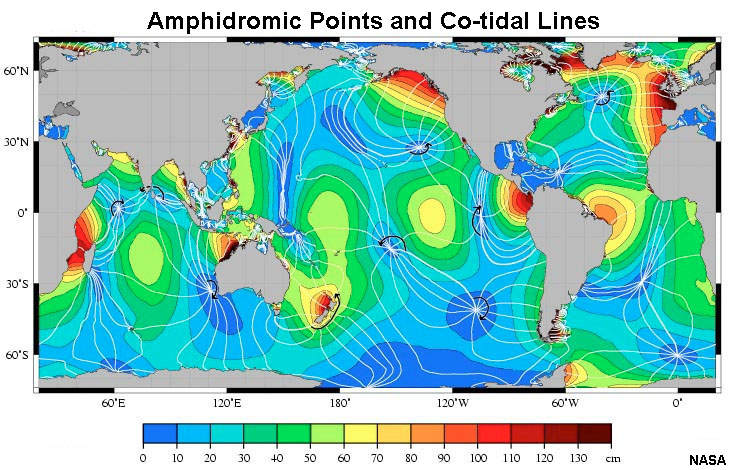 Fig. 11-15. World map showing locations of amphidromic points and cotidal lines. |
| Note: this map also shows where the highest tides occur around the world. |
| What is a Tidal Wave? Tidal wave is a term often confused with the term tsunami. They are different. Tsunamis are seismic sea wave formed by rapid displacement of the seafloor, such as by earthquakes, volcanic explosions, landslides, etc.). Tsunamis are not related to tides. Tsunamis are generally unpredictable, especially close to the source of the disturbance, with only minutes to hours to warn large coastal populations. A tidal wave is a large wave associated with a tidal bore. A tidal bore is a surging flow of a large about of water moving with the incoming tide that funnels a large amount of water into a river mouth or a narrow bay (Figure 11-16). Tidal bore can produces sizable waves that move inland along rivers and estuaries (they are surges of water that can behave like a tsunami). Tidal bore characteristics are often predictable, but can be influenced by storm surges and high sea waves causing potentially hazardous conditions. |
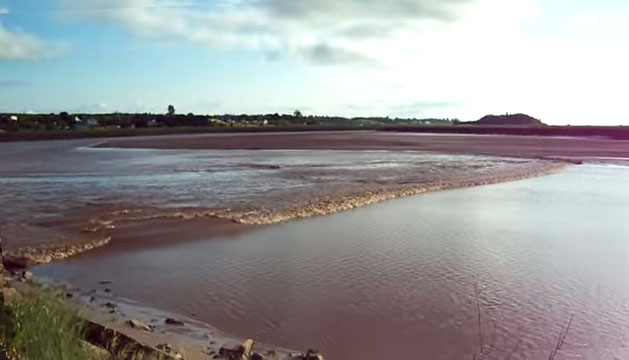 Fig. 11-16. A tidal bore moving up a tidal estuary near Truro, Nova Scotia on the Bay of Fundy. A tidal bore is associated with the surge of an incoming ebb tide. |
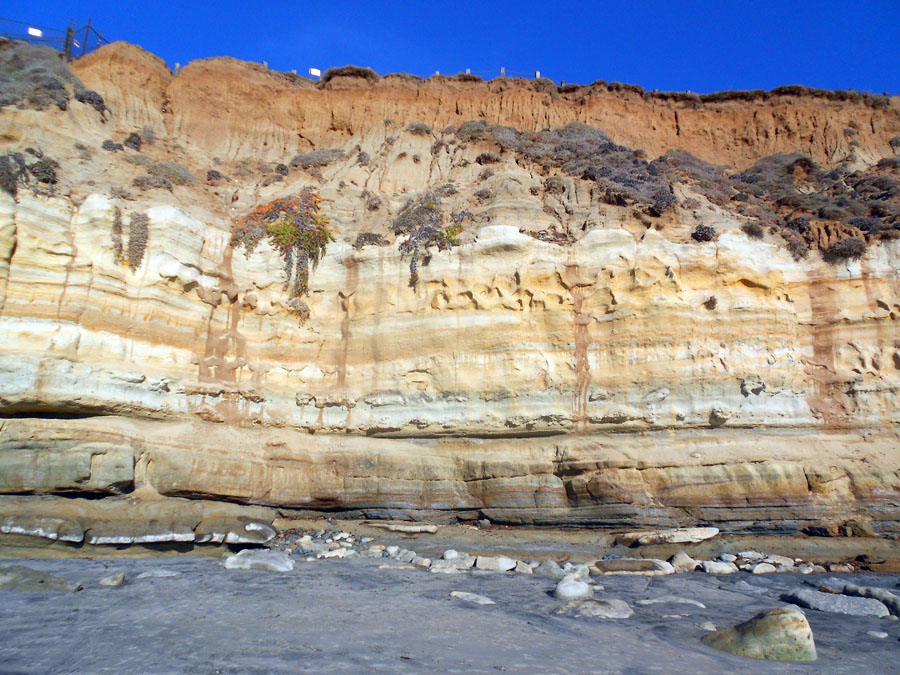 Fig. 11-17. High tide combined with storm waves can cause intense erosion at the base of sea cliffs, such as illustrated here at the Del Mar Dog Beach, CA. |
| Check out these tidal bore videos: Tidal bore surfing on the Bono waves, Kampar River, Indonesia (Tidal bore surfing video on YouTube) Tidal bores surge in Qiantang River(YouTube video) Tidal Bore Surfing Seven Ghosts in Indonesia (Tidal bore surfing video on YouTube) |

Subdivisions of the Intertidal ZoneThe intertidal zone is the region where land surface is intermittently exposed between the lowest-low water and the highest-high water. The intertidal zone is between the subtidal and supratidal zones (Figure 11-20). Tidal ranges influence the distribution of sediments and the habitats occupied by plants and animals.The subtidal zone is the submerged region lying below the low-tide mark but still shallow and close to shore. The supratidal zone is the typically vegetation-free splash or spray zone above the high water line where back-beach dunes accumulate. A wrackline is an accumulation of shell material and debris that typically marks the location of the last high tide cycle on a beach or after a storm surge (Figure 11-21). |
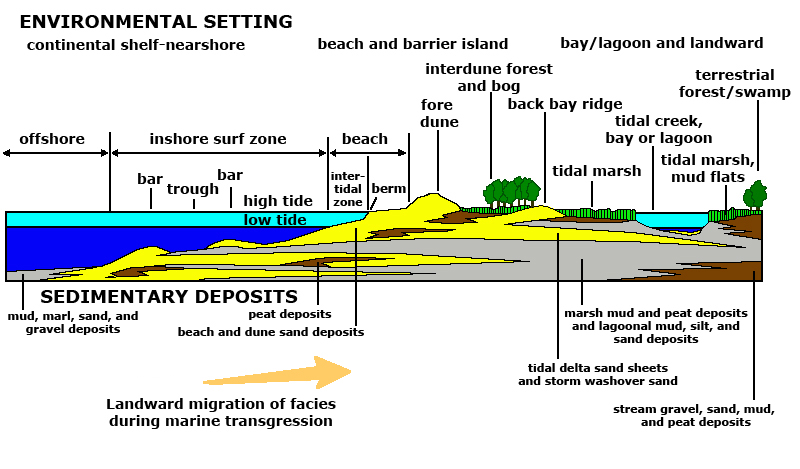 Fig. 11-20. Coastal environments within the intertidal zone extend from offshore bars to inland estuaries and bays. |
 Fig. 11-21. A wrackline consisting of most shell material, pebbles, and flotsam along Plumb Beach, Jamaica Bay, Brooklyn, NY. |
Tidal Forces In Other Planet SystemsTidal features have been observed in other planet systems. For instance, Jupiter’s moon, Europa, is covered with large cracks that are attributed to Jupiter’s enormous gravity pulling on the moon, causing the thick ice crust to fracture (Figure 11-22). Tidal forces release heat, enough to melt large quantities of ice below its surface, allowing the Solar System’s largest oceans to remain liquid.Jupiter's moon, Io, is perhaps the most geologically active moon in the Solar System (Figure 11-23). Tidal forces between Jupiter and its other moons are generating heat within the moon that are driving volcanic activity, recycling the planets crust every few million years. Tidal forces also play a role in the heat generated within planet Earth, and may have a significant influence on plate-tectonics and magnetic reversals associated with the core. |
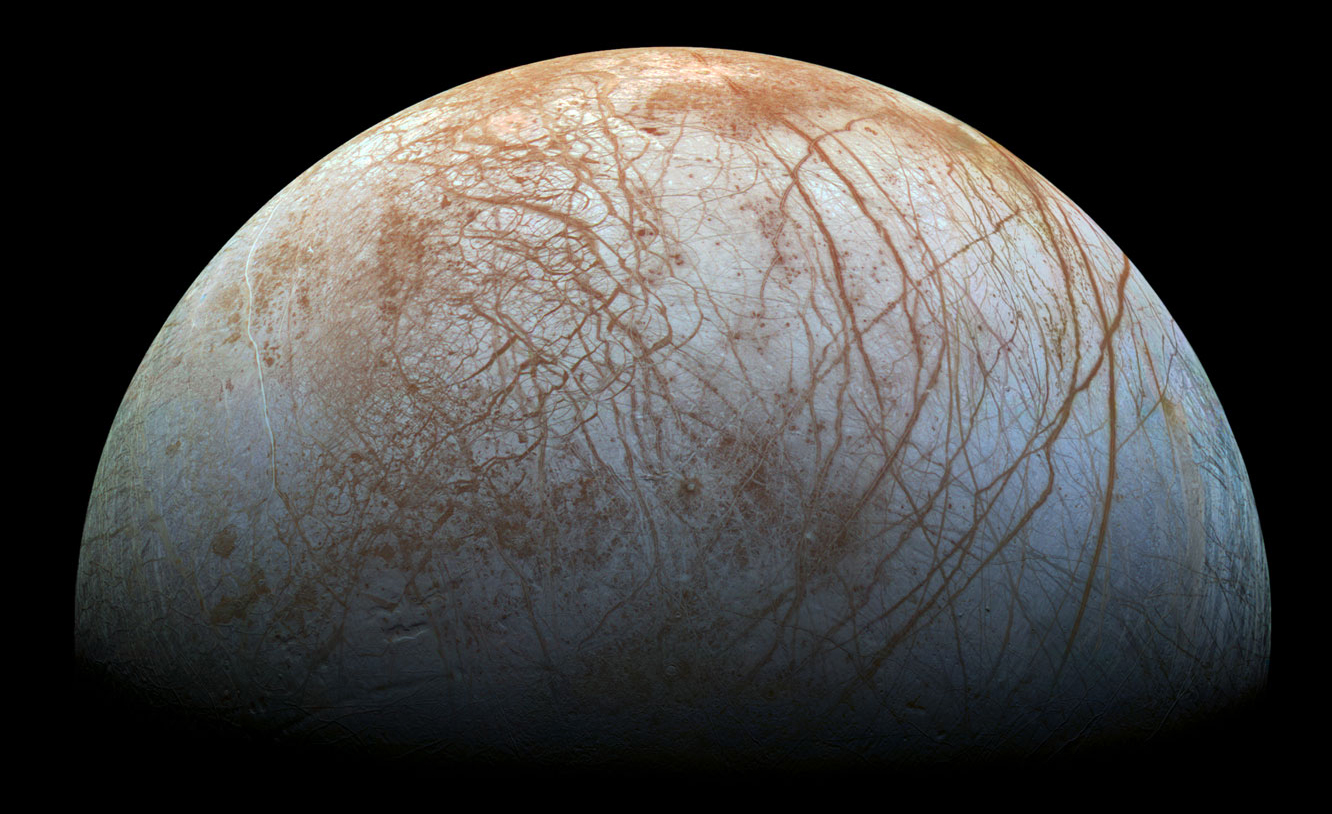 Fig. 11-22. Tidal ice cracks on Jupiter's moon Europa |
 Fig. 11-23. A volcanic eruption on Jupiter's moon Io |
Students! Be Prepared to understand our local tides! Check out: Oceanside Harbor Tides (Surf-Forecast.com website). Del Mar Tides San Diego (NOAA Tides website) NOAA's Long Term tide prediction calculator for La Jolla, California (Scripps Institute of Oceanography) |
A Rare King Tide Experience In San DiegoOpportunity to see the effects of Perigee and Perihelion happening on a full moon on the same day!On January 1, 2018, the Moon was both full and at perigee, and on January 2 the Earth was at perihelion. In other words, the best conditions for creating maximum tides. The tide chart showed that the tidal ranges are 9.5 feet on those days—the largest in seen in many years in San Diego! |
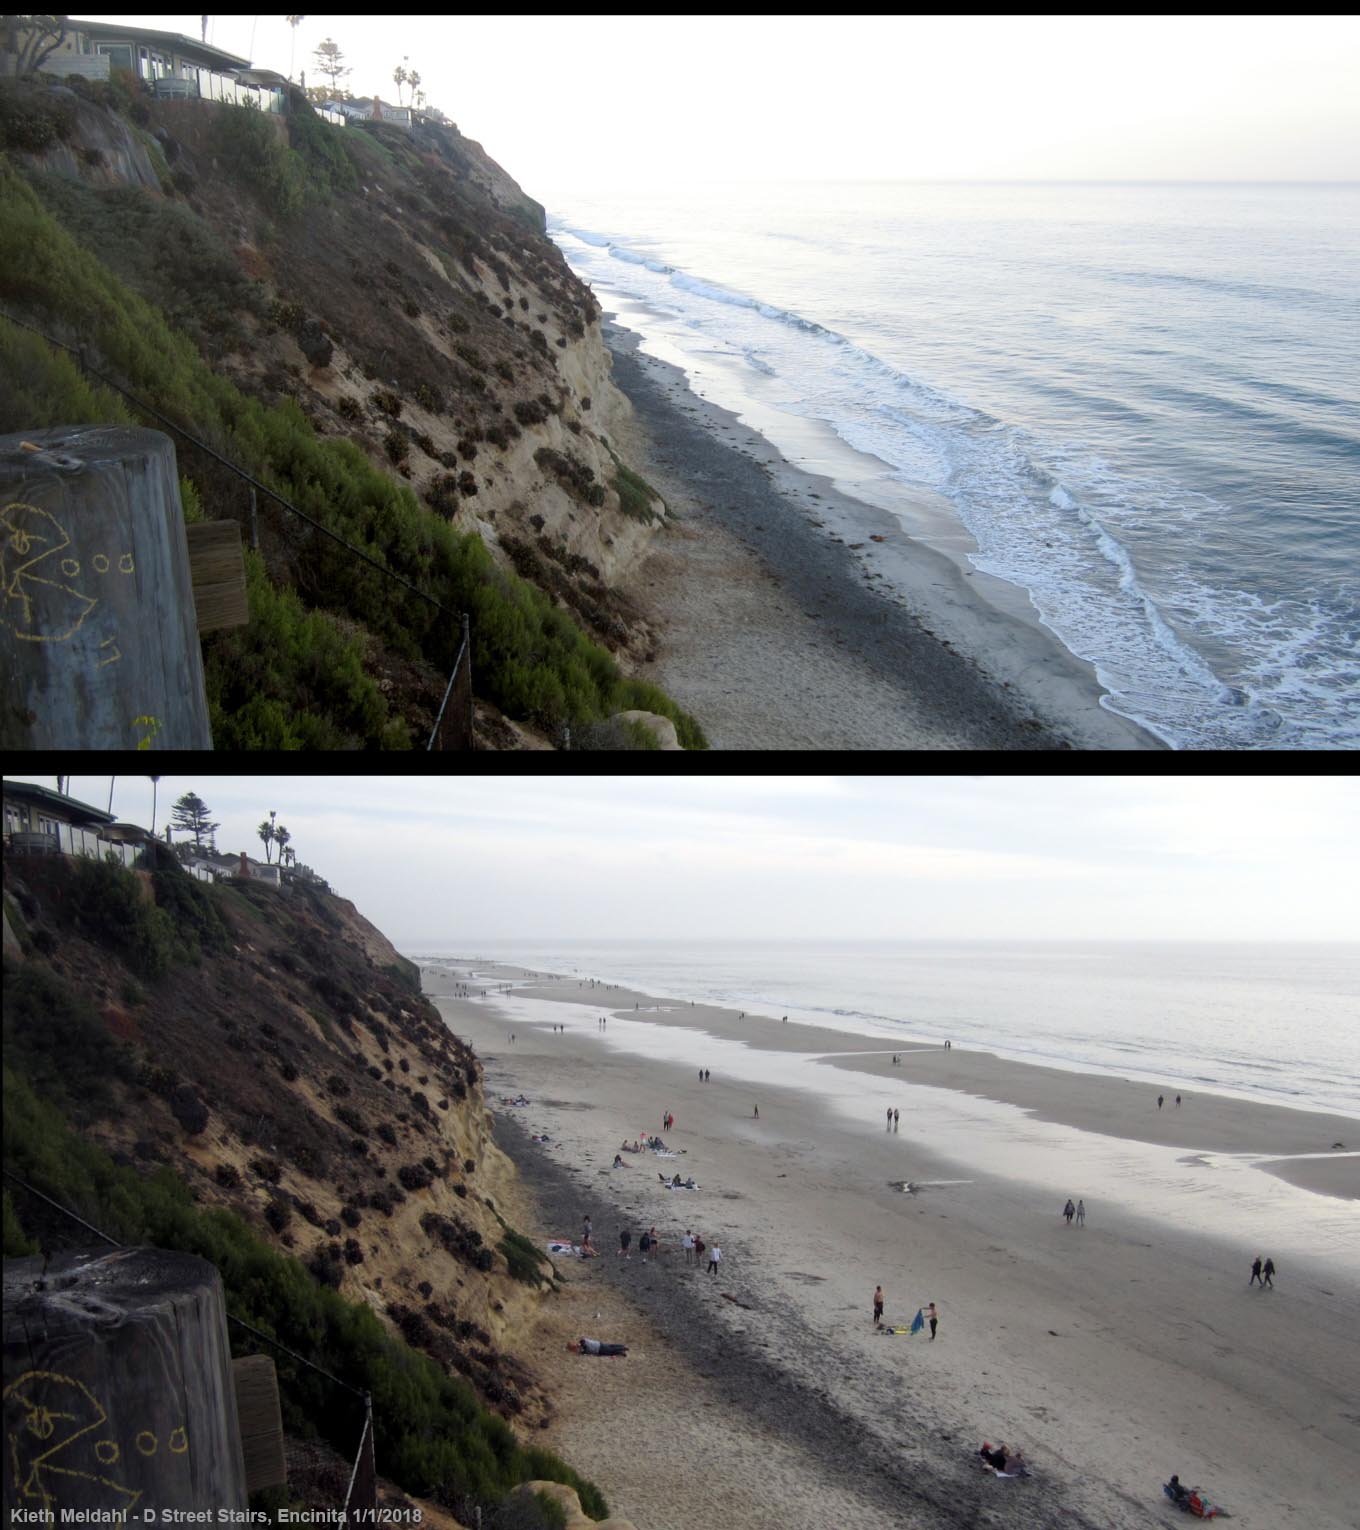 Fig. 11-24. A rare king tide as experienced in San Diego (high tide and low tide, same day in Encinitas). |
| Chapter 11 quiz questions |