Humans, Agents of Geologic Change
(Please note: the text below was written in 1998, and left here basically un-modified in personal memorial to the events of the 9-11-2001 World Trade Center Disaster., P.S., 2003)
In our modern world human activities have taken on an ever-increasing role in changing our environment. In general, most geologic changes in the landscape proceeds in a imperceptible pace, with notable exceptions (such as volcanic eruptions, landslides, or major storm erosion). However, as modern history shows, humans can alter a landscape in ways that rival nature's most powerful agents. Examples include the building of cities, combined with construction of massive infrastructure, such as the the building of dams and diversion of rivers, the mining and drilling required to supply the unending flux of fuel to feed fires to electrify, heat, to build, and to move our populations daily. It is our growing population, motivated by necessity, that drives these changes. Perhaps nowhere on Earth is this more apparent than in the New York City metropolitan area! This final chapter in the geologic evolution of the New York City region examines some of the more significant modifications we've created, and some of the more significant environmental risks that our increasing population has to reckon with. Each individual draws a daily demand on natural resources (energy, water, Earth materials, and physical space). In our modern world, the cumulative demands of our population are powerful agents of geologic and environmental change.
Our Population
According to the U.S. Department of Commerce Bureau of the Census, in 1994 there were 19,796,430 people living within the New York Consolidated Metropolitan Statistical Area (including southern NY, northern NJ, CT and easternmost PA). This represents approximately 1/13th of the total U.S. population. Our population is currently growing at a rate of ±1.3% annually. Approximately 7.3 million live within the borders of New York City. Although the overall population growth rate is small, the region's population still is growing by almost 300,000 annually. For comparison, this number corresponds to the population of New York City in about 1835, or the entire population of Staten Island in 1970!
Figure 201 illustrates how the human population has grown through time in relation to significant events in the region's history. It is unclear when American Indians first migrated into the area. It is possible that early human habitation has not yet been recognized for lack of clearly identifiable artifacts. The discovery of Folsom and Clovis style projectile points in the area suggests that the region was utilized by Big Game Hunters after the glacial ice melted. Waves of human migration, conflict, and cultural mixing are inferred from the variety of artifacts found. The coastal areas were clearly utilized by "Tidewater Communities" beginning as long as 4,000 years ago. These people used both marine resources (fishing and collecting shellfish) and agricultural methods (corn, beans, and squash). The record of these cultures was preserved in the form of shell heaps (called middens) along the shores and bays throughout the region. Collections of artifacts from old village sites in the Hudson and Delaware Valleys show that trade and cultural exchange transpired with the Ohio Valley Mounds and Woodlands cultures (between ±950BC-1,300AD). By 1,300AD the modern Iroquois culture dominated the region. At the time of European contact approximately 40-50,000 native people inhabited the coastal areas of the Bight. The coastal areas of New York and New Jersey were home to the Lenni Lenape, a collection of regionally isolated tribes, comprising a single ethnic group which shared a common sense of identity and heritage. Unfortunately shortly after European contact, the Lenapes, along with all American Indian populations, were decimated by epidemics of smallpox, measles, malaria, and other diseases. They were also afflicted by alcoholism, conflict, and forced expatriation. When Manhattan (the Lenape word for "island") was exchanged for the equivalent of $24 of beads in 1626, the "remnant" population consisted of a handful of American Indians who probably knew too well that their land had been already taken. By the year 1700 there were probably fewer than 3,000 Indians left in the region. By then, the local European population was in the tens of thousands.
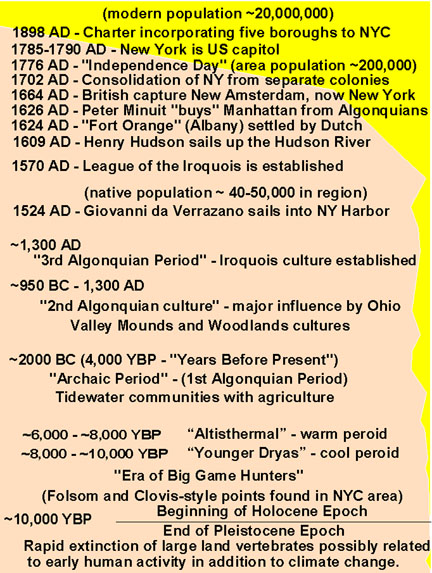 |
| Figure 201. A Holocene time line for the New York City region showing growth and changes of the human population. |
Census data for New York City through time reflect a logarithmic increase in
population: 1800 (79,216); 1850 (696,115); 1900 (3,437,202); 1950 (7,891,957),
and at its maximum in 1970 (7,894,862). Since 1970, the population within city
limits has gradually declined but the surrounding suburban regions have developed.
The overall steady growth of population has pushed the demand for available
resources far beyond what could be generated locally. Today, nearly all food
and energy is transported in from distant sources. Only water is supplied from
local or near local source areas.
Infrastructure
New York City, particularly Manhattan, is a place of unfathomable scale. Despite its problems, the city is a testament of human will power put to maximize use within a limiting geographic setting. People make New York, New York! Most people, including most New Yorkers, consider southern and central Manhattan Island the center of the city. It is in this region where the tall skyscrapers could most cost effectively be built directly on the crystalline bedrock foundation. The island is about 12 miles long, a maximum of 2.5 miles wide, and covering approximately 20,000 acres (Figure 202). The island is home to about 1.2 million (in 1998) inhabitants, with roughly double that number during any work day. Below is a list of our favorite places to observe Manhattan.
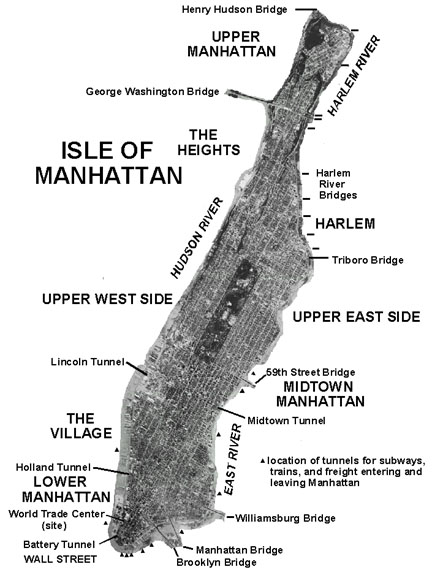 |
| Figure 202. Aerial photograph map of Manhattan Island. |
Our Top 10 Favorite Public Places to View Manhattan.
1) Empire State Building, 86th Floor Observatory (elevation 1,050 feet) -- The Empire State Building is located at 34th Street and 5th Avenue. Access to the outdoor observatory requires a nominal fee, but the view is spectacular.
2) 2 World Trade Center Observation Deck (elevation 1,377 feet) -- the recently reopened indoor observation deck on the 110th floor is frequently lost in the clouds! The views in all directions are unrivaled! The trip requires $10 and a 58 second elevator ride. (This was written in 1998. PS)
3) The Brooklyn Bridge -- a walk across the bridge between Brooklyn and the Wall Street area provides a stunning view of the city and the waterfront along the East River.
4) The Brooklyn Heights Promenade -- this park extends above the Brooklyn-Queens Expressway, but provides a fantastic view of Wall Street, the East River, and the Brooklyn Bridge.
5) Central Park -- throughout the park are marvelous views of Midtown and the incredible buildings lining Central Park West and the Upper East Side.
6) Liberty Island/Ellis Island -- The view from either of these islands or from the top of the Statue of Liberty is spectacular. Ferry access is available from Battery Park or from Liberty State Park in New Jersey from spring to late fall.
7) Roosevelt Island -- A ride on the overhead tram car between 61st Street in Manhattan and Roosevelt Island costs a subway token each way, but it can be combined with a shore walk with exquisite views of Midtown and the East River around the southern tip of the island.
8) Riverside Church -- Located on Riverside Drive between 120th and 122nd Streets on the Upper West Side, this extraordinary building not only has the largest church bells on Earth, but offers a lofty public observation deck high above the surrounding urban landscape.
9) Battery Park -- Located at the southern end of Manhattan, the park offers wonderful views of the harbor and the Wall Street towers.
10) Times Square -- Located at the intersection of Broadway, 42nd Street, and Seventh Avenue, the views in this bustling center is unparalleled anywhere in the city.
The Transit Authority reports that in New York City, public transportation (trains and buses) account for about 5.3 million passenger rides daily, but this accounts for perhaps a third to one half of all transport in the city. In Manhattan alone there are almost 6,000 miles of streets and highways. Half the work force commutes into Manhattan daily via its 18 connecting bridges and 21 traffic and train tunnels.
The grand skyline of Manhattan is a reflection of the availability of bedrock foundation space in New York City. Most of southern Manhattan is covered by a thick layer of glacial debris and some landfill. Two areas where the more resistant bedrock is at or near the surface is in the Midtown area and in the Wall Street area. Nearly all the tall buildings in the city sit on a bedrock foundation. The region of lower buildings between Wall Street and Midtown is built on unconsolidated material (Figure 203). The placement on firm bedrock (such as Manhattan Schist) alleviates the need for the excavation and construction of extensive foundations, however, not all tall buildings in NYC are attached to bedrock. If buildings are not attached to bedrock then the building must have a basement cavity large enough to balance the weight of the building to prevent it from sinking. Alternatively, pylons beneath the foundation must be sunk deep enough to establish a firm footing. This is increasingly difficult with the number of train, gas, water, sewage, electrical, steam, cable, phone, and other lines below the land's surface!
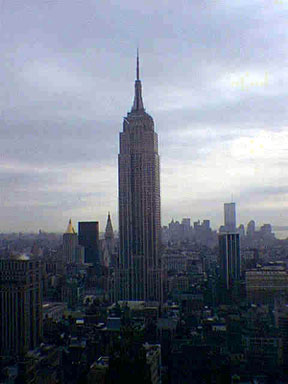 |
| Figure 203. Southward view of the Empire State Building from the 39th floor of the Grace Building (42nd Street in Midtown. Note the buildup of sky scrappers in the Wall Street area in the distance (P.S., 1998). |
Energy Statistics
One of the aspects of urban living is the opportunity (or demand) for energy efficiency. This is apparent in the data reported by the U.S. Department of Energy (D.O.E.) which publishes energy generation and consumption statistics in the form of British Thermal Units (a British Thermal Unit, or BTU, is awkwardly defined as the quantity of heat required to raise the temperature one pound of water one degree Fahrenheit). According to the D.O.E. 1994 energy statistics, people in the state of New York have the lowest per capita energy consumption in the United States (#51 including the District of Columbia) averaging 213.1 million BTU per person. Connecticut ranked 47th at 243.4 million BTU per capita; New Jersey ranked 31st at 322.2 million BTU per capita. However, by rank of total energy consumption, New York rated 4th using 3,868 trillion BTU; New Jersey was 10th at 2,547 trillion BTU; and Connecticut was 31st at 797 trillion BTU. The total energy consumed in the New York City metropolitan region approaches 8 quadrillion BTU per year (down from almost 10 quadrillion in the early 1980s). This is about 8.5% of the total U.S. energy consumption (93.8 quadrillion BTU in 1994).
Needless to say, it is difficult to translate 8 quadrillion BTU to something we can understand. This is equivalent to about 2.34 x 10"14th" kilowatt/hours of power (one kilowatt is roughly ~10"15th" pieces of toast). Roughly, this would be equivalent to the energy released by about two dozen 50 megaton nuclear explosions, or to burning about 800,000 acres of tropical forest, or roughly equivalent to the fires that burned most of Yellowstone National Park region in 1988. It is slightly more than the energy released by an 8.1 Richter Scale earthquake. About 85% of all energy consumed in the United States is derived from fossil fuels (petroleum - 38%; natural gas - 24%; coal - 23%), the rest is generated from nuclear energy (7%) and hydropower (4%), with about 4% from renewable and alternative energy sources (wind, solar, wood, geothermal, recycled wastes, etc.). Overall, in the NYC region, the per capita consumption of petroleum products is slightly higher than the national average, with lesser amounts supplied by other energy sources.
How does the release of all this is energy affect the local environment? In
reality, this amount of energy is infinitesimally small compared to the amount
of energy the region receives daily from the sun, or to the energy radiated
daily back into space. Perhaps the only apparent effect can be seen in the form
of "urban conductive heating" during the winter when the temperature
in the city is a couple of degrees warmer than the surrounding suburbs. Perhaps
a more significant impact from the burning of fossil fuels is on regional air
quality, especially the air pollution generated by cars and trucks. The region's
contribution of greenhouse gases to the atmosphere is another issue that remains
unresolved. Although the greenhouse effect may have global catastrophic consequences,
NYC would benefit from having warmer winters (except perhaps, the summer bug
seasons would be worse!). However, the progressive melting of arctic and alpine
glaciers would accelerate sea level rise and the progress of coastal flooding.
Perhaps the grave concerns are how the greenhouse effect will affect global
climates, and in turn, how this will affect ecosystems, food and water supplies,
tropical storm development, and the flooding of densely populated coastal communities.
Water
In 1990, NYC alone drew about 1.5 billion gallons of water per day, provided by the NYC water supply system (Figure 204). The infrastructure of the city water supply system dates back well into the last century with the construction of the massive Croton Reservoir Aqueduct system, initially completed in 1842 (Figure 205). The expansion and development of the Catskill Mountains/Delaware River Watershed began in 1927 and was completed in 1965. New York is rapidly approaching the cap of withdrawal from the Delaware River Valley region where the flow of the river is protected by a 1954 law limiting New York's share of the water at 800 million gallons per day.
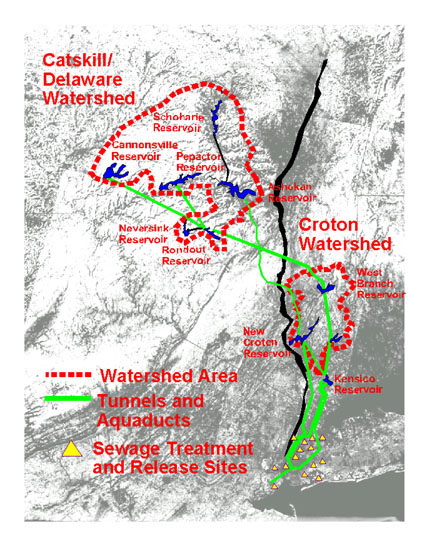 |
| Figure 204. Map of the New York City water supply network with the location of sewage treatment and release sites in the city. |
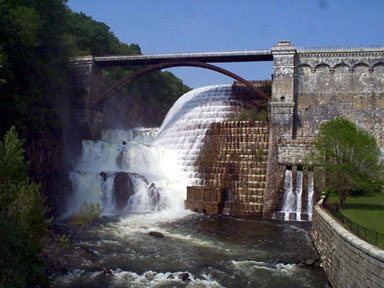 |
| Figure 205. The scenic spillway at New Croton Reservoir near Croton-On-Hudson, Westchester County, New York. |
Estimates prepared by the NYC Department of Environmental Protection suggest that during the most severe drought conditions, the reservoir system should still be able to maintain about 1.3 billion gallons of water per day, requiring a limitation on per capita use of water (which, based on population statistics, is about 200 gallons per person per day - this estimate includes commercial usage as well). Individual usage is probably closer to 120-130 gallons per day. The city is constantly examining alternative water sources, including the Hudson River, and long distance transport options from the Great Lakes region or beyond.
A primary environmental concern is how the diversion of water into the city's supply affects the water quality of the already-stressed Hudson River. Withdrawal upstream would increase the salinity of the estuary upstream, whereas the massive emission of additional wastewater (essentially freshwater) into the lower estuary and bays has equally damaging environmental consequences on salt water-tolerant species. It is unfortunate that we have to make such modifications to our environment to supply our growing population with water. Fortunately, most organisms can migrate to new habitats that match their habitat needs and their life cycles. Perhaps in the future ways will be discovered to better manage our water demands and sewage output to better suit our regional terrestrial and marine ecosystems.
From another angle, the high demand for high quality drinking water in cities of the region is working to preserve the environment in the upland regions. In the long run, it is cheaper to set aside land for undeveloped watershed than it is to daily treat and purify polluted water. In this manner, most of the beautiful, forested upland areas of the Highlands and Catskills have been purchased or set aside by legal action for watershed protection. However, the effort to preserve and improve water quality for the City is a source of regional political conflict. Water quality is diminished when development occurs in watershed regions. As a result, property owners in watershed regions are facing ever-increasing restrictions on the use and development of their land.
In the Newark Basin, the Coastal Plain, and on Long Island, much of the municipal
water comes from water wells. Groundwater pollution remains a grave concern
throughout the area. Unfortunately, from the beginning of the American Industrial
Revolution through to the 1960s, the issues of groundwater contamination were
largely ignored. As a result, the New York Bight region is host to a record
number of "Superfund" sites. These are "point sources" of
pollution, such as old landfills or chemical plant dump sites, where improperly
disposed hazardous compounds are leaking into the environment, particularly
into the groundwater. Fortunately, great strides have been made in managing,
containing, or eliminating these problem spots, but at extremely high cost.
Of greatest concern in the future will be the management of "non-point
sources" of pollution. These are typically small waste discharges without
traceable sources. Non-point sources include improperly disposed motor oil,
yard fertilizers and pesticides, animal wastes, household solvents, paints,
etc. Although such small chemical spills seem essentially harmless, their frequency
in a large urban population is cumulative. Addressing non-point pollution problems
is extremely difficult, and it requires both the eventual prohibition of many
frequently used chemicals, and intensive constant public education on how to
properly dispose of wastes.
Waste Disposal
In 2001, New York City's last active landfill will be closed. This landfill, named Fresh Kills (Dutch for "fresh streams"), opened despite local opposition in 1948. It is currently the largest landfill on Earth. It covers about 3,000 acres in Staten Island and currently receives 14,000 tons of trash per day, or about 4.3 million tons per year. It is New York City's greatest environmental nightmare. The great heap releases an estimated 2,650 tons of methane daily. Its leachate plume is a major source of heavy metals and other toxins feeding into the waterways of the New York Bight. After 2001, all garbage generated by New York City will be exported to distant landfills in other states. (Each year, NYC already exports 2.9 million tons of commercial waste, and undisclosed quantities of industrial waste). Although recycling, waste reduction, and composting have greatly reduced the volume of garbage generated in recent years, the cost of long distance garbage removal is high, and is politically volatile. (Note: this was the status as of 1998.)
Unfortunately, Fresh Kills is only part of the problem. In the New York Bight there are numerous landfills that have been closed or are soon to be closed. These heaps typically stand out as great grass covered hills along the highways and rivers throughout the region. They are a lasting legacy of our times and times past. Most materials deposited in landfills (particularly paper and metals) eventually decompose to inert compounds that occur naturally in the environment (clays, iron-oxides, organic residues, etc.). In the humid coastal environment this process proceeds to near completion in about 30 years. However, in order to reduce the generation of leachate most landfills are "sealed" away from air and water, greatly slowing down the process of aerobic decay and increasing the generation of methane. Also, materials such as glass, ceramics, and certain plastics will remain in recognizable form for perhaps thousands or even millions of years. Another problem is that landfills have typically been placed in low areas, putting them at risk of coastal erosion induced exposure, or to or slumping as sea level continues to rise (Figure 206).
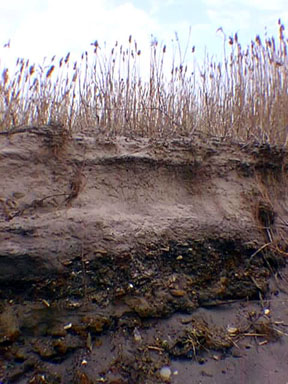 |
| Figure 206. Coastal erosion is exposing a landfill used during the 1930s to 1950s near Floyd Bennett Field, Brooklyn, New York. |
Living With Risk
Potential hazards to our public health and well being extend beyond tradition means (such as plague and war; The New York City region has already experienced both). Other less familiar disaster are not often not considered...
Fire -- History demonstrates that massive fire outbreaks can occur by themselves or in conjunction with other types of disasters. Within the United States there have been numerous fires that have destroyed entire cities. Perhaps most famous were the fires in Chicago and New Orleans. Although earthquakes were blamed for massive destruction of San Francisco, Charleston, and Boston, it was actually the resulting fire in each case that did the majority of damage. Although modern fire codes have greatly alleviated the probability of large-scale conflagrations, it remains a grave potential.
Earthquakes -- An earthquake of severe magnitude has never occurred in the region in historic times, and therefore is unfortunately unexpected in the New York Bight. However, a potential exists. Both east coast cities of Boston and Charleston have endured destructive earthquakes, and suffered catastrophic fires in the aftermath. Earthquakes cause the greatest damage to structures built on unconsolidated sediments, particularly to buildings and structures built on landfill. It takes a strong earthquake, typically greater than a Richter Scale quake of about 5.6, to cause significant damage to buildings. Perhaps the greatest concern is the rupture of gas, fuel, and power lines for their potential to cause fire. Equally problematic is the rupture of water lines, causing a lack of water pressure adequate to fight fires, and the potential for the spread of disease. The harsh reality in New York City is that a large, undetermined percentage of buildings and structures were built prior to earthquake code. With a Richter Scale quake of 6.0 there would probably widespread damage throughout the city. A 6.5 to 7.0 quake, although highly unlikely, would probably cause a widespread catastrophe, particularly in areas built of fill or loosely consolidated alluvial, glacial, or coastal sediments. Figure 207 shows the intensity and location of earthquake epicenters recorded in the New York City region. The strongest earthquake to affect the city was an estimated 5.5 quake that happened in 1836. It was centered beneath Brooklyn's Gravesend Bay and the Outer Harbor area. Several other greater-than-magnitude-5 quakes have rattled the City in historic times. As any detailed geologic map shows, there are numerous faults exposed throughout the Highlands and Newark Basin. Although most of these faults are ancient, they still represent zones of structural weakness in the crust. Buried major faults beneath the Coastal Plain and along the continental shelf have been revealed by seismic studies, and by gravity and magnetic investigations. Visible at the surface, Ramapo Fault that borders the western Newark Basin presents an obvious if not unlikely threat, already having a record of modern seismic activity. It is unclear what effect the influence of glacial loading and unloading has had on these faults, or whether glacial rebound could be a trigger mechanism for an earthquake in the region.
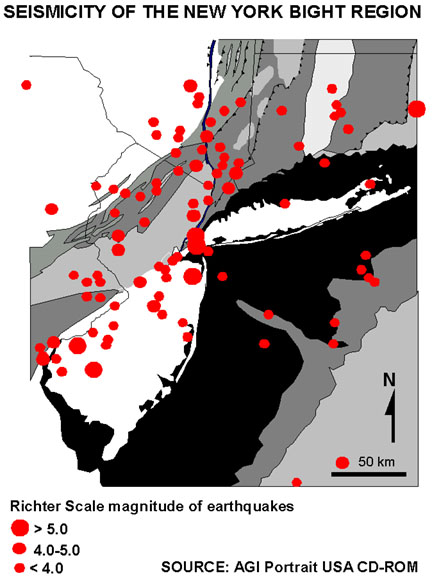 |
| Figure 207. Seismicity map of the New York Bight region (information modified from the seismic data set of the Joint Education Initiative Portrait USA CD-ROM and USGS web-based resources in 1997) (PS, 1998). |
Giant Storms -- Hurricanes and nor'easters cause coastal erosion
and producing flood surges, particularly during high tide. Wind damage
can severely affect practically any structure in the region, and can also
fan fires. Part of the problem is the geometry of the New York Bight and
of Long Island Sound in relation to the direction of wind flow and the
potential for an enormous storm surge in New York Harbor. As previous
hurricanes have demonstrated, storm surges can easily rise as much as
5 meters above high tide, with the potential being much greater during
storms of higher intensity. Many of the subways and tunnels throughout
the city could become flooded: the very places where many people may go
to seek shelter! In addition, by the time that large scale evacuation
could be announced, the high winds would likely stop all bridge traffic,
particularly on the higher Verrazano Narrows and George Washington Bridges.
Low communities like the Flatlands region of southern Brooklyn could become
completely inundated by flood waters, much in the manner that the 1938
hurricane submerged large portions of Long Island.
Failure of Infrastructure -- The region has already experienced major
power failures. However, catastrophic circumstances could rise from major failures
in the city's water, transportation, and communication systems, especially in
relation to another disaster in progress.
Economic Failure -- All one has to do is read about the impact of the Great Depression had on the population on New York City. With our greater reliance on long distance transportation for food and other resources, and with our expanded population, the potential for civil disaster would be magnified.
Famine -- This could be more of a global concern in the future.
Drought -- Although the city is well prepared compared to other drought-prone regions, the loss of water supply through drought or failure of the water system could increase the potential for catastrophic fire and the spread of waterborne diseases.
Accumulation of Toxins in the Environment — This includes the potential for the toxins in our air, water, or food supply. Although the days of mass poisoning by clouds of smog are likely past history, the potential remains, especially in association with extreme heat waves. As the concern with Mad Cow Disease illustrates in Great Britain, or the effects of the Chernobyl nuclear disaster in Europe, large portions of the population can be exposed to a potential pathogen, with the effects not being felt until nearly a generation later. Casualties related to these types of hazards may be recognized in long-term health statistics. The problem is knowing a potential cause and eliminating it before it is too late! As the smoking-related cancer pandemic illustrates, this isn't always that easy.
We live in this age when the growing human population is approaching an unknown point of maximum sustainability of our Earth's natural resources. It can be said paradoxically that "over-population is killing us!" At speech given at San Jose State University in 1998, Stephen Hawking joked that if our population continues to grow at its current rate that every inch of land would be covered with humans, standing shoulder to shoulder by the year 2600, and that our electrical demands would have the surface glowing red hot! Clearly, our resources will only go so far, and we will need ingenuity to push back our limitations.
| Continue to the Selected List of References. |