
Oceanography 101 |
Return to class home page |
Chapter 10 - Waves |
This chapter focuses on the phenomena associated waves on bodies of water (oceans, lakes, etc.) • Short-term changes in sea level. |
Click on thumbnail images for a larger view. |
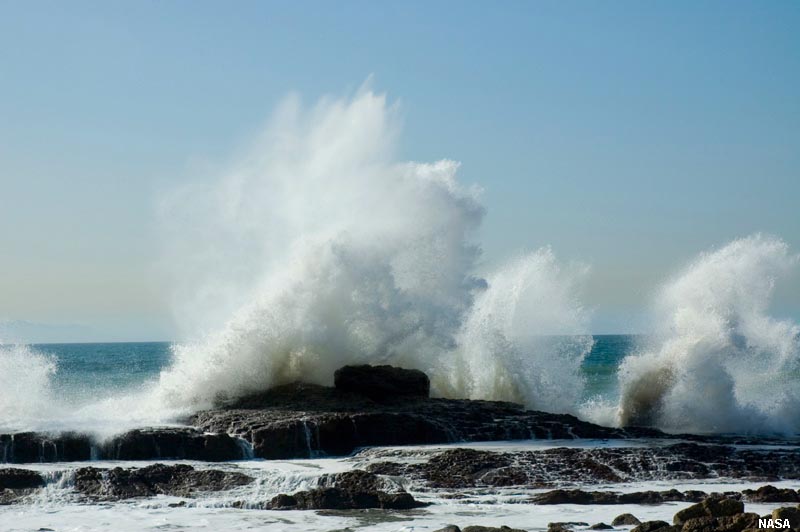 Fig. 10-1. A wave crashing onshore releases energy. |
Wind is the disturbing force for waves in the ocean and large bodies of water. Waves are also generated by earthquakes, landslides, and volcanic eruptions (producing tsunamis), and tides are produced by gravitational interactions between the Earth, Moon and Sun.
|
 Fig. 10-2. A splash is an example of a disturbing force creating waves. The ripples radiate away from the splash site, dispersing the energy transmitted to the surface of the water. |
|||||||||
Terms Used To Describe Waves
Characteristics of WavesOcean waves are created by wind blowing over water. The distance between two wave crests or two wave troughs is called the wavelength. Wave height is the vertical distance between the highest (crest) and lowest (trough) parts of a wave. (Figure 10-3). Wave period is the time interval between passing wave crests (completing one cycle) and are measured as wave crests pass a stationary point (such as waves passing a buoy or pole on a pier)(Figure 10-4). |
 Fig. 10-3. Wavelength and wave height of wave cycles. 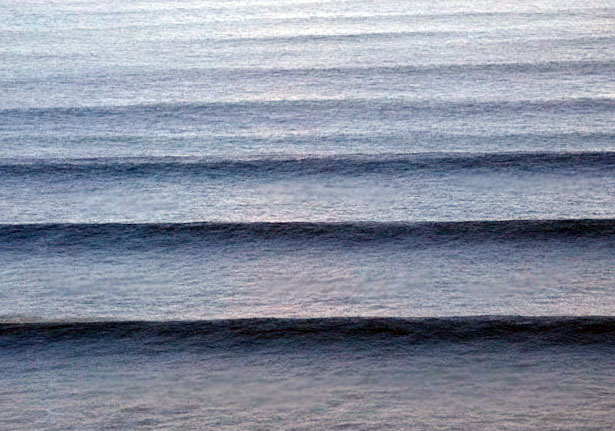 Fig. 10-4. Waves approaching a shoreline arrive at cyclic intervals called a period. |
Ripples illustrate Wave Propogation (Video)A pebble falling on still water illustrates the dispersion of energy from a wave source. Notice that the ripples propogate away from the wave source (where an acorn struck the water) in a radiating circular pattern. As the ripples move away, the circular wave front expands larger and larger. Meanwhile the wave height of the ripples get smaller and smaller the farther they travel. Note the the fastest moving ripples are at the front of the wave train. Also note that the wavelength between wave crests is longest between with the fastest moving ripples. Ripples will continue to propogate until the meet the shore or their energy is completely dispersed. (The refection of the tree highlights the ripples.) |
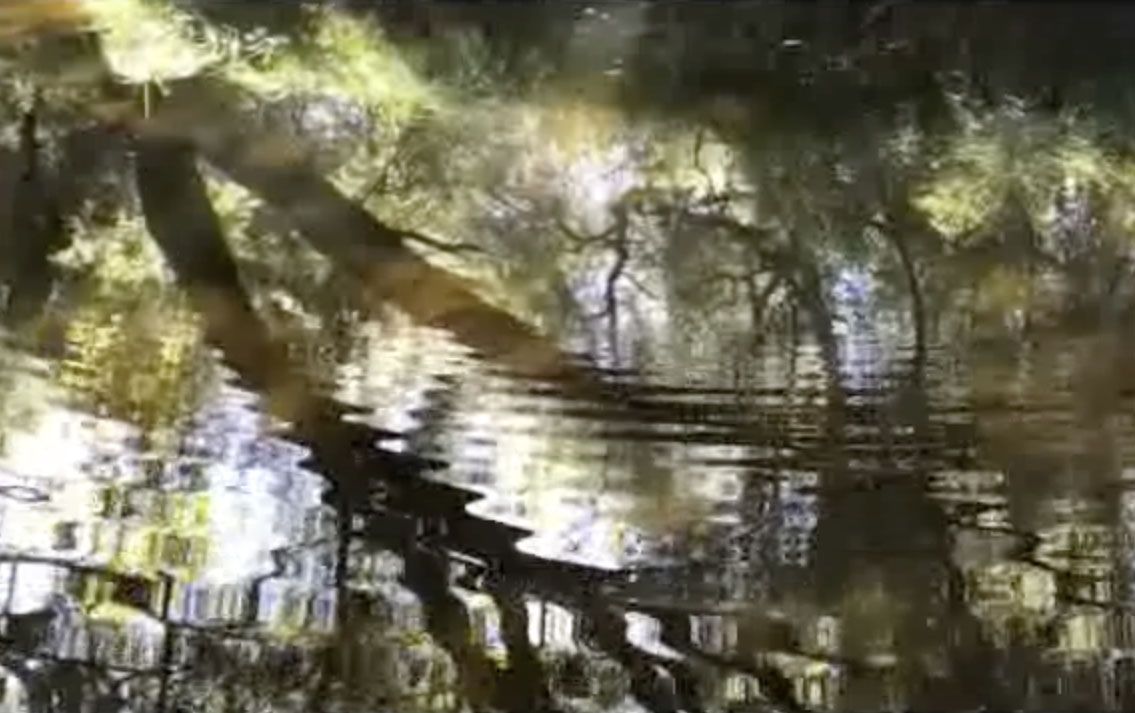 Ripple radiating away from where aan acorn hit a stream. |
Wave Speed and Wave EnergyWave speed is a function of wavelength and wave period, and is related to the wind velocity where the waves form. What is important is the combination of the wave height and wave period. Wave period is directly related to the speed the wave is traveling. The longer the period, the faster the wave, and the more energy in contains. The greater the period the faster the wave moves (Figure 10-5). Also, the greater the period, typically the higher the wave breaks as it approaches the shore. |
 Fig. 10-5. Comparison of wavelength to wave speed and wave period. |
Wave BaseWave base is the depth of influence of a passing water wave—it is about half the wavelength of passing water waves (Figure 10-16). At depths greater than half the wavelength wave motion dies out—the water motion is less than 4% of its value at the water surface and is generally insignificant. |
|||||||||||||||||
Wave Orbits and Orbital DepthPassing waves create a circular current in the water. This is revealed by the orbit-like motion of particles in the water. The orbital motion of a wave is greatest at the surface and diminishes with depth. Orbital depth is the depth to which the orbital motion of the wave energy can be felt. Orbital depth is equal to half of the wavelength. At the sea surface, orbital diameter is equal to wave height. As depth increases, less wave energy can be felt. The orbital depth is the depth where zero wave energy remains. For example, if a wave at the surface has a height of 4 meters and a wavelength of 48 m, then the depth where no motion from the wave exists is 48/2 or 24 meters. Deep-Water Waves and Shallow-Water WavesThe depth of the water determines the character of wave behaviors.• Deep-water waves are waves passing through water greater than half of its wavelength. Deep-water waves are waves of oscillation. A wave of oscillation is a wave in the open ocean where movement in the water below a passing wave is in a vertical circular motion. • Shallow-water waves are waves that are interacting with the seabed in depths less than half it wavelength. Shallow-water waves are called waves of transition because they change character as the move shoreward and dissipate their energy interacting with the seabed onto the shore.
Wind waves change as they approach the shore: |
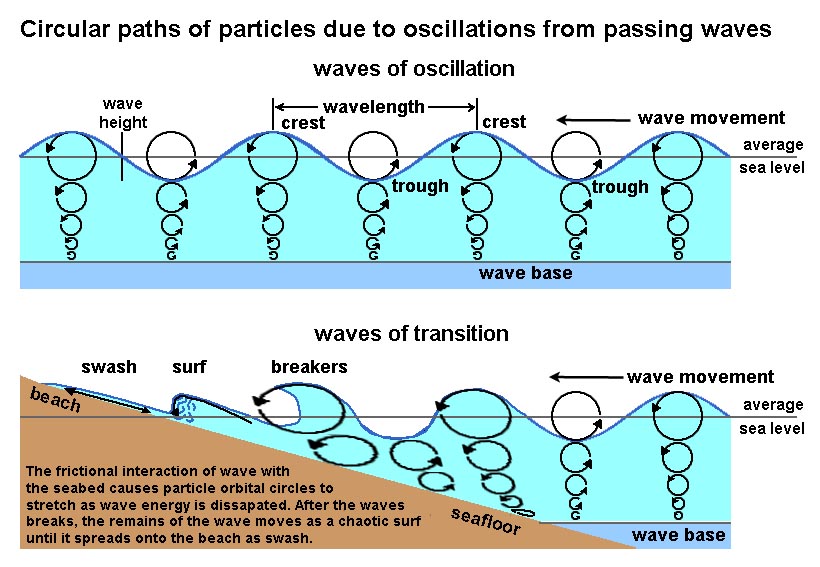 Fig. 10-6. Orbital oscillations in deep and shallow waves.  Fig. 10-7. Waves of oscillation, breakers, and waves of transition moving onto the beach. 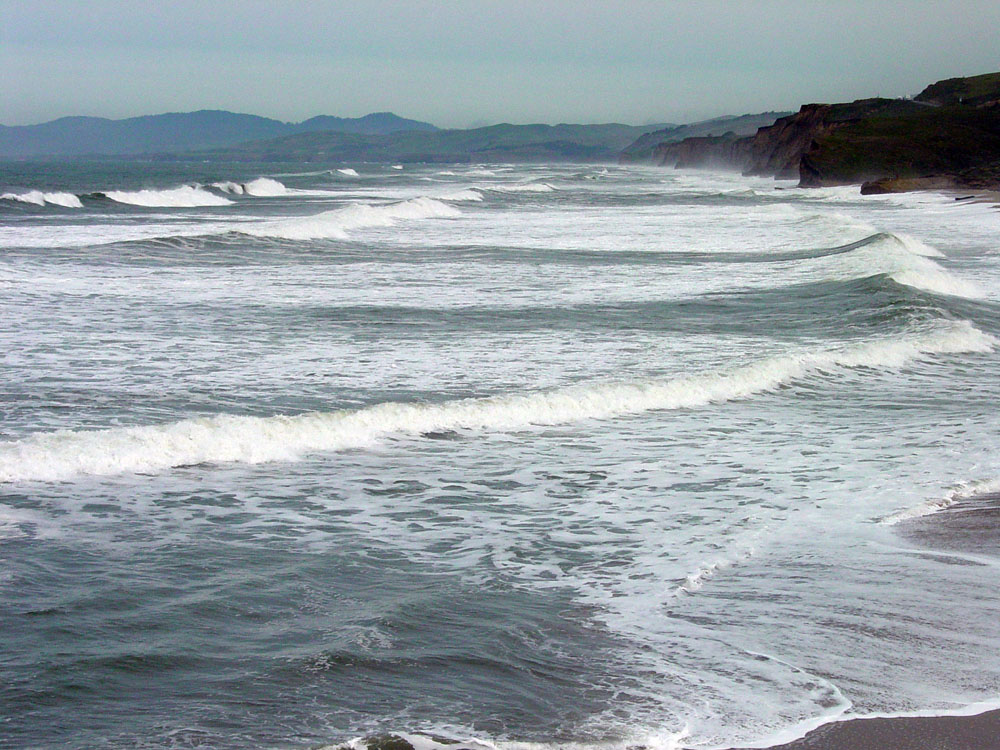 Fig. 10-8. Waves of transition build up, break, and become surf before ending on the beach as swash. 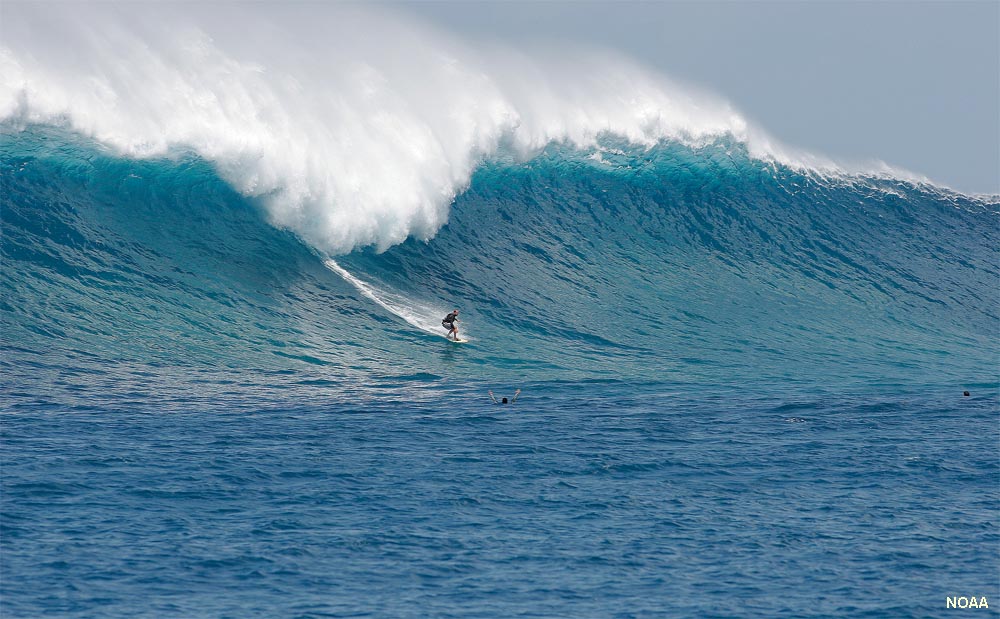 Fig. 10-9. A breaking wave (with surfer in Puerto Rico) |
||||||||||||||||
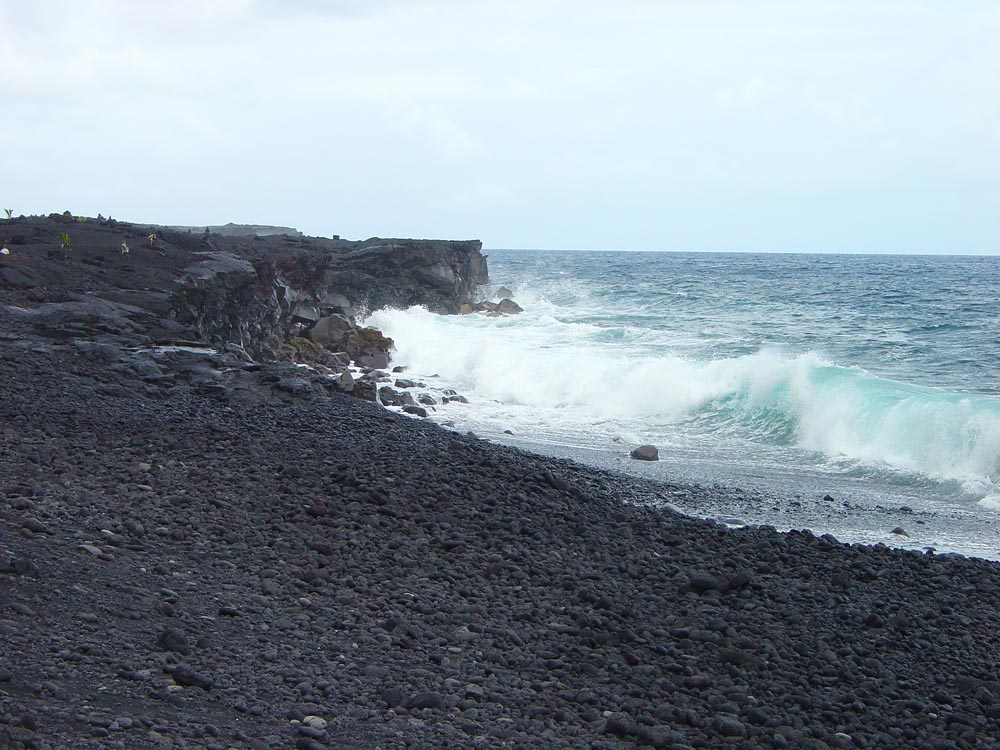
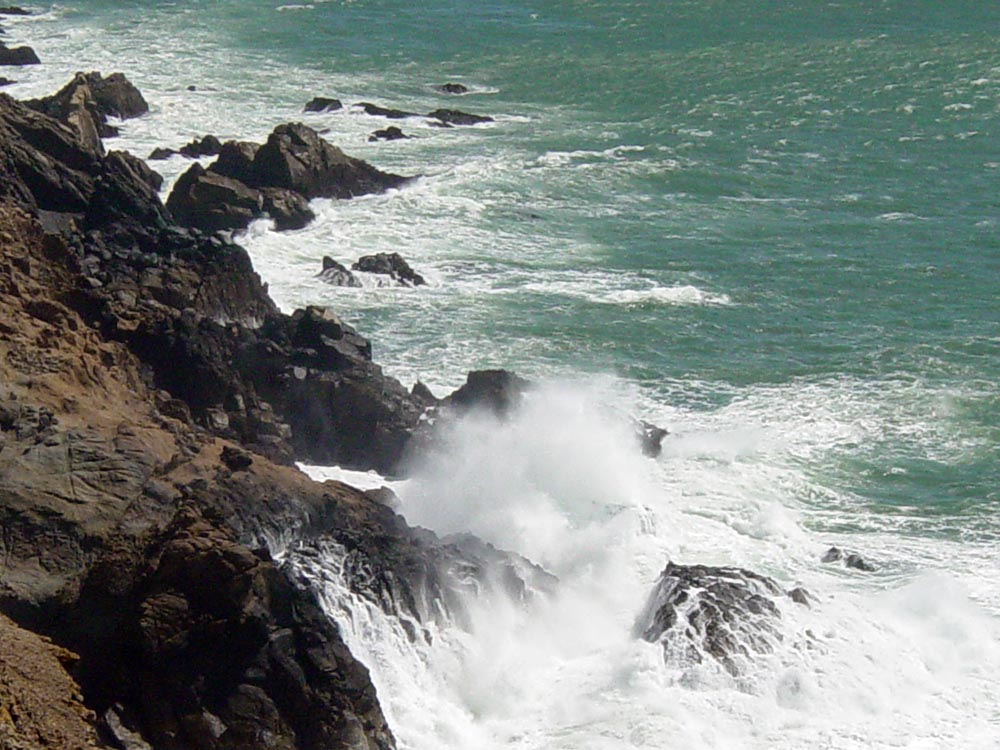
BreakersWhen a wave approaches shore, the base of the wave encounters the bottom—the front of the wave slows down and the back overtakes the front. This forces the water into a peak where the top (crest) curves forward. This peak will eventually fall forward in a tumbling rush of foam and water called a breaker. Waves break on or near shore, they also crash over reefs or offshore sandbars if water depths are shallow.Wave steepness is the ratio of height to wavelength. When wave steepness exceeds a ratio of 1:7, breakers form. Example: If a moving wave has a height of one foot and a length from crest to crest of 8 feet, then the ratio is 1:8 and this wave is not going to break. However, if the height is 1 foot and the length decreases to 6 feet, then the ratio is 1:6, then the wave has now become steep enough that the crest topples over and the wave breaks. Slope of the seabed/beach creates different kinds of breakers There are three types of breaking waves: spilling breakers, plunging breakers, and surging breakers. Breakers may be one or a combination of these types. Gentle slopes produce spilling breakers. Spilling breakers begin far from shore and take a relatively longer time to reach the beach. The breaking crest slides down the front of the wave in a flurry of foam as the wave moves shoreward. Spilling breakers give surfers a long slow ride. Moderate slopes produce plunging breakers. Plunging breakers build up rapidly into a steeply leaning crest. The crest curls further forward of the rest of the wave before crashing down in the surf zone. Plunging breakers are dangerous because the crash into shallow water. Steep slopes produce surging breakers. Surging breakers occur where waves slam directly on the shoreline. With no gentle slope the waves surge onto a steep beach, producing no tumbling surf. Surging breakers also create huge splashes on a rocky cliff shoreline. |
||||||||
|
Wave TrainsA wave train is a group of waves of equal or similar wavelengths traveling in the same direction. Individual waves move from the back to the front of a wave train, gradually building up, peaking, then declining as it moves to the front of the wave train (Figure 10-14). The result is that individual waves within a wave train are moving about twice as the wave train itself. Surfers watching advancing waves may notice that the first waves to arrive decline in intensity as they arrive as the following waves build higher. After the highest crest passes, the trailing waves decline in intensity as the wave train passes. |
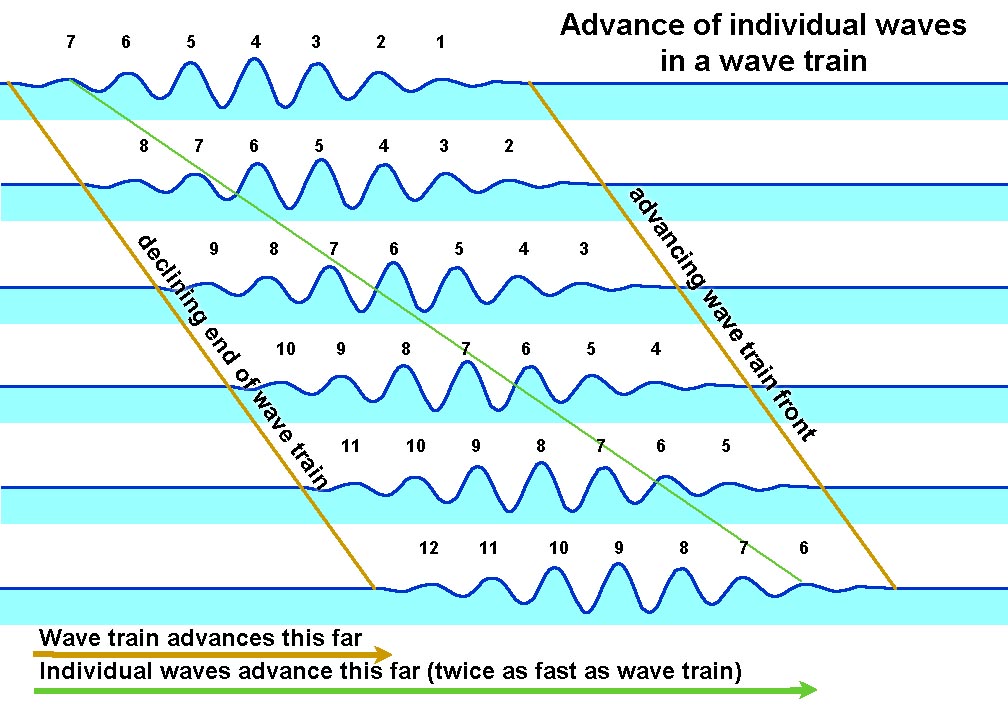 Fig. 10-14. Waves moving through a wave train. |
Origin of Wind WavesWind waves form from wind blowing on the ocean surface. The key factors influencing wave intensity include fetch, wind duration, wind strength, and proximity to wind source area. Wind energy is gradually transferred to the waves forming on a body of water, causing waves to absorb energy and grow in amplitude and period over distance and time (Figure 10-15). The transfer of wind energy to wave energy is not very efficient (only about 2% of the energy is actually transferred) but it is the size of the area that the wind is impacting, as well as how strong the wind is blowing that matters.
Wave Equation: Large Fetch + Long Duration + Strong Winds (wind speed) = Large, Long Period Waves |
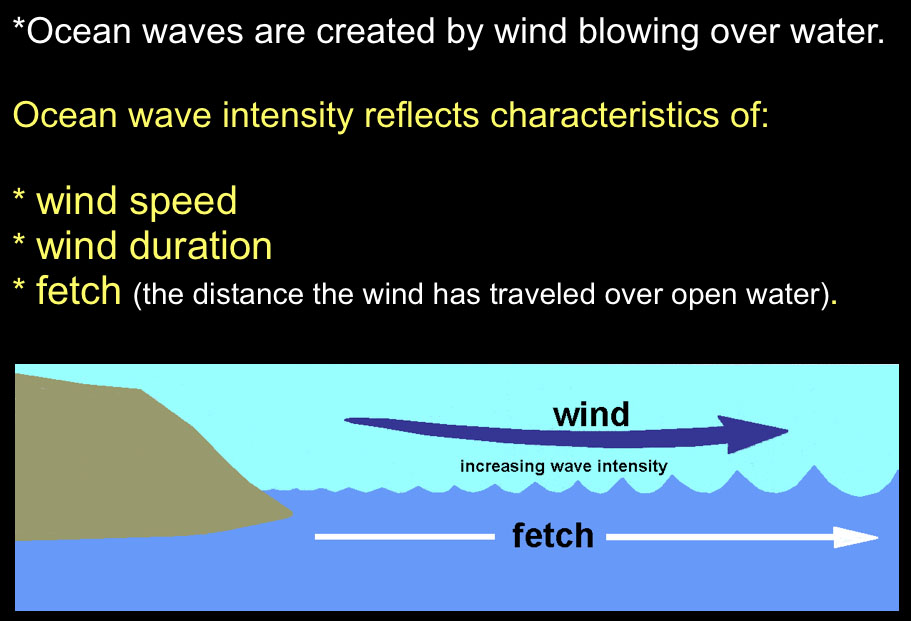 Fig. 10-15. Waves energy depends on wind speed, wind duration, and fetch. 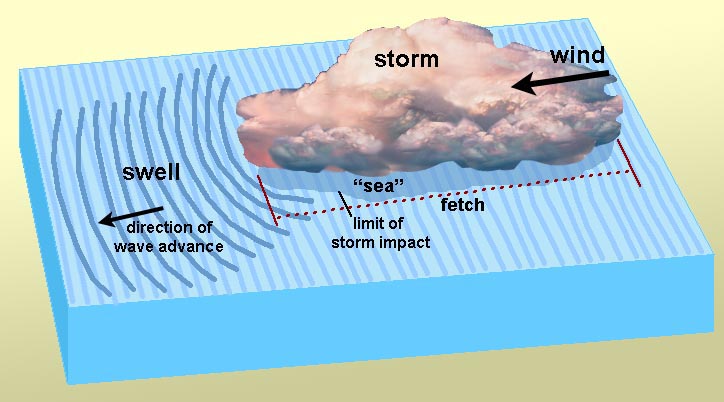 Figure 10-16. Sea and Swells illustrated. A storm generates winds that impact a region over open water. The area impacted by the wind is called a sea. The waves generated by the storm will move out and away from sea are called swell. |
Sea and Swell• Sea: Area where wind waves are generated, mixed period and wavelengths. Seas are typically a chaotic jumble of waves of many different sizes (wave heights, wavelengths, and periods) (Figure 10-16).• Fully Developed Sea: Max size waves can grow given a certain fetch, wind speed and duration. Ocean swell refers to series of ocean surface waves that were not generated by the local wind. Swell refers to an increase in wave height due to a distant storm. Ocean swell waves often have a long wavelength. Swell can develop on lakes and bays, but their size varies with the size of the water body and wave intensity. As waves move out and away from the storm center, they sort themselves out into groups of similar speeds and wavelengths. This produces the smooth undulating ocean surface called a swell. Swells may travel thousands of kilometers from the storm center until they strike shore. Swells are generated by storms over the open ocean, but many ocean swells originate in the oceans around Antarctica where there is high winds with nearly infinite duration and fetch (Figure 10-17). |
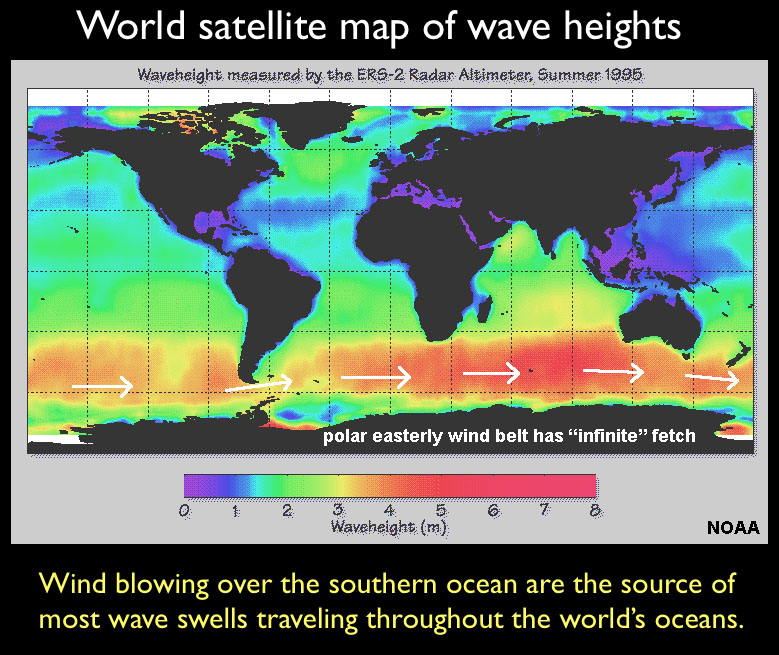 Fig. 10-17. Most ocean swells originate in the southern oceans where strong winds combine with unlimited fetch. |
Wave Dispersion and ComplexityIf you go to the beach frequently, you can see that the pattern and frequency of waves change significantly. Waves generated by storms typically have a mix of wavelengths, wave heights, and direction of movement. The waves with the longest wavelength not only move fastest, but also transmit the most energy and can travel the longest distances. The farther away from a storm, the longer wavelength waves move out ahead of other waves (because they are traveling faster). These become the dominant swell moving away from a storm and the farther they travel, the more even spaced they become (such as illustrated in Figure 10.4). These longer-traveling waves tend to become in phase with the same frequency (wave period). However, when storms move closer to shore, wave patterns become complex (less ideal for surfing!) as waves of different wavelength, wave height, and direction interfere with each other as they approach the coastline. Long wavelength waves can travel great distances before they disperse their energy (across entire ocean basins).Click here to see a short video that illustrates waves moving away from a disturbing force (an acorn falling into a quiet stream). Note how the longer wavelength waves move away faster than the waves with shorter wavelength. The farther the ripples travel, the more they disperse their energy. |
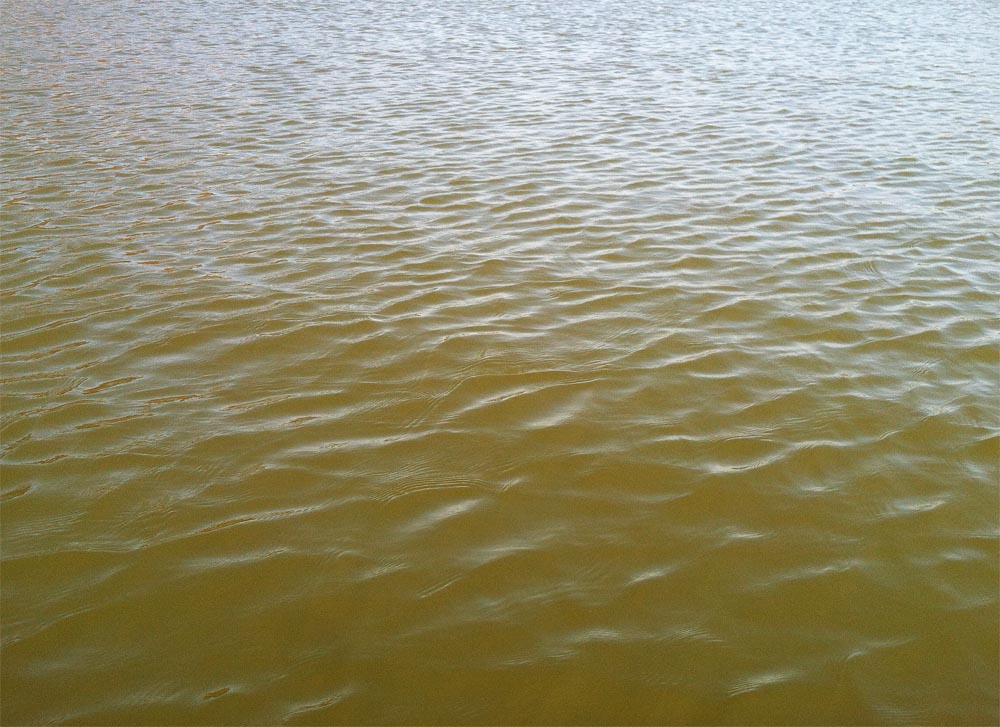
How Waves FormWhen the wind starts to blow, the surface of a water body will go through a progression as waves form and intensify. When the wind starts to blow, the ocean surface will change from calm (mirror-like) conditions to form capillary waves (ripples), chop, wavelets, to waves (each with increasing wavelengths, wave heights, and wave periods). Smaller wave features can form on existing larger wave features, adding to the complexity of the water's surface.Ripples (Capillary Waves)Capillary waves are very small waves with wavelengths less than 1.7 cm or 0.68 inches (Figure 10-18). The formation of capillary waves is influenced by both the effects of surface tension and gravity. The ruffling of the water’s surface due to pressure variations of the wind on the water. This creates stress on the water and results in tiny short wavelength waves called ripples. Ripples are often called capillary waves. The motion of a ripple is governed by surface tension. They are the first waves to form when the wind blows over the surface of the water and are created by the friction of wind and the surface tension of the water. These tiny little waves increase the surface area of the sea surface and if the wind continues to blow, the size of the wave will increase in size and become a wind wave.ChopChop refers to small waves causing the ocean surface to be rough. Ripples and small wavelets form and move independently of large waves moving through an area, creating rough and irregular wave patterns (Figure 10-19). |
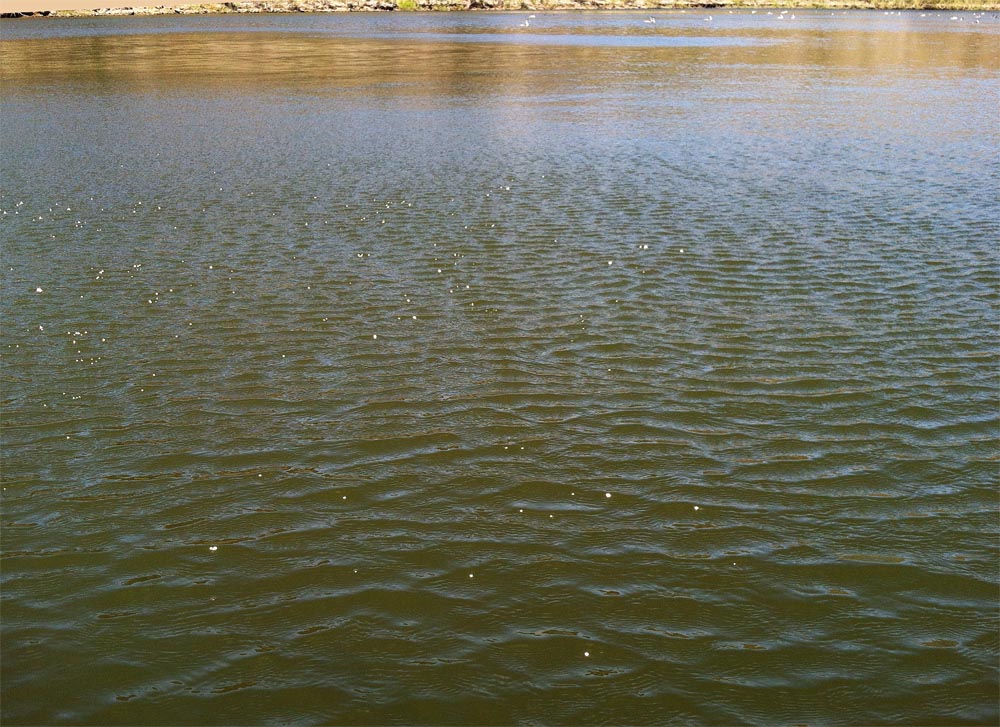 Fig. 10-18. Capillary wave (ripples) forming next to a calm area (Lake Hodges, CA) 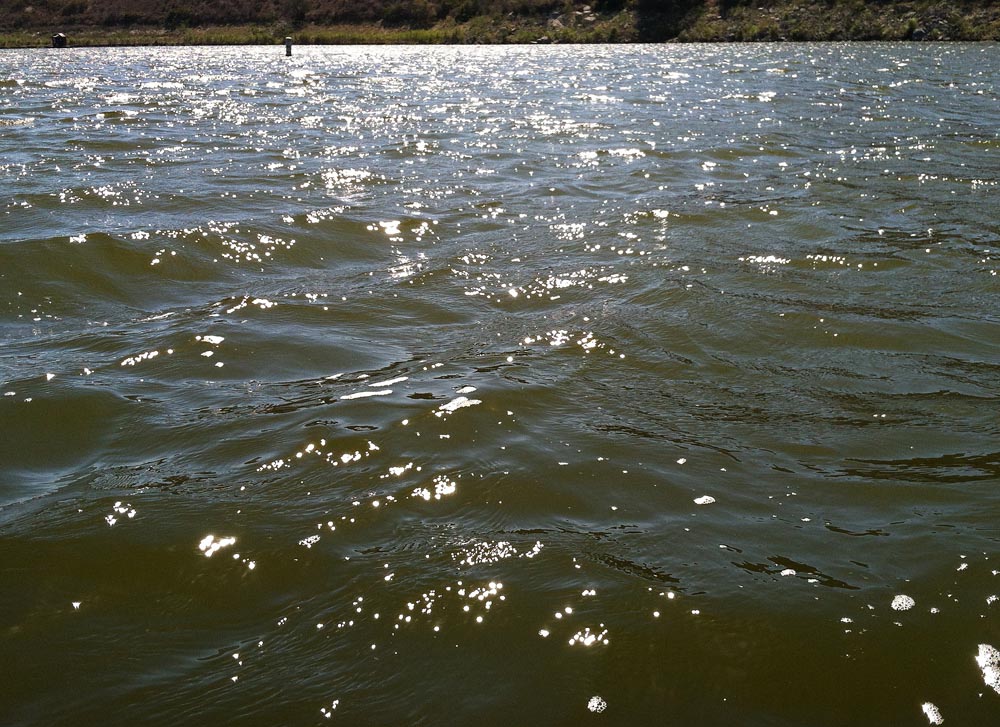 Fig. 10-19. With increasing fetch, ripples merge to become wavelets in choppy surface water conditions. |
Cat's PawsA cat's paw is the imprint that a light breeze that ruffles small areas of a water surface. When generated by light wind in open water, a nautical name for them is cat's paw waves, since they may resemble paw prints (Figure 10-20). Light breezes which stir up such small ripples are also sometimes referred to as cat's paws. On the open ocean, much larger ocean surface waves (seas and swells) may result from coalescence of smaller wind-caused ripple-waves.A squall is a sudden violent gust of wind or a localized storm. A squall line is a line of thunderstorms that can form along or ahead of a cold front. It contains heavy precipitation, hail, frequent lightning, strong straight-line winds, and possibly tornadoes and waterspouts. At sea, a squall is used to describe a relatively rapid change in weather from calm or mild weather to sudden strong winds and intense precipitation, usually associated with passing a cold front. |
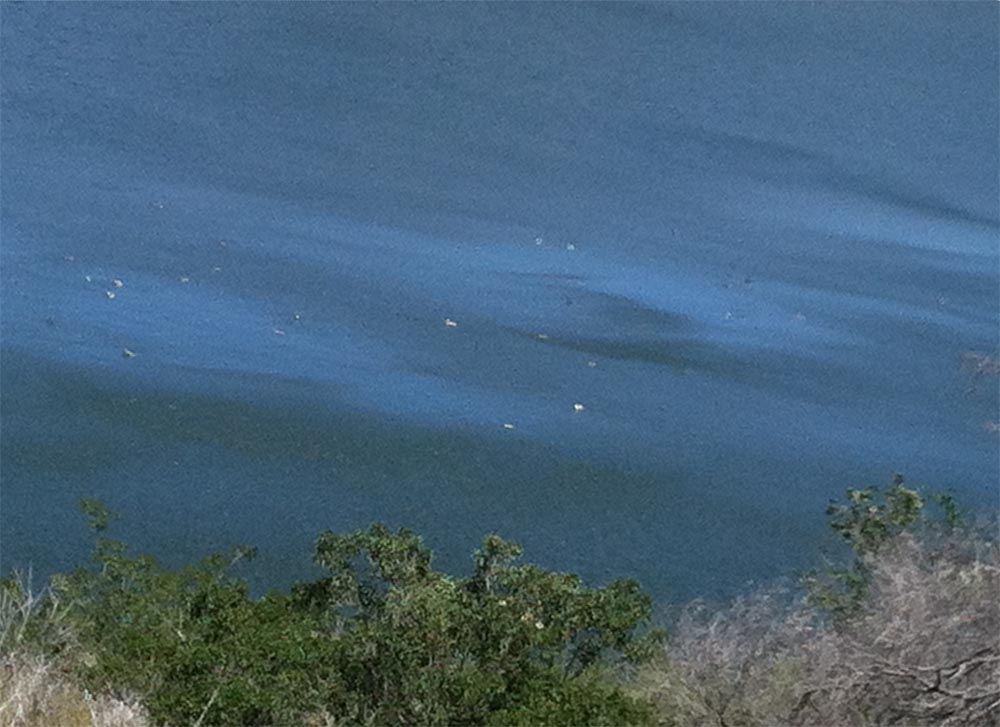 Fig. 10-20. Wind gusts creating cat paws capillary ripple patterns on the lake surface. |
Beaufort Wind Force Scale (Wind Velocity, Wave Height, and Sea Conditions)The Beaufort wind force scale relates wind speed (velocity) to observed conditions at sea (including wave height) or impact of features on land. It is a numbered scale from 0 to 12 to describe sea conditions and wave size. The Beaufort Scale was developed by Rear Admiral Sir Francis Beaufort 1774-1857, an officer in Britain's Royal Navy). Zero 0 on the Beaufort scale represents the calmest of seas (the water is so smooth that it looks like glass). A 12 on the Beaufort scale represents hurricane force waves (Figure 10-21). |
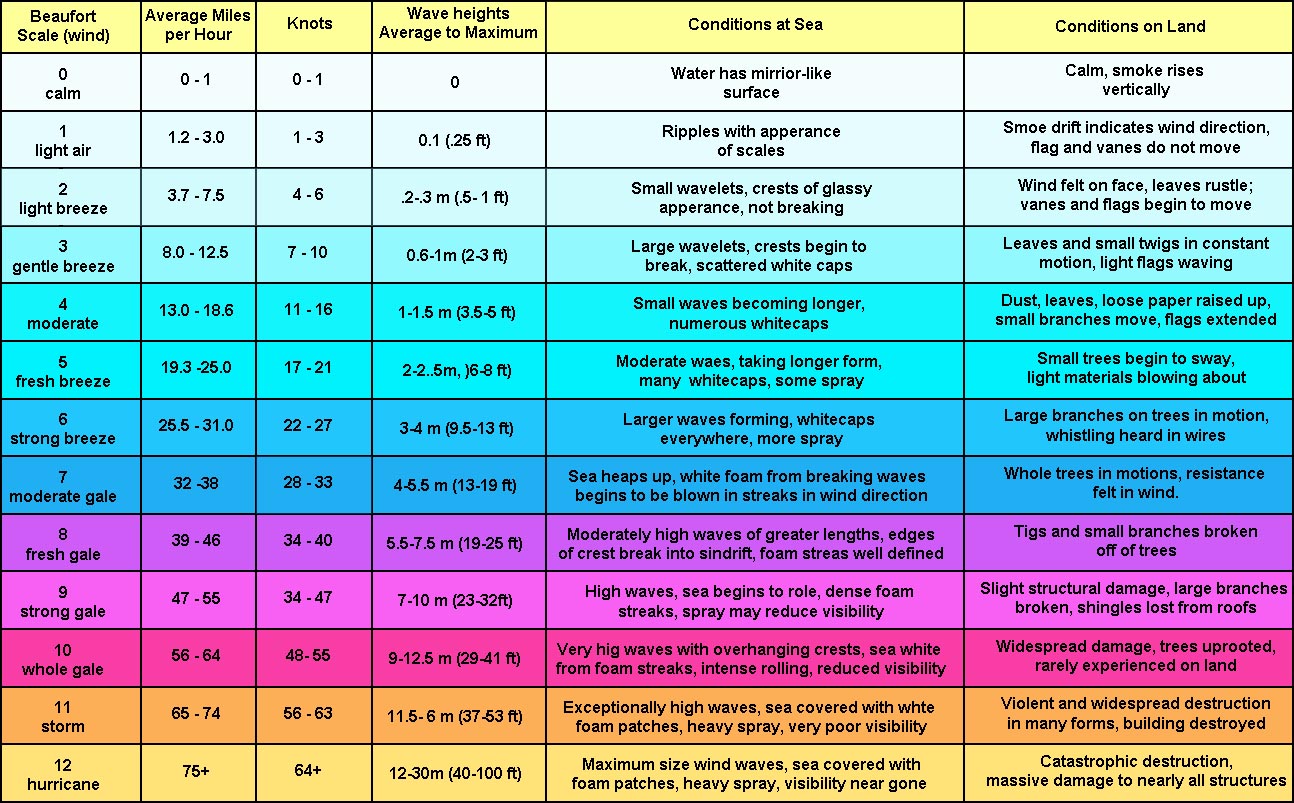 Figure 10-21. Beaufort Wind Force Scale for sea conditions (and on land). |
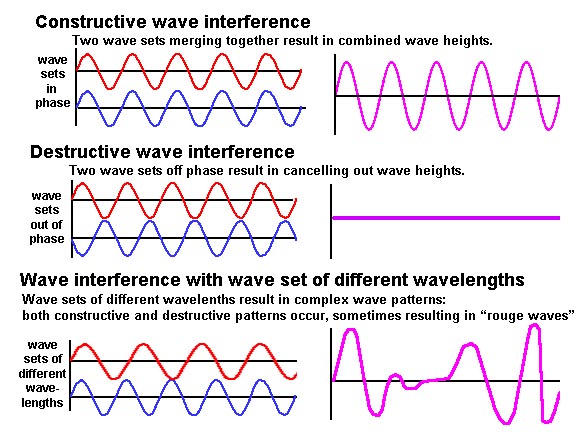
Wave Interference PatternsWave interference occurs where waves from different sources collide (Figures 10-22 and 10-23).Constructive wave interference occurs where waves come together in phase or crest meets another crest (or trough meets another trough) . • Destructive wave interference: Waves come together out of phase or crest meets a trough. |
 |
 |
| Fig. 10-22. Examples of constructive and destructive wave interference patterns. | Fig. 10-23. Interference patterns created by winds gusts blowing from different directions. |
Rogue WavesRogue waves are large, unpredictable, and dangerous. Rogue waves (also called 'extreme storm waves') are those waves which are greater than twice the size of surrounding waves. They often come unexpectedly from directions other than prevailing wind and waves. Many reports of extreme storm waves describe them sudden "walls of water." They are often steep-sided and associated with unusually deep troughs. Some rogue waves are a result of constructive interference of swells traveling at different speeds and directions. As these swells pass through one another, their crests, troughs, and wavelengths sometimes coincide and reinforce each other. This process produces large, towering waves that quickly form and disappear. If the swells are traveling roughly in the same direction, these massive waves may last for several minutes before subsiding. Rogue waves can also form when storm swells move against a strong current, resulting in a shortening of the wavelength and increasing it’s amplitude. Large rouge wave of this kind are frequently experienced in the Gulf Stream and Agulhas currents (Figure 10-24). |
 Fig. 10-24. This 60 foot rouge wave threatened a ship in the Gulf Stream near Charleston, South Carolina. Rogue wave have sunk ships, destroyed drilling rigs, and are responsible for many deaths and injuries along coastlines. |
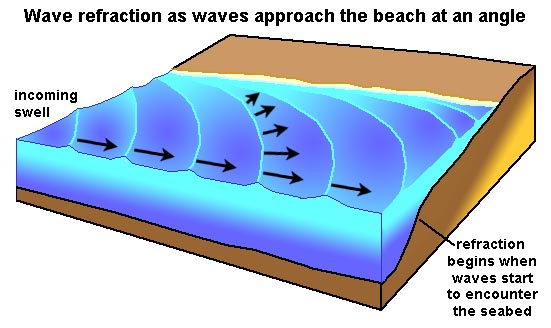
Surfer's Guide to Wave Forecasting for San Diego CountySan Diego County Swell Window• The compass bearing window that we can receive swell from is between 180° and 340° (Figure 10-27). Waves are weak on the “edges” of this window. The best part of our window is really between 200° and 300° degrees because the waves simply have to bend too much to be received on our coastline if they are outside of that range. |
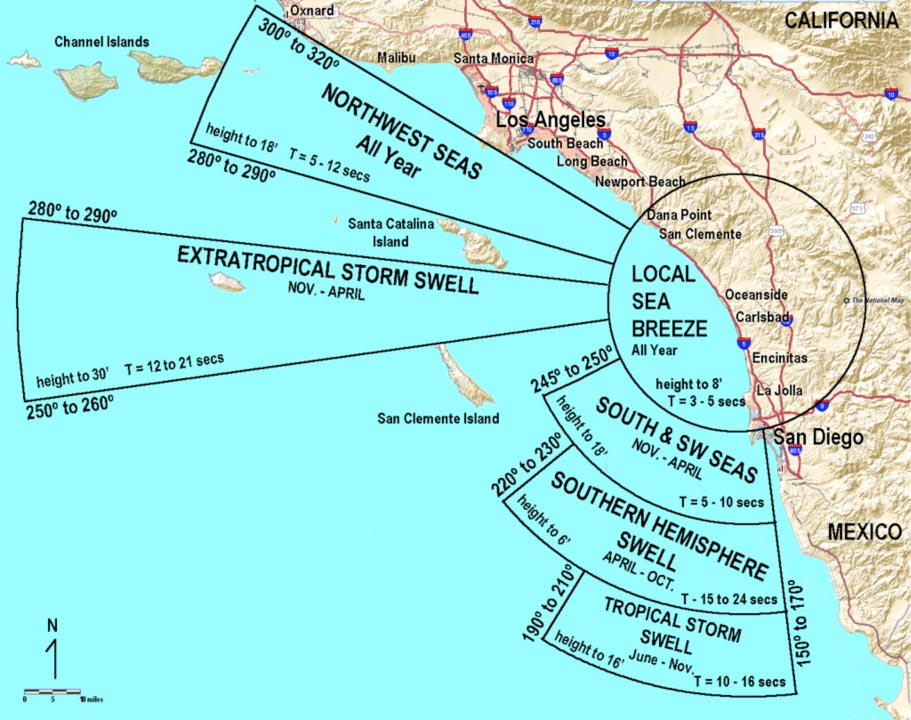 Fig. 10-27. The swell window for San Diego County is roughly between 180° and 340° (with North being 360°). |
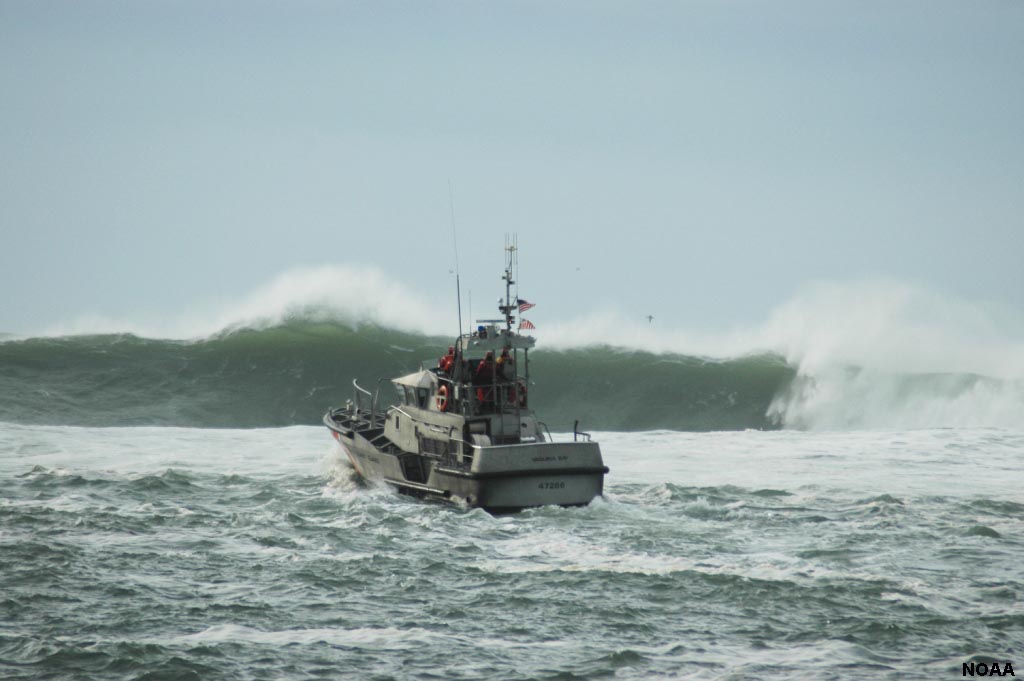
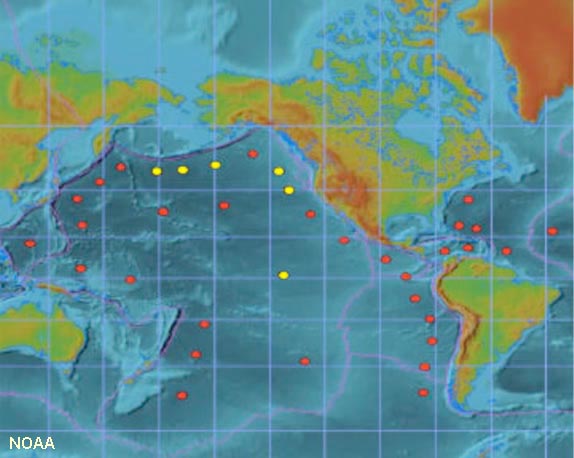
Getting Swell Information Data Real-TimeCasual surfers in San Diego County can get forecasts of waves from a number of surfing and weather websites. However,professional surfers (and swell wave forecasters for navigation and other purposes) use real-time buoy information available from the National Data Buoy Center (NOAA) network to evaluate swell period and height in different parts of the Pacific Ocean basin and around the world. Data from this system is incorporated into many government weather and commercial shipping navigation websites and several surfing organization websites. For example: check this maximum wave energy animation: http://www.surf-forecast.com/ -- click on the slider bar and move through the 12 day forecast and watch the wave energy patterns move across the ocean basins. This website also shows wave energy, wave height, and wind maps for the current day. Surfers check at distant buoy locations to look for increases in wave period, but not so much in wave height. (Why?) |
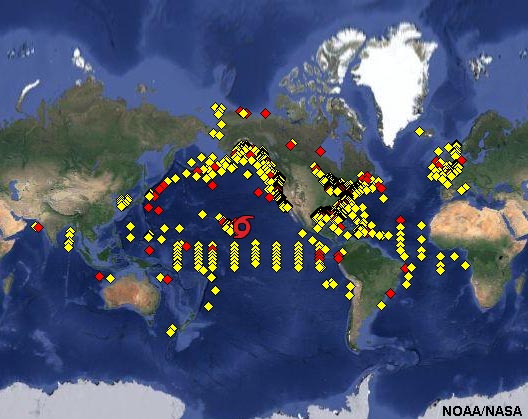 Fig. 10-28. Location of buoys associated with the National Data Buoy Center (NOAA). |
Summer Swells Affecting San Diego County• Swell generated between Antarctica and New Zealand dominates the world oceans much of the year because it is a region with large storms (largest on Earth), and there is constant wind (infinite duration) and unhindered passage over open waters (infinite fetch)(Figure 10-29). Winter Swells Affecting San Diego County• Winter swells are largest swells on average in San Diego County• San Diego's winter swell is mostly generated in the Gulf of Alaska, most begin off of the Kuril Islands • Storm track is generally from west to east • Early season swell is usually more northerly (N or NNW direction or about 320 to 340 degrees). • Later season storms drop farther south and give us a more westerly swell direction from about 280 to 300 degrees. We also get more rain from these storms. • Partial swell blockage occurs in the Southern California Bight from wave shadows created from the Channel Islands. • During the winter the largest surf is in southern San Diego County and northern Baja. We also can get colder water and upwelling conditions. Locally Generated Swell In San Diego RegionWe have a number of locally generated swells that come from smaller storms in the Pacific Northwest.• These storms produce surf that has a shorter period (between 6 and 10 seconds) because the storms are not very large. • The swell angle is very steep from the north-northwest around 320 to 340 degrees. • We often get upwelling associated with these storms as well. Hurricane Swell In San Diego RegionDuring the late summer and early fall we can get swell from hurricanes that form off of the coast of mainland Mexico.• The wave periods generated from these storms is usually between 10 and 14 seconds. • The key identifying waves from these storms is the angle. The swell angle begins from the S or SSE between 160 and 180 degrees. The angle increases with time as the storm moves up the coast and either onshore or out to sea towards Hawaii. |
Long period waves make better surfing waves because they impact the seafloor sooner (at a deeper wave depth), they build up higher, and last longer.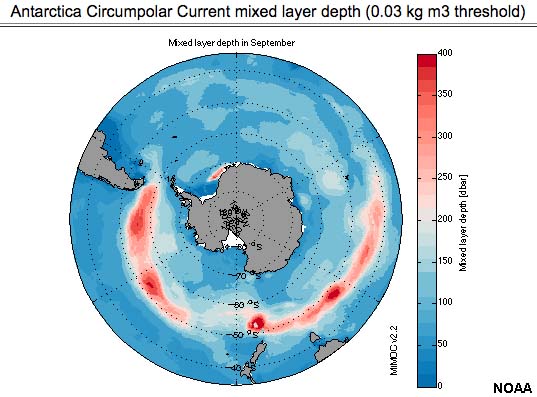 Fig. 10-29. The Antarctic Circumpolar wind belt is the source of most ocean swells around the world. Why? (Think wind speed, duration, and fetch!) |
Tsunamis |
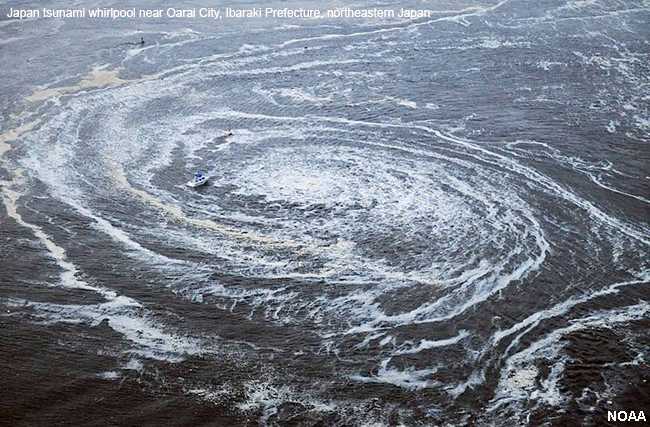
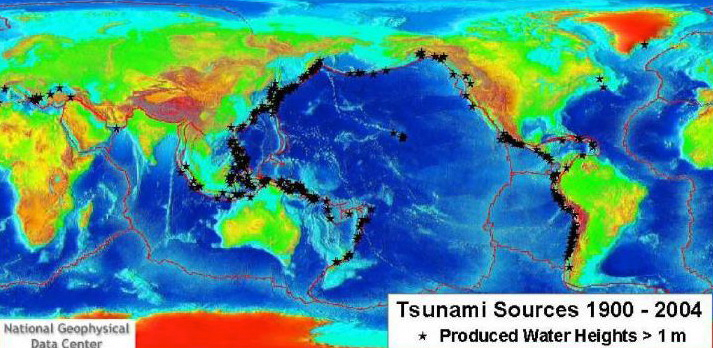
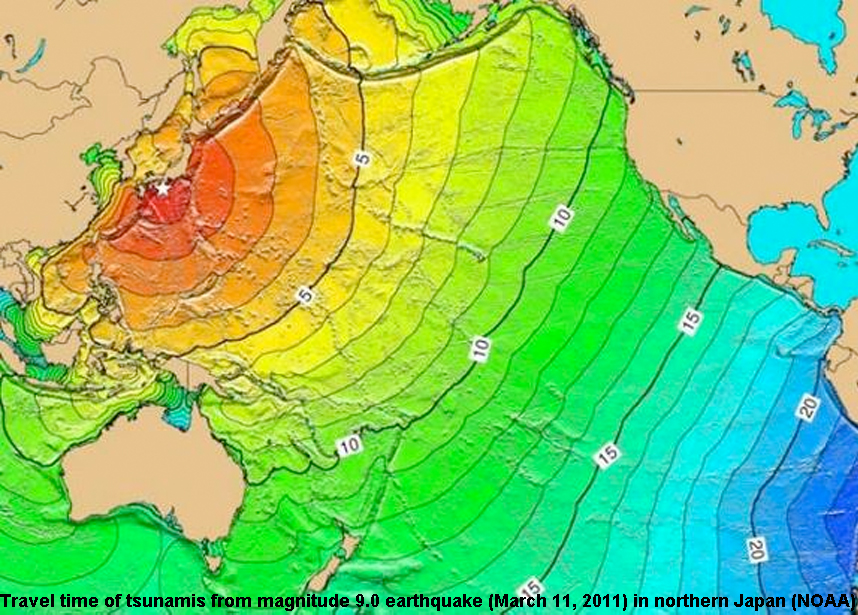
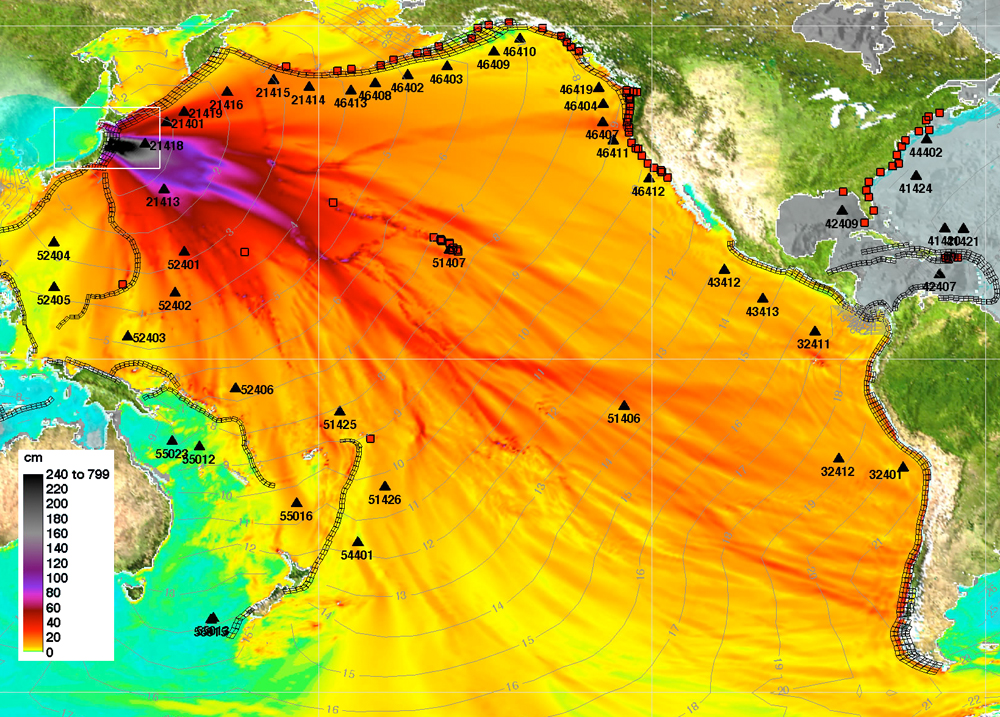
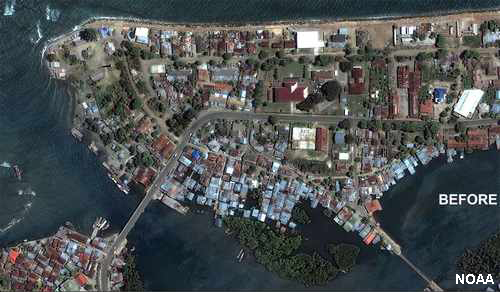
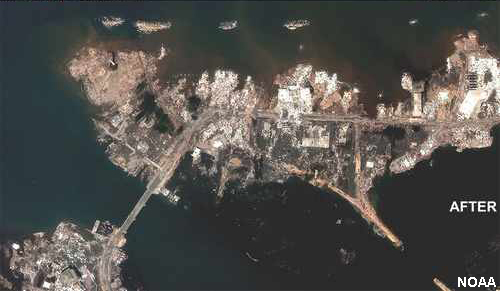
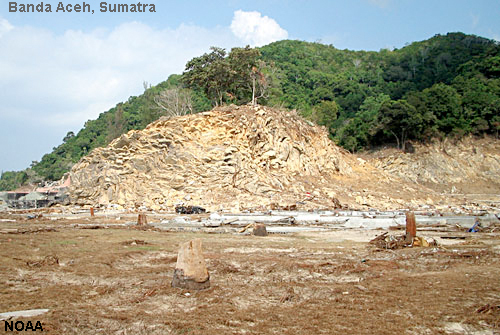
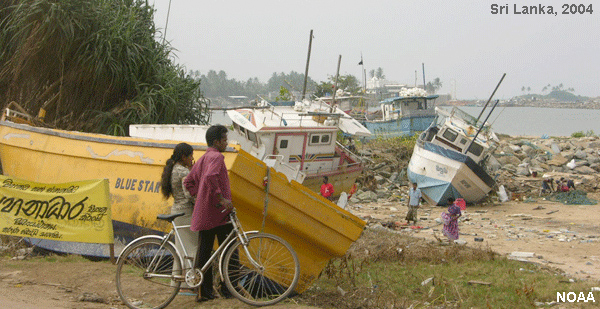
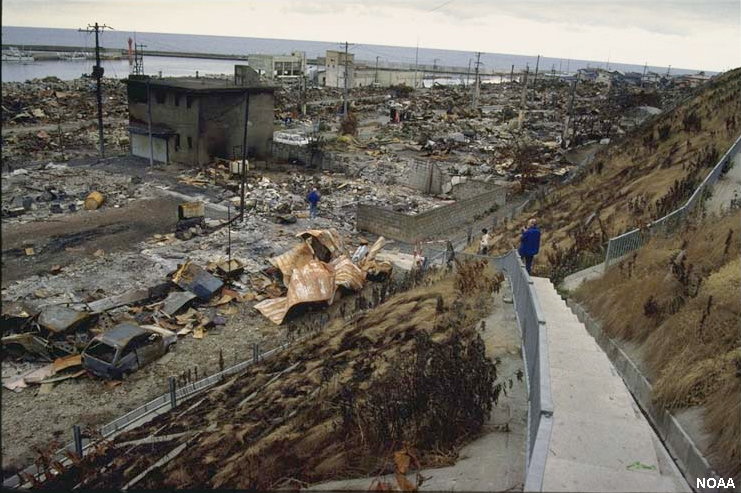
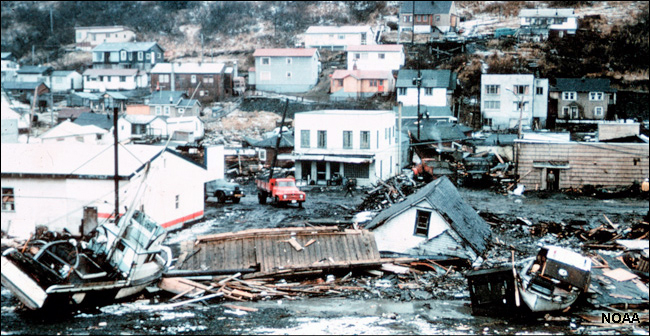
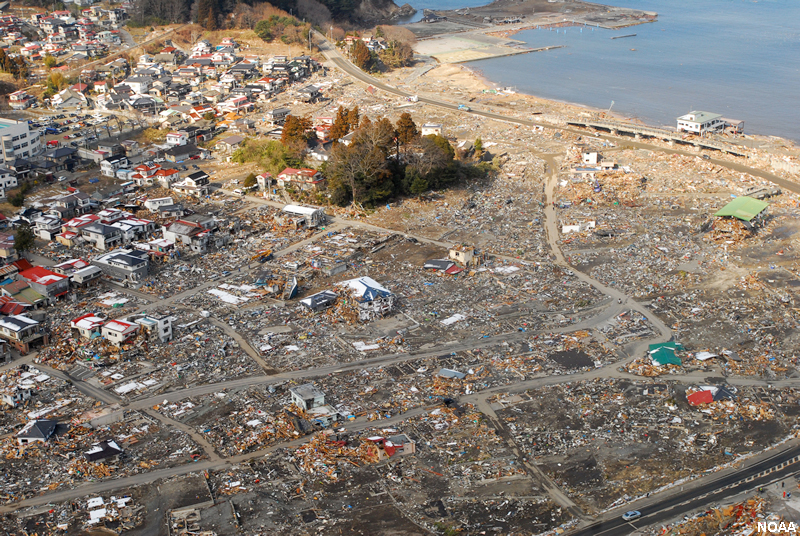
A tsunami is a very long and/or high sea wave or coastal serge of water caused by an earthquake or other disturbance. Tsunamis get their name from Japan (where they are fairly common): "Tsu"[ harbor], "nami" [wave]. Tsunamis are caused by displacement of the earth's crust under an ocean or body of water of any size. They can also be generated by earthquakes, volcanic explosions, underwater landslides, even asteroid impacts. When the solid earth moves, the water above it also moves with it (Figures 10-32 and 10-33). Tsunamis are the result of both the initial shock waves and the following motion of the water readjusting to a stable pool (sea level). Tsunamis can travel great distances throughout the world's ocean. Their energy is dissipated when they approach shorelines where they come onshore as a great surge of water, with or without massive waves crashing onshore. Although most tsunamis are small (barely detectable), some modern tsunamis have reached inland elevations many hundreds of feet above sea level.
|
 Fig. 10-32. How a tsunami is generated by an earthquake. 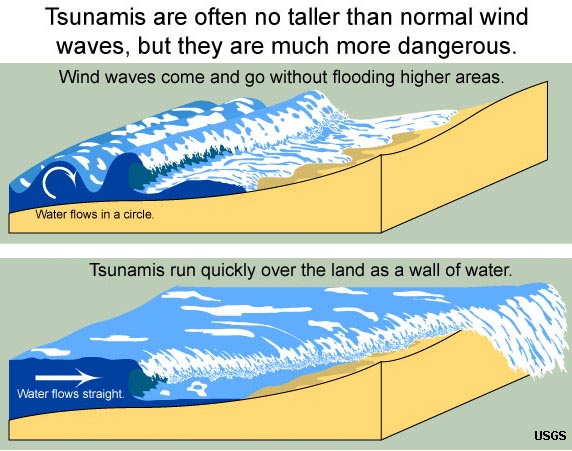 Fig. 10-33. Tsunamis move onshore more as a surge than just a wave. |
|
|||||||||||||||||||||||||||||||||||||||
|
||||||||||||||||||||||


Tsunami videosNOTE! There are many amazing animations about tsunamis, but their links on YouTube are constantly changing. The two videos shown here were working as of 3/28/2021). Note that these videos can be quite disturbing to some people and viewer disgression is advised.Indonesia Tsunami 2004 (NOAA): Tsunami waves move out animation of Indian Ocean |
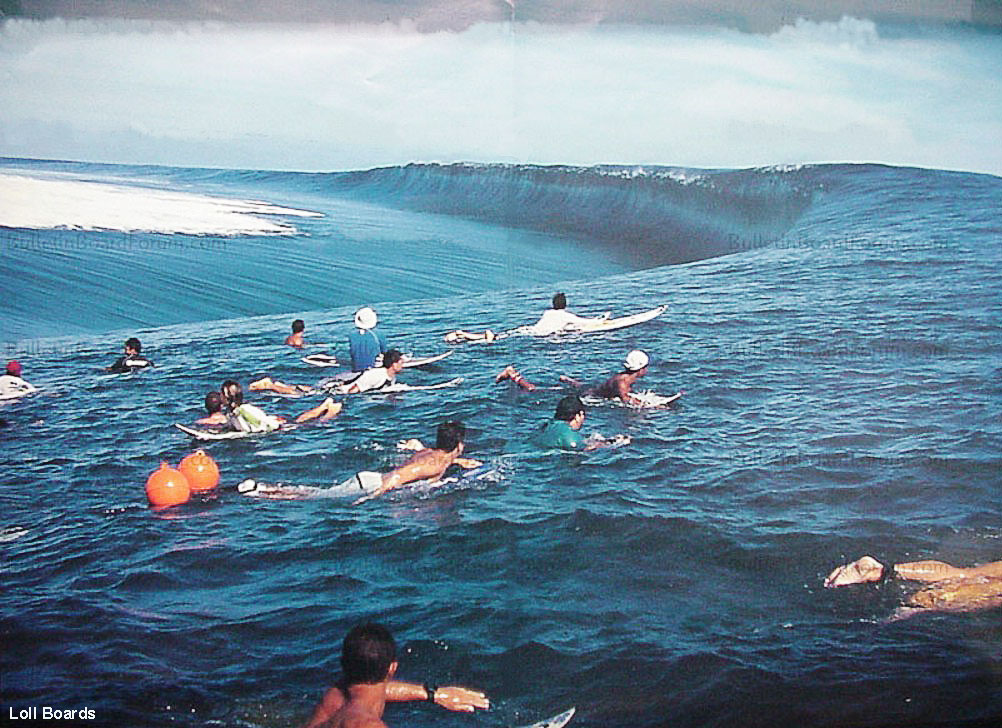 Fig. 10-52. Surfing a tsunami wave? (Not recommended!) |
| Chapter 10 quiz questions |