
Introduction to Physical Geology |
Chapter 15 - Ocean Processes & Shorelines |
| According to a study by the United Nations, about 40 percent of the people around the planet live within about 60 miles of a coastline. It is essential that coastal citizens are prepared to face the challenges associated with coastal processes. Shorelines are constantly changing, influence by both natural and human-induced processes. The first part of this chapter is a summary of oceanographic processes that ultimately influence our planet's regional climates and coastlines. Factors discussed include the nature of seawater, waves, currents, tides, and erosional processes that influence features along coastlines. The second part of this chapter is about landforms along coastlines and how they form by both the erosion and deposition of sediments and by the movement of sediments along coastlines by wave and current actions. The fact that human like to live near the ocean or along bodies of water is problematic because shorelines are constantly changing from both natural and man-made causes. Coastal development is extremely expensive and difficult to maintain, even without major disasters associated with hurricanes, floods, tsunamis. The daily scour of waves, tides, and currents has a long-term impact on shorelines. In addition, sea-level is slowly rising and impacting coastlines everywhere. |
Click on images for a larger view. |
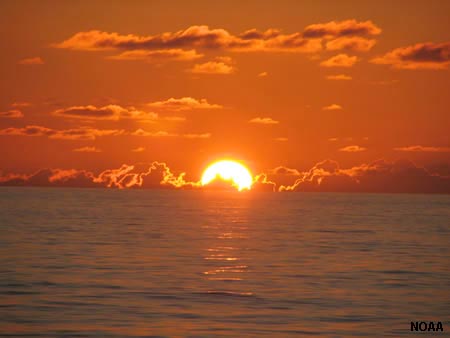 Fig. 15-1. The Sun's energy ultimately influences almost all things oceanographic. |
Distribution of Water On Earth97.2% is in the world oceans.2.15% is frozen in glaciers and ice caps. 0.62% is in groundwater and soil moisture. 0.02% is in streams and lakes. 0.001% as water vapor in the atmosphere. Seawater is the most abundant resource on Earth! Seawater has evolved to what it is over the billions of years that oceans have existed on Earth. Seawater has gained its salt (salinity) from erosion from land, volcanism, and rock-water interactions on the seafloor. Evaporation concentrates salts in water, eventually converting freshwater to seawater. |
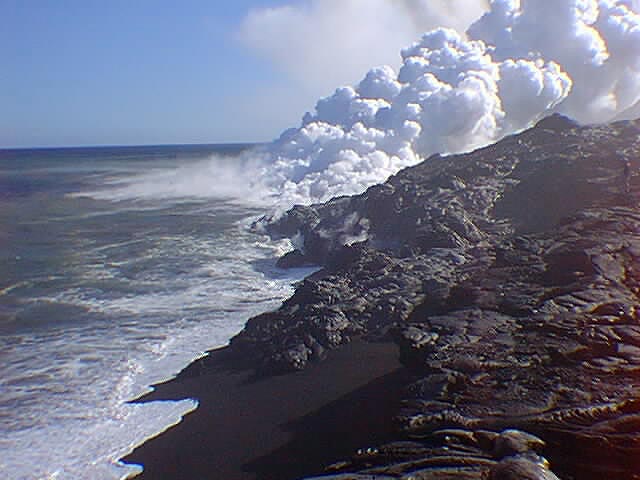 Fig. 15-2. New land forming and eroding on a Hawaii volcano. |
Components of SeawaterSeawater is composed of:• Water • Dissolved matter: solids and gas (as ions) • Suspended matter (dust and organic residues) Figure 15-3 illustrates the elemental components of salts dissolved in seawater. |
|
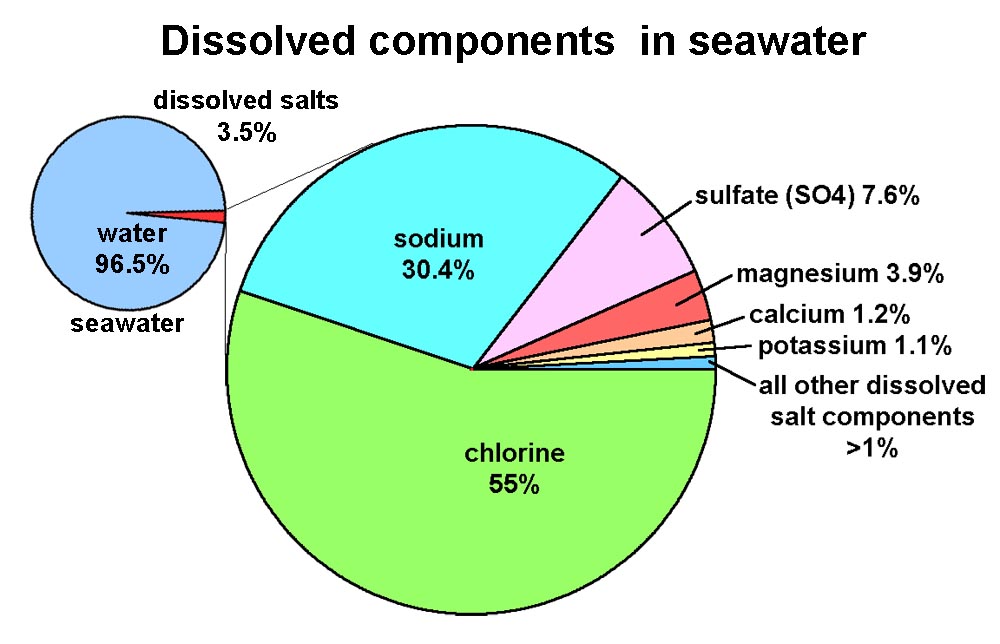 Fig. 15-3. Components of seawater. |
|
Where does salt in seawater come from?Salt in seawater comes from a variety of sources:• Salts are released the mechanical and chemical breakdown of rocks on land. • Salts in seawater comes from salts dissolved in streams and groundwater draining off of the continents. • Salts are released by hydrothermal vents on the seafloor. Salts are concentrated in seawater through evaporation. The amount of salts dissolved in seawater is a direct reflection of the great age of the Earth and its oceans. |
|||
Salinity |
|||||
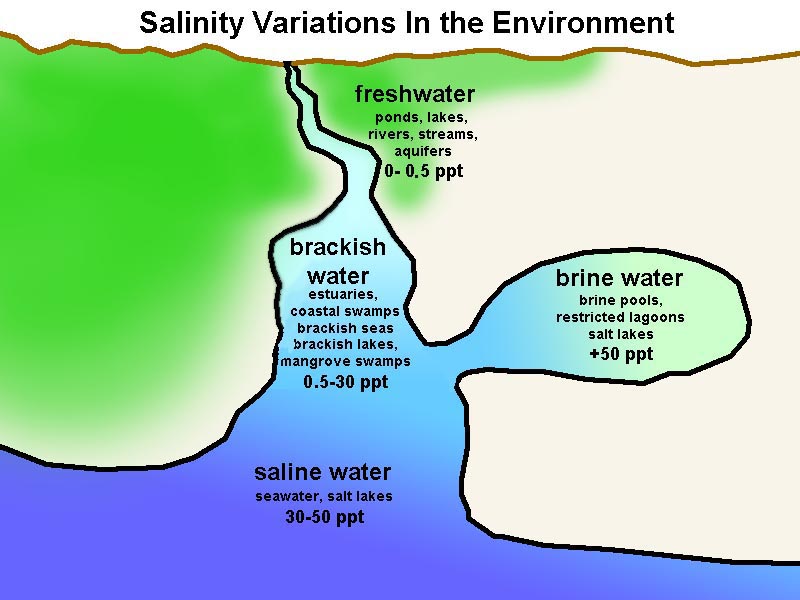
| Salinity is a measure of the total amount of solid material (salts) dissolved in water. Salinity is measured in parts-per-thousand (‰ or ppt).
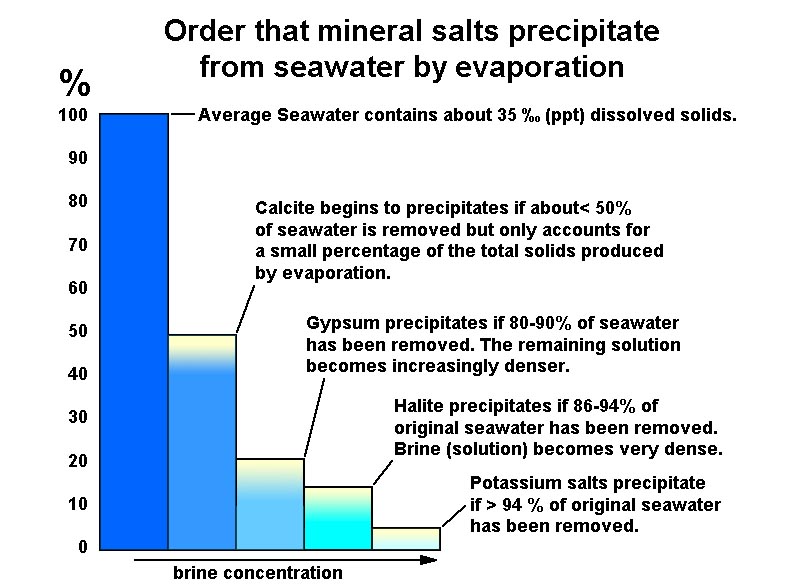
Fresh water (including drinking water) is typically less than 1 ‰ (ppt). Average seawater in the oceans is about 35 ‰ (ppt). Water that contains salt content between fresh and seawater is called brackish. A brine is water that is concentrated with higher levels of salt than seawater. The salinity of coastal waters can vary considerably. The mixing of fresh water from streams or from precipitation reduces salinity, whereas, evaporation concentrates seawater. When evaporation concentrates salty water to it saturation point, salt crystals will precipitate (Figures 15-3 to 15-6). Evaporation of seawater results in precipitation of mineral salts.As seawater evaporates in a restricted basin, seawater is concentrated becoming a brine. As evaporation proceeds various mineral salts will precipitate out in the reverse order of their solubility. Salty sedimentary deposits produced by evaporation are called evaporites. The first to precipitate is CaCO3 (calcite) (calcite may be consumed by organisms first). Next come CaSO4 (gypsum and anhydrite varieties). This is followed by NaCl (salt, mineral name: halite; rock name: rock salt). By volume, NaCl is the most abundant salt from seawater. The last to precipitate are potassium salts (sylvite: KCl and others) and magnesium salts (epson salt; MgSO4 and others). Various other trace salt compounds are concentrated in the last of the brine to evaporate. About 80 different salt minerals have been reportedly found in evaporite deposits. |
Variation of salinity in salinity in natural waters • Mountain spring water - 0.3 ‰ (ppt) (fresh) • Tap water - 0.7 ‰ (ppt) (fresh) • Limit on agriculture irrigation - 2 ‰ (ppt) • Baltic Sea - 10 ‰ (ppt) (brackish) • Black Sea - 18 ‰ (ppt) (brackish) • Average Ocean - 35 ‰ (ppt) • Mediterranean Sea - 38 ‰ (ppt) • Red Sea - 42 ‰ (ppt) (hypersaline) • Great Salt Lake - 280 ‰ (ppt) (hypersaline) • Dead Sea - 330 ‰ (ppt) (hypersaline) |
||||
|
|||||
Impacts of Temperature and Salinity Variations on Seawater and Ocean BasinsTemperature and salinity variations in seawater have great significance to the movement of currents in ocean basins. Both factors influence the density of seawater. Without turbulence to mix waters, warm water floats on cold water. Likewise, freshwater will float on salt water. A warm body of water floating on the surface of the ocean is called a thermocline. Thermoclines cover large portions of ocean basins in tropical regions where lack of currents and turbulence prevent mixing of warm surface waters from mixing with colder waters at depth. Similarly, freshwater or diluted seawater is less dense and will float on normal seawater. Without strong currents and mixing, freshwater from streams can pool on the surface of the ocean nearshore, forming a halocline. In contrast, muddy waters (with particles in suspension) such as from a flood or a turbidity flow can sink to the bottom below less-dense surface waters.The relationships of temperature, salinity, and density of seawater:• as temperature increases, density decreases.• as salinity increases, density increases. • as temperature changes, salinity remains the same. |
Changes in Temperature, Salinity, and Density with Water Depth• A thermocline is a steep temperature gradient in a body of water marked by a layer above and below which the water is at different temperatures (Figure 15-8).• A halocline is a vertical zone in the oceanic water column in which salinity changes rapidly with depth. • A pycnocline is a layer in an ocean or other body of water in which water density increases rapidly with depth (may be a combination of the effects of temperature, salinity, or sediment suspended in the water). Thermoclines significantly influence biological productivity in ocean environments.• Thermoclines form from solar heating of the ocean surface.• As surface waters warm, they become isolated because they are lower density than the colder water below. • A blanket of warm surface waters will thicken with seasonal heating and may eventually reduce or prevent surface waters from mixing with more nutrient-rich colder waters at depth. • Warm surface waters above the thermocline can become depleted of nutrients essential for biological productivity in the oceans. • Regions with thick thermoclines support less sea life than colder water regions with little or no thermocline. The Mixing Zone (Surface Waters)Uppermost water where mixing from currents make temperature, salinity, and density mostly constant. The mixing is a result of surface waters by wave action and wind-driven currents (Figure 15-9).Vertical changes in temperature with latitude: • Tropical regions have a strong thermocline. • Temperate (mid latitude) regions have weak thermoclines (moderate in summer, less in winter). • Polar regions have almost no thermocline. |
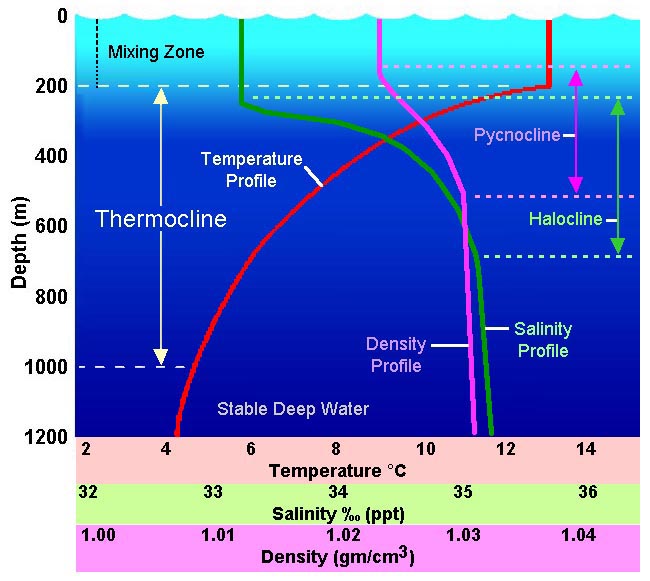 Fig. 15-8. The cline curves - illustration showing the relationship of thermoclines, haloclines, and pycnoclines and water depth. 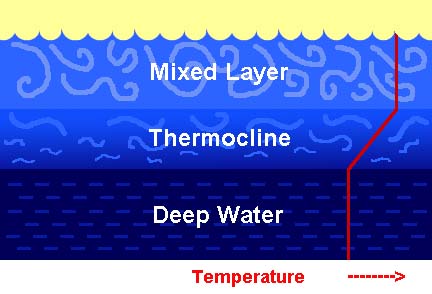 Fig. 15-9. The mixing zone is where surface waters experience turbulence, but deeper down, lack of turbulence allow density stratification to occur. |
The Coriolis Effect On Atmosphere and OceansHeat from incoming solar radiation is the driving force behind the fluid motion of the atmosphere and the oceans. However, the patterns of motion are also influenced by the forces created by the rotation of the Earth on its axis. Because air and seawater have mass, they maintain momentum when moving. Air moves from a location of high pressure to low pressure. Ocean currents are driven by wind currents and changes in seawater density. However, because the Earth is rotating, this rotation causes an observable deflection in both the fluid atmosphere and oceans (Figure 15-10). This deflection is called the Coriolis effect.Moving water (like wind) are influenced by the Coriolis effect: • Moving water is deflected to the RIGHT in the Northern Hemisphere. • Moving water is deflected to the LEFT in the Southern Hemisphere. • The greatest impact of the Coriolis effect is near the poles (north and south). • There is no Coriolis effect along the equator. The Coriolis effect is a most important factor in the examination of both atmospheric and oceanographic processes (involving the movement of both water and air). Perhaps most notable is the influence of the Coriolis effect on large tropical storms. On an even larger scale, the Coriolis effect significantly influences the great currents that move waters throughout the world's ocean basins (discussed below). |
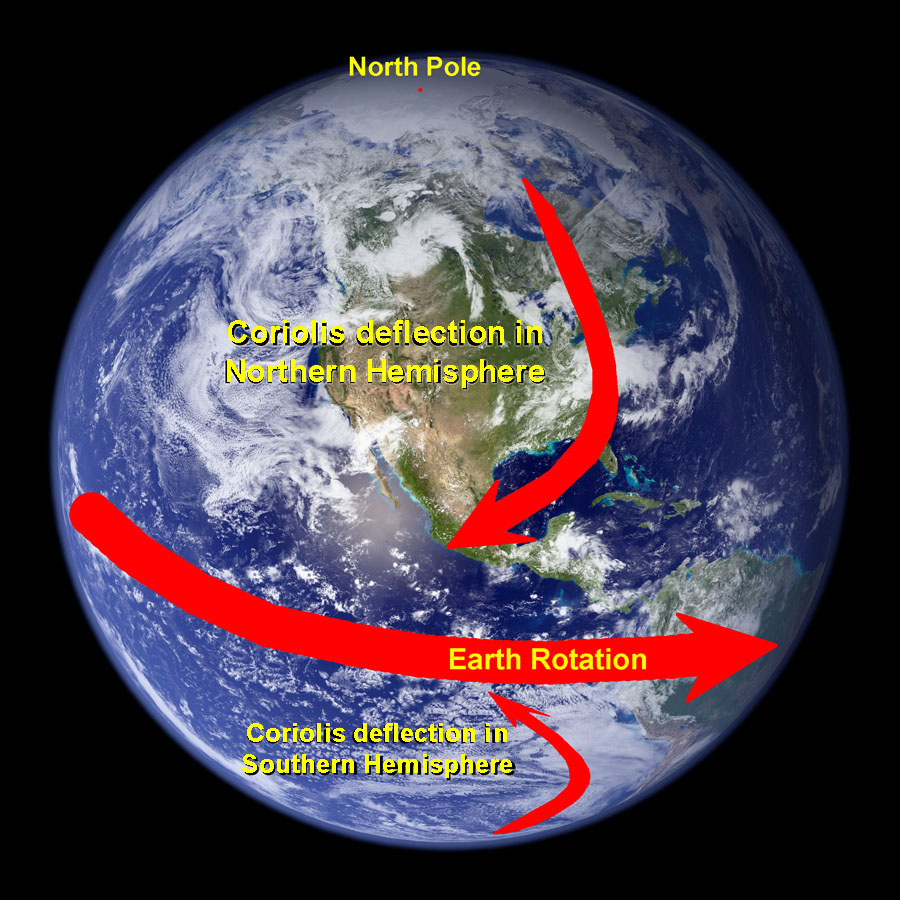 Fig. 15-10. The Coriolis effect is cause by the rotation of the Earth on its axis. This rotation causes air masses moving from high to low pressure to deflect. |
The Coriolis Effect Influences SuperstormsThe term superstorm is used to describe any variety of storm that causes significant widespread destruction. In most cases, superstorms are are large rotating air masses with low atmospheric pressure that originate in tropical regions and significantly impact coastal regions. Superstorms not only can cause major wind damage and flooding, but can erode and redeposit vast quantities of sediments, both offshore and onshore, heavily impacting impacting both communities and ecosystems in coastal regions.Large rotating tropical storms are called hurricanes (near North America), typhoons (near Southeast Asia) and cyclones (in the Indian Ocean). All are the same. Superstorms caused by warm moist winds being drawn to the center of low pressure near the center of the storm (called the eye in well developed storms) (Figure 15-11). North of the equator the Coriolis effect causes low-atmospheric pressure to rotate counterclockwise, but south of the equator they rotate in a clockwise direction. The lower the air pressure in the eye of the storm, the greater the wind speed and rotation. Note on the map in Figure 15-12 that there are no hurricanes along the equator or near the poles. Near the equator the Coriolis effect is not a significant force in deflecting storm winds to cause storm rotation. |
 Fig. 15-11. The eye of a hurricane is the center of low atmospheric pressure. Hurricane Katrina (2005) shown here, was the most costly and destructive hurricane disaster in US history, killing more than 1,800 people. |
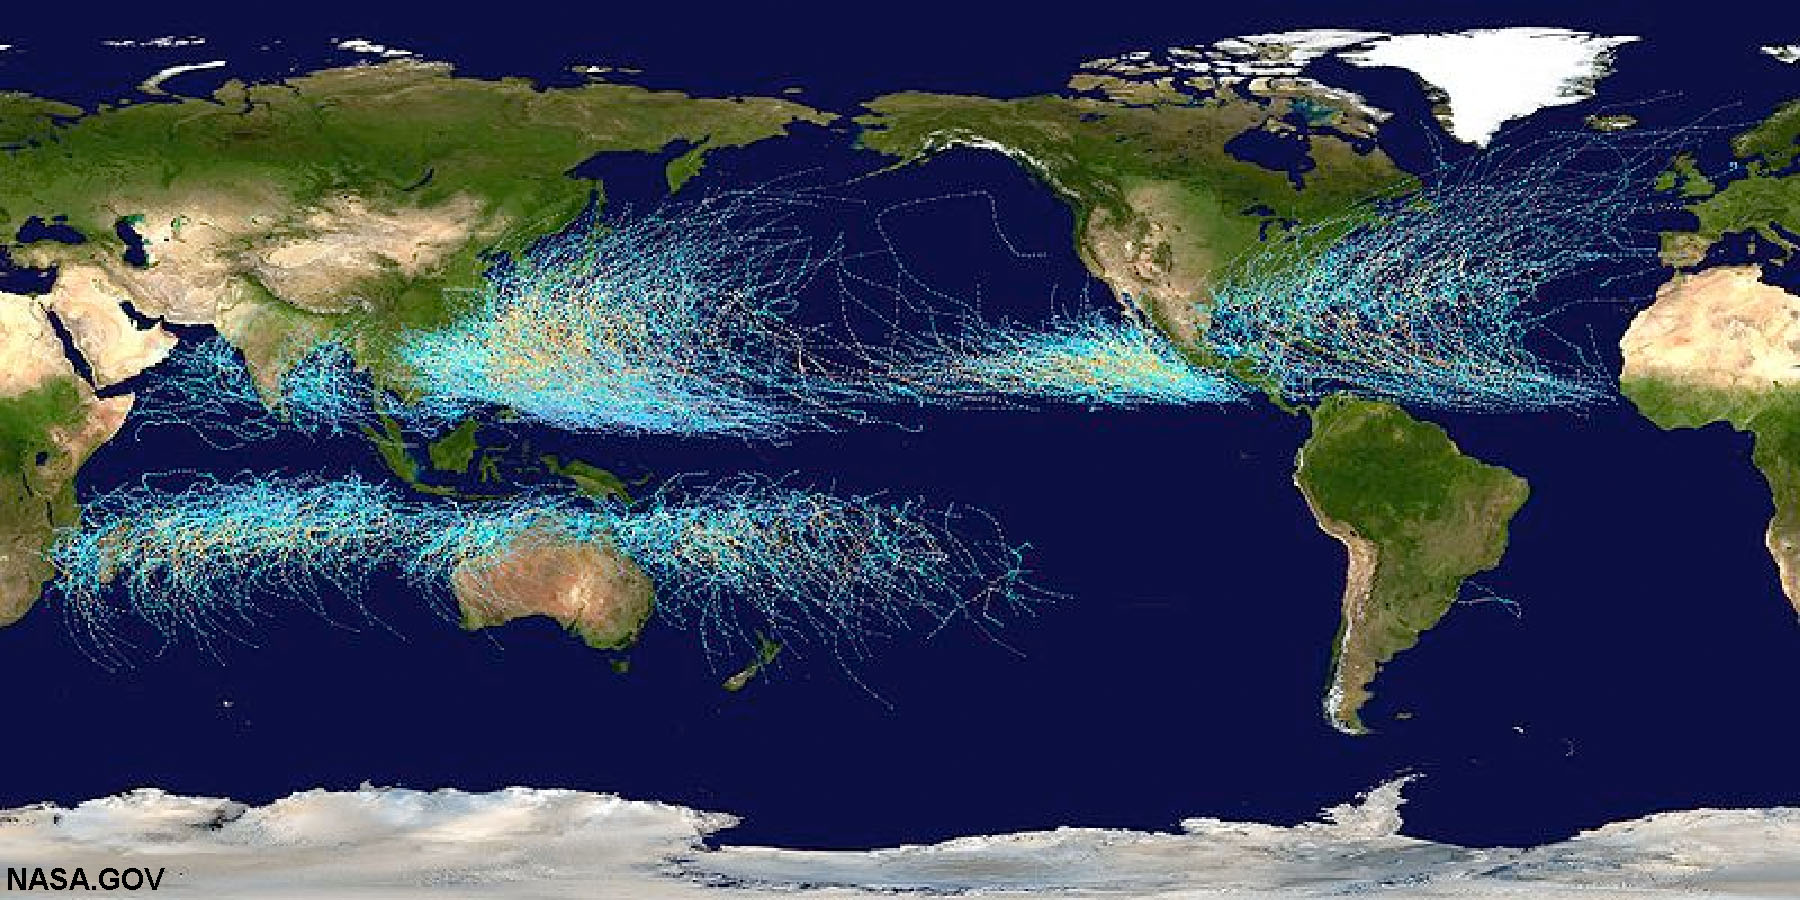 Fig. 15.12. World map showing historic paths of hurricanes, typhoons, and cyclones. The large storms are the same (different names for different regions); storm rotation is influenced by the Coriolis effect. |
Coriolis Effect On Water Movement In OceansThe Coriolis effect also has a large influence on the movement of bodies of water (of any size). The Coriolis effect impacts both surface waters and deeper waters within ocean basins. However, wind-driven currents move fastest near the ocean surface and diminish with depth. The difference in rate of movement at the surface and deeper down results in a rotational process called Ekman transport.Ekman Spiral and Ekman TransportMysterious historic observations: Early sailors traveling in regions where icebergs are common noticed that the icebergs moved in a different direction than the wind (causing alarm as the icebergs were cutting across the paths of ships moving down wind) (Figure 15-13).Walfrid Ekman (1874-1954, a Swedish physicist) resolved the problem of why wind currents and surface water currents were not not moving in the same direction. The force of wind affect surface water molecules, which in turn, drag (by friction) pulls deeper layers of water molecules below them. The deeper below the surface, the slower the water moves compared to the water layer above it. In most regions around the world where Ekman transport is observed, surface movement ceases at a depth of about 100 meters (330 feet). As noted above, both surface water and deeper water is deflected by the Coriolis effect. —90° to the right in the Northern Hemisphere —90° to the left in the Southern Hemisphere. Depth is important: Each successively deeper layer of water moves more slowly to the right (or left), creating a spiral effect (called the Ekman Spiral, Figure 15-14). Because the deeper layers of water move more slowly than the shallower layers, they tend to twist around and flow opposite to the surface current. Net result is that net transport in surface currents is 90° from wind. This twisting character of ocean surface waters is called the Ekman spiral. The impact of the Ekman Spiral is enhanced where geographic features create barriers to the movement of water. Ekman transport is the net motion of a fluid (seawater) as the result of a balance between the Coriolis effect and turbulent drag forces (within surface waters and geographic features (shoreline and seabed). |
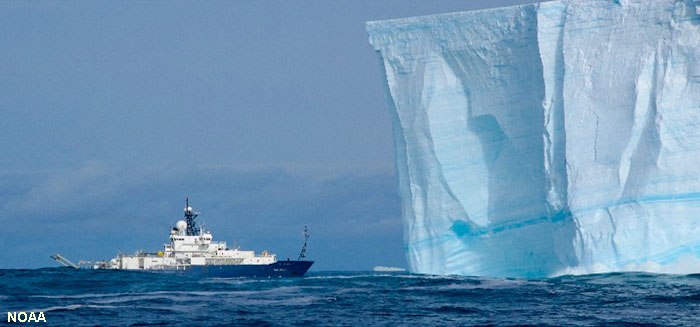 Fig. 15-13. Sailors of ships noticed that icebergs move in a different direction than the wind. This is because surface winds create currents that are affected by the Coriolis effect. Because of isostasy, for every foot of an iceberg above water, there is about 7 feet of ice below the surface. 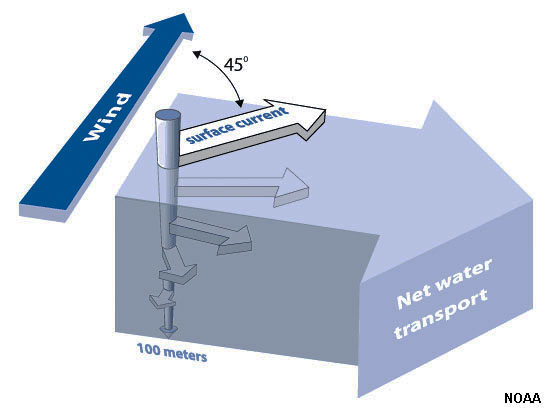 Fig. 15-14. The Ekman spiral illustrated. The wind may move surface waters in the direction of the wind, but the Coriolis effect impacts deeper waters, creating an overall migration of the upper waters in a deflected direction. |
The Global Atmosphere And Ocean Systems Are LinkedThe global atmospheric circulation system influences the movement of air masses in general wind belts that move air in rotating masses within zones around the planet (Figure 15-15). These relatively stationary wind belts impact the surface of the oceans, creating currents that circulate waters in the oceans, creating five large gyres (Figure 15-16) and lesser rotational currents in other regions (such as in Figures 15-17 to 15-19).How the Atmospheric Circulation System Works• Solar heating is most intense at the equator, causing moist warm, air to rise in the Inter-tropical Convergence Zone (ITCZ).The rising, moist air cools resulting in abundant rain along the along the equatorial region.• From the ITCZ, the winds move north and south and descends as dry and warm in the Subtropical High Zones (located about 30° north and south of the equator). Most of the world's deserts and arid regions are within the Subtropical High Zones (both north and south of the equator). (Dry air is denser that moist air, so Subtropical High Zones are dominated by atmospheric high pressure). • Where the winds descend in the Subtropical High Zones some of the wind move back toward the equator in the Hadley Cells (air circulation cells), picking up moisture at the surface at it migrate back toward the Inter-tropical Convergence Zone. Because of the Coriolis effect, these winds are deflected to the west, resulting the Tropical Easterlies (also called the Trade Winds because they were used to move sailing ships west across the oceans). • Wind also moves from the Subtropical High Zones toward the polar regions (north and south) associated with the Ferrel Cells (atmosphere circulation cells located between about 30° to 60° degrees north and south of the equator). Because of the Coriolis effect, these winds are deflected to the east, resulting the Prevailing Westerlies (wind belts in mid-latitude regions were used to move sailing ships back across the oceans, particularly the North Atlantic Ocean). • In the polar regions (with little influence from solar heating) the air is cold and dry, and is sinking, resulting in the Polar Cells. The cold air from the polar regions move south and collide with the northern margin of the now moist air moving toward the poles from the Ferrel Cells (and Prevailing Westerlies). The collision of the moist warm air with the dry cool air results in the development of the storm systems that move with the Prevailing Westerlies. For example, most of the storm systems that move across the United States (from west to east) are a result of the collision of cold arctic air colliding with warm, moist air moving in from the Pacific Ocean and the Gulf of Mexico. |
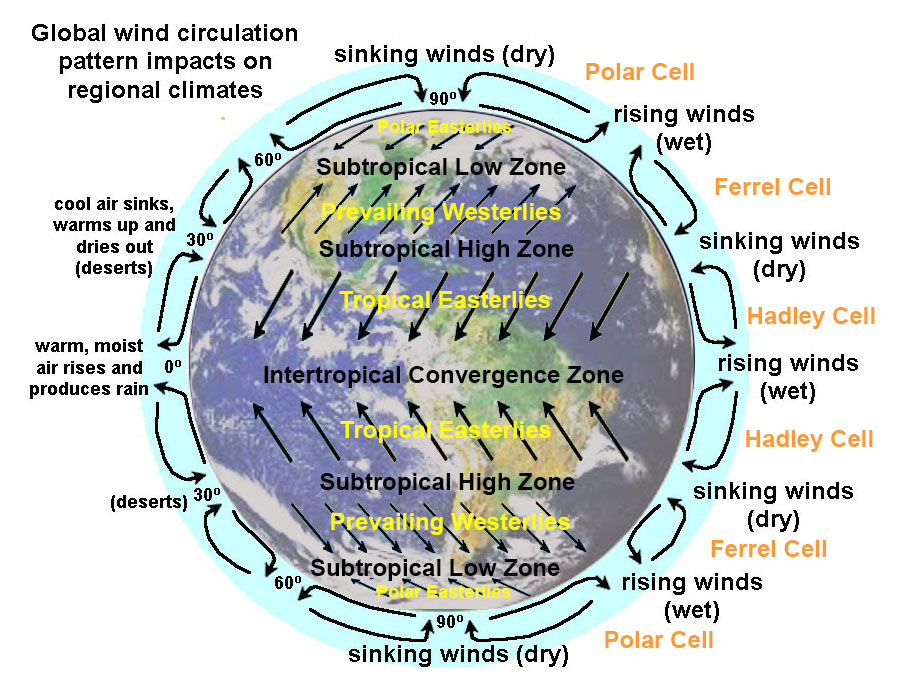 Fig. 15-15. Global wind circulation patterns impact regional climates and drive the large surface currents in the global ocean circulation system. |
The Global Ocean SystemCurrents in the oceans include surface currents and deep currents:• Surface currents are driven horizontally by effects of the wind, mostly by the prevailing winds in Earth's wind belts (see Figure 15-15). • Deep-ocean currents are driven horizontally and vertically by differences in density (density changes typically start near the surface). Ocean circulation is also influenced by seawater temperature and density. • Warm water in the tropics flows in currents to polar regions where it cools, increases in density, and sinks. • Cold and salty water sinks (salt is concentrated by surface evaporation and the formation of sea ice). The formation of sea ice concentrates the salt in seawater, increasing its density so that it sinks. Elsewhere seawater rises where it is displaced by colder and saltier water. |
Ocean Surface CurrentsSurface currents involve large masses of water moving horizontally on the surface. Prevailing winds move surface waters that are also impacted by the Coriolis effect and by the locations of continents that block and deflect surface currents.Ocean GyresFive large gyres are the prevailing surface currents in the world's ocean basins (Figure 15-16). These gyres are driven by the large stable wind belts moving the atmosphere (shown in Figure 15-15).• Tropical Easterlies (called the trade winds) move ocean currents westward in tropical regions. • Prevailing Westerlies (winds) move storm systems eastward across mid- to high-latitude regions. The 5 large gyres are actually are part of a much more complex system of currents that circulate water into different regions around the globe because of the location of continental land masses and the regional influence of the Coriolis effect. More detail of the world's ocean currents are shown in Figure 15-17 to 15-19. The velocity and the volume of surface currents also varies considerably from region to region. Wind is the driving force behind surface currents, however: • The transfer of wind energy to water is not very efficient (only about 2% energy transfer of friction between water and air). • Wind produces both waves and currents (more on waves below). • Surface currents occur only in the mixing zone, mostly within the top several hundred meters of the ocean (near the surface, discussed below). • Effects of surface currents is to redistribute heat from equatorial to polar regions. |
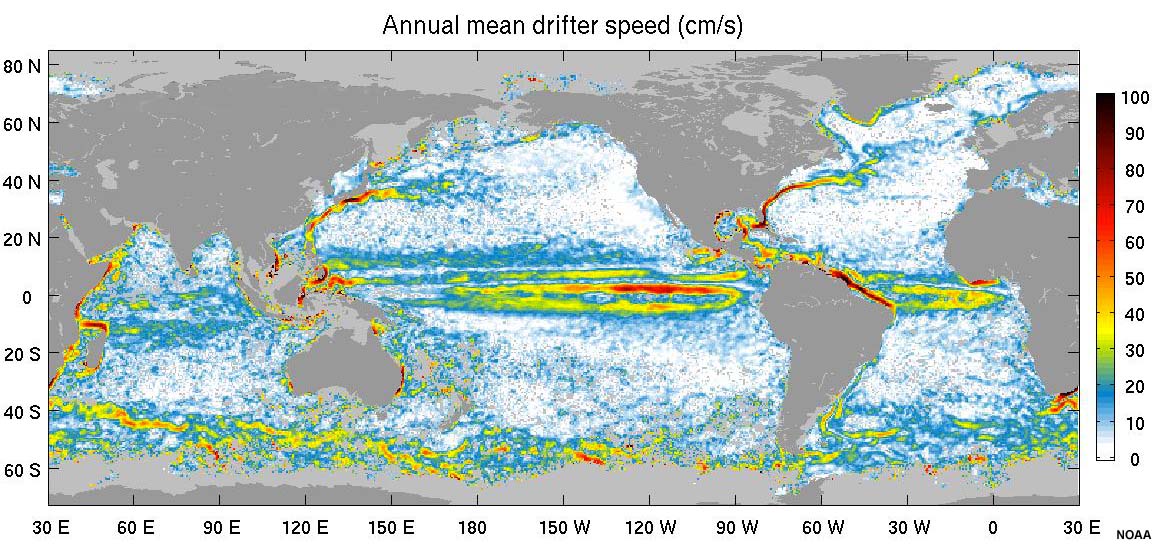
Ocean Gyres Fig. 15-16. Five large gyres circulate surface waters in the global oceans. These rotating subtropical gyres are influenced by the patterns of atmospheric winds and the Coriolis effect. 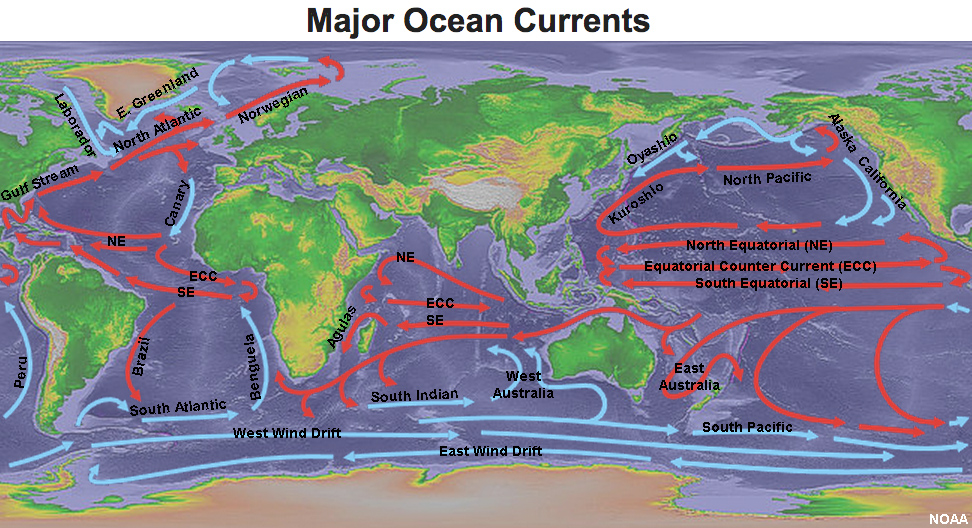 Fig. 15-17. Major surface currents of the oceans. See Oceans Currents Map (NOAA-NWS) |
Mechanisms that influence surface currents include:• Wind is the major mechanism (result of atmospheric circulation patterns).• Solar heating (direct heating by the Sun) is a minor mechanism (influences surface waters but not water at depth). • Tides affect currents in coastal regions (tidal currents are discussed below). • Geography: locations of continents (and islands) influence direction and flow currents (acting as barriers to flow). Subtropical gyres are large system of rotating ocean surface currents driven by global wind currents and continental geography (land masses restrict and deflect the flow of water currents), and under the influence of the Coriolis effect. |
Deep-Ocean Thermohaline CirculationOcean circulation is also influenced by seawater temperature and density. Cold and salty water (concentrated by surface evaporation) sinks. Elsewhere seawater rises where it is displaced by colder and saltier (denser) water (Figure 15-18). Warm water in the tropics flows in currents to polar regions where it cools. In the Arctic region, the formation of sea ice concentrates the salt in seawater, increasing its density so that it sinks. Cold, salty water sinks both in the Arctic and Antarctic regions, feeding deep ocean circulation. The differences in temperature and salinity (or overall density) is the driving force behind deep-ocean thermohaline circulation (Figure 15-19). The coldest and densest (saltiest) water form around Antarctica where massive amount of sea ice forms. When seawater freezes, the sea ice is salt free (expelling the salt). The expelled salt adds to the saltiness (and density) of the coastal waters around Antarctica, causing them to sink in a slow current into the deep ocean basins. Lesser amounts of sea ice form in the northern Arctic region and around Greenland.The deep ocean basins have slow moving currents (compared with the surface waters exposed to atmospheric winds. As currents move about the globe, evaporation increases salinity. Increased salinity combined with cooling increases seawater density, allowing affected seawater to sink into the deep ocean. The movement of surface waters downward supplies oxygen to the seabed, assisting in the decay of organic matter. The deep, slow-moving water picks up nutrients from the seafloor and from decaying organic particles sinking through the water column. In locations where deep-water upwells to the surface, these nutrients supply the ingredients for phytoplankton blooms, providing food for the food chain.
|
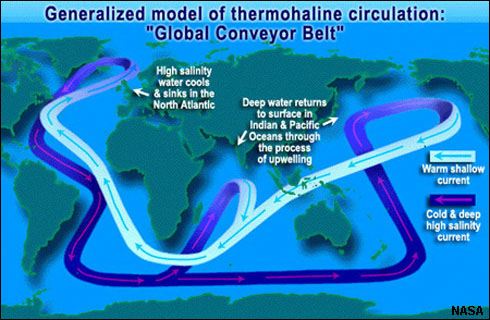 Fig. 15-18. Thermohaline Circulation: cold and salty ocean water is dense and sinks. Warm water stays at the surface. Evaporation increasing salinity (and increasing density) before it can sink. Formation of sea ice also increases salinity. 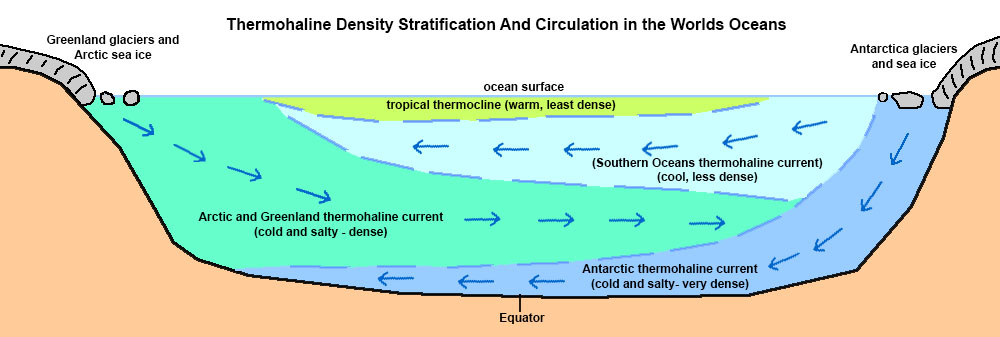 Fig. 15-19. Thermohaline density stratification and deep currents of the world's oceans. |

Meandering and Eddy CurrentsGyres and boundary currents are large scale, but are also complex. The combination of currents, winds, tides, and geography with the impact of the Coriolis effect create complex and often changing patterns in surface currents. Currents change constantly (called meandering) producing spinning cone-shaped masses of water—spinning off of larger boundary currents. Rotation caused by the Coriolis effect create swirling eddies and meandering movements in surface currents (see Figures 15-20 and 15-21).Satellite temperature data of the ocean surface reveals the spreading and mixing of surface waters as currents move from one region to another, gaining intensity and dispersing energy as they move (Figure 15-23). Under the influence of the Coriolis effect, currents move, meander, and locally spiral into rings that may persist for weeks, months, even years. The temperature data reveals large spinning eddies and rings in portions of the ocean basins along the margins of major currents. |
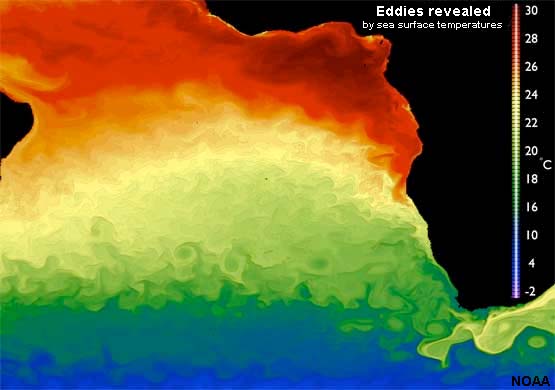 Fig. 15-22. Eddies and meandering currents in the South Atlantic Ocean (as viewed from satellite ocean temperature data). |
Antarctic Circumpolar Current• The Antarctic Circumpolar Current is the only current to completely encircle Earth (Figure 9-23).• The current moves more water than any other current. • The current is in a region of the world with intense winds and wave action. • The region has lots of upwelling - very rich ocean basin (nutrients for plankton; food for higher-level feeders) Antarctic Circumpolar Current (NOAA website); also see an animation of the changes in the mixing zone by seasons: Antarctic Circumpolar Current (NOAA) |
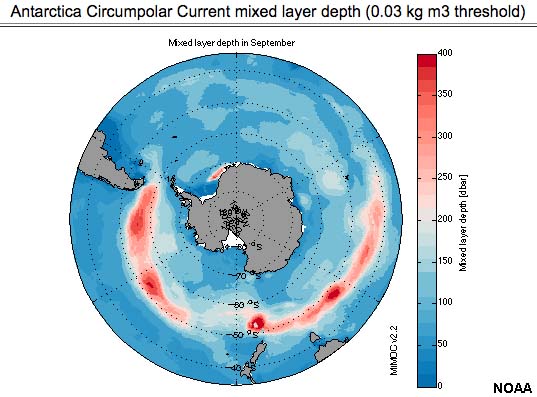 Fig. 9-23. Antarctic circumpolar current revealed by mixing zone depths. |
The Gulf Stream CurrentThe Gulf Stream is a fast moving ocean western boundary current (Figure 15-24).• The North Equatorial Current moves east across the Atlantic Ocean in the Northern Hemisphere. • This flow splits into the Antilles Current (east of the West Indies) and the Caribbean Current (around the Gulf of Mexico). • These currents merge into the Florida Current. (~30-50 miles wide, moving 2-6 mph, a mile deep). • Along the East Coast, the Gulf Stream experiences western intensification. • North of Cape Hatteras (NC) the current moves away from the coast and gradually looses much of its intensity (by meandering) producing numerous warm and cold core rings. • The Gulf Stream gradually merges eastward with the water of the Sargasso Sea, the rotating center of the North Atlantic Gyre (The Sargasso See is named for floating marine alga [seaweed] called Sargassum that accumulates in the stagnant waters.) • For comparison, the volume of water moved by the Gulf Stream is about 100 times all the world's rivers combined! |
 Fig. 15-24. The Gulf Stream is the world's largest ocean current (revealed here by water temperature patterns) |
Upwelling and DownwellingUpwelling is the vertical movement of cold, nutrient-rich water from deep water to the surface, resulting in high productivity (plankton growth).• Can bring cold, nutrient-rich water to the surface (photic zone) unless a thermocline is strong and prevents it. • Nutrients are not food but act like a fertilizer. • Upwelling water rich in nutrients feeds phytoplankton, the base of the food chain. Downwelling is the vertical movement of surface water downward in water column. Regions where downwelling is occurring typically have low biological productivity. • Downwelling takes dissolved oxygen down where it is consumed by the decay organic matter. |
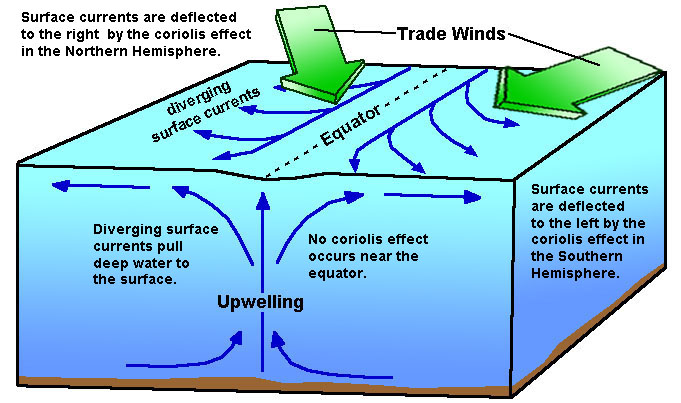 Fig. 15-25. Equatorial upwelling involves the Trade Winds blowing across the equator and the Coriolis effect taking over as diverging currents move away from the equator. |
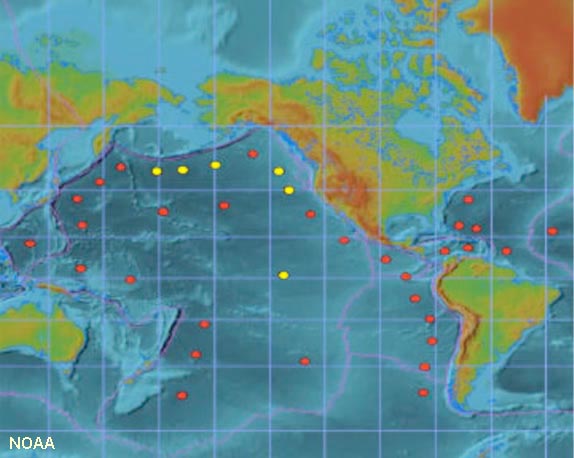
Where Upwelling OccursDiverging surface waters occur where wind-driven surface waters are moving away from an area on the ocean surface. When surface waters are displaced, it forces water from down below to rise to the surface—a process called upwelling.• Equatorial upwelling occurs where SE trade wind blow across the equator (Figure 15-25); Ekman transport forces surface water movement to the south (south of the Equator), and to the north (north of the Equator). Upwelling of deep ocean waters is most intense in equatorial regions. This upwelling supports some of the most intense biological activity in the world's oceans. • Coastal upwelling occurs where wind blowing along a coastline is influenced by Ekman current moving surface waters offshore. Winds blowing along coastlines or off the land pull surface waters away from the coast—pulling deeper water up to replace surface waters. Locations where coastal upwelling occurs around the world are shown in Figure 15-26. • Other locations where upwelling occurs include around underwater obstructions (guyots) or sharp bends in coastlines. |
 Fig. 15-26. Regions of the world where coastal upwelling occurs.
|
Ekman Transport Influence on Coastal Upwelling and Downwelling Along the California CoastCoastal upwelling is influenced by coastal geometry, wind directions, and the influence of the Coriolis effect (Ekman transport). Figures 15-27 and 15-28 illustrate how the direction of wind movement determines how coastal upwelling and downwelling takes place in the Northern Hemisphere (such as in California). Figure 15-29 shows regions of coastal upwelling along the California continental margin—revealed ocean-surface temperature imagery. Upwelling water along the coastline is colder than waters farther offshore. |
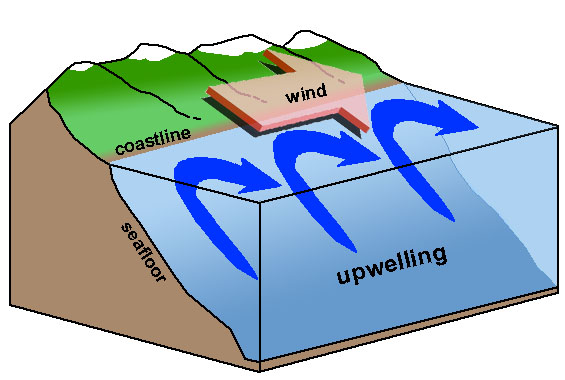 Fig. 15-27. Coastal upwelling occurs when the wind blows south along the California coast. |
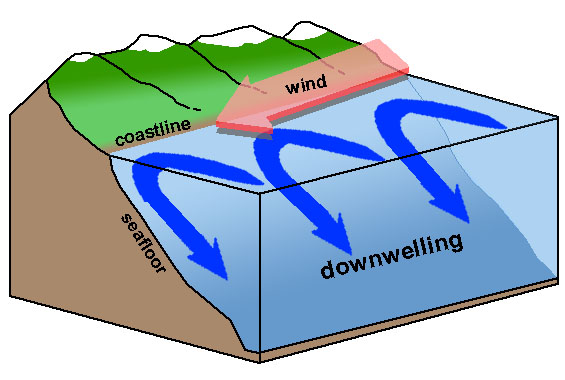 Fig. 15-28. Coastal downwelling occurs when the wind blows north along the California coast. |
Large Cycles in Ocean Climate VariabilityThe ocean/atmosphere systems display cyclic changes beyond annual seasonal changes. Longer-term cycles are also taking place. Changes happening in one region can gradually impact other regions on multi-year to decade cycles (example: cycles in coastal upwelling on North America's West Coast, Figure 15-30). Even longer-term cycles are influenced by extraterrestrial pattern changes in the orbit and rotation of the Earth relative to the Sun over time. These changes impact the distribution of precipitation and influence the warming or cooling of climates over multi-year periods, and changes in sea level over time linked to the accumulation and melting of continental glaciers. |
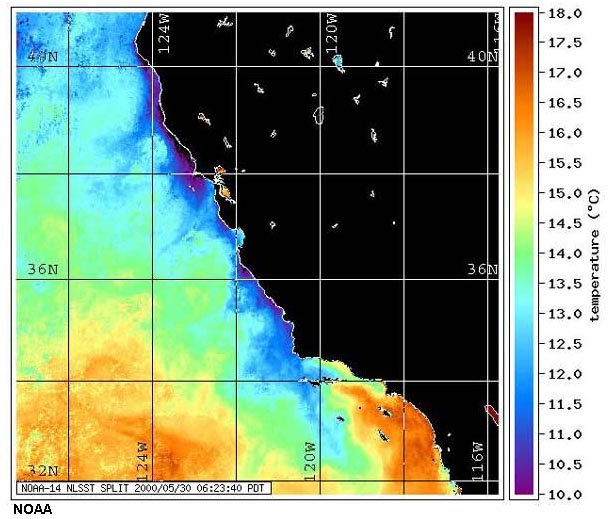 Fig. 15-29. Upwelling offshore of California revealed by ocean surface temperatures. |
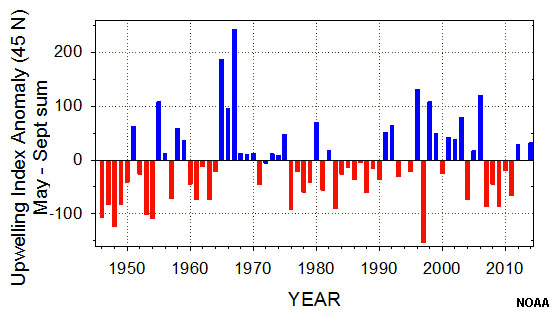 Fig. 15-30. Cycles of upwelling on North America's West Coast influenced by ENSO. |
El Niño/Southern Oscillation (ENSO)El Niño/Southern Oscillation (ENSO) in the Pacific Ocean [also called El Niño-La Niña Cycles] is associated with a band of warm ocean water that develops in the central and east-central equatorial Pacific. El Niño/Southern Oscillation (ENSO) is perhaps the most important ocean-atmosphere interaction phenomenon to cause cyclic global climate variability. Here's how the ENSO cycle works: ENSO involves the interactions of ocean currents, ocean temperatures, and atmospheric effects, over time.Pacific Ocean Currents Involved With ENSO• West moving winds at the Equator help to drive the two Pacific Subtropical Gyres (northern and southern gyres)(see Figures 15-17 and 15-18).• In the North Pacific Subtropical Gyre, the western-intensified Kuroshio Current moves up the Asian seaboard (warming China, Japan), flows east with the North Pacific Current, then south as the California Current along the west coast of North America. • In the South Pacific Subtropical Gyre, the western intensified East Australian Current moves south and merges with the Antarctic Circumpolar Current, the completes the gyre as the Peru Current (flowing northward along the west coast of South America). ENSO Ocean Temperature EffectsENSO Cycles are influenced by ocean surface temperatures throughout the Equatorial Pacific Ocean region. During the El Niño periods, ocean surface temperatures are much warmer than the La Niña periods. This is a reflection of the amount of cloud cover (deflecting incoming solar radiation) and winds driving cold upwelling currents to the ocean surface in the equatorial region. During El Niño periods, the Pacific Warm Pool grows larger and more intense in the Eastern Pacific region near Australia and Indonesia (Figure 15-36).ENSO Weather Effects And the Walker Cell• The rising warm-moist air in the western Pacific contrasts with the cool sinking air along South America, resulting in the Walker Cell (an unstable equatorial air circulation pattern region in the Pacific Ocean)(Figure 15-32). The Walker Cell operates perpendicular (east to west, not north to south like the Hadley, Farrell, and Polar circulation cells [see Figure 15-15]). the intensity Walker Cell weather pattern is controlled by temperature contrasts on opposite sides of the Pacific Basin along the equator. |
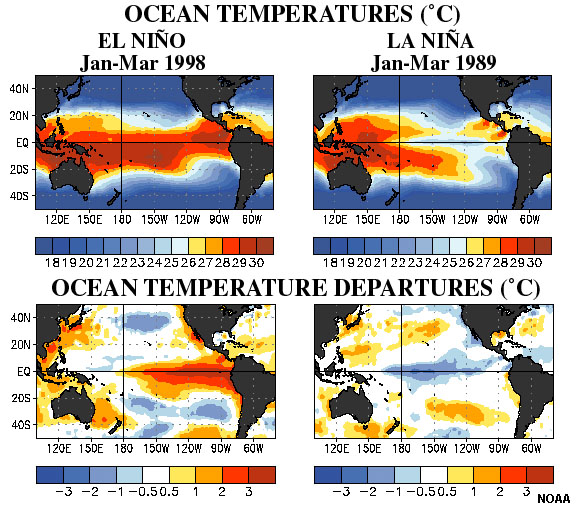 Fig. 15-31. Ocean surface temperatures reveal the changing patterns and regional extent of the Pacific warm pool associated with El Niño-La Niña Cycles. 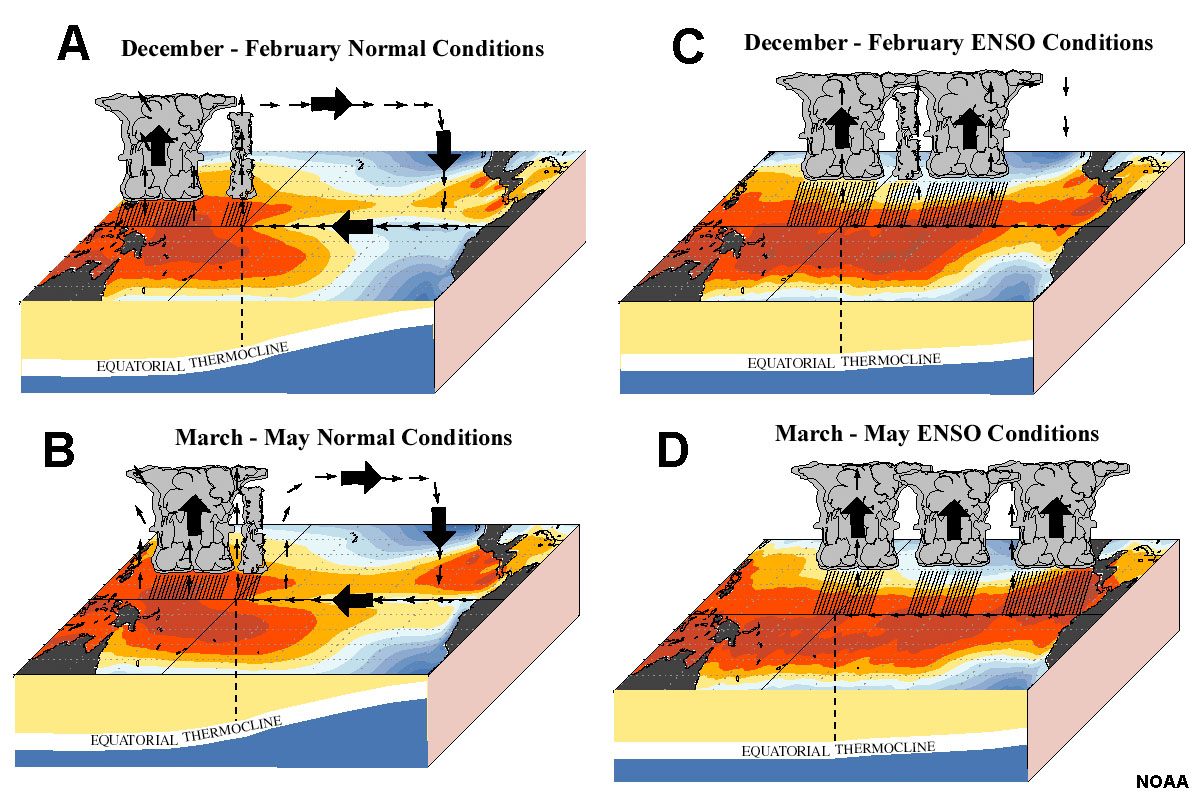 Fig. 15-32. El Niño-La Niña Cycles changes in the Walker Cell wind currents affect ocean surface temperatures which impact the thickness and extent of the thermocline (which impacts upwelling). |
Impacts of ENSO CyclesENSO cycles [El Niño-La Niña Cycles] consist of shifting weather and oceanographic conditions in the tropical Pacific region (refer to Figures 15-31 and 15-32).During El Niño:• High and low atmospheric pressures systems reverse across the equatorial Pacific region. As a result the Walker Cell circulation pattern is very weak.• Winds become slack or blow against the west-moving Equatorial Current. • The west-moving Equatorial Current mounds warm water on eastern side of Pacific Basin. near Australia and Indonesia. • Along the coast of South America, a normally thin temperate thermocline replaced with a thick tropical thermocline. • This thick thermocline prevents mixing of deep cold nutrient rich water because of the buoyancy of extra warm surface water. • The tropical thermocline shuts down upwelling currents that would otherwise provide nutrients to the base of the food chain in shallow ocean waters, resulting in a collapse of marine fisheries offshore (often resulting in economic and ecological catastrophe along South America's west coast). • During El Niño, the warm conditions typically arrive around Christmas, so El Niño refers to the Christ Child in Peruvian weather— El Niño conditions offshore results in both warm and wet conditions on land. During La Niña:• The Walker Cell circulation intensifies across the equatorial Pacific region.• This increase in windy weather condition pulls the thick warm waters away from the coast of South America. • As a result, there is increased cooling and more upwelling along the coast, enhancing ocean productivity. • Cool conditions offshore results in persisting drought conditions on land in South America. Global significance of ENSO cycles:These fluctuating cycles of ocean surface water temperatures influence climate factors (warm/wet or cool/dry) conditions around the entire Pacific Basin, if not the entire world. Monitoring for El Niño is conducted by:• studies of wind speed and direction on the Equatorial regions. • monitoring high and low pressure systems on the Equatorial regions. • monitoring water temperature changes on Equatorial regions, mainly warming on east side of Pacific Basin. • measuring water heights (mounding) above average sea level along the Equator. |
ENSO Impacts on Coastal CaliforniaDuring El Niño periods, California's coastal ocean waters are warmer, and a more well-developed thermocline hinders coastal upwelling. This reduces the nutrient supply for sea life, so marine specie either adapt and migrate elsewhere, or in many cases, loose populations due to competition for limited food resources. Southern California typically gets heavier winter rainy periods because the southern tropical jet stream move north from the Central America region. As a result, Southern California gets more tropical moisture which can translate to increased rainfall if conditions are right.During La Niña periods, California's coastal ocean waters are cooler, only a weak thermocline can develop. As a result, there is stronger and well developed coastal upwelling. As a result, more food is available, and marine life flourishes in coastal waters. Colder waters offshore translate to drier conditions on land. |
WavesIn oceanography, waves are:• Short-term changes in sea level. • A wave is energy moving through water. Waves are generated by a disturbing force—something that transmits energy into a fluid medium (such as wind blowing on water). A pebble hitting a puddle generates a splash that creates ripples (tiny waves) that propagate away from the source (Figure 15-34). The ripples grow smaller as they move away from the splash (source) until they diffuse away with increasing distance, or when it encounters the edge of the puddle. |
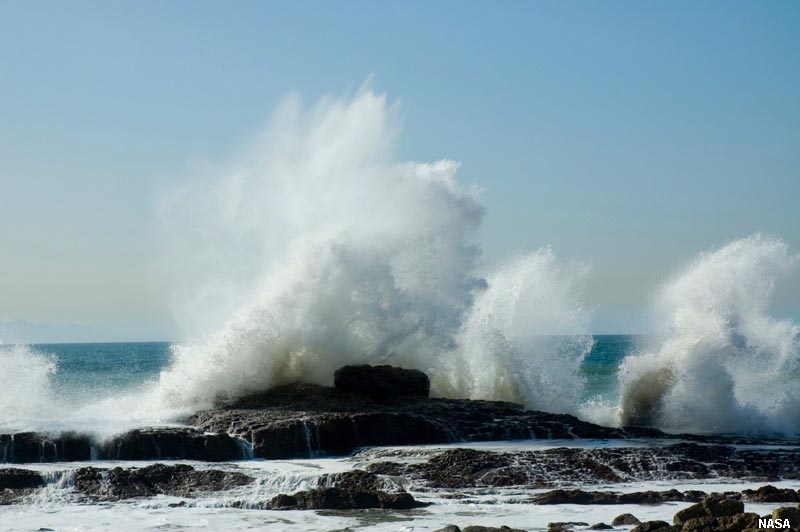 Fig. 15-33. A wave crashing onshore releases energy. |
Wind is the disturbing force for waves in the ocean and large bodies of water. Waves are also generated by earthquakes, landslides, and volcanic eruptions (producing tsunamis), and tides are produced by gravitational interactions between the Earth, Moon and Sun.
|
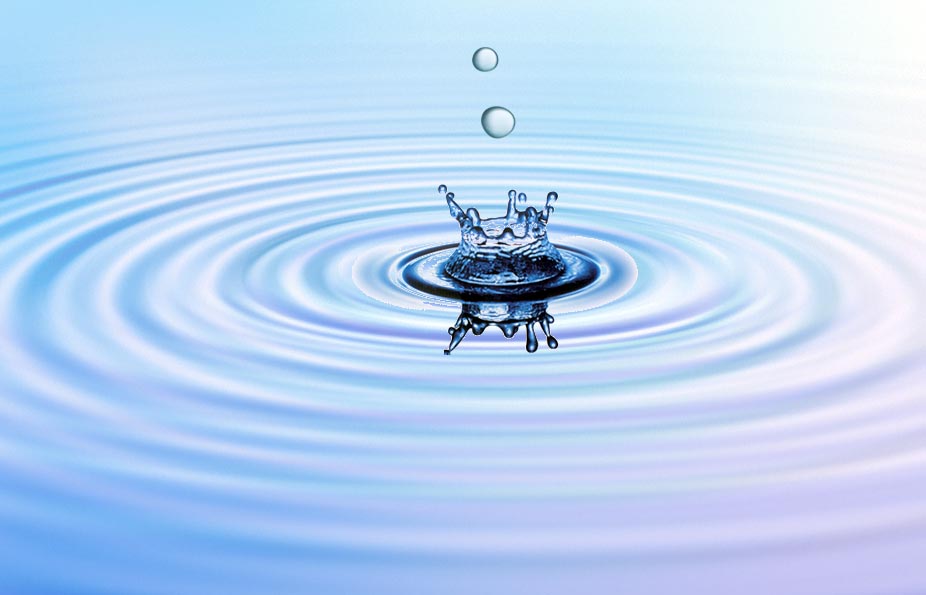 Fig. 15-34. A splash is an example of a disturbing force creating waves. |
|||||||||
Terms Used To Describe Waves
Characteristics of WavesOcean waves are created by wind blowing over water. The distance between two wave crests or two wave troughs is called the wavelength (Figure 15-35). Wave height is a measure of wave amplitude. The wave period is the time interval between passing wave crests (completing one cycle) and are measured as wave crests pass a stationary point (such as a buoy or pole on a pier)(Figure 15-36). The greater the wave period, typically the higher the wave breaks as it approaches the shore. The energy transmitted by waves increases with increasing wave length (wave period) and wave height. |
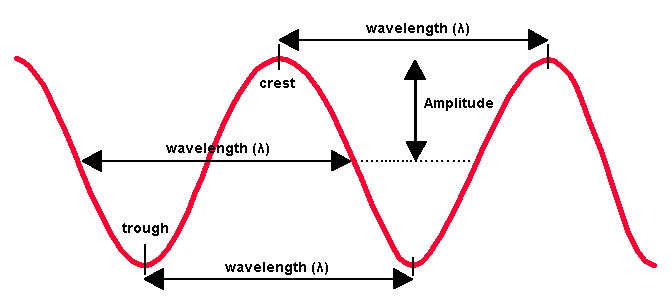 Fig. 15-35. Wavelength and wave height of wave cycles. 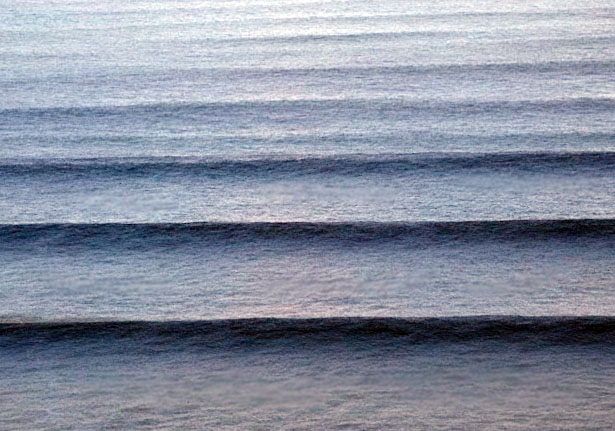 Fig. 15-36. Ocean swell waves approaching a shoreline arrive at cyclic intervals called a wave period. |
Wave Speed and Wave EnergyWave speed is a function of wavelength and wave period, and is related to the wind velocity where the waves form. What is important is the combination of the wave height and wave period. Wave period is directly related to the speed the wave is traveling. The longer the period, the faster the wave, and the more energy in contains. The greater the period the faster the wave moves (Figure 15-37). Also, the greater the period, typically the higher the wave breaks as it approaches the shore. |
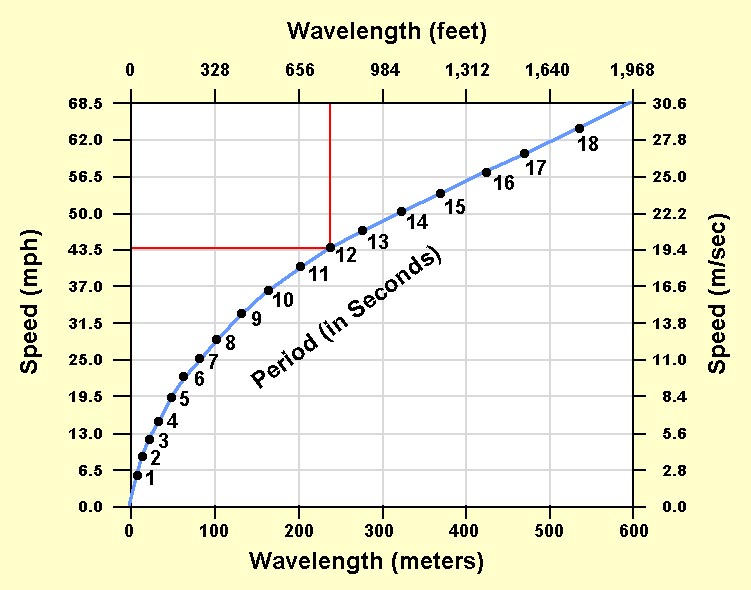 Fig. 15-37. Comparison of wavelength to wave speed and wave period. |
Factors In the Formation of Wind WavesOcean wave intensity reflects characteristics of wind speed, wind duration, and fetch (the distance the wind has traveled over open water). Wind energy is gradually transferred to the waves forming on a body of water, causing waves to absorb energy and grow in height and period over distance and time (Figure 15-38).Storm winds over open waters generate waves. The wave speed, wave period, and wave height of waves generated is proportional to the size and intensity of a storm. Once storm wind transmits energy into generating waves, the waves will distribute that energy across any body of water (lake or ocean basin) until the energy is dissipated by friction as they encounter shallow water and shorelines. Where do waves form?Waves form wherever there is ample fetch, wind speed and wind duration tend to be more variable due to regional storm activity. The region that consistently produces the greatest amount of wave action is around Antarctica (often called the Antarctic Ocean). The Antarctic circumpolar current (shown in Figure 15-23) produces a steady stream of very large well waves because the region experiences strong winds for long durations, and because the Antarctic Ocean has infinite fetch in the souther Polar Easterlies wind belt where the dominant winds blow around Antarctica (Figure 15-39). |
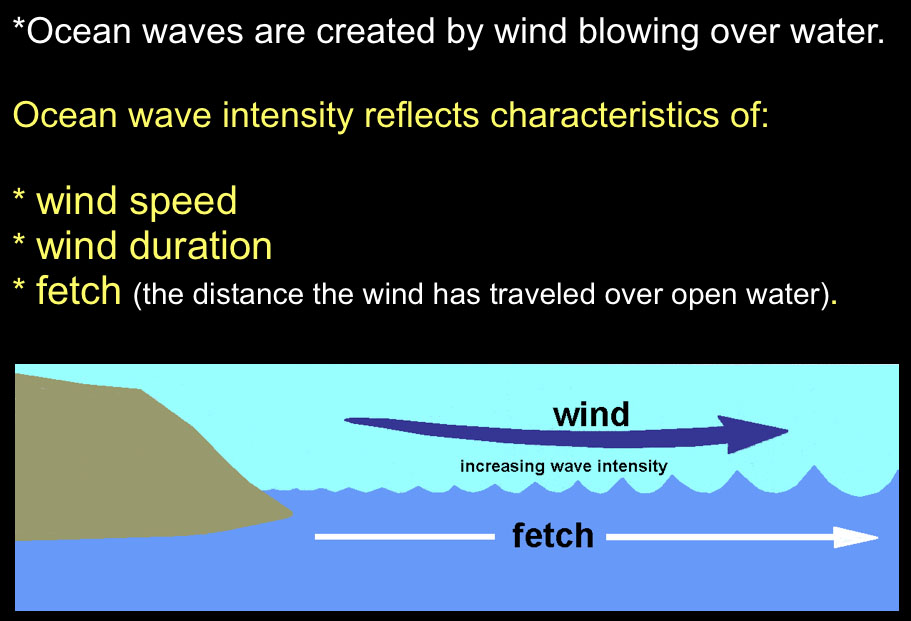 Fig. 15-38. Waves energy depends on wind speed, wind duration, and fetch. |
Swell and SeasOcean swell refers to series of ocean surface waves that were not generated by the local wind. Ocean swell waves often have a long wavelength. Swell can develop on lakes and bays, but their size varies with the size of the water body and wave intensity. Swells are generated by storms over the open ocean. Certain regions of the world are more prone to producing large long-period waves that can spread as swell throughout the world's ocean basins. The southern ocean around Antarctica is a region of persistent strong winds blowing over a region with infinite fetch (open waters surrounding Antarctica, and south of South America, Africa, and Australia continents, Figure 15-39). Large swell ( waves with long periods and large wave heights) are are also generated by large and powerful tropical storms. In the North Pacific Ocean, storms also produce similar waves, typically during seasons when storms occur in these different regions.• The term sea refers to an area where wind waves are generated. Waves produced in sea conditions have mixed period and wavelengths. Seas are typically a chaotic jumble of waves of many different sizes (wave heights, wavelengths, and periods). • The term fully developed sea refers to the maximum size waves can grow given a certain fetch, wind speed and duration associated with storm winds. Figure 15-40 illustrates the relationship of sea and swell. Swell are waves generated in and move away from a sea. The farther away from a sea, the more uniform the swell becomes in relation to wave period and wave height. Swell can develop on lakes and bays, but their size varies with the size of the water body and wave intensity. As waves move out and away from the storm center (a sea), they sort themselves out into groups of similar speeds and wavelengths. The faster waves with long wavelengths move away from the area. This produces the smooth undulating ocean surface called a swell. Swells may travel thousands of kilometers from the storm center until they strike shore (the ocean swell waves illustrated in Figure 15-36 are typical of swell from a distance source). |
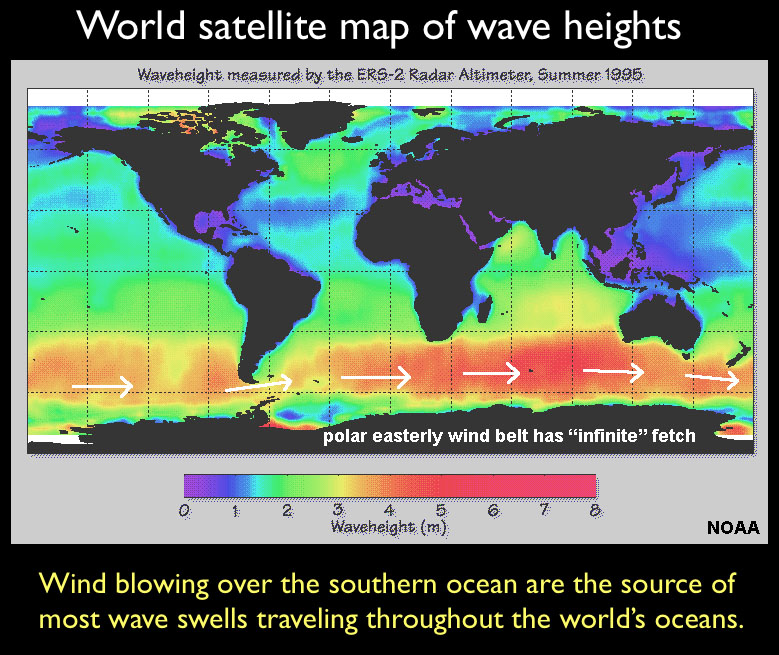 Fig. 15-39. Most ocean swells originate in the southern oceans where strong winds (southern polar easterlies) combine with unlimited fetch. 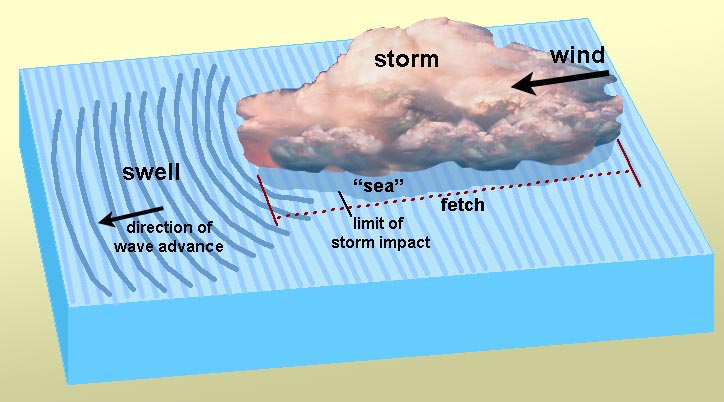 Fig. 15-40. Sea and swell associated with a storm over open water. |
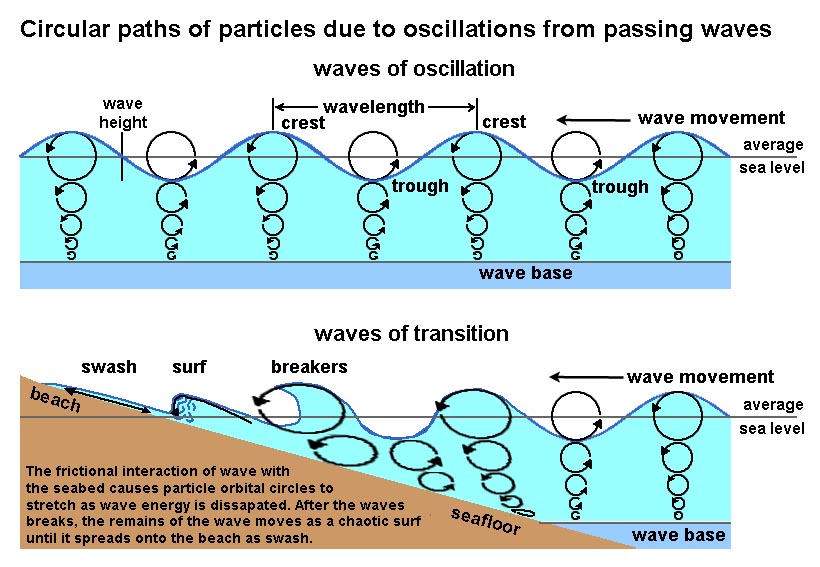
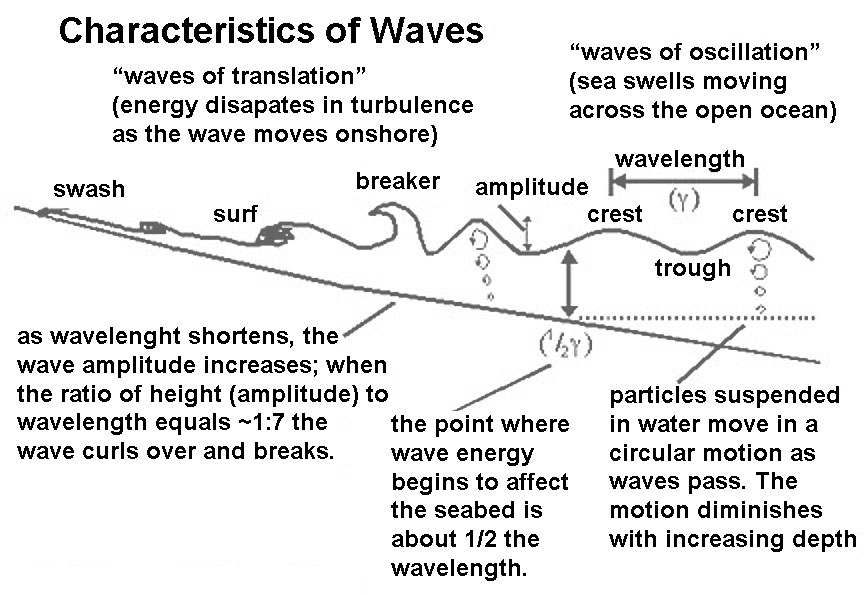
Breakers: Why do waves break near shore?Wind waves change as they approach the shore:• As a wave approaches shallow water its begins to transform when it's orbital depth comes in contact with the seabed (when depth < ½ wavelength [wave base], and a deep-water wave start to become a wave of translation). • The friction caused by waves interacting with the seabed causes waves to slow down as the move onshore. • The friction of the seabed begins to slow the bottom of the wave; whereas the top of the wave does not slow as quickly. • Circular motion within the wave becomes interrupted and becomes elliptical. • As waves approach the beach, their wavelengths (L) and velocity decrease. However the wave period (T) stays the same. The shortening of the wavelength results in an increase in wave height as it moves into shallow water. • A wave breaks when the water depth (d) is about the same as the wave height (h). Where a wave curls over on itself is called a breaker. When a wave breaks the rising back of the waves moves up and over the slower moving front of a wave approaching the shore (Figures 15-3 and 15-44). • Breakers then turn into a moving turbulent front called surf that moves onto the beach. • When the dying wave runs up on the beach and then retreats it is called swash. In a wave passing through the open ocean a water molecule in the water will move in a circular motion parallel to the direction the wave is moving. However, as a wave approaches the shore, its internal circular motion begins to impact the seabed causing the wave to drag along the bottom and slow down, shortening the wavelength (and wave period), but increasing the wave amplitude. Ocean waves typically break where the water depth is about one half of its wavelength or when the slope of the wave approaches a steepness ratio of 1 to 7 (feet or meters). Example: If a moving wave has a height of one foot and a length from crest to crest of 8 feet, then the ratio is 1:8 and this wave is not going to break. However, if the height is 1 foot and the length decreases to 6 feet, then the ratio is 1:6, then the wave has now become steep enough that the crest topples and the wave breaks. |
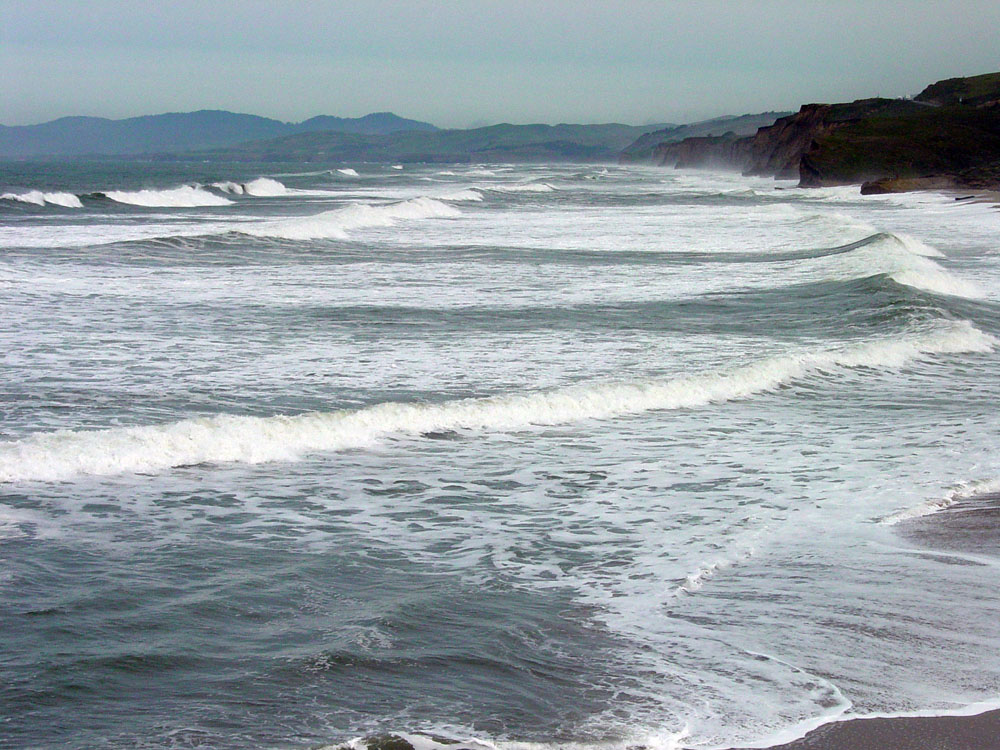 Fig. 15-43. Waves of transition build up, break, and become surf before ending on the beach as swash. 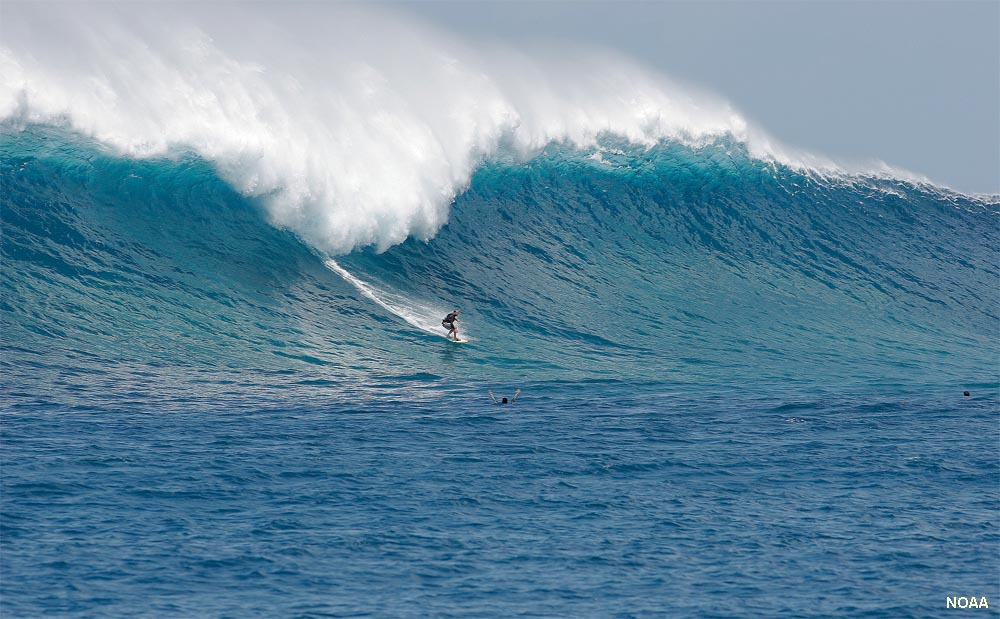 Fig. 15-44. A breaking wave (with surfer in Puerto Rico) |
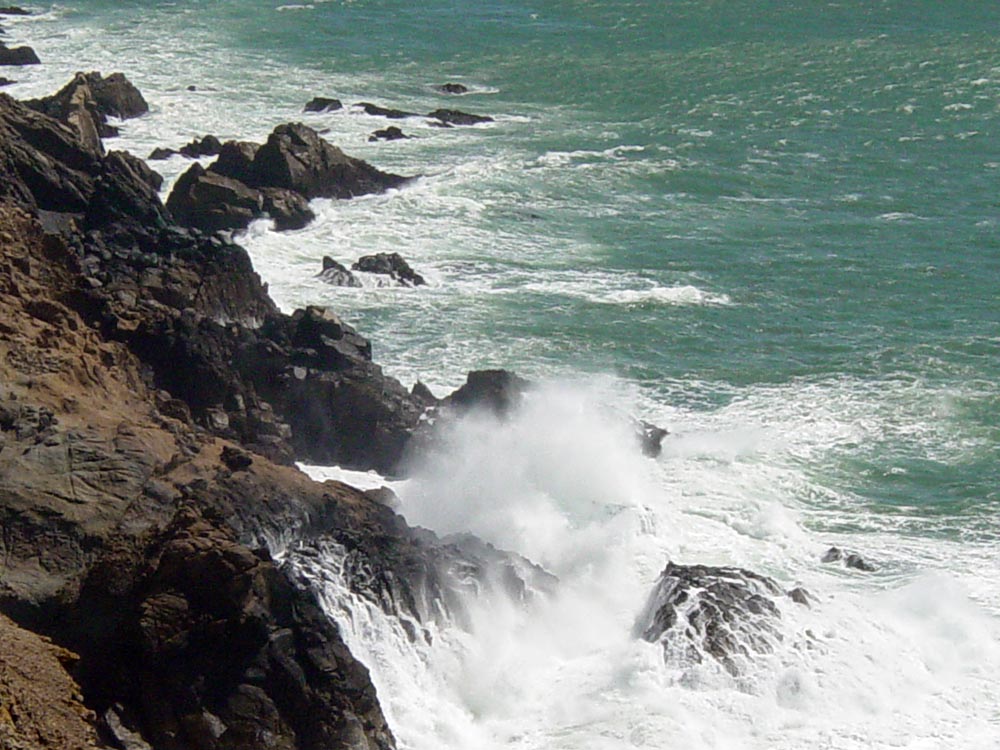
How does the slope of the seabed/beach creates different kinds of breakers?There are three types of breaking waves: spilling breakers, plunging breakers, and surging breakers. Breakers may be one or a combination of these types.Gentle slopes produce spilling breakers (Figure 15-45). Spilling breakers begin far from shore and take a relatively longer time to reach the beach. The breaking crest slides down the front of the wave in a flurry of foam as the wave moves shoreward. Spilling breakers give surfers a long slow ride. Moderate slopes produce plunging breakers (Figure 15-46). Plunging breakers build up rapidly into a steeply leaning crest. The crest curls further forward of the rest of the wave before crashing down in the surf zone. Plunging breakers are dangerous because the crash into shallow water. Steep slopes produce surging breakers (Figures 15-47 and 15-48). Surging breakers occur where waves slam directly on the shorelines. With no gentle slope the waves surge onto a steep beach, producing no tumbling surf. Surging breakers also create huge splashes on a rocky cliff shoreline. |
||||
|

How Waves FormWhen the wind starts to blow, the surface of a water body will go through a progression as waves form and intensify. When the wind starts to blow, the ocean surface will change from calm (mirror-like) conditions to form capillary waves (ripples), chop, wavelets, to waves (each with increasing wavelengths, wave heights, and wave periods). Smaller wave features can form on existing larger wave features, adding to the complexity of the water's surface.Ripples (Capillary Waves)Capillary waves are very small waves with wavelengths less than 1.7 cm or 0.68 inches (Figure 15-49). The formation of capillary waves is influenced by both the effects of surface tension and gravity. The ruffling of the water’s surface due to pressure variations of the wind on the water. This creates stress on the water and results in tiny short wavelength waves called ripples. Ripples are often called capillary waves. The motion of a ripple is governed by surface tension. They are the first waves to form when the wind blows over the surface of the water and are created by the friction of wind and the surface tension of the water. These tiny little waves increase the surface area of the sea surface and if the wind continues to blow, the size of the wave will increase in size and become a wind wave.ChopChop refers to small waves (wavelets) causing the ocean surface to be rough. Ripples and small wavelets form and move independently of large waves moving through an area, creating rough and irregular wave patterns (Figure 15-50). Over time and distance waves tend to consolidate to become more continuous rows of waves moving in parallel. |
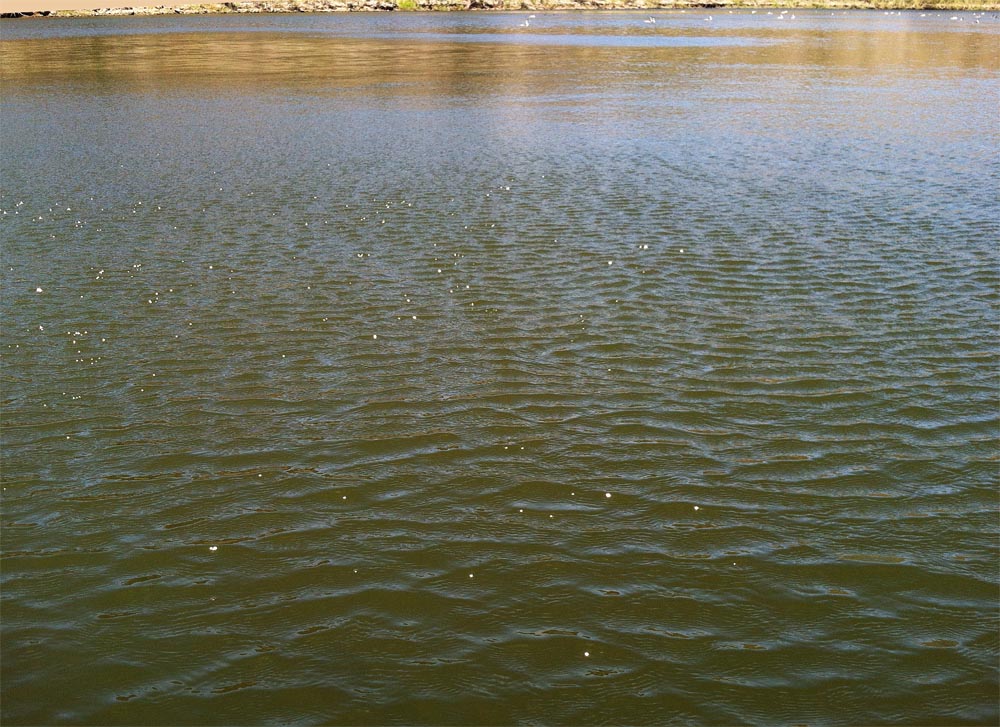 Fig. 15-49. Capillary wave (ripples) forming next to a calm area (Lake Hodges, CA) 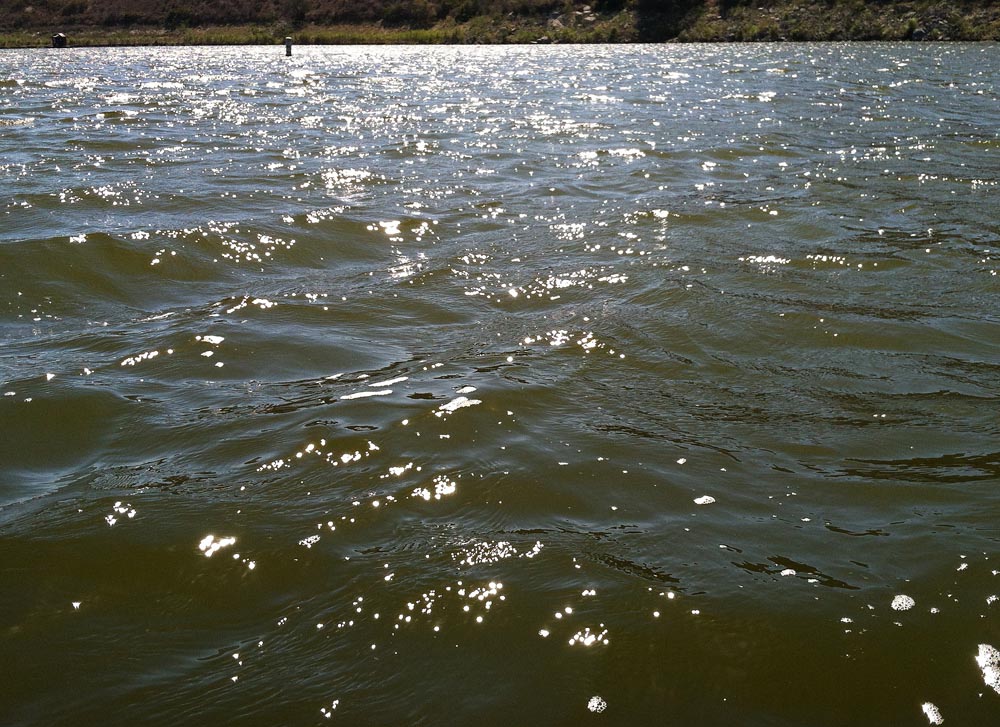 Fig. 15-50. Chop: with increasing fetch, ripples merge to become wavelets in choppy surface water conditions. |
Beaufort Wind Force Scale (Wind Velocity, Wave Height, and Sea Conditions)The Beaufort wind force scale relates wind speed (velocity) to observed conditions at sea (including wave height) or impact of features on land. It is a numbered scale from 0 to 12 to describe sea conditions and wave size. The Beaufort Scale was developed by Rear Admiral Sir Francis Beaufort 1774-1857, an officer in Britain's Royal Navy). Zero 0 on the Beaufort scale represents the calmest of seas (the water is so smooth that it looks like glass). A 12 on the Beaufort scale represents hurricane force waves (Figure 15-51). |
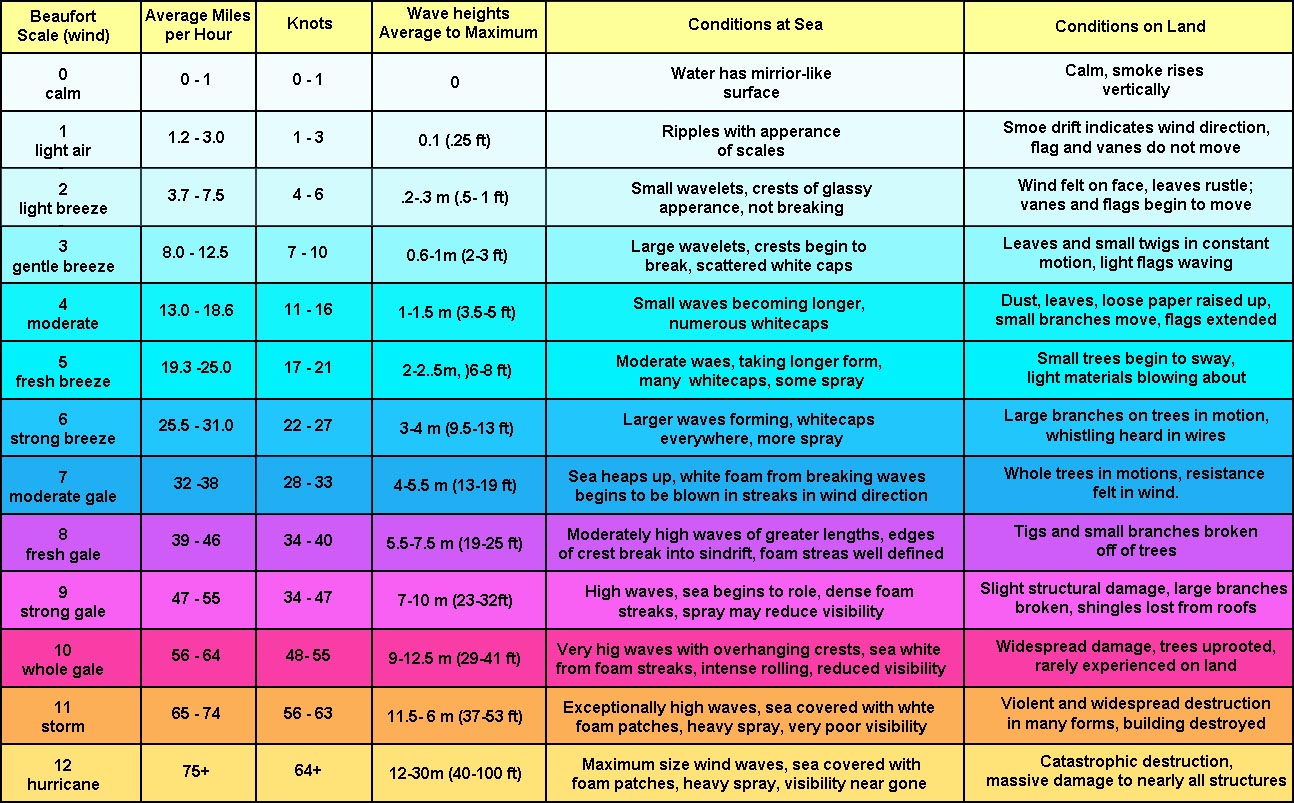 |
| Figure 15-51. Beaufort Wind Force Scale for sea conditions (and on land). |
Wave Interference PatternsWave interference occurs where waves from different sources collide (Figures 15-52 and 15-53).Constructive wave interference occurs where waves come together in phase or crest meets another crest (or trough meets another trough) . • Destructive wave interference: Waves come together out of phase or crest meets a trough. |
 Fig. 15-52. Examples of constructive and destructive wave interference patterns. |
 Fig. 15-53. Interference patterns created by winds gusts blowing from different directions. |
Rogue WavesRogue waves are large, unpredictable, and dangerous. Rogue waves (also called extreme storm waves) are those waves which are greater than twice the size of surrounding waves. They often come unexpectedly from directions other than prevailing wind and waves. Many reports of extreme storm waves describe them sudden walls of water. They are often steep-sided and associated with unusually deep troughs. Some rogue waves are a result of constructive interference of swells traveling at different speeds and directions. As these swells pass through one another, their crests, troughs, and wavelengths sometimes coincide and reinforce each other. This process produces large, towering waves that quickly form and disappear. If the swells are traveling roughly in the same direction, these massive waves may last for several minutes before subsiding. Rogue waves can also form when storm swells move against a strong current, resulting in a shortening of the wavelength and increasing its wave height. Constructive interference can also create deep troughs (the opposite of a rogue wave). Large rouge wave of this kind are frequently experienced in the Gulf Stream and Agulhas currents (Figure 15-54). Rouge waves are extremely dangerous along coastlines and frequently known sweep unaware people away on beaches and along sea cliffs, sometime to their death. |
 Fig. 15-54. This 60 foot rogue wave threatened a ship in the Gulf Stream near Charleston, South Carolina. |
Waves Refraction, Diffraction, and ReflectionWaves can bend when they encounter obstacles or changes on the sea floor. |
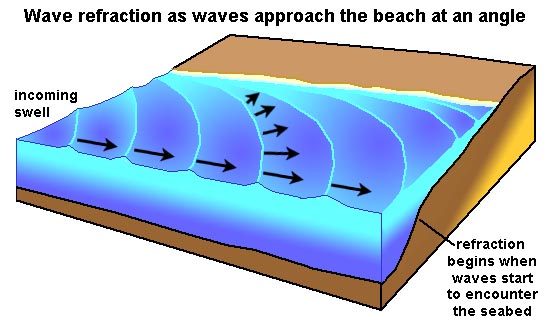 Fig. 15-55. Wave refraction as waves approach the beach at an angle. |
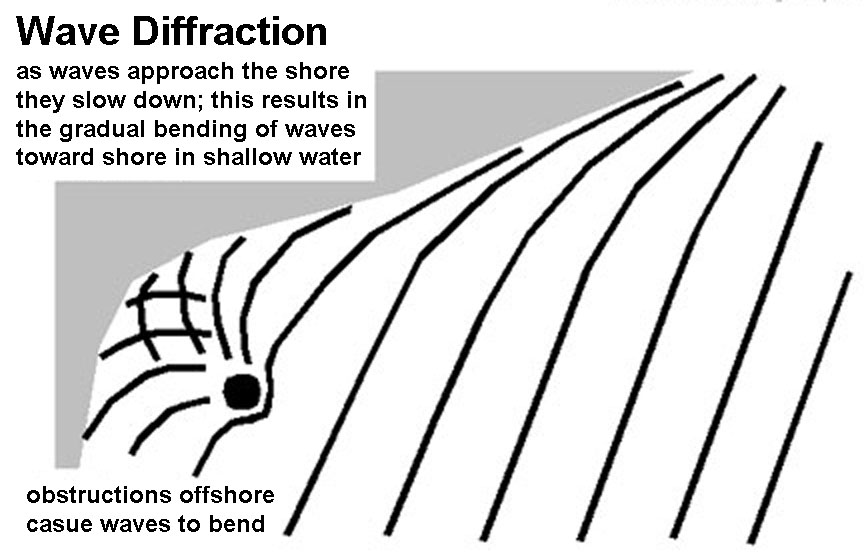 Fig. 15-56. Wave diffraction around offshore obstruction on waves nearshore |
Longshore Currents and Longshore DriftA longshore current is a current that flows parallel to the shore within the zone of breaking waves. Longshore currents develop when waves approach a beach at an angle (Figure 15-57). When waves approach a beach, they slow down. If the waves approach a beach at an angle, the slowdown near the beach will cause the line of a wave crest to bend in a process called wave refraction. Some of the energy from the waves approaching the beach at an angle create currents that move parallel to the beach (moving downwind).Longshore drift is the process by which sediments (sand and gravel) move along a beach shoreline, caused by currents created by waves approaching the shore at an oblique angle. The waves create a movement of water close to the beach called a longshore current. Longshore drift is the movement of sediments along a coast by waves that approach at an angle to the shore but then the swash recedes directly away from it. The water in a longshore current flows up onto the beach, and then back into the ocean in a sheet-like flow. As this sheet of water moves on and off the beach, it can transport beach sediment back out to sea. Objects floating in the longshore current move in a zigzag pattern up and down the beach as it moves down current. Longshore currents are agents of both erosion and deposition along shorelines. Longshore currents move in directions dependent on the direction of the dominant incoming swell. |
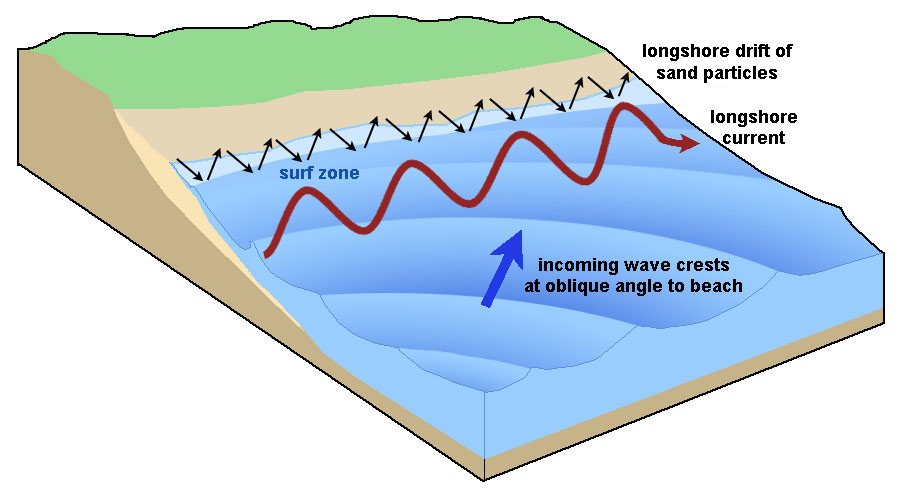 Fig. 15-57. Longshore currents and longshore drift are caused by waves approaching the beach at an oblique angle. Particles carried by wave currents move in a zigzag pattern along the beach. |
Rip Currents and Rip TidesA rip current is a current that flows away from the coast (Figures 15-58 and 15-59). Rip current, also commonly referred to simply as a rip, is a strong channel of water flowing seaward from near the shore, typically through the surf line. Rip currents tend to form when wave swells approach directly onto the beach, causing water to bunch up and then spill seaward in locations along the beach. Rip currents form when wave break strongly in one direction, but weakly in another. In the surf zone, breaking waves produce currents that flow both along the shore and out to sea. Rip currents typical form on beaches with a sand bar and channel system in the nearshore area. A rip current forms as a narrow fast-moving current of water moving in an offshore direction. Obstructions in the water can also deflect current offshore. Rip current vary in size and speed (up to 6 miles an hour, or faster than an Olympic swimmer). Rip currents move offshore and dissipate beyond the breaker zone. If caught in a rip current, swim parallel to shore to leave the current before heading for shore.A rip current is different than a rip tide, which is current associated with the swift movement of tidal water through inlets and the mouths of estuaries, embayments, and harbors caused by the rise and fall of tides. |
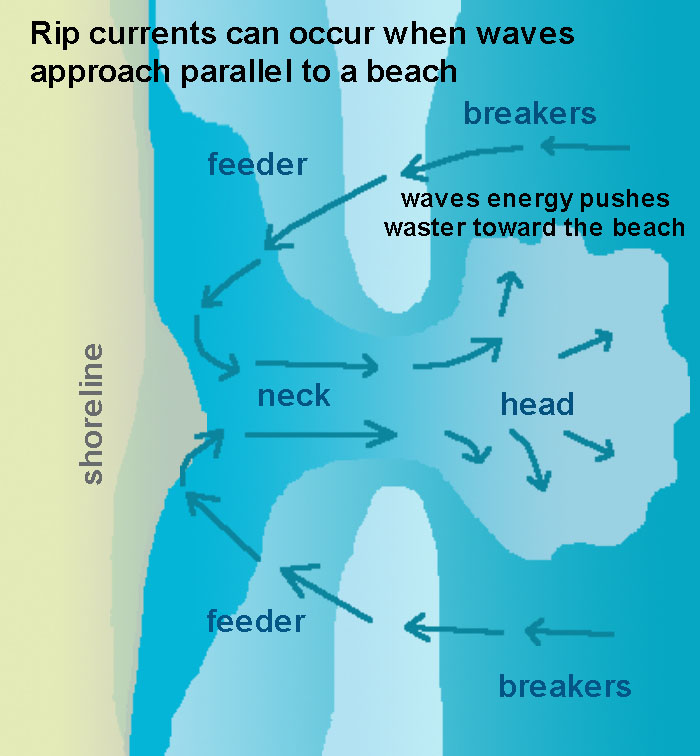 Fig. 15-58. Formation of rip current. Rip currents are common when wave approach in a line parallel to the beach. The bigger the waves, the stronger the rip currents. |
 Fig. 15-59. Rip current can vary with size and intensity depending of waves and shore geometry. Rip current are revealed by frothy bubbles streaming offshore. |
Surfer's Guide to Wave Forecasting for San Diego CountySan Diego County Swell Window• The compass bearing window that we can receive swell from is between 180° and 340° (south to north-northwest, Figure 15-60). Waves are weak on the edges of this window. The best part of our window is really between 200° and 300° degrees because the waves simply have to bend too much to be received on our coastline as surfable waves if they are outside of that range. |
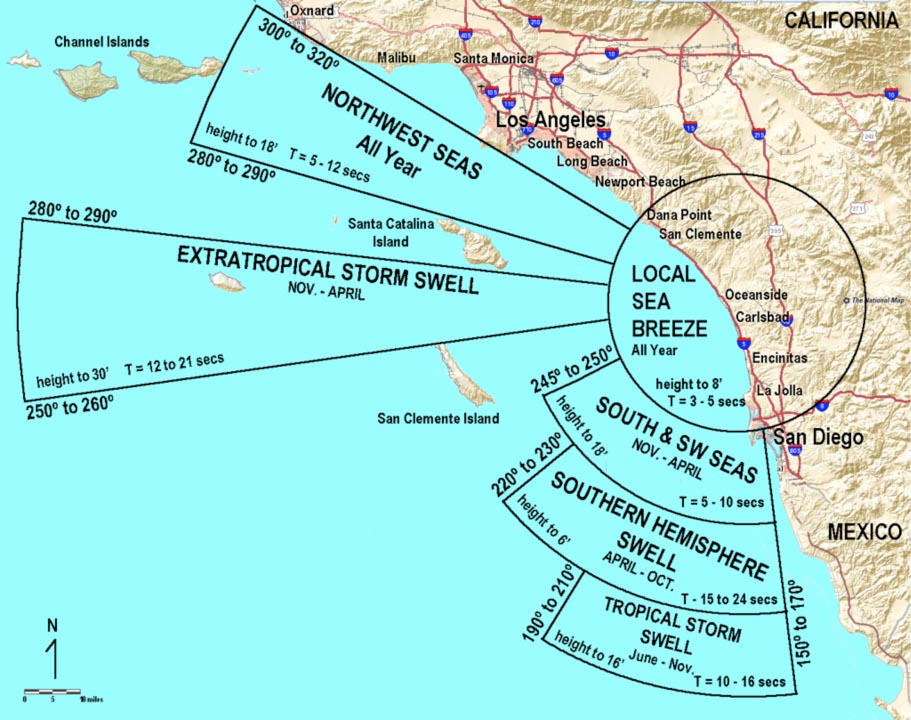 Fig. 15-60. The swell window for San Diego County is roughly between 180° and 340° (with North being 360°). |
Summer Swells Affecting San Diego County• Swell generated between Antarctica and New Zealand dominates the world oceans much of the year because it is a region with large storms (largest on Earth), and there is constant wind (infinite duration) and unhindered passage over open waters (infinite fetch)(Figure 15-61). Winter Swells Affecting San Diego County• Winter swells are largest swells on average in San Diego County• San Diego's winter swell is mostly generated in the Gulf of Alaska, most begin off of the Kuril Islands • Storm track is generally from west to east • Early season swell is usually more northerly (N or NNW direction or about 320 to 340 degrees). • Later season storms drop farther south and give us a more westerly swell direction from about 280 to 300 degrees. We also get more rain from these storms. • Partial swell blockage occurs in the Southern California Bight from wave shadows created from the Channel Islands. • During the winter the largest surf is in southern San Diego County and northern Baja. We also can get colder water and upwelling conditions. Locally Generated Swell In San Diego RegionWe have a number of locally generated swells that come from smaller storms in the Pacific Northwest.• These storms produce surf that has a shorter period (between 6 and 10 seconds) because the storms are not very large. • The swell angle is very steep from the north-northwest around 320 to 340 degrees. • We often get upwelling associated with these storms as well. Hurricane Swell In San Diego RegionDuring the late summer and early fall we can get swell from hurricanes that form off of the coast of mainland Mexico.• The wave periods generated from these storms is usually between 10 and 14 seconds. • The key identifying waves from these storms is the angle. The swell angle begins from the S or SSE between 160 and 180 degrees. The angle increases with time as the storm moves up the coast and either onshore or out to sea towards Hawaii. |
Fig. 15-61. The Antarctic Circumpolar wind belt is the source of most swells. Why? Fig. 15-62. A southwest swell coming in at Beacons Beach, Encinitas, San Diego County, California. |
Tsunamis |
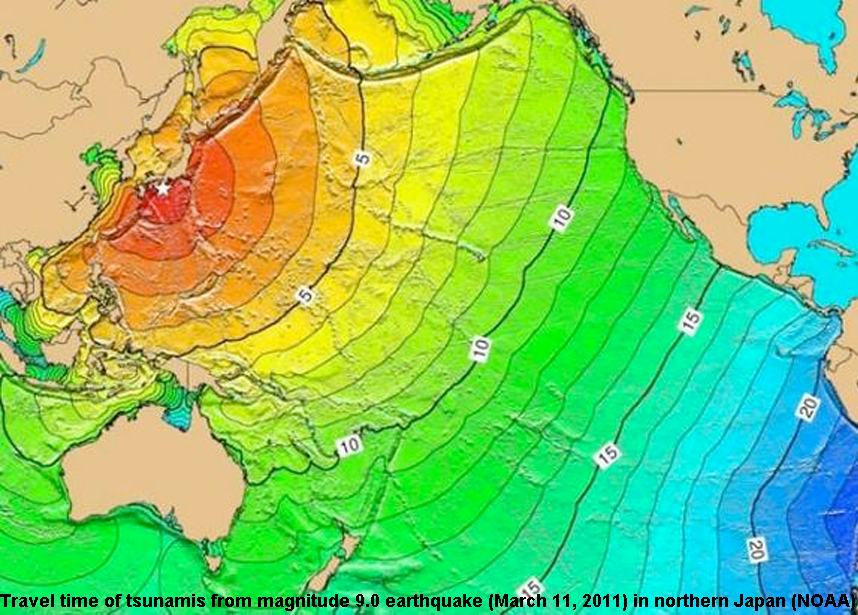
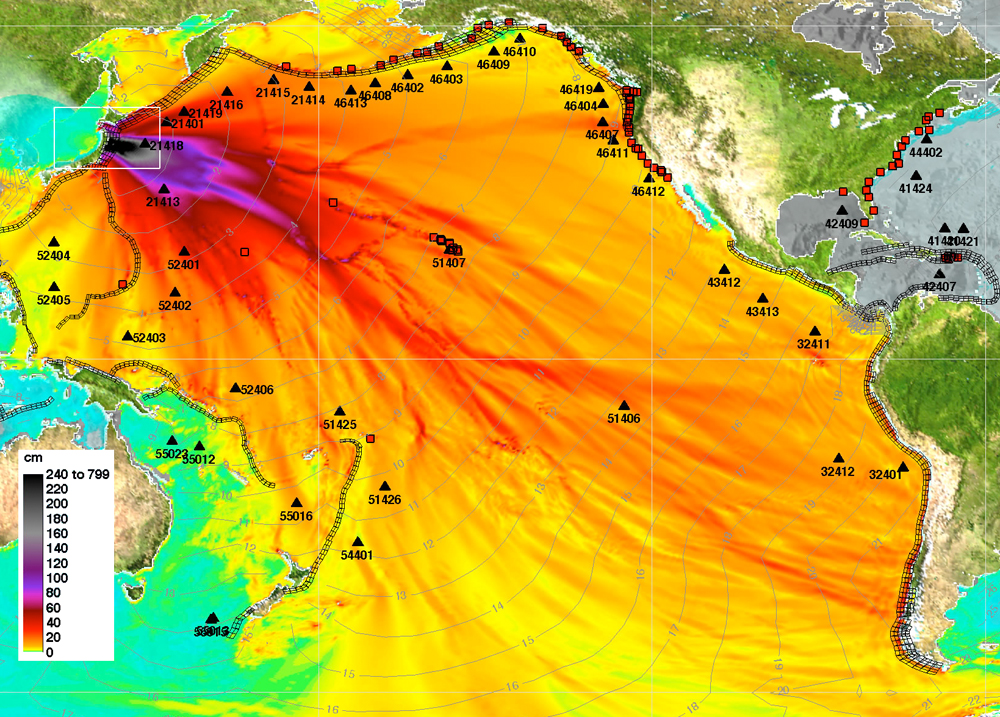
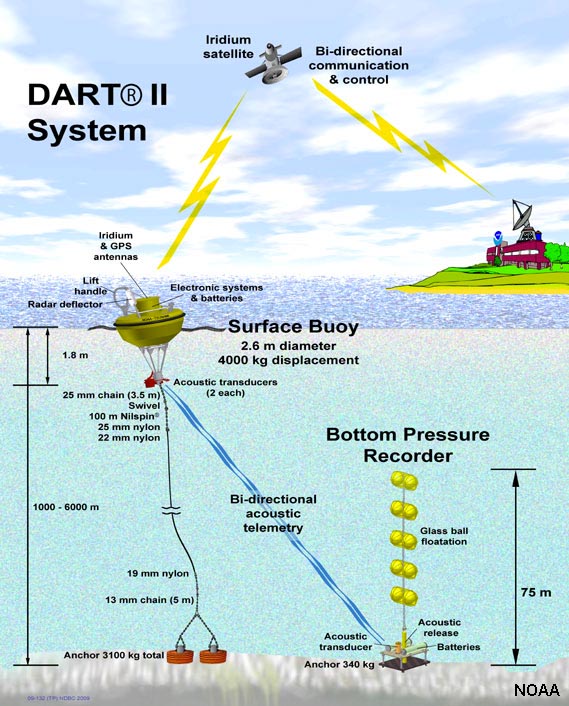
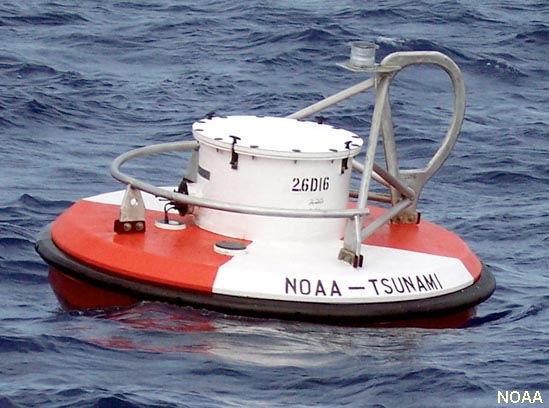
| A tsunami is a very long and/or high sea wave or coastal serge of water caused by an earthquake or other disturbance. Tsunamis get their name from Japan (where they are fairly common): "Tsu" [ harbor], "nami" [wave]. Tsunamis are caused by displacement of the earth's crust under an ocean or body of water of any size. They can also be generated by earthquakes, volcanic explosions, underwater landslides, even asteroid impacts. When the solid earth moves, the water above it also moves with it (Figures 15-63 and 15-64). Tsunamis are the result of both the initial shock waves and the following motion of the water readjusting to a stable pool (sea level). Tsunamis can travel great distances throughout the world's ocean. Their energy is dissipated when they approach shorelines where they come onshore as a great surge of water, with or without a massive "tidal wave" crashing onshore. Although most tsunamis are small (barely detectable), some modern tsunamis have reached inland elevations many hundreds of feet above sea level.
|
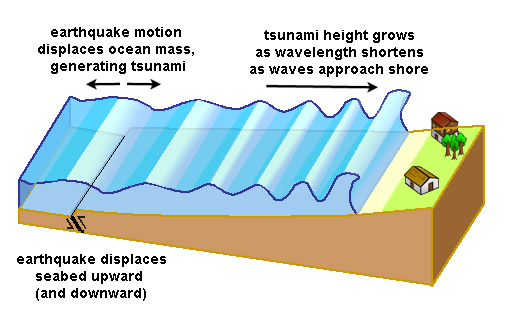 Fig. 15-63. How a tsunami is generated by an earthquake. 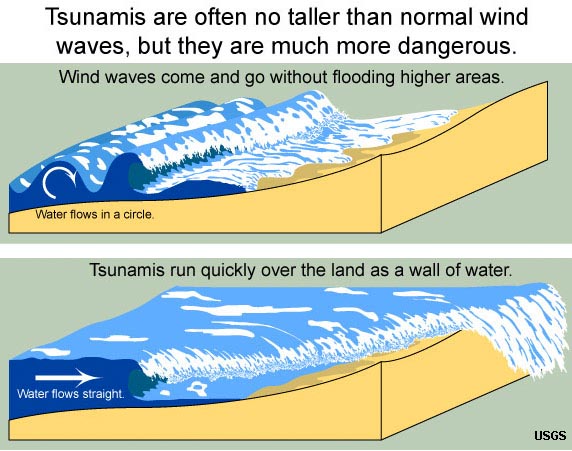 Fig. 15-64. Tsunamis move onshore more as a surge than just a wave. |
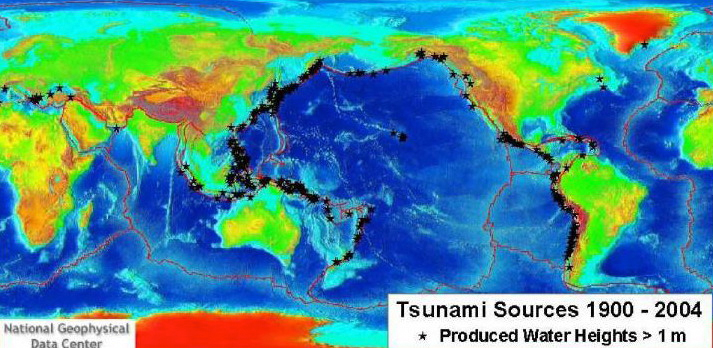
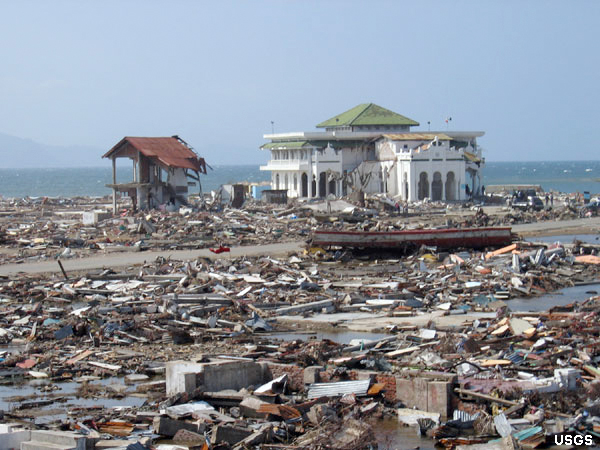
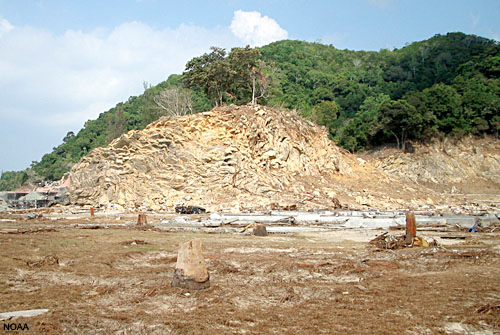
Impact of Tsunamis in Modern World History |
|||||||||||||||||||||||||||||||||||
|
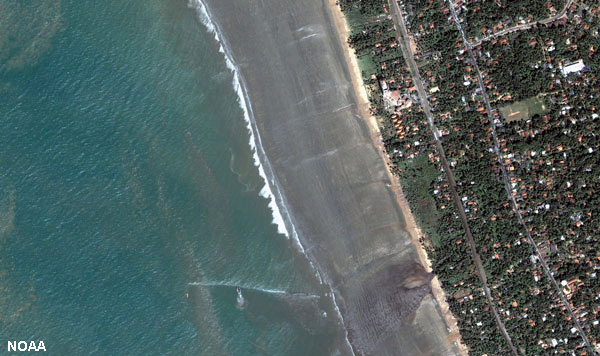 Fig. 15-65. Drawback from tsunami in Sri Lanka exposed about 150 meters before the tsunamis arrived from 2004 earthquake. |
||||||||||||||||||||||||||||||||||
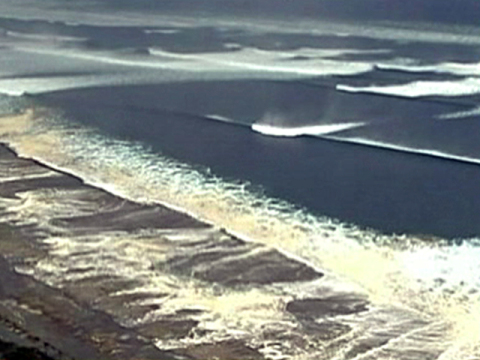 Fig. 15-66. Tsunamis arriving on coast of Japan in 2010 |
|||||||||||||||||||||||||||||||||||
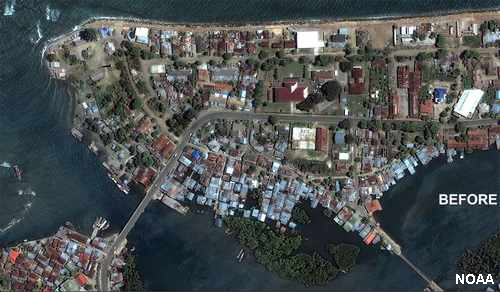
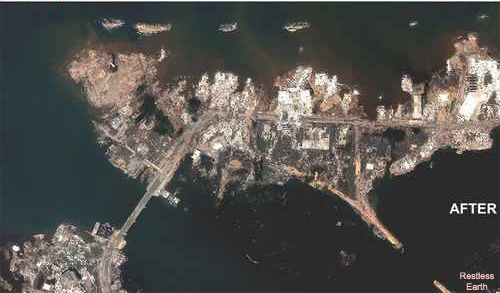
 Fig. 15-67. 2004 Tsunami damage in Sri Lanka |
|||||||||||||||||||||||||||||||||||
 Fig. 15-68. Giant whirlpool caused by the Japan, 2011 tsunamis (note the boat for scale). |
|||||||||||||||||||||||||||||||||||
|
||||||||||||||||||||

What are tides and what causes them?Tides are one of the most reliable and predictable phenomena in the world. Tides are cause by the gravitation pull of extraterrestrial objects, the Sun and Moon being the most significant tidal forces on planet Earth (Figure 15-97). Tidal forces can affect crustal rocks and especially water (oceans and great lakes). Water will flow in the direction of gravitational pull. However, because the earth is rotating, this gravitational pull is constantly changing causing daily tide cycles.Tides are very long-period waves that move through the oceans in response to gravitational forces exerted on the oceans by the Moon and Sun. Both the solid Earth and the oceans are impacted by tidal forces, but oceans can move because they are fluid. Tidal forces create bulges on the ocean surface (Figure 15-80). The largest tidal effect is from the Moon due to its proximity to Earth; a smaller tidal effect is from the Sun. The Sun's gravitational pull on the Earth is about half (~44%) of the moon's gravitational pull. Tides arise in the oceans and move toward the coastlines where they appear as the daily rise and fall of the ocean surface. Large lakes can have tides, but they are small because of the comparatively small volume of water. A tidal range is the difference in height between the highest high water (HHW) and the lowest low water (LLW) (Figure 15-81). Tidal ranges vary from region to region, influenced by the geography of coastlines. |
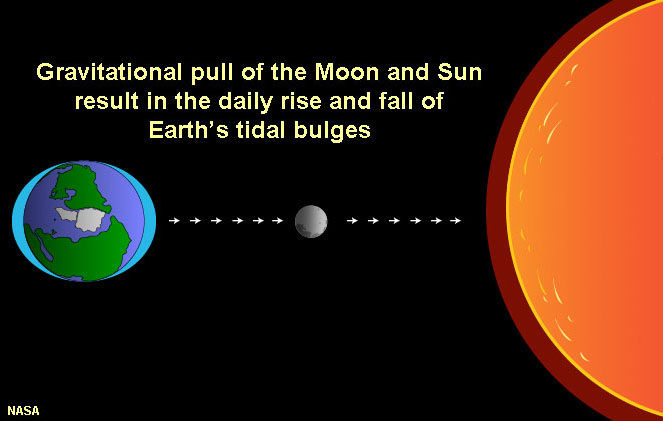 Fig. 15-80. Tidal bulges from the gravitational attraction of Earth, Moon, and Sun. 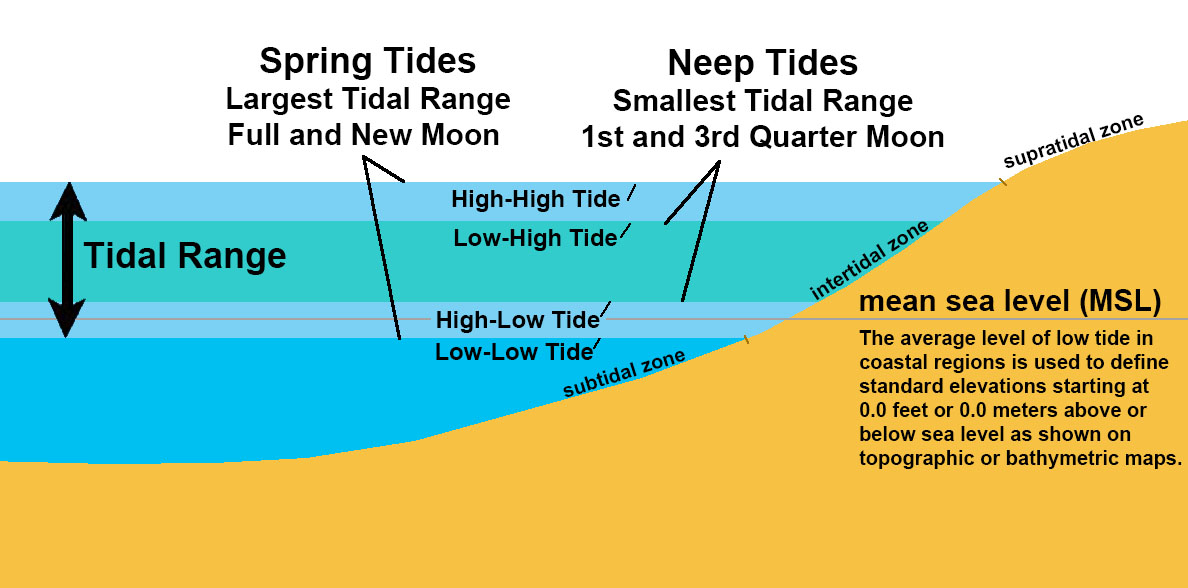 Fig. 15-81. Tidal range is the distance between average highest and lowest tides. |
Spring Tides and Neap TidesTides are periodic short term changes in the elevation of the ocean surface caused to the gravitational attraction of the Moon and Sun, AND the rotational motion (inertia) of the of the Earth. The gravitational pull of the Moon is slightly stronger than the Sun. However, sometimes the gravitational forces of the Sun and Moon join together to make higher tides (Figure 15-82).Phases of the Moon and TidesThe gravitational pull of the Moon is slightly stronger than the Sun. However, sometimes the gravitational forces of the Sun and Moon join together to make higher tides.* During full moon or new moon phases, the gravitational forces of the Sun and Moon are maximized, producing very large ranges of tidal highs and lows called spring tides (Figures 15-82 and 15-83). * During full moon or new moon phases, the gravitational forces of the Sun and Moon are maximized, producing very large ranges of tidal highs and lows called spring tides. A spring tide is the exceptionally high and low tides that occur at the time of the new moon or the full moon when the Sun, Moon, and Earth are approximately aligned. * During the quarter moon phases, the gravitational forces of the Sun and Moon are at their minimum, producing very small ranges of tidal highs and lows (neap tides). A neap tide is the lowest level of high tide; a tide that occurs when the difference between high and low tide is least. Neap tide comes twice a month, in the first and third quarters of the moon. Tidal ranges vary considerably around the world and are influenced by factors including shoreline and continental shelf geometries, latitude, size of the body of water, and other factors.
|
 Fig. 15-82. Spring and neap tides are related to the orientation of the Earth, Moon, and Sun (note polar orientation in this view).  Fig. 15-83. Monthly tidal cycle showing spring tides and neap tides. |
The Effects of Elliptical Orbits of Earth and Moon On TidesIt take the Earth 365.242 days for the Earth to orbit the Sun. The Moon completes one orbit around the Earth in 27.3 days (called the sidereal month). However, due to the Earth's motion around the Sun it has not finished a full cycle until it reaches the point in its orbit where the Sun is in the same position (29.53 days) - this is the time from one full moon to the next.However, both the Earth and the Moon have orbits that are slightly elliptical (not circular). This has an influence on the intensity of tide cycles (Figure 15-84). Perigee is when the Moon is closest to the Earth. Apogee the Moon the farthest from the Earth. Perihelion is when Earth is closest to the Sun (in early January). Aphelion Earth is farthest from the Sun it is called (in early July). Because the Moon has a greater influence on tides, the highest tides happen at perigee when there is a full or new moon. This happens a couple times a year and are called king tides. King tides occur when the Earth, Moon and Sun are aligned at perigee and perihelion, resulting in the largest tidal ranges seen over the course of a year. |
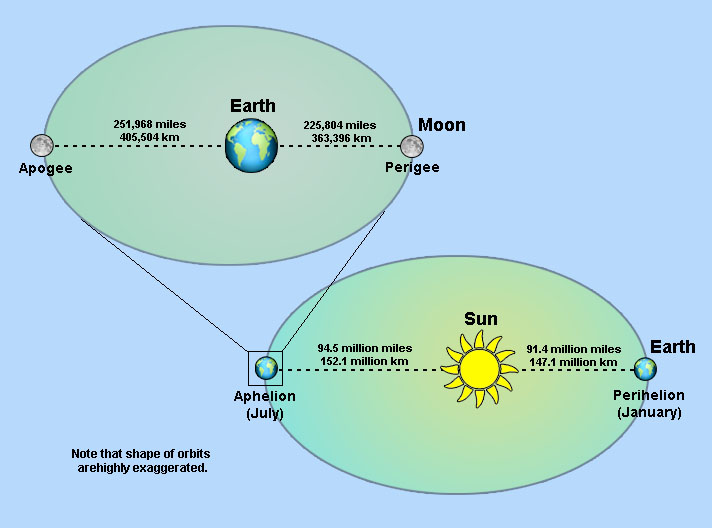 Fig. 15-84. Effects of elliptical orbits.  Fig. 15-85. Tidal curves for diurnal, semi-diurnal, and mixed tides. |
Types of Tidal CyclesIf the Earth were a perfect sphere with no continents, all parts of the planet would have two equally proportioned low and high tides every lunar day as the Earth rotates. However, the large continental land masses block the westward movement of the tidal bulges. This blocking of the tidal bulges results in the development of complex tidal patterns within each ocean basin. As a result, different parts of ocean basins have different types of tides (Figures 15-85 and 15-86).
Most coastal locations experience two high tides and two low tides each day (semidiurnal tides). |
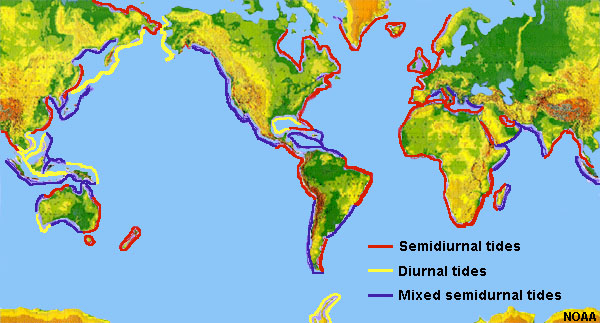 Fig. 15-86. Map of the world showing the regions affected by semidiurnal, diurnal, and mixed tides. |
Regional Tidal VariationsTidal ranges vary considerably around the world and are influenced by factors including shoreline and continental shelf geometries, latitude, size of the body of water, and other factors. For instance, the equatorial regions have very minimal tides compared with higher latitudes. Like all ocean currents, tidal currents are influenced the influence of the Coriolis effect. Ebb and flood currents influenced by the Coriolis effect create circular flow patterns in large bays. |
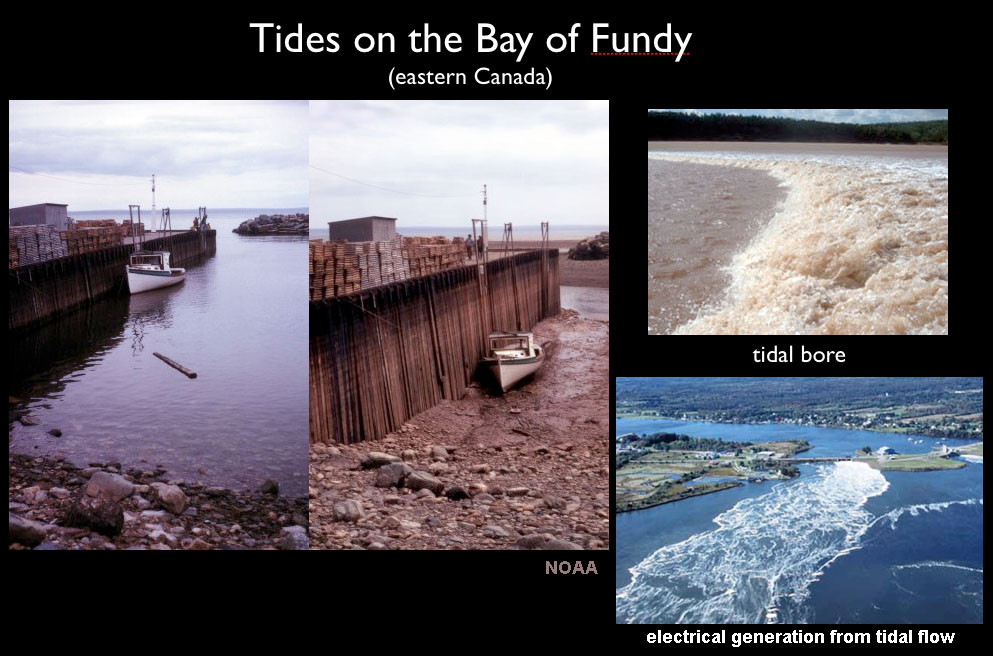 Fig. 15-87. Tides at the Bay of Fundy, Maine and Canada, are the largest in the world with spring tide ranges more than 50 feet! |
|
Tidal CurrentsAn incoming tide along a coast is called a flood current; an outgoing tide is called an ebb current. The strongest currents usually occur near the time of the highest and lowest tides. The tidal currents are typically weakest midway between the flood and ebb currents and are called slack tides.Daily tides move vast quantities of water along coastlines, filling in and emptying coastal bays and estuaries, flushing out stagnant waters, and moving nutrients in and out. The ebb and flood tides cause rivers in delta regions to reverse their flow directions and bring in seawater to mix with freshwater (creating brackish waters). The speed of tidal currents can reach up to several miles per hour. |
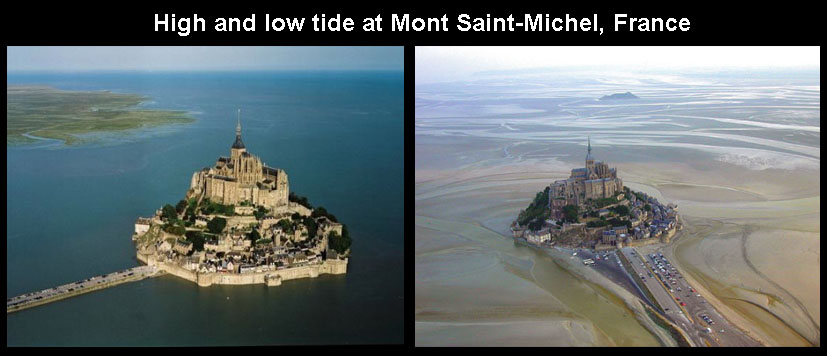 Fig. 15-88. Tides and tidal flats at Mont Saint-Michel, France, a region with a high tidal range. Left shows flood (during high tide); right shows ebb (during low tide) when tidal flats are exposed. |
|
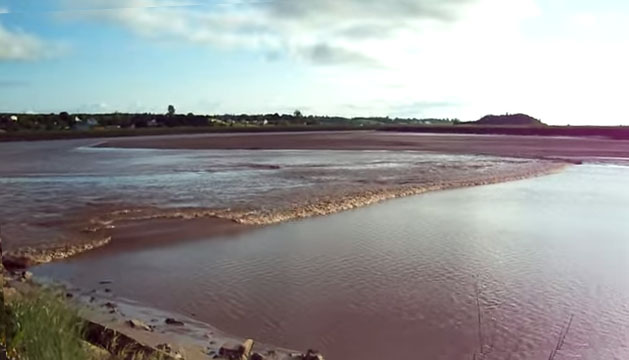
| Check out these tidal bore videos: Tidal bore surfing on the "Bono" waves, Kampar River, Indonesia (YouTube video) Tidal bores surge in Qiantang River(YouTube video) Tidal Bore Surfing "Seven Ghosts" in Indonesia (YouTube video) |
Storm Surge and Storm TidesA storm surge is a wind-driven current of water that piles water into shallow coastal areas and onshore areas with low coastal elevation. A storm surge is a buildup of water created by winds associated with large storms where wind moves water into coastal areas that have no place to drain away.Storm surges are typically associated with large low pressure tropical cyclones (hurricanes and typhoons) and strong extra-tropical storms that move into shallow neritic zone environments, and often have enhanced effects where coastal geography, such as a shallow bay or estuary, that cause water to accumulate. Storm surge effect are most catastrophic when they occur in association with high tide, and are often the cause of the greatest death & destruction associated with large storms. A storm tide is when a storm surge coincides with a regular high tide. The effects of storm tides adds to the catastrophic effects of storms associated with cyclones on coastal settings (Figures 15-91 and 15-92). Fortunately, storm tides can be forecasted (predicted in advance) in association with large storms. |
 Fig. 15-91. Storm surge associated with a cyclone. |
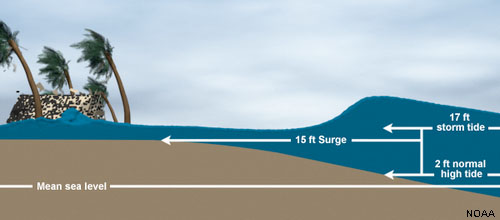 Fig. 15-92. Additive effects of storm surge with high tide. |
Subdivisions of the Intertidal ZoneThe intertidal zone is the region where land surface is intermittently exposed between the lowest-low water and the highest-high water. The intertidal zone is between the subtidal and supratidal zones (Figure 15-93). Tidal ranges influence the distribution of sediments and the habitats occupied by plants and animals.The subtidal zone is the submerged region lying below the low-tide mark but still shallow and close to shore. The supratidal zone is the typically vegetation-free splash or spray zone above the high water line where back-beach dunes accumulate and it is too salty on average for land plants to grow. A wrackline is an accumulation of shell material and debris that typically marks the location of the last high tide cycle on a beach or after a storm surge (Figure 15-94). |
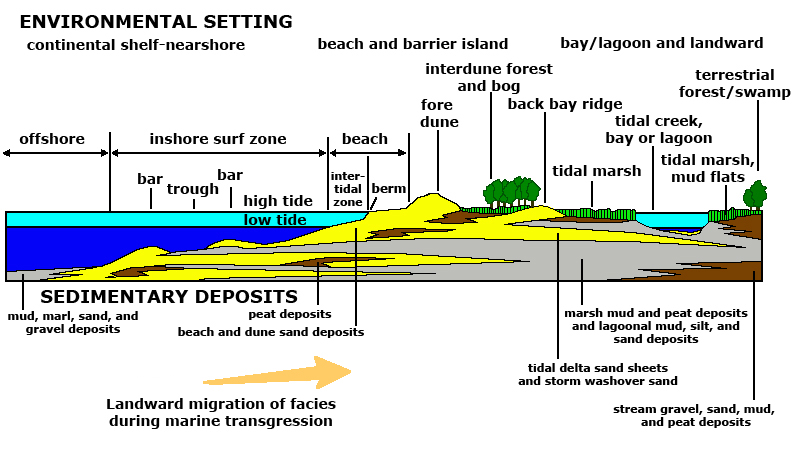 Fig. 15-93. Coastal environments within the intertidal zone extend from offshore bars to inland estuaries and bays. |
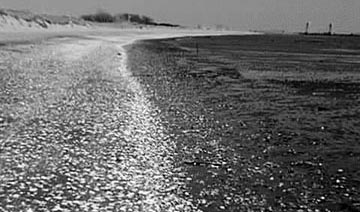 Fig. 15-94. A wrackline consisting of most shell material, pebbles, and flotsam along Plumb Beach, Jamaica Bay, Brooklyn, NY |
What is Sea Level?Sea level is generally used to refer to mean sea level (MSL). A common accepted definition of mean sea-level standard is the midpoint between a mean low and mean high tide at a particular location.Sea level is an average level for the surface of one or more of Earth's oceans from which heights such as elevations may be measured. However, sea level varies for place to place due to gravitational differences in the solid earth, and variations in sea water characteristics (water density) and atmospheric pressure effects. For instance, Figure 15-95 shows topography of the ocean surface one specific day, however, it is constantly changing day by day, season to season. MSL is a standardized geodetic reference point for geographic locations. |
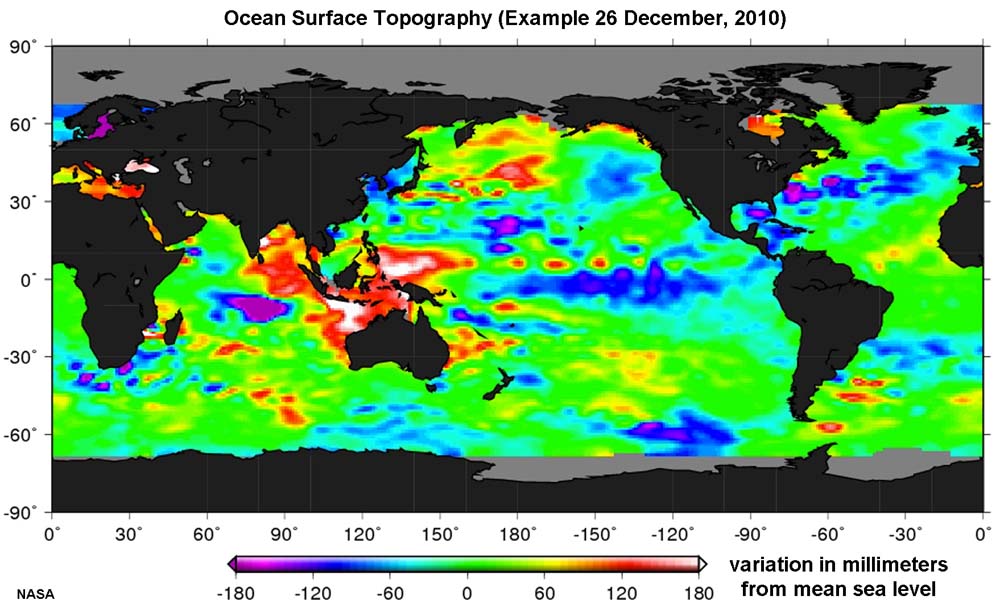 Fig. 15-95. Sea level height map on a particular day (departure from mean sea level). |
Changes of the Sea Level Over TimeSea levels are constantly changing around the globe. Long-term trends in sea-level rise are linked to global climate change. Sea level changes are primarily due to the melting and freezing of the icecaps due to global temperature changes. Sea level change is also due to the expansion and contraction of the total water mass due to global temperature changes. Figure 15-96 illustrates the dramatic rise in sea level over the past 20,000 years—estimated at about 120 meters (400 feet)! Figure 15-97 shows how much sea level has risen since detailed global record have been kept (starting around 1900).Figure 15-98 show that in most places around the coastline of North America sea level is rising, however, in some places sea level is falling. In northeastern North America the land is rising due to glacial rebound (an isostatic adjustment caused by the melting of the great Laurentide continental glacier). In Alaska and other part of the West Coast, tectonic forces are pushing up coastal regions, some of these were rapid adjustments associated with massive earthquakes. |
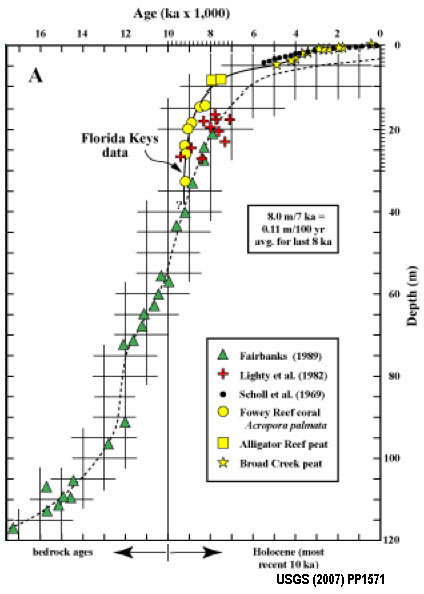 Fig. 15-96. Sea level changes of the past 20,000 years (Late Pleistocene and Holocene) |
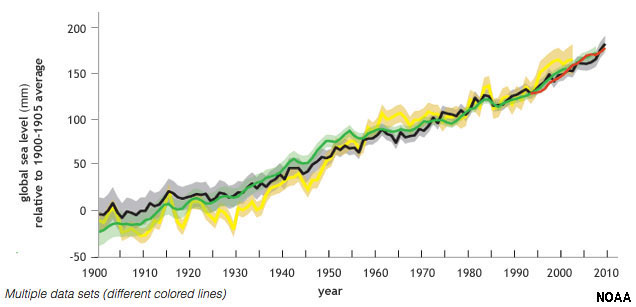 Fig. 15-97. Average global sea-level rise 1900 to 2010. |
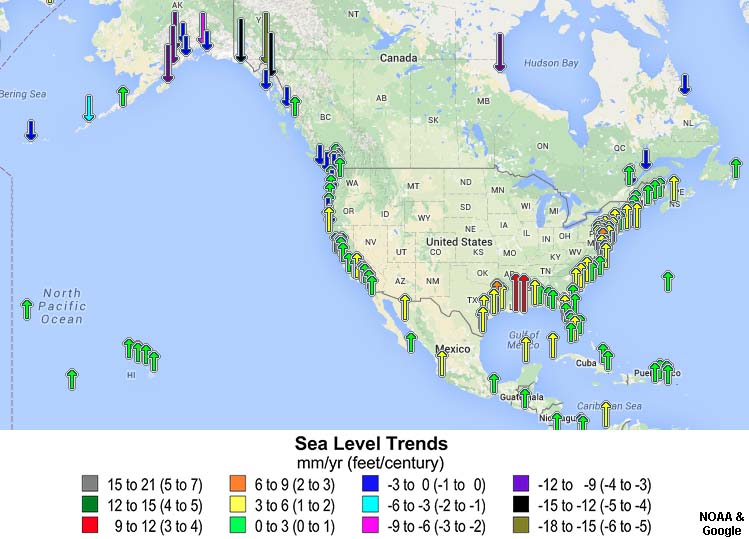 Fig. 15-98. Sea level changes around North America. |
||
| What is Sea Level? YouTube video explaining the geodesy of defining sea level. Sea Level Trends (NOAA website linked to data used in Figure 15-98). |
Coastlines and Coastal Processes |
| Coastlines are a dynamic interface between land and sea. Coastlines preserve evidence of many process from the past, going back hundreds, thousands, even millions of years. Coastlines are shaped by an ongoing series of processes involving daily wind and wave action, tides, occasional storms and superstorms, earthquakes, and massive tsunamis. Coastlines reflect process of their origin including erosion of bedrock features, and are influenced by regional geology, geography, and climate. Understanding coastline dynamics is important considering that about 75% of the worlds megacities are on coastlines. According to the United Nations. presently about 40% of the world’s population lives within 100 kilometers of the coast, with hundreds of millions living in low-lying coastal areas (below about 10 meters elevation). Wave erosion is persistent and intense, especially when storm waves combine with high tides. As a result, coastal landforms are generally delicate, and short-lived features. The sediment supply to coasts are offset by erosion rates along shorelines. Sediment supply is influenced by climate factors and geography, and can vary significantly from place to place, season to season, and by isolated events, such as changes caused by a massive superstorm (Figure 15-100). |
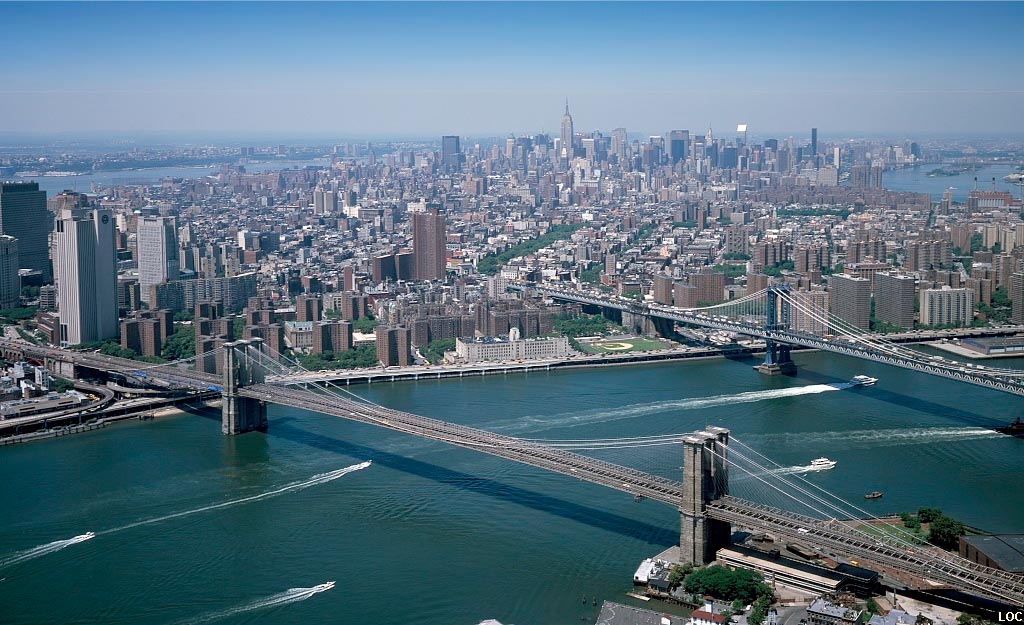 Fig. 15-99. New York, the largest coastal city in North America. More than 12 million people in the United States live in regions within 3 meters above current sea level. |
Classifications of Coastlines and Shoreline FeaturesThree different classification schemes of coastlines include:a. Primary or Secondary Coastlines b. Active or Passive Margins c. Emergent or Submergent Coasts Note below that characteristics of each classification scheme overlap and complement each other. |
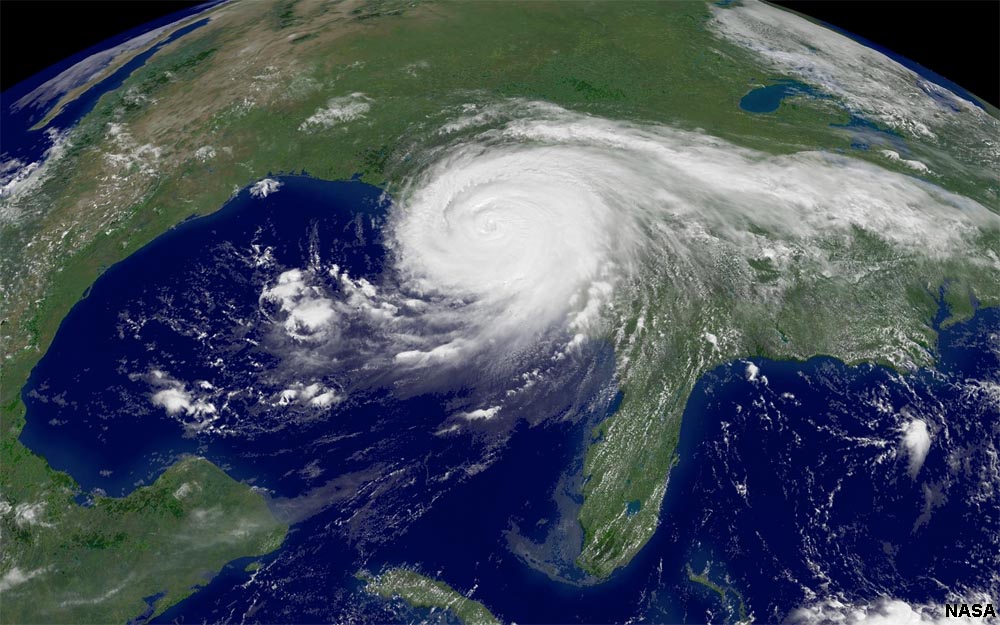 Fig. 15-100. Hurricane Katrina, North America's most expensive disaster, wiped out an estimated 328 square miles of coastal land along the Gulf of Mexico. |
Primary and Secondary CoastlinesPrimary: Young coasts formed by terrestrial influences, and have not been significantly altered by marine processes. Processes including active faulting, volcanism, recent glaciation, and rapid sea level rise or fall create young coastlines.Secondary: Coasts that have been significantly changed by marine processes after sea level has stabilized. Secondary coastlines are dominated by shoreline erosion and deposition processes. |
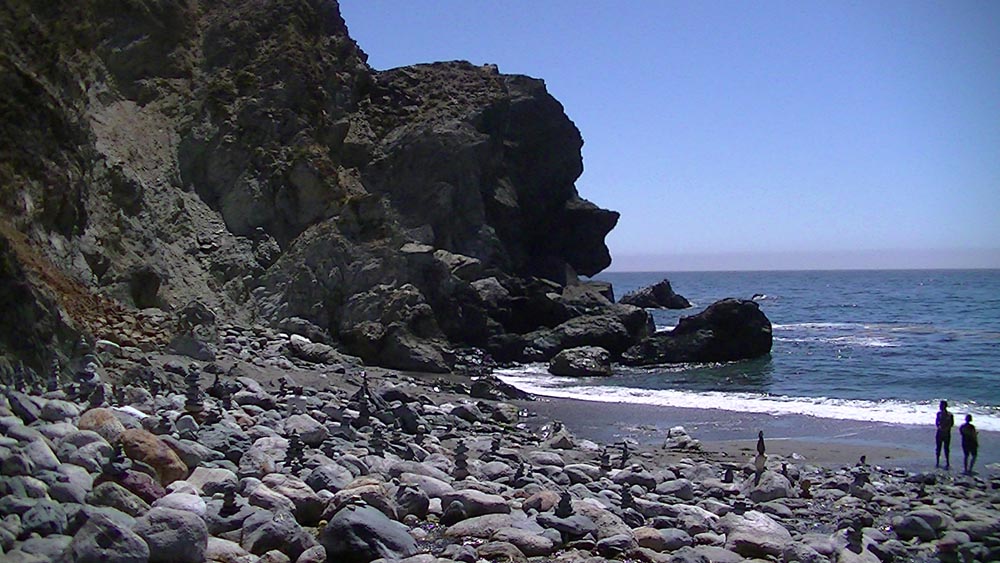 Fig. 15-101. Jade Beach, California, a primary coast along a tectonically active coastal mountain range. |
Primary Coasts - 5 TypesRia Coasts: Drowned river valleys caused by a rise in sea level.Examples: Chesapeake Bay (Figure 15-102). Glacial Coasts: Coastlines influenced by recent glacial activity such as glacial cut U-shaped valleys called fjords. Examples: Norway, British Columbia, Alaska, Hudson Valley, New England region, Long Island (Figure 15-103). Deltaic Coasts: Coastlines associated with active river and delta systems. Examples: Mississippi and Nile Rivers (Figure 15-104). Volcanic Coasts: Coastlines associated with recent or active volcanoes (mostly basaltic or andesitic volcanoes). Examples: Hawaii, Aleutian Islands, Japan, Philippines, Indonesia (Figure 15-105). Fault/tectonic Coasts: Coastlines associated with major active fault systems along continental margins Example: San Andreas fault going off shore at San Francisco (Figure 15-106). |
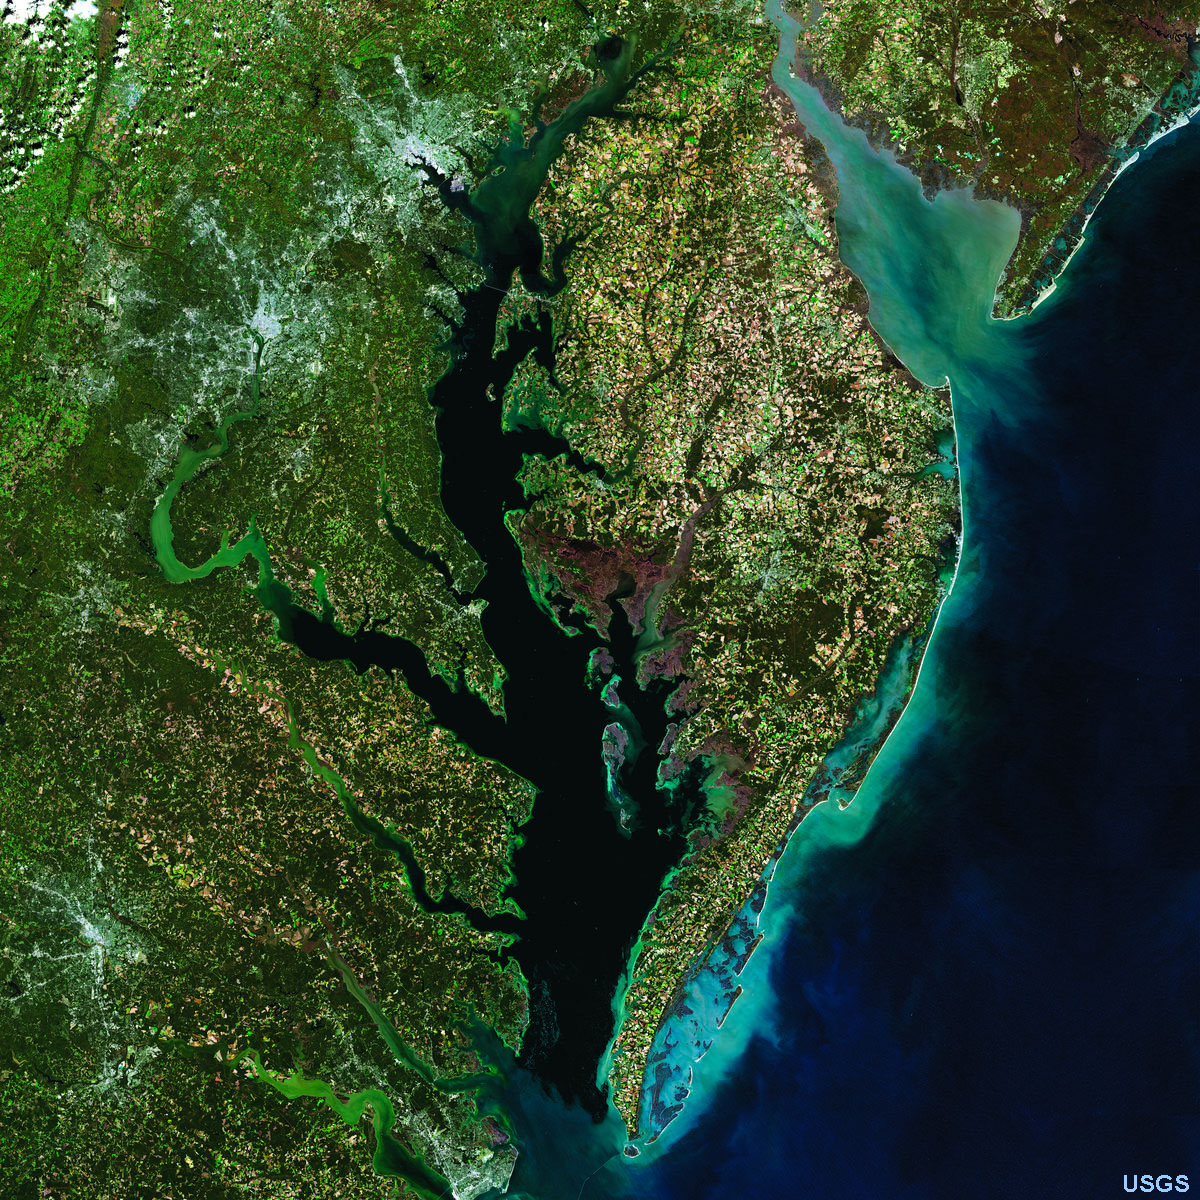 Fig. 15-102. Ria Coast: Chesapeake and Delaware Bays (estuaries), and the Delmarva Peninsula. Sea-level rise has back filled river valleys draining into the Atlantic Ocean. Ridges on land became peninsulas. |
|
||||||


Secondary CoastsSecondary coasts are coastlines that have been significantly changed by marine processes after sea level has "stabilized" allowing "erosional" and/or "depositional" processes to dominate shaping of the landscape. However, to explain this better, we need to examine the other classifications of coastlines first. |
||
Both primary and secondary coasts are influenced by whether they are active or passive continental margins (the second method of coast classification)(Figure 15-107). Both primary and secondary coasts are influenced by whether they are emergent or submergent coastlines (a third method of coast classification - discussed below). Passive margins tend to be submergent due to the ongoing rise in sea level (Figure 15-108). In contrast, active margins can be both "emergent or submergent" depending on local tectonic forces, such as caused by faulting. |
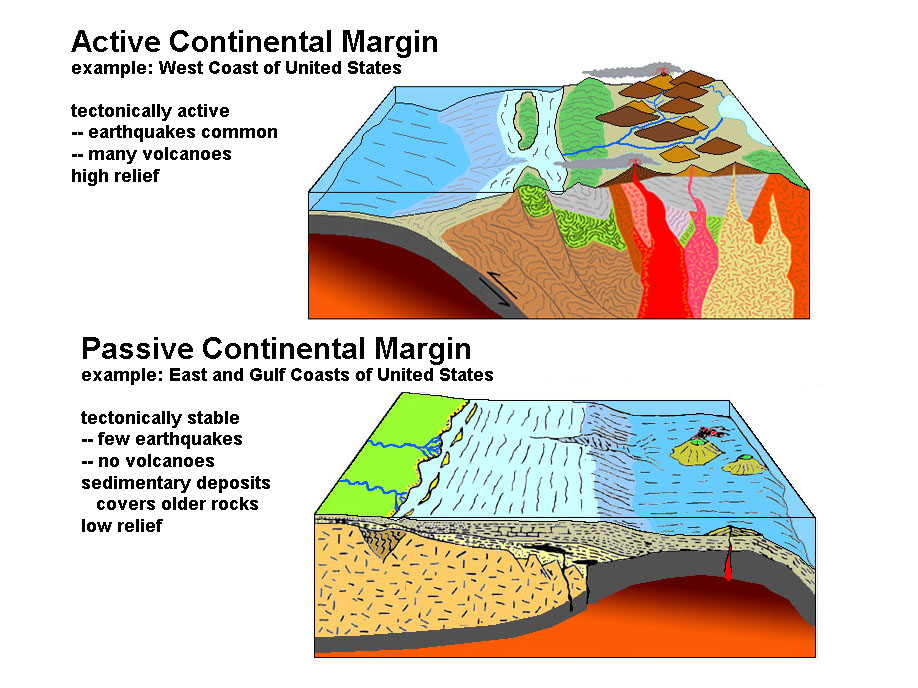 Fig. 15-107. Active versus passive margins. |
Fig. 15-108. Changing sea level trends. |
Coastlines on Active vs. Passive Continental MarginsIn North America, the Pacific Coast is an active continental margin whereas the Atlantic Coast is a passive continental margin (Figures 15-109 and 15-110).An active continental margin is a coastal region that is characterized by mountain-building activity including earthquakes, volcanic activity, and tectonic motion resulting from movement of tectonic plates. Active margins typically have a narrower and steeper continental shelf and slope. They can also be subsiding or uplifting. Active continental margins are also associated with subduction zones, often include a deep offshore trench. The Pacific Coast is an active margin that is characterized by narrow beach, steep cliffs, rugged coastlines with headlands and sea stacks (see features discussed below). Passive continental margins occur where the transition between oceanic and continental crust which is not an active plate boundary. Passive margins are characterized by wide beaches, barrier islands, broad coastal plains. Offshore passive margins typically have a wider and flatter continental shelf and slope. They are usually subsiding. Examples of passive margins are the Atlantic and Gulf coastal regions which represent setting where thick accumulations of sedimentary materials have buried ancient rifted continental boundaries formed by the opening of the Atlantic Ocean basin. |
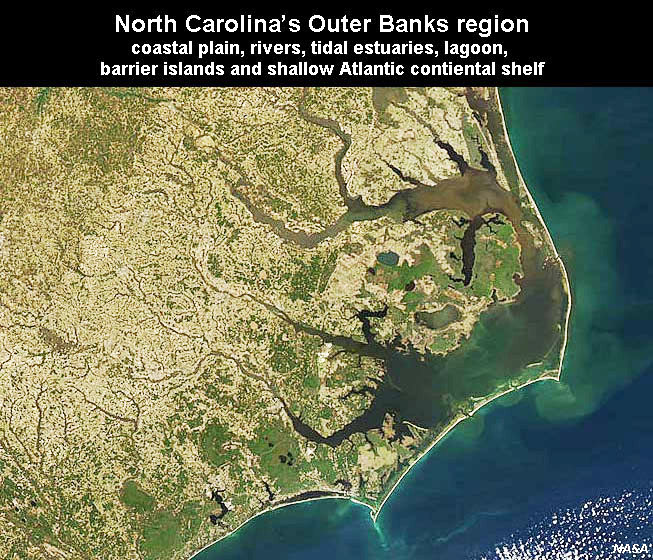 Fig. 15-109. Passive margin: North Carolina's Outer Banks region showing coastal plain, rivers, tidal estuaries, lagoon, barrier islands, and shallow Atlantic continental shelf. |
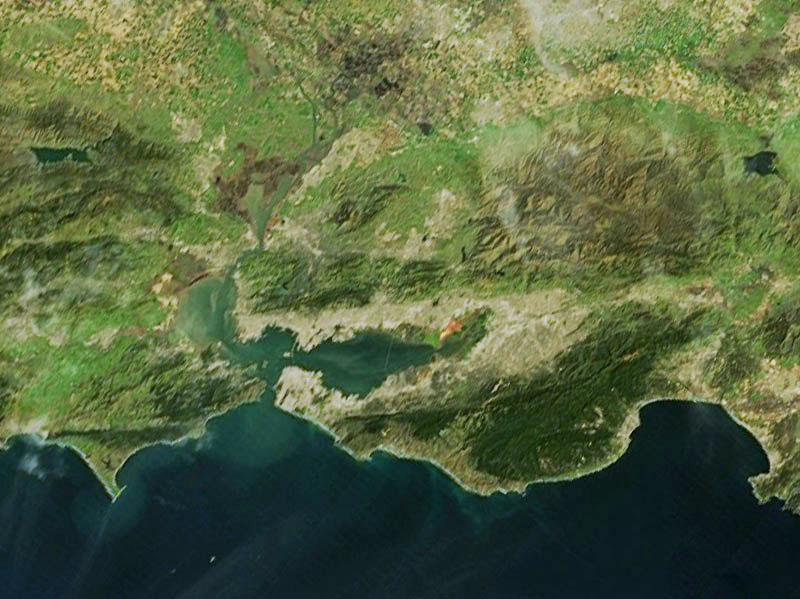 Fig. 15-110. Active margin: San Francisco Bay and Monterey Bay region has actively rising coastal range mountains and sinking coastal basins. |
Emergent and Submergent Coasts |
| Another important factor in understanding shorelines is tectonic activity and the rise and fall of sea level. Submergent coastlines display characteristics caused when sea level rises or the land sinks down. Submergent coastlines: * Contain estuaries and barrier bars, and barrier island systems. * Ridges that separate valleys that propel into the sea. Example: East Coast (see Figure 15-109). Emergent coastlines display characteristics caused when sea level drops or the land rises (from tectonic uplift). * Wave cut platforms and elevated marine terraces. Example: West Coast California (Figures 15-110 and 15-111). In some regions around the world, tectonic forces are pushing rocks up along coastal regions, mostly in regions associated with active continental margins. There areas are called emergent coasts and display features including sea cliffs and marine terraces (see below). Where sea level is rising faster than land is rising, or where coastal areas are sinking, it is called a submergent coast. Submergent coasts are associated with passive continental margins with wide coastal plains and continental shelves. Estuaries are associated with submergent coastlines formed when sea level rises and floods existing river valleys. Active margins can have both emergent and submergent coastlines in close proximity to each other. |
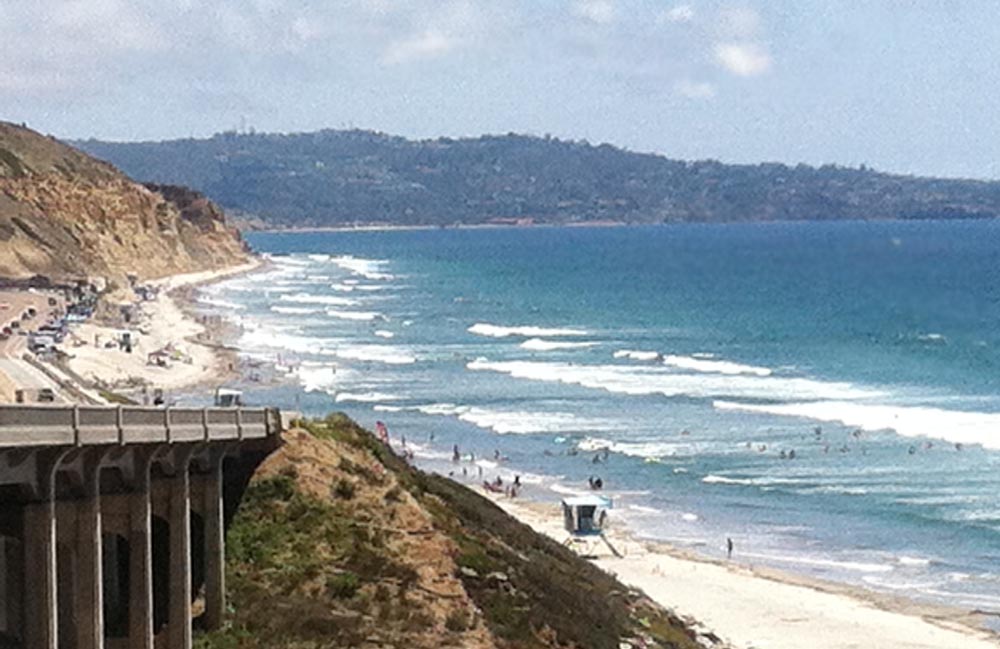 Fig. 15-111. San Diego's coastline displays characteristics of both emergent and submergent coastlines, having both seacliffs, headlands and marine terraces (emergent), and bays and estuaries filling flooded river valleys (submergent). View south along the Coast Highway at Torrey Pines Nature Preserve, California. |
How do waves contribute to coastal erosion?Shoreline erosion depends on several factors:1) Amount of sediment to buffer land: If the sand supplied to a beach is less than the amount removed by shoreline erosion processes, the beach will retreat landward. 2) Amount of tectonic activity: Uplift along the coastline allows erosion to provide sediments to a coastline. If the coast is not rising, then shoreline will retreat landward. 3) Topography: Coastal uplands provide more sediments to beaches than flat coastal plain regions. 4) Composition of land: Hard bedrock (such as granite) is harder to erode than softer unconsolidated deposits. 5) Waves and weather: The greater the waves and storm-generated currents, the more material can be eroded. 6) Coastline configuration: Coasts facing prevailing storm waves are eroded faster than isolated bays and down-wind protected shorelines (Figure 15-112). |
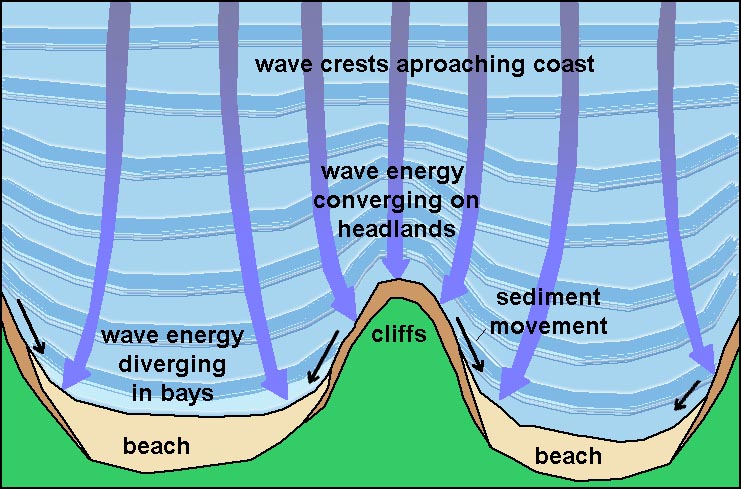 Fig. 15-112. Wave refraction focuses wave energy on headlands and deposits sand in quieter bay settings. |
Erosional Features Along Emergent CoastlinesThere are a variety of erosional coastal landforms or features (typical of secondary coastlines on active continental margins):Emergent coastlines typically have sea cliffs carved by wave and current action along the shoreline. The geometry of a coastline is largely a reflection of how some rocks along a coastline are more resistant to erosion. Waves erode the base of sea cliffs, often causing it to subside or fail (Figure 15-113). Headlands are rocky shorelines that have resisted wave erosion more than surrounding areas, forming points or small peninsulas that jut seaward. Small sandy beaches typically occur in bays between headlands (Figure 15-115). Wave action carves a flat surface where they scour the seabed leading up to the beach and base of a sea cliff creating a wave-cut platform (see Figure 15-113). When sea level locally falls falls (such as from uplift of a regional earthquake) wave action eventually scours out a new wave-cut platform, leaving remnants of the old wave-cut platform exposed as an exposed wave-cut bench. A wave-cut bench is a flat bench-like platform of rock that form by wave erosion at the base of a an actively eroding sea cliff on an emergent coastline (Figure 15-115) and 15-116) (also see marine terraces discussed below). Sea stacks are large rocky outcrops that have resisted wave erosion and stand offshore as the beach and sea cliff continues to erode landward (Figure 15-117). A sea cave is an underground passage or enclosed overhang carved into a sea cliff carved by focused wave action. A sea arch is a natural rock arch caved by wave action (Figure 15-118). Marine terraces are elevated step-like benches formed by the combined effects of long-term wave erosion during the rise and fall of sea level on an emergent coastline |
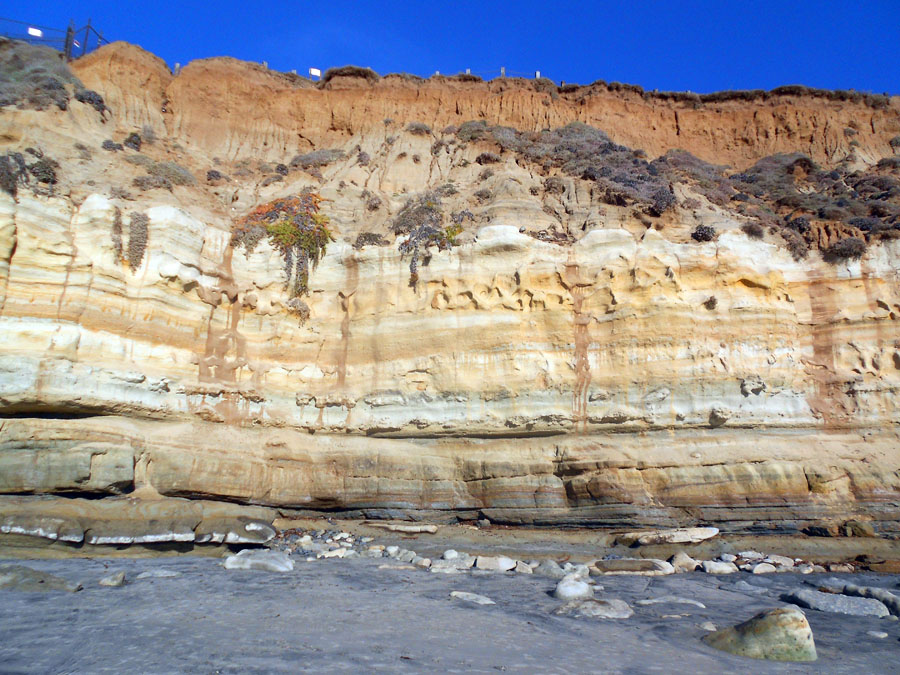 Fig. 15-113. Sea cliffs rise above a wave-cut platform (covered with beach sand ) at Del Mar Dog Beach, California. 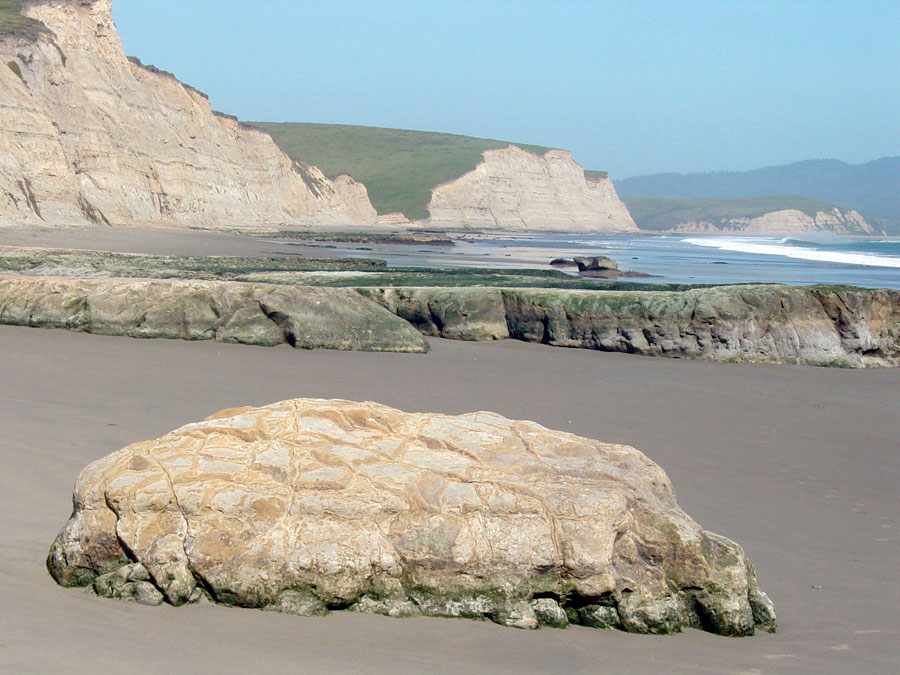 Fig. 15-115. Wave-cut platform (covered with sand), an elevated wave-cut benches and sea cliffs on Point Reyes National Seashore, California. 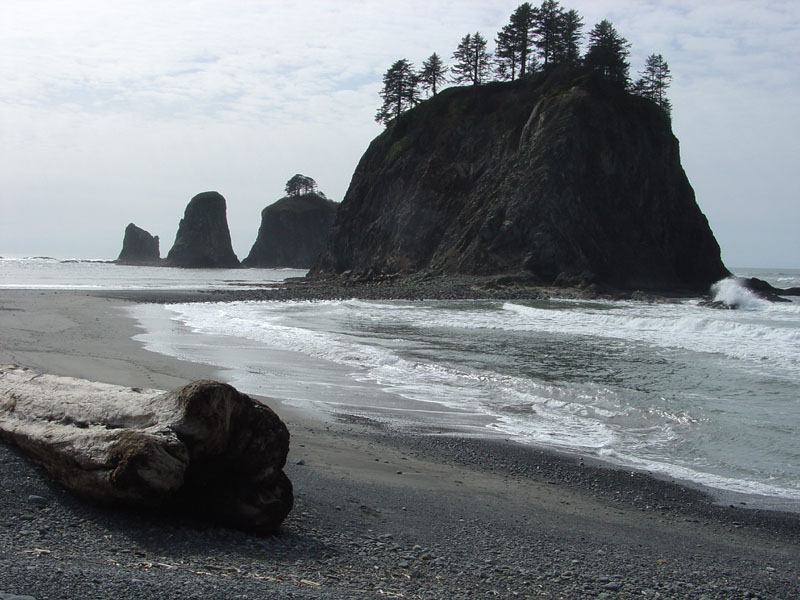 Fig. 15-117. Sea stacks along the coast at Olympic National Park, Washington. |
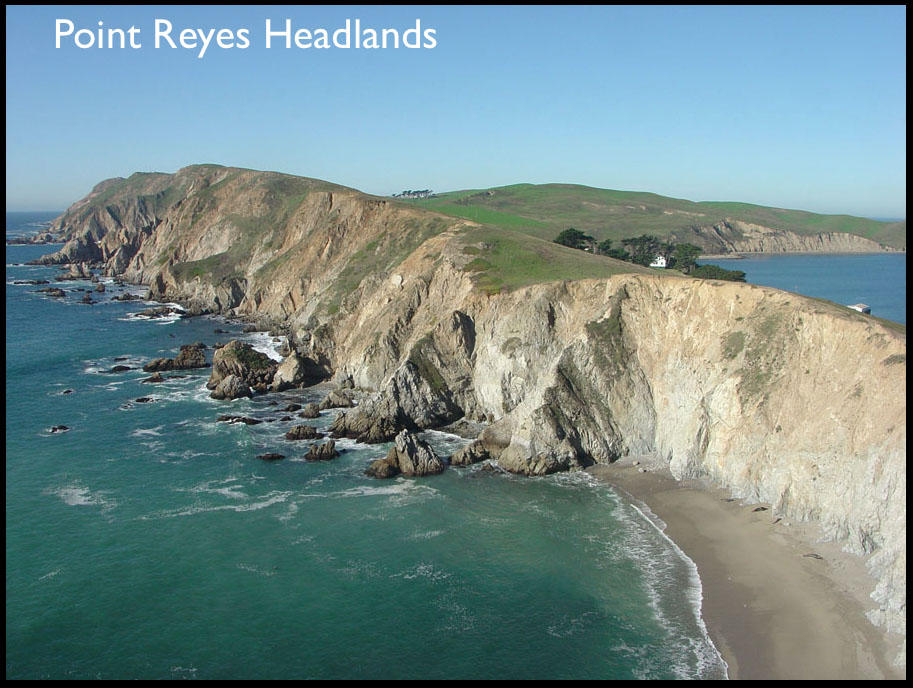 Fig. 15-114. Headlands and bays at Point Reyes National Seashore, California. 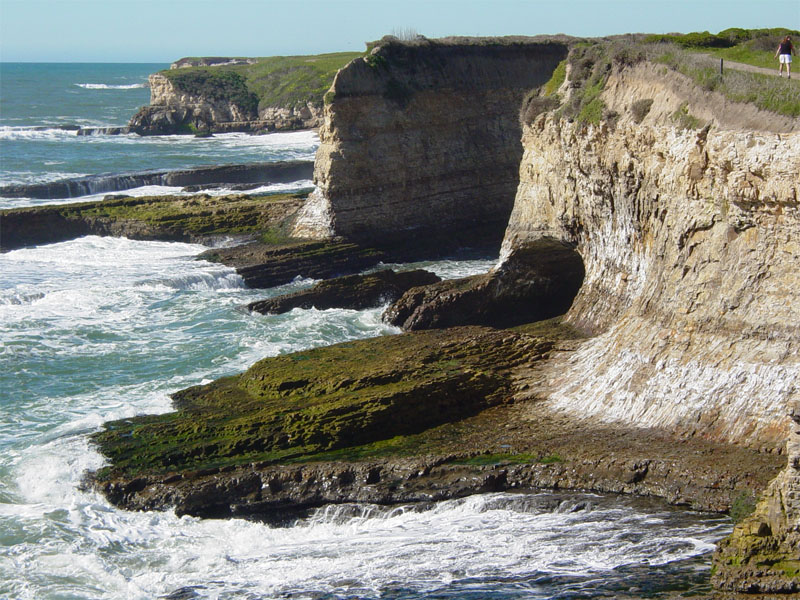 Fig. 15-116. Wave-cut benches and a sea cave at Wilder Ranch State Park, Santa Cruz, CA 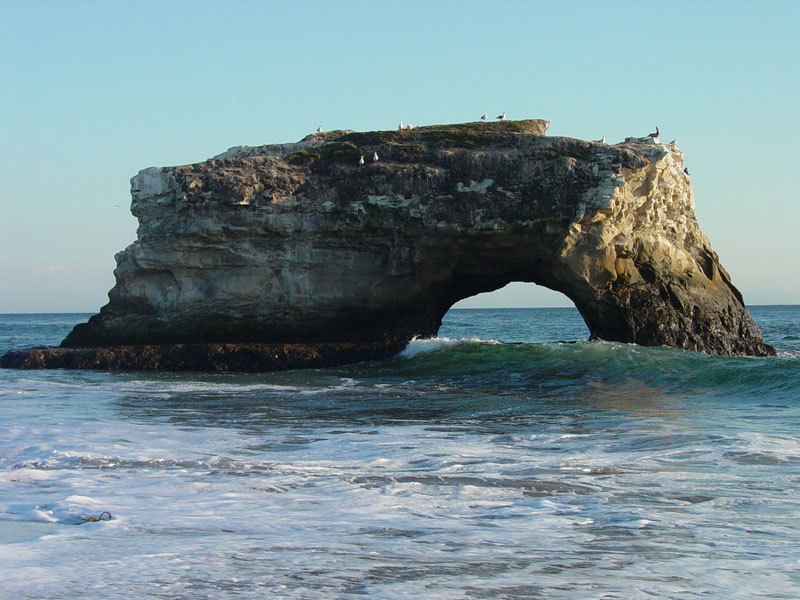 Fig. 15-118. A sea arch at Natural Bridges State Park, Santa Cruz, CA |
| Elevated marine terraces on the California coastline California preserves much evidence of geologic, geographic, and climatic changes caused by ice ages. During the last ice age, alpine glaciers and ice caps covered upland regions in the Sierra Nevada Range and Cascades volcanoes, but lower elevations were ice free (Figure 15-119). The formation of continental glaciers in North America and Europe caused sea level to fall almost 400 feet, causing the shoreline to migrate seaward as much as 10 to 70 miles westward of the current coastline in some locations. This rise and fall of sea level happened with each glaciation cycle (of which there were many through the ice ages of the Pleistocene Epoch). In places where the California coastline is slowly rising, each of the major glaciation cycles is preserved as a step-like bench, called a marine terrace. The formation of marine terraces is illustrated in Figure 15-120. Examples in northern and southern California are illustrated in Figures 15-121 and 15-122. Learn more! Landscapes from the Waves--Marine Terraces of California (USGS). |
 Fig. 15-119. California at the peak of the last ice age. Glaciers covered the higher mountains, lakes filled inland valleys, and a coastal plain was extended offshore. |
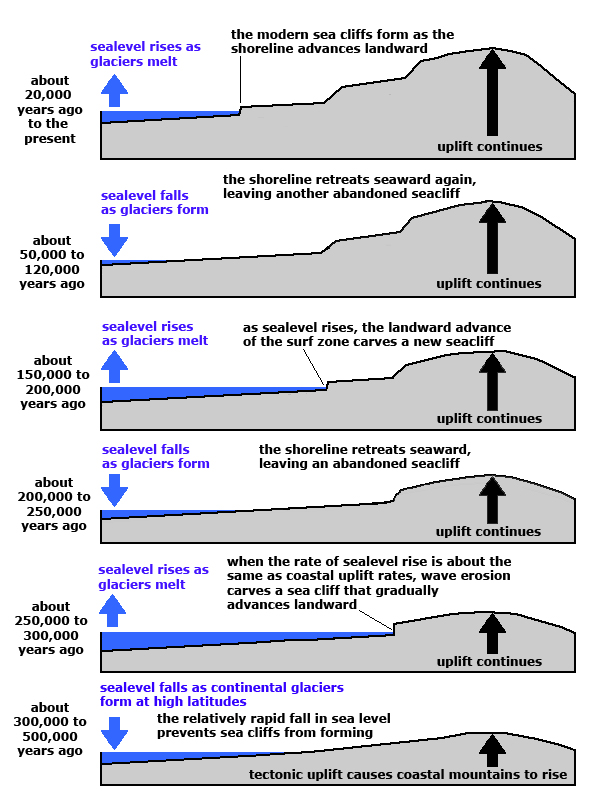 Fig. 15-120. Formation of marine terraces. This example shows the formation of two terraces. At least seven major terrace levels are preserved in some areas along the California coast. |
 Fig. 15-121. Marine terraces at Davenport, California |
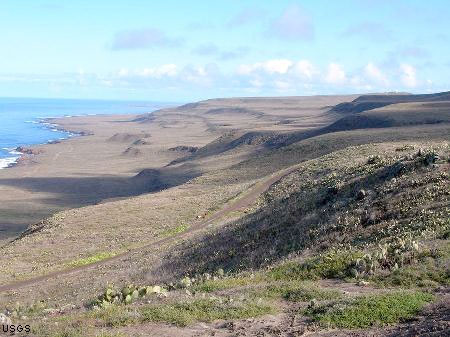 Fig. 15-122. Step-like marine terraces on San Clement Island located offshore in southern California |
Depositional Coastal Landforms or Features |
| A beach is the primary depositional landform along a coastline. However, beaches are constantly growing and shrinking with passing storms and by seasonal weather patterns. Longshore drift contributes to the deposition of sediments in some locations. Landforms associated with deposition tend to change significantly over time. Spits are ridges of sand projected from land into the bay (Figure 15-123). A Bay-mouth bar is a sandbar that stretches across a bay, separating it from the ocean (Figure 15-124). Barrier islands are ridges of sand islands that run parallel to the coastline and rise above sea level (Figure 15-125). Barrier Islands generally develop in locations where the seafloor remains shallow for long distances offshore. |
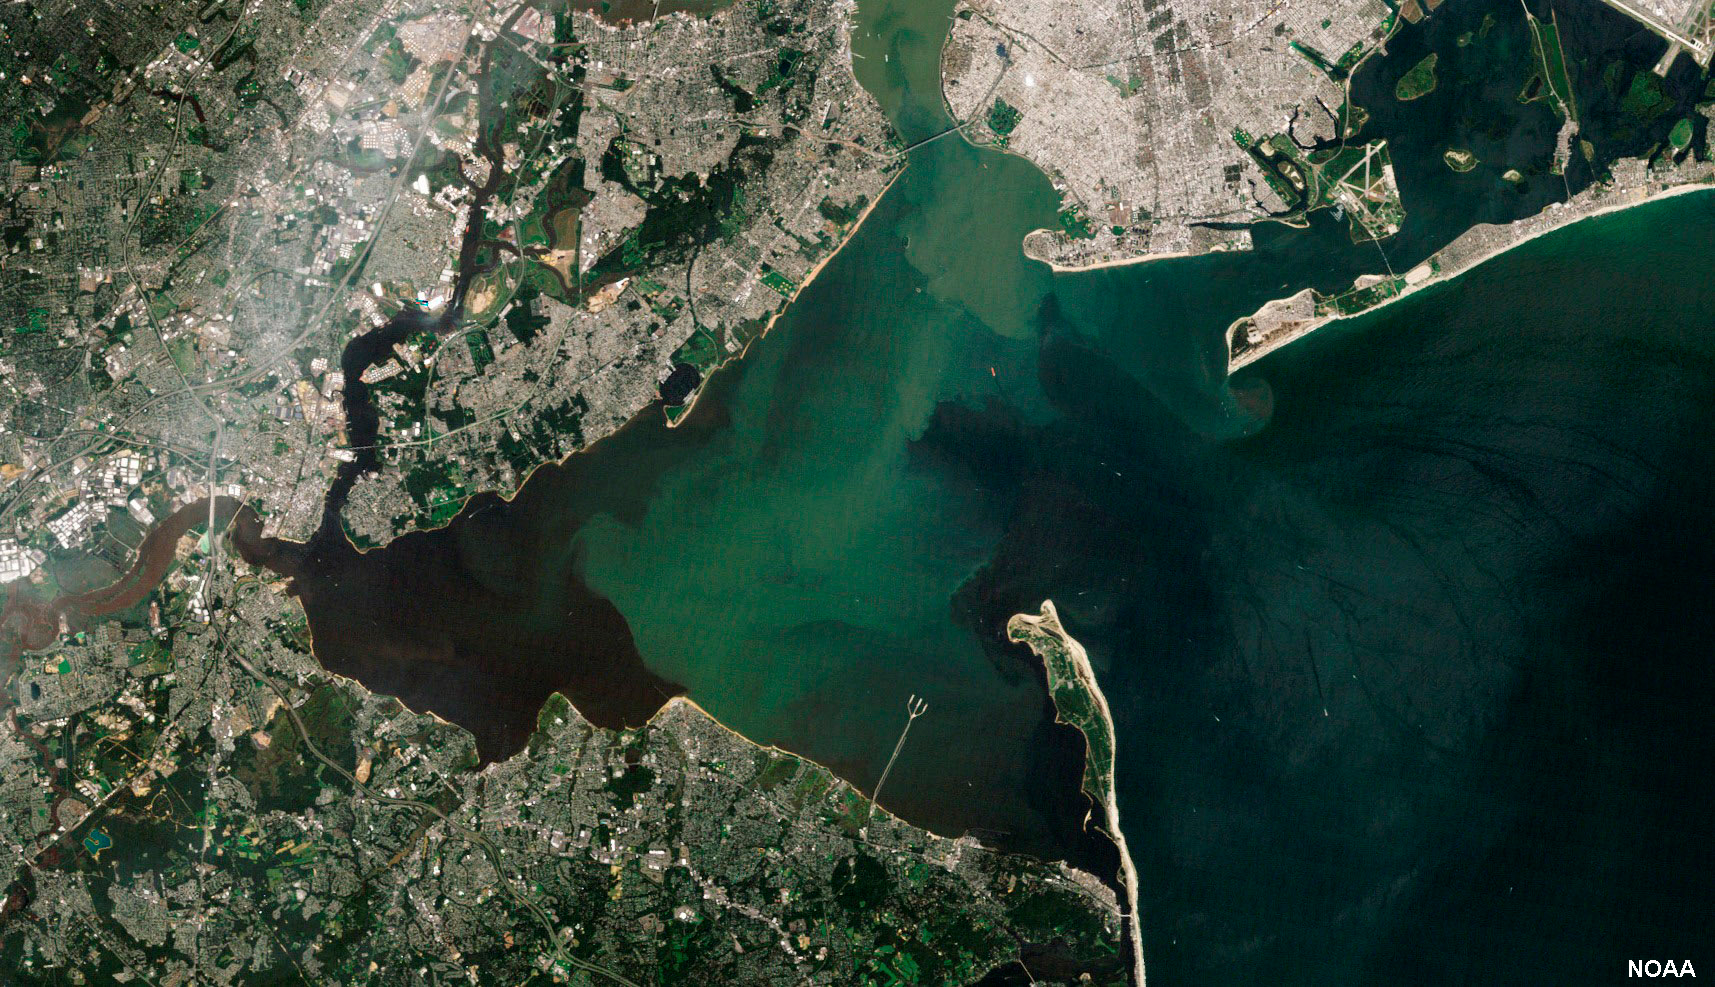 Fig. 15-123. Spits: Rockaway Spit (on Long Island, NY) and Sandy Hook Spit (New Jersey project into outer New York Harbor and Raritan Bay. |
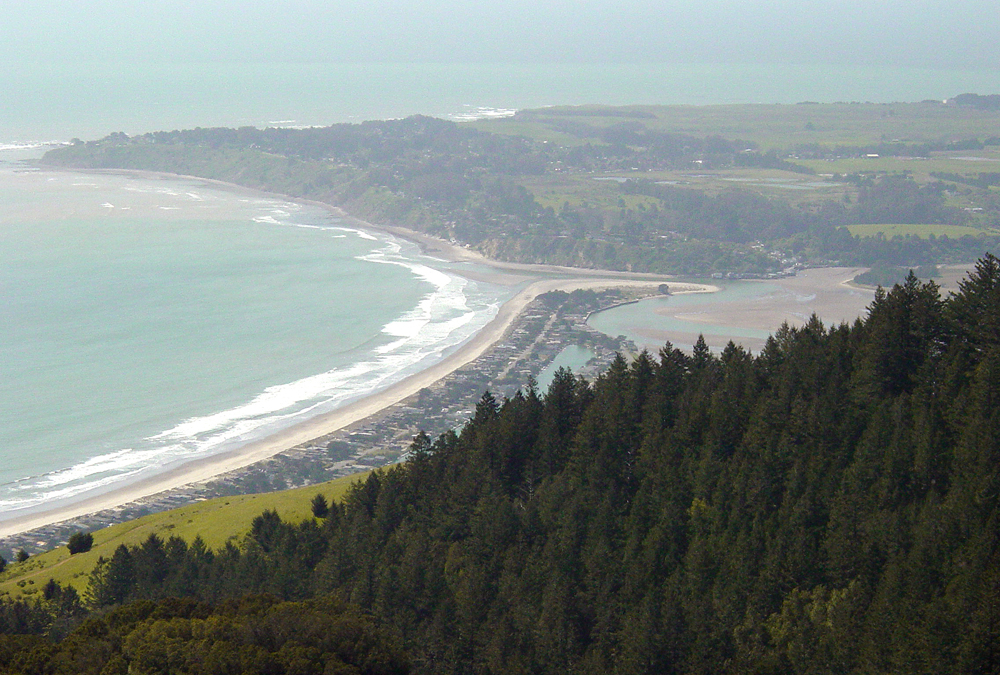 Fig. 15-124. Bay-mouth bar: Bolinas lagoon has a baymouth bar composed of sand from the Point Reyes. Peninsula. |
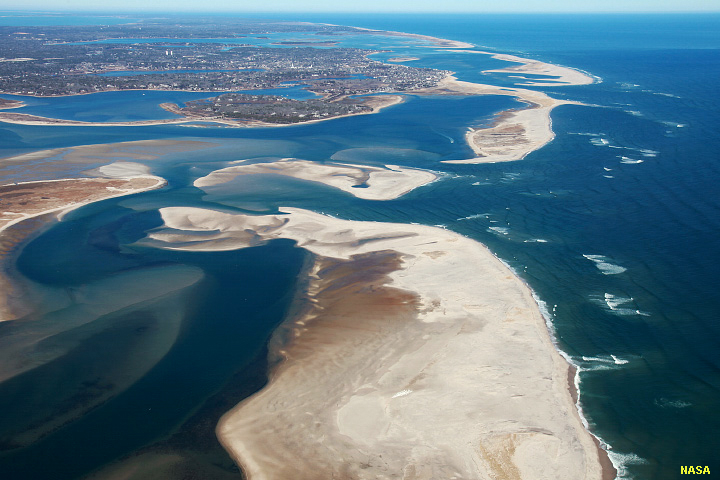 Fig. 15-125. Nausea-Monomoy barrier islands along Cape Cod's south shore, Massachusetts. |
Seasonal Erosional Changes To A Beach ProfileDuring the winter, storm-wave energy is most intense. Waves wash up on the beach and erode sand, and transport it offshore to where wave-driven currents aren't so strong and the sand accumulates on offshore bars. Heavier materials (gravel and boulders) are concentrated on the beach (Figure 15-126).During the summer, lower wave energy prevails, and the sand gradually migrates back onshore, gradually expanding the beach seaward (Figure 15-127). |
 Fig. 15-126. Cove Beach at Año Nuevo State Park (California) in winter. |
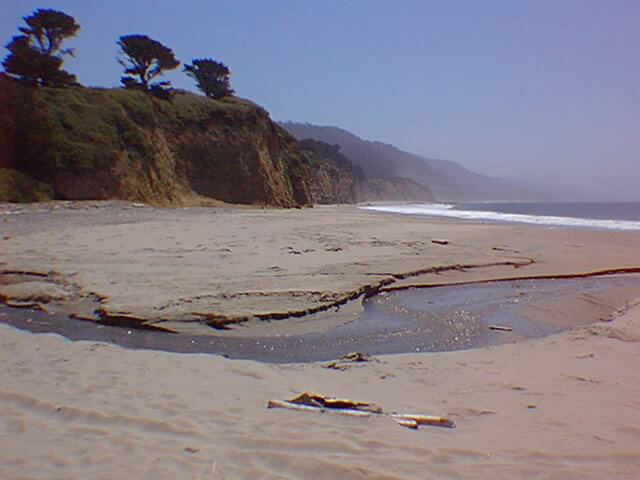 Fig. 15-127. Cove Beach at Año Nuevo State Park in summer. |
Tidal DeltasTidal currents (including rip tides) are strong erosional forces where they are restricted at the mouths of inlets and straights between bodies of water. One example is the narrow straights of the Verrazano Narrows (between Staten Island and Brooklyn on Long Island, New York) (Figures 15-128 and 15-129). Another example is the Golden Gate Narrows between San Francisco and Marin County in northern California (Figure 15-130). In both cases, the seabed has been scoured deeply in the narrow channels by the daily tidal flows (ebb and flood tides). Tidal flows redistribute sediments building submerged tidal deltas at opposite ends of the channel that need to be dredged frequently to mitigate hazards to shipping. |
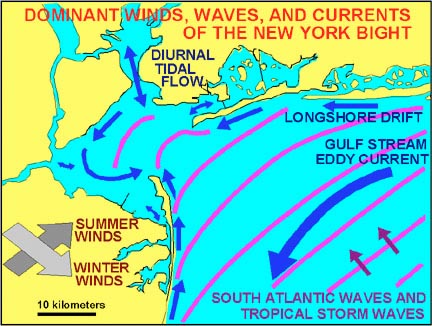 Fig. 15-128. Dominant winds, waves, and currents of the New York City region. |
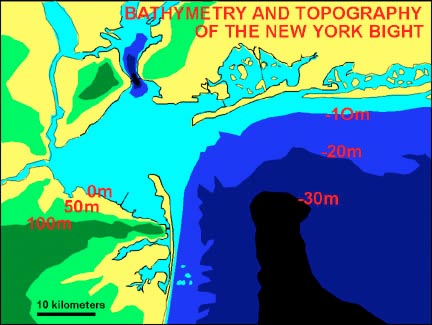 Fig. 15-129. Bathymetry shows tidal current scour in the Verrazano Narrows. |
 Fig. 15-130. Bathymetry shows tidal current scour in near the Golden Gate Bridge. |
| Tidal deltas are created on both ends of an inlet. Incoming flood tides push sediments through narrow passages where they are deposited on the inland side of the inlet where currents spread out and slow down. Another tidal delta forms when the ebb tidal flow scours the inlet area and deposits sediments in the quieter waters on the ocean side near the mouth of an inlet. | |||
Coral Reefs, Keys, and AtollsBiogenous carbonate sediments can accumulate faster than sea level is rising. Skeletal reefs (including coral reefs) thrive in the surf zone, and are able to weather wave action, although they can be heavily damaged by superstorm wave energy. The sediments generated by wave erosion and bioerosion (critters eating critters) contribute to the buildup of carbonate islands (keys) and atolls associated with fringing reefs forming around extinct and eroding volcanic islands (Figures 15-131 to 15-133). Keys and reefs of the world experience exposure and erosion during low sea levels during the ice ages. |
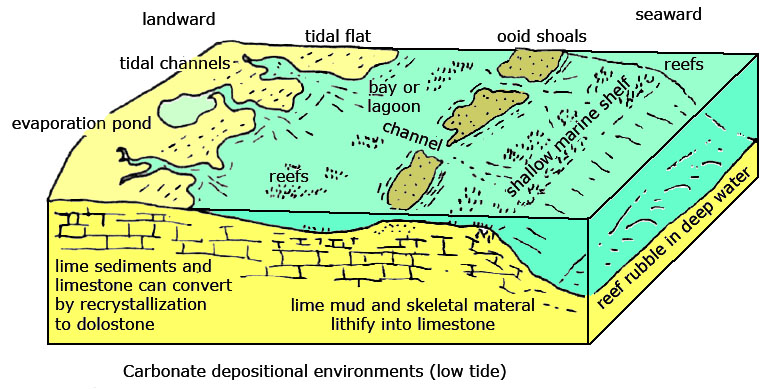 Fig. 15-131. Landforms associated with carbonate depositional environments. |
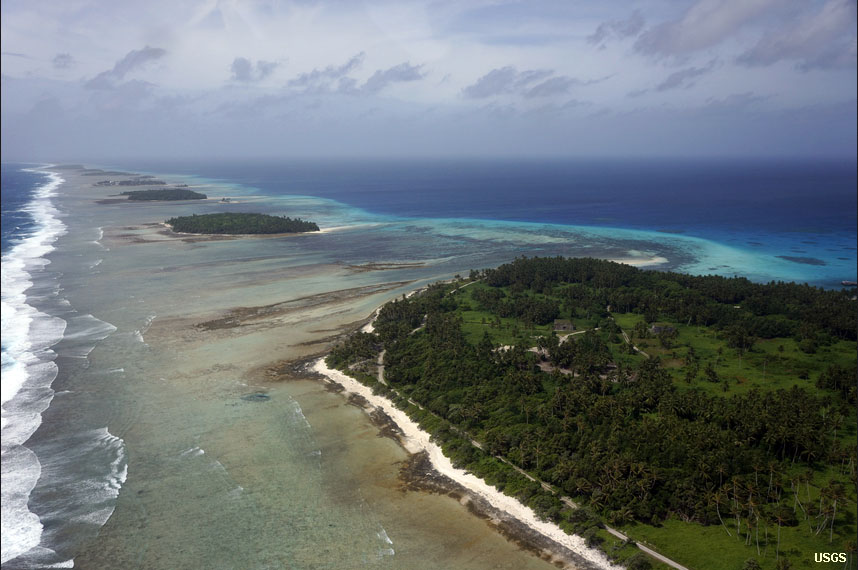 Fig. 15-132. Coral reefs and keys, Kwajalein Atoll, Marshall Islands, South Pacific Ocean |
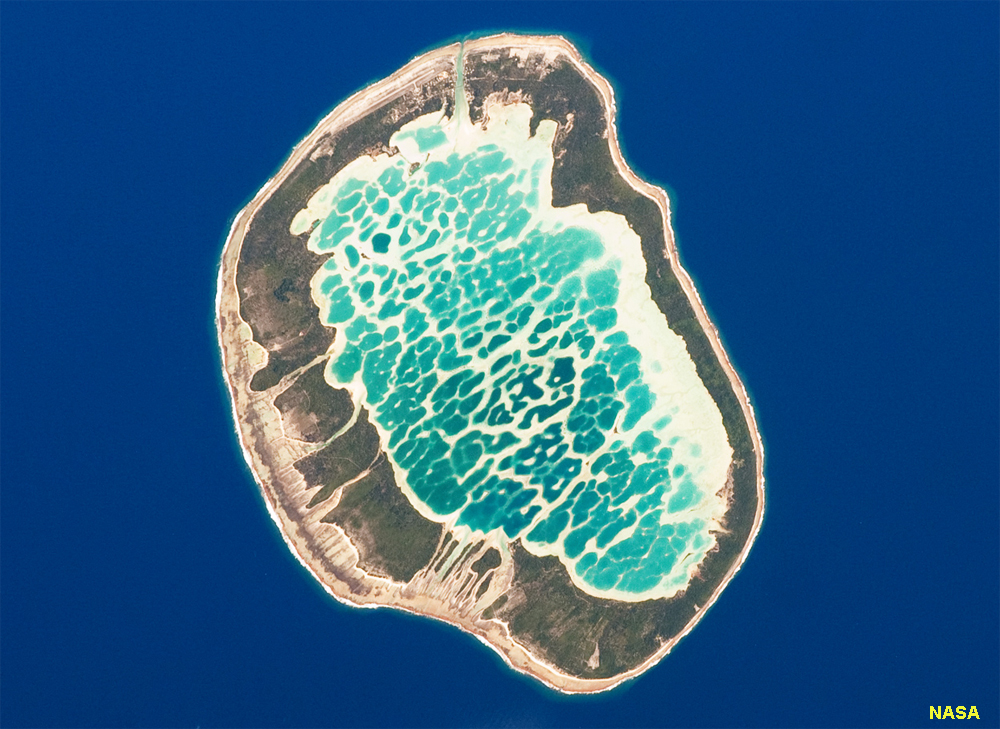 Fig. 15-133. Mataiva Atoll, Tuamotu Archipelago, South Pacific Ocean |
Coastal Cells, An Example from San DiegoA coastal cell is a relatively self-contained compartment along a coastline within which sediments circulate from source areas to where they vanish into the deep ocean basin. A coastal cell contains a complete cycle of sedimentation including sources, transport paths, and sinks. In the San Diego area, the Oceanside Coastal Cell extends from Dana Point to La Jolla Canyon; some of the sand is lost to the smaller Carlsbad Canyon as well (Figure 15-134). Streams and cliff erosion provide sediments to the shore zone. The arrow on the map indicates the predominant longshore current direction (and the direction of the migration of beach sand along the coast). Most of the sand moves down the coast and eventually drains down La Jolla Canyon and is deposited as turbidity flow deposits on the La Jolla Canyon deep-sea fan in the San Diego Trough (Figure 15-135). |
 Fig. 15-134. Map of the Oceanside littoral cell and Carlsbad and La Jolla Canyons offshore. |
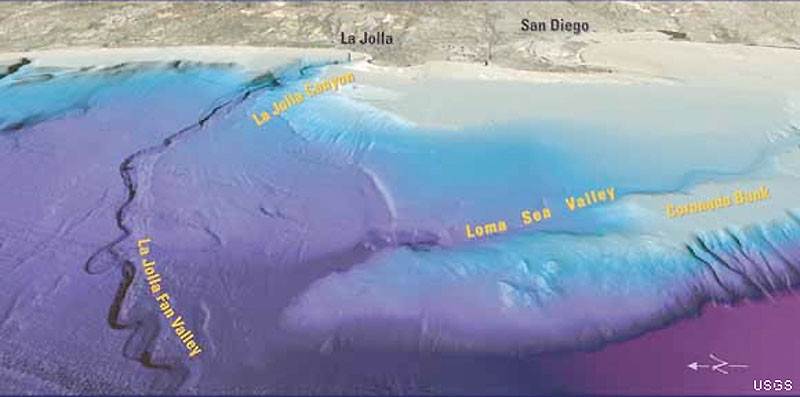 Fig. 15-135. Sediments move from shore down La Jolla Canyon to the San Diego Trough. |
Coastal Erosion Problems Related To the Oceanside Coast CellThe dominant swell direction in northern San Diego County is from the northwest. This creates longshore currents that move sediments (longshore drift) from north to south along area beaches. The sand on northern San Diego County beaches are mostly derived from sediments derived from coastal erosion in the shallow nearshore, beach, and sea cliffs along the coast between Dana Point and Oceanside (much of it from along the undeveloped coast within Camp Pendleton north of Oceanside). In addition, large quantities of sandy sediments are contributed to beaches from streams (small rivers) that, during episodic floods, dump large amounts of fresh sediment into the nearshore environment, contributing about half of the sand supply to area beaches over time. The amount of sand from river sources is highly variable with the seasonal weather, year to year.Large waves (swell) especially during high tides in stormy conditions can erode, transport, and deposit large quantities of sediments. |
Shoreline Erosion Problems and Human ImpactsShoreline changes quickly with natural forces; they are not a stable landforms. Coastlines, especially on the East Coast and Gulf regions, are constantly changing, especially from the impacts of superstorms. These coastal regions are underlain by unconsolidated sediments that are easily eroded by strong currents. They remain relatively stable, as long as there is a new supply of sediment to replace materials eroded by longshore currents, tides, and storm waves. Figure 15-136 illustrates how much shorelines can change. In less than two centuries, Fire Island's eastern spit has grown about 5 miles longer. The sediments creating this new land came at the expense of coastal lands father east on Fire Island, making the island increasing narrower. Barrier Islands are prone to be breached by storm erosion, creating new inlets, and filling in others. |
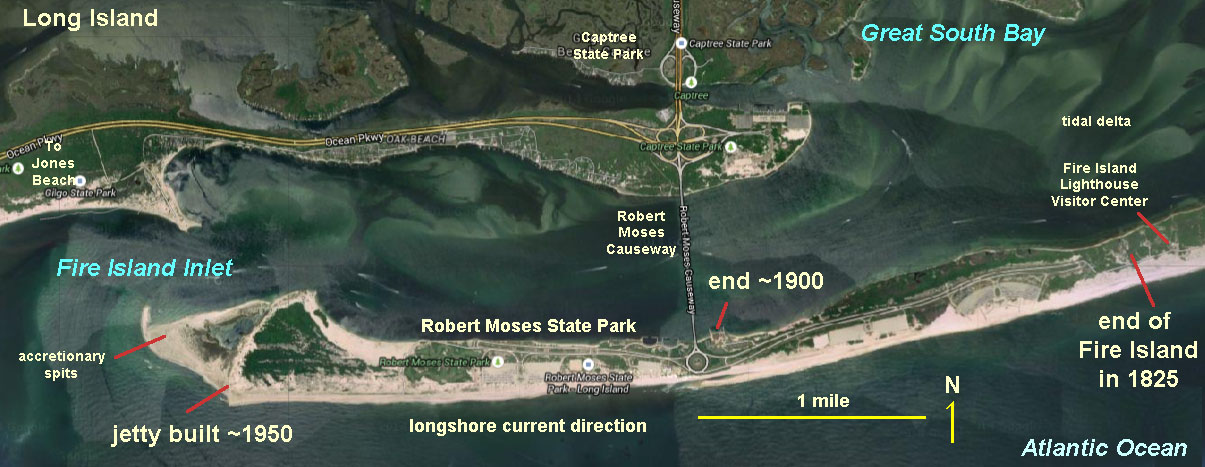 Fig. 15-136. Fire Island (on Long Island, NY) has steadily grown about 5 miles longer since 1825 by longshore drift (see Figure 15-128). Fire Island Inlet at the west end of Fire Island is scoured by rip tides, adding sediments to the tidal delta in Great South Bay. |
Many attempts have been made, often at great expense, to try to prevent the effects of erosion and deposition along coastlines. Common construction efforts include jetties, groins, and seawalls to protect harbors, infrastructure, and communities. Prevailing wind and wave swell patterns and storm events affect shoreline erosion and deposition, changing shoreline geometry over time. Man-made structures designed to control wave and storm damage include seawalls, groins, and jetties. These features affect wave energy dispersion and longshore currents, modifying shoreline geometries. They must be designed for long-term stability or they may fail. Great coastal storms can severely impact coastal communities and change shoreline geometries. Great storm can move as much sediment in a couple days what may take 100 years or more of "normal storms."Coastal erosion is a HUGE problem for humans intent on living along the shore. Coastal erosion is inevitable and unstoppable in the long term. Coastal environments are locations where people should probably be building parks and nature preserves, not megacities! All coastal communities are at some risk of potential disaster. The question isn't "if..." but the answers are in "how, where, and when!" Man-made structures, such as groins, jetties, and seawalls, are designed to control erosion, but their construction often creates other problems. Groins and jetties trap sand moving along a beach with longshore drift. Whereas they may trap sand in one location, their construction shuts off the sand supply for beach areas down current. This scenario was well illustrated by a disaster involving the community Westhampton Beach on Long Island, New York where a wealthy community decided to have a groin field built to protect coastal homes. The groins constructed by the US Army Corp of Engineers successfully stopped the erosion, but down current of the groin field, it was the recipe for disaster which took place when a typical nor'easter storm hit in the winter of 1982 (Figure 15-137). The storm surge and waves eroded the beach, cutting a new inlet across the barrier island and hundreds of homes were either destroyed or heavily damaged. In the end, it was the tax payers in New York who had to pay many millions of dollars to clear up the damage for a relatively small population of coastal dwellers. This is a story has been generally repeated many times, but in many different locations. The movement of the coastline is unstoppable. It is well illustrated along the Atlantic shore of Long Island. For example, coastal erosion is causing the shoreline to migrate landward, removing sediments from the increasingly narrow barrier island, but that sand is moving and accumulating in other locations. Since the construction of a lighthouse at the western end of Fire Island in 1825, the island has grown nearly 4 miles longer. built from sediments contributed by erosion from the eastern end of the barrier island (Figure 15-138). The sediments are accumulating at the entrance to Moriches Inlet, which is making dredging at the harbor entrance an unending expense. Eventually, the Fire Island barrier island will no longer exist as the landward erosion of the coastline continues. A similar situation exists farther west on Long Island in an area called the Rockaways. The end of the barrier island has grown nearly 2 miles since 1866 (Figure 15-139). The westward migration of the end of the barrier was temporarily halted with the construction of a jetty to protect the harbor entrance to Jamaica Bay, but the supply of sand filling in the harbor entrance continues unabated, and will require dredging to keep it open. As an aside, the community of Breezy Point constructed near the jetty was nearly completely destroyed by fire during Superstorm Sandy in 2013. Billions of dollars have been spent trying to cope with the coastal erosion problems in California. A big problem that affects the California coastline is landsliding. In many areas, the coastline is extremely steep, and wave erosion is constantly gnawing away the at the base of the seacliffs along the coast. In many places, the rocks exposed along the shoreline consist of soft sedimentary deposits which easily erode. This make the development of prime real estate of oceanfront property a costly venture for everyone. Figure 15-141 illustrates the expensive efforts to shore up eroding sea cliffs in Encinitas, California. Seawall construction only delays the inevitable erosional retreat of the seacliffs and visually impacts the view of the natural environment. Figure 15-142 shows the jetty constructed around the Oceanside Harbor and to Fort Pendleton. Although the jetty protects the harbor, it impacts the natural longshore drift of sand to the beaches of Oceanside south of the harbor. When the beach washes away, the seacliffs are exposed to wave erosion, undercutting hillsides. The result can be catastrophic landsliding (Figures 15-143 and 15-144). Coastlines are not ideal locations for construction! |
 Fig. 15-137. Construction of a poorly designed groin field led to the Westhampton Beach disaster of 1982. The groins shut off the natural sand supply to a coastal community next door. |
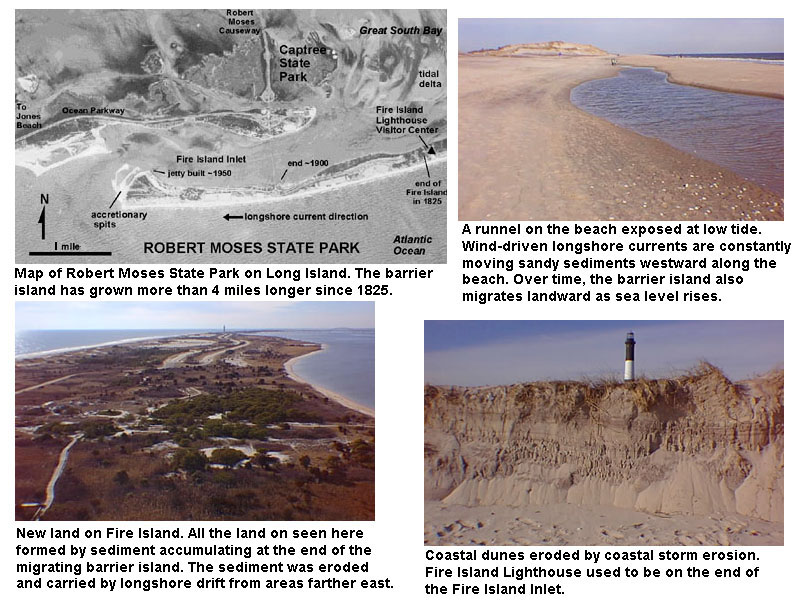 Fig. 15-138. Jones Beach and Robert Moses State Park, New York has grown by nearly 4 miles by sand accumulation by longshore drift. Erosion is making the island longer and narrower. |
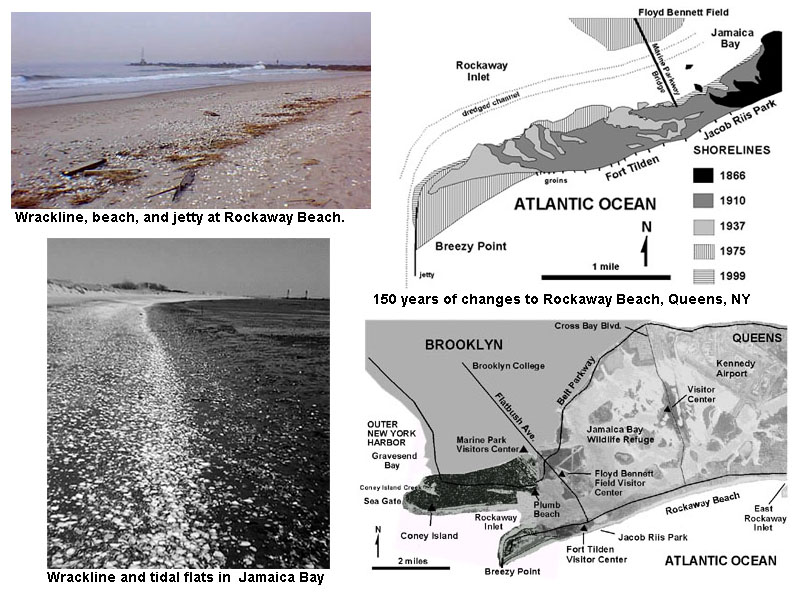 Fig. 15-139. Beach wracklines and historic changes to the coastal landscape of Rockaway Beach caused by longshore drift. Rockaway beach, located Queens, New York (seaward of New York Harbor), has grown nearly 2 miles since 1866, largely influences by construction of groins and a jetty. |
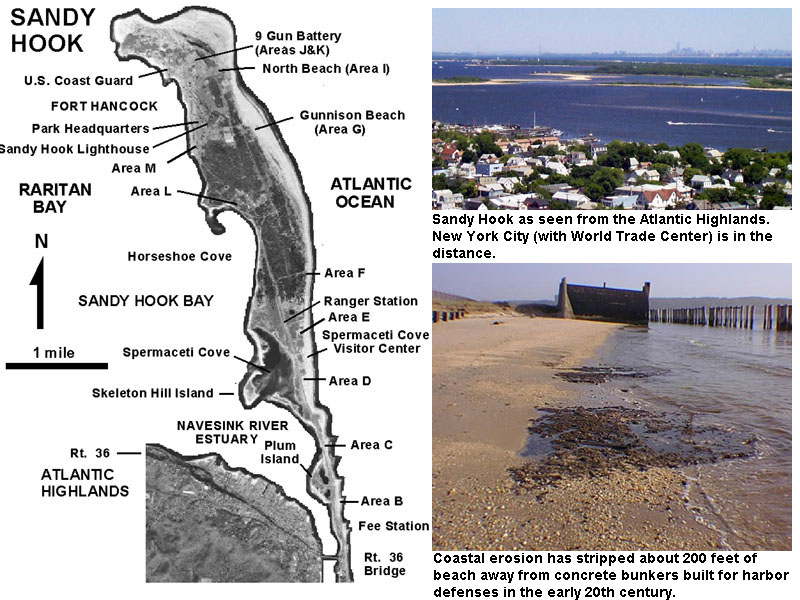 Fig. 15-140. Sandy Hook is a sand spit on the southern New Jersey side to the entrance to New York Harbor. The spit has changed its geometry continuously through historic times, and is now preserved as a national park. Many attempts have been made to control coastal erosion on Sandy Hook. |
|
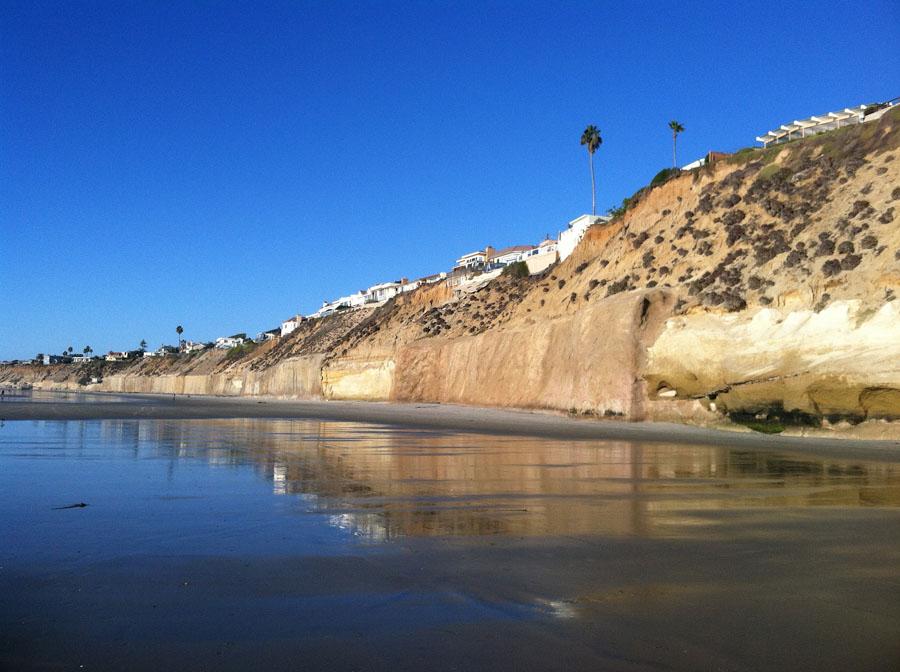 Fig. 15-141. Attempts to halt sea cliff erosion to protect coastal properties in Encinitas, California. Sea cliff erosion naturally provides a sand to the beach. |
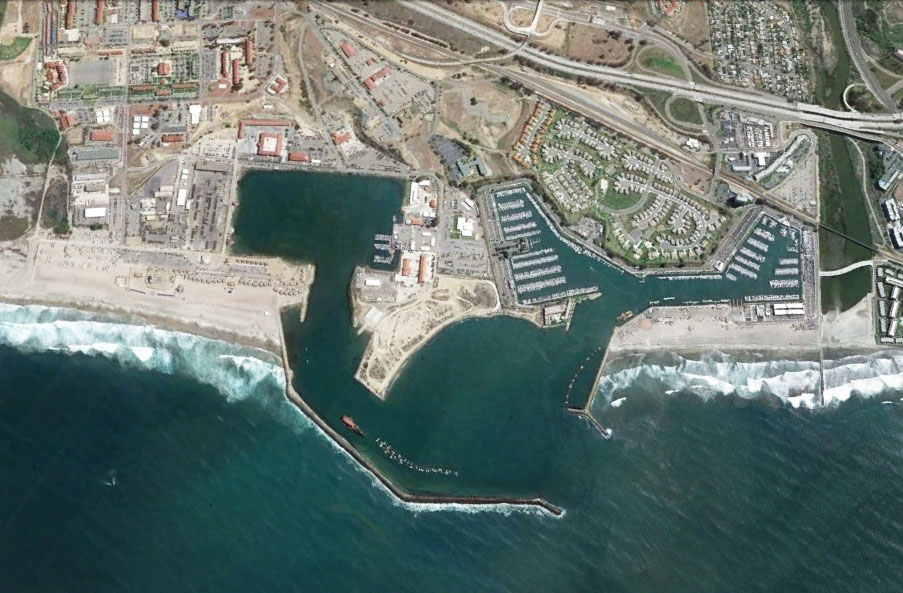 Fig. 15-142. A jetty constructed around the entrance to Oceanside Harbor impacts longshore drift, requiring occasional dredging operations. |
|
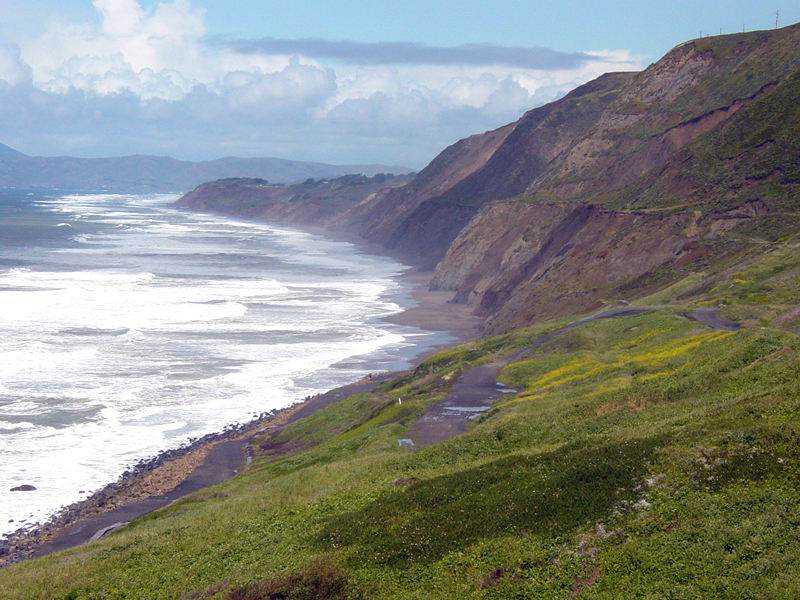 Fig. 15-143. In 1905, a railroad line was constructed along the coast south of San Francisco, it was destroyed by coastal landsliding in the great 1906 earthquake. Today very little evidence of the railroad line is visible along the coast. |
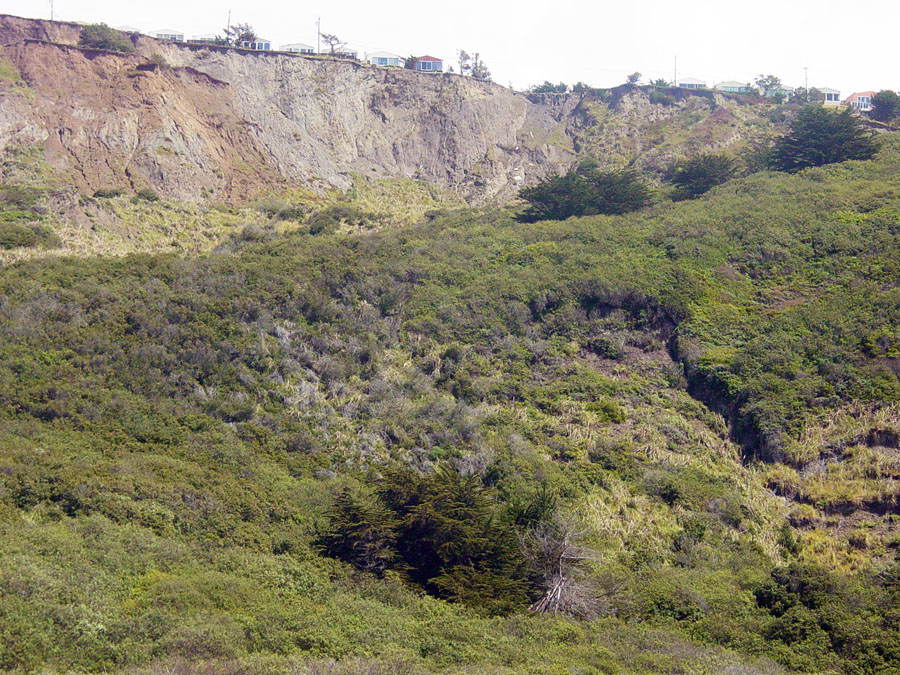 Fig. 15-144. A massive coastal landslide took out many homes along the sea cliffs in Daly City, a coastal community near San Francisco. As coast erosion proceeds the entire mountain face is subject to landslides. |
Jetties, Groins, Breakwaters, and SeawallsJetties are built at entrances to rivers and harbors. Their purpose is to protect properties from storm and wave damage, and to keep sand out of channels (so that there is no beach). Jetties require high maintenance costs to manage because they impede longshore drift (which is continues relentlessly). Most the costs are for dredging sand from one side, and moving it down current to replenish sand to community beaches. Loss of the sand supply makes down current areas susceptible to beach loss and coastal erosion (a major problem for Southern California's coastal communities, Figure 15-145). |
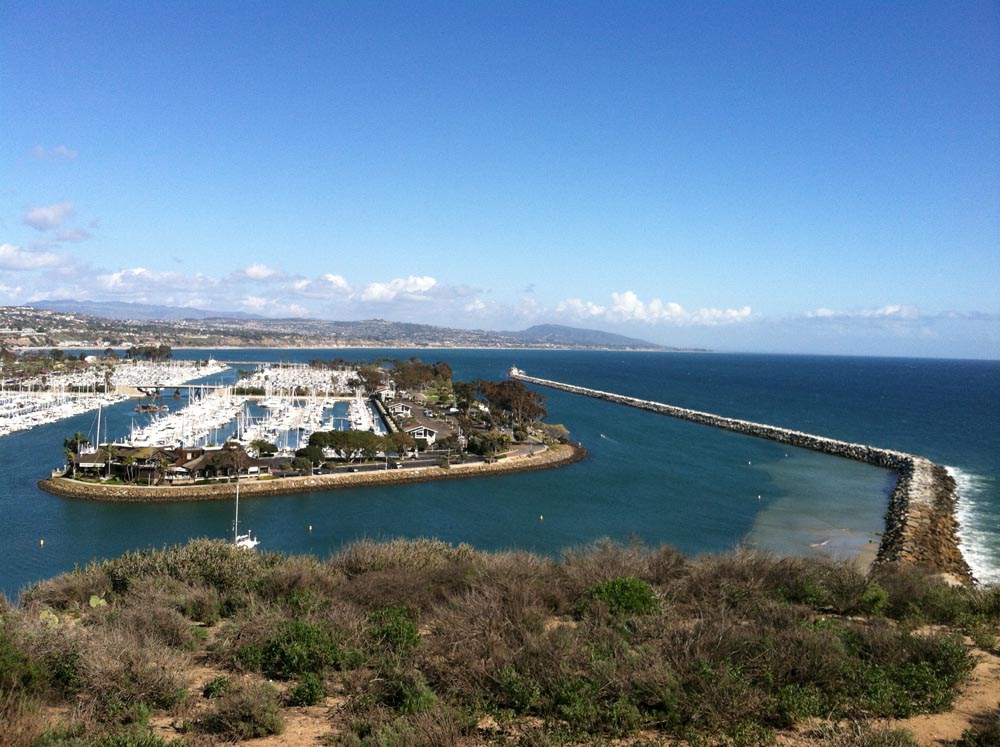 Fig. 15-145. Dana Point Harbor and Jetty (Orange County, CA) |
| Groins are built as barriers perpendicular to the beach in an attempt to stabilize shorelines. Their purpose is to trap sand migrating along the shore by longshore drift (Figure 15-146). Figure 15-147A is an aerial view of a wash-over fan created by a breach in Sandy Hook Spit (on the New Jersey side of New York City's Outer Harbor (also see Figure 15-140).The inlet formed when coastal storm waves and currents cut an inlet across the spit. Note the sand trapped on the left side of the groins (longshore drift is moving left to right). Figure 15-147B shows an accretionary prism of sand building up at the end of Sandy Hook Spit. Figure 15-148 shows the growth of Rockaway Spit on the north east side of New York's Outer Harbor. It has grown nearly 2 miles since the end of the Civil War (1866). The area has been heavily modified by construction of groins and a jetty to keep the inlet to Jamaica Bay accessible to boat navigation. | 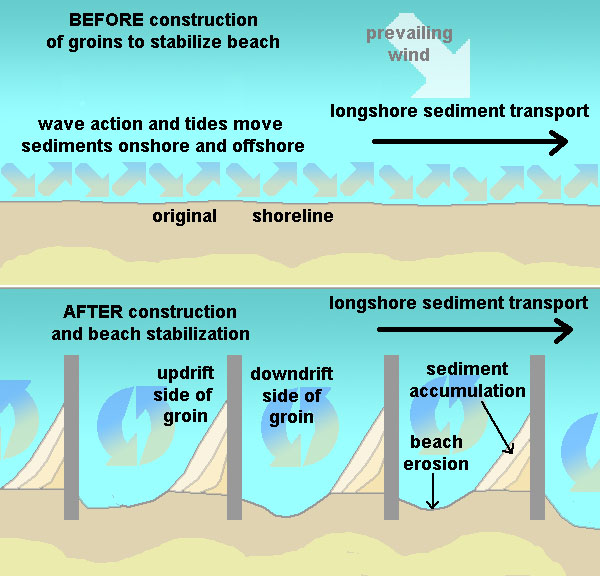 Fig. 15-146. Groins are designed to trap migrating sand by impeding the flow of longshore drift. |
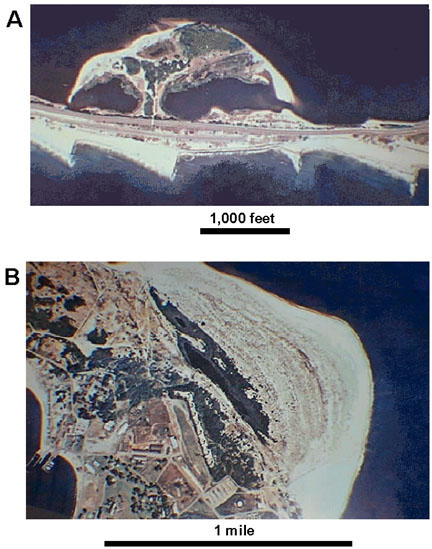 Fig. 15-147 (A&B). Groins, a washover fan, and accretionary prism on Sandy Hook, New Jersey. |
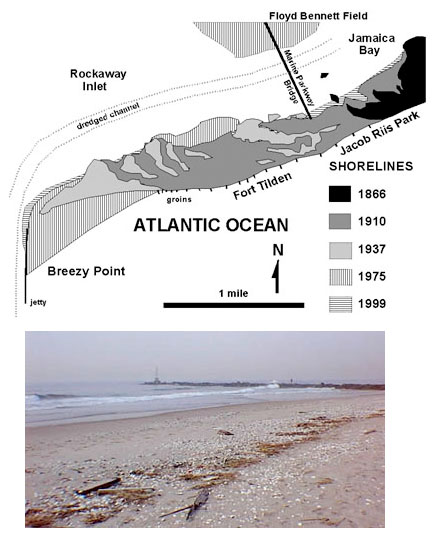 Fig. 15-148. Map showing the growth of Rockaway Spit impacted by construction of groins and a jetty. |
| * Breakwaters are structures used to protect boats from large waves (jetties and groins are also forms of breakwaters). * Seawalls are walls built to protect land structures from large waves and coastal erosion (Figure 15-141 shows an example of some seawalls used to stop cliff erosion). * Rip Rap are piles of large boulders put on the beach or shoreline. They are cheap but take up beach space and are not as permanent as a seawall, and are unsightly and dangerous. However, they do create habitat for sea life that needs a hard substrate to live (Figure 15-149). * Beach nourishment adds large amounts of sand to the beach to keep water away from land structures. Sand is dredged form harbor areas or mined from sand bars offshore and pumped onshore in slurries. The process is quite expensive. |
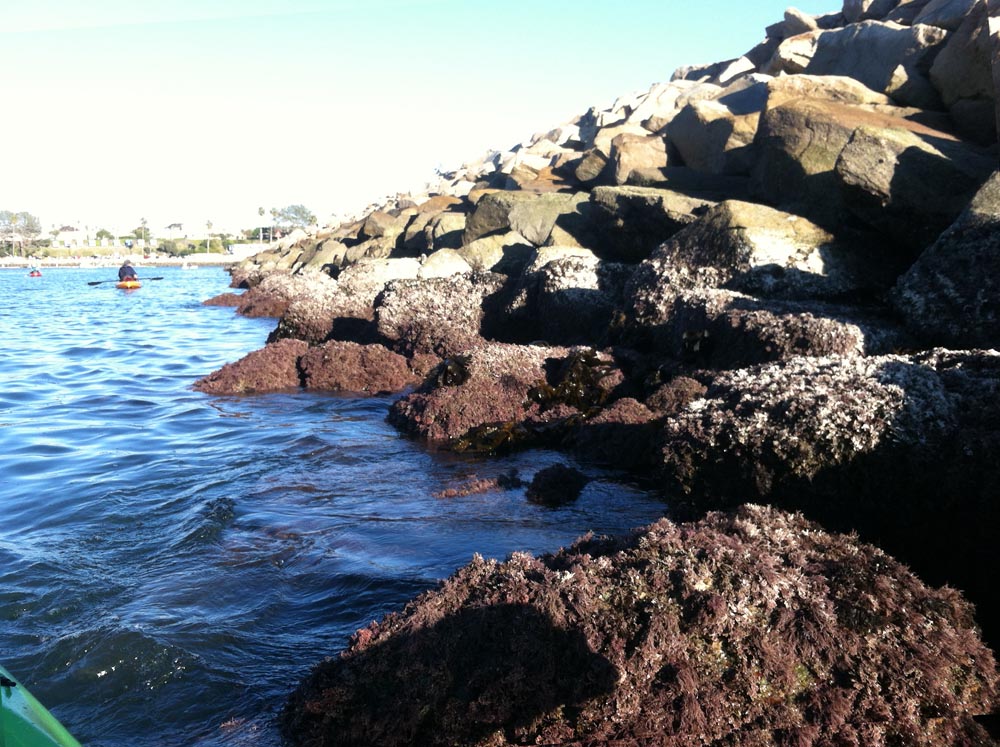 Fig. 15-149. Rip-rap was used in the construction of the breakwater (Oceanside Harbor). |
The "Dam Problem"Dams have been constructed on most of the small rivers and streams throughout upland regions of San Diego County. The intentions of dam construction were to store water (reservoirs) and to reduce flood damage in low-lying communities. The problem is that dams have largely shut off the supply of sand from rivers and streams to the shore. One of the largest dams is for Lake Hodges on the San Dieguito River near Escondido, California (Figure 15-150). Construction of highway and railroad bridges, dikes, and causeways also restrict the flow of sediment-bearing water, preventing the migration of sediment to the coast. As a result, less sand is finding its way to the shore, resulting in narrower beaches. Without the protection of well-developed beaches, erosion of the sea cliffs are progressively endangering homes and infrastructure along the coast. |
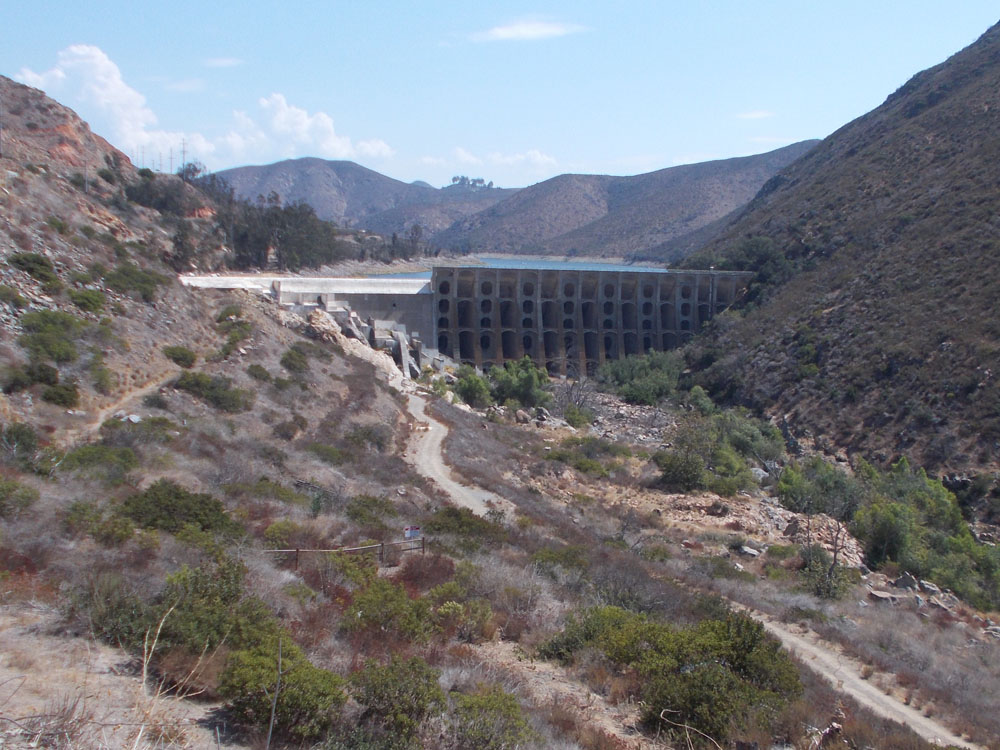 Fig. 15-150. Lake Hodges Dam has shut off the sand supply that used to feed beaches along the coast in San Diego County. |
| Dams on rivers trap sediments that would otherwise find their way to ocean beaches. A classic example was the construction of a dam on Matilija Creek in Ventura County. The dam is currently being demolished in order to return the sediment flow to sensitive habitats along the river downstream, but also to return a sediment supply to the Ventura County coastline (Figure 15-151). Many other dams constructed in the 19th and 20th century are being removed for the same reasons. |  Fig. 15-151. The Ventura River (left) supplies massive amounts of sediments to the coast during infrequent floods, then persistent coastal erosion processes take over the action. Construction of the Matilija shut of much of the sediment supply to the coast. The dam is now being removed. |
Coastal Dynamics—The Unending SagaSea-level rise due to global warming is a highly political topic of our times. The world's Scientific Community has been studying the changes happening around the world for many decades. Real-time observations show that the atmospheric temperatures are steadily rising along with the concentrations of greenhouse gases in the atmosphere. What is perhaps most alarming is that the rate of sea-level rise is accelerating as the ice caps melt and the oceans expand from increased warmth (there are many NASA and NOAA websites on these matters). However, the threat doesn't seem to fit within the interest span of politicians and corporations keen on making high profits from the extraction of coal, oil, and gas. sea-level rise will likely continue unabated until either we either consume all the economically available carbon-based resources, or human populations collaborate to change the fate we, collectively, are facing. |